low carbon leadership workbook
DESCRIPTION
In partnership with the Energy Saving Trust, Carbon Forum produced the Workbook to assist key decision makers to get to grips with what CO2 targets really mean and what is logistically possible in their own community.TRANSCRIPT

Name:
Cl s:
Low CarbonLeadershipA work book for decision makers
In partnership with

On Why?“In the past, we didn’t understand the effect of our actions. Unknowingly, we sowed the wind and now, literally, we are reaping the whirlwind. But we no longer have that excuse: now we do recognise the consequences of our behaviour. Now surely, we must act to reform it: individually and collectively; nationally and internationally.”
Sir David Attenborough
“[Climate change] is not another priority amongst the many that compete for local government leaders’ attention. It is now clear from the scientific evidence that it is the single priority which overrides all others, now and for the foreseeable future.”
LGA’s Climate Change Commission
On the role for local government“Climate change is the most important long-term priority for local government. It is a test of the sector’s credibility and reputation. It is as important now as public health and sanitation were to our Victorian predecessors.”
Sir Simon Milton (Chair of Local Government Association)
On Leadership“Search all the parks in all your cities; you’ll find no statues of committees.”
David Ogilvy
On Ambition“We choose to go to the Moon in this decade and do the other things, not because they are easy, but because they are hard”. Under ten years later, JFK’s dream was realised. The world was shown that where there is political, business, and personal will then anything can be achieved – and quickly. The same urgency must now be applied to tackling climate change. The time for talk is over. All of us must now start taking the action necessary to reduce our carbon emissions. It won’t be easy. There will be challenges. But all of them can be overcome. Preventing climate change can collectively be our ‘giant leap for mankind’.”
Philip Sellwood, CEO, Energy Saving Trust
“Make no little plans. They have no magic to stir men’s blood… Make big plans; aim high in hope and work.”
Daniel Hudson Burnham
Low Carbon Leadership - A workbook for decision makers, Marches Energy Agency in partnership with Energy Saving Trust

Marches Energy Agency (MEA) is a sustainable energy and climate change charity, working with households, organisations and communities in the West Midlands and beyond.
For further information, contact:
Marches Energy Agency
e: [email protected]: 01743 246 007f: 01743 246 008 w: www.mea.org.uk
This workbook was produced by MEA’s Carbon Forum team in partnership with the Energy Saving Trust.
The Energy Saving Trust helps people take action to reduce carbon in their homes and lifestyles by offering practical support through their advice centres, communities and local authorities
www.est.org.uk
MEA’s Carbon Forum provides decarbonation inspiration. It aims to be a launch pad for organisations, communities and individuals embarking on a journey to tackle climate change. It does this by providing clarity and direction through this complex problem and its numerous solutions.
www.carbonforum.org
Partnership StatementThe Energy Saving Trust has provided financial support to enable the creation, design, publication and dissemination of this workbook. Verification of statistics and opinion on choice of action is from Marches Energy Agency, independent of the Energy Saving Trust.
Design by Revert Creative - creativity with a conscience
Printed with vegetable based inks on paper which is:
100% Post consumer waste,100% Chlorine free,100% Recyclable and biodegradable.All printing and paper production complies to IS0 14001 environmental standards.
www.revertcreative.com
Foreword
This workbook aims to be a bit different; to be inspiring. But more importantly it seeks to help all that use it to get from aspiration to planning practical action. There is certainly no shortage of information on sustainable energy and climate change, although there does seem to be a sizeable amount of carbon illiteracy.
As the English Romantic painter John Constable said in the year before his death “We see nothing truly till we understand it.” We hope this book helps you and your community truly see the challenge and the opportunity of sustainable energy and climate change.
One way or another, this generation - that’s you and me - have this awesome responsibility of delivering low carbon lifestyles in our communities. So turn the page and spend an important hour or so as a carbon accountant and low carbon community planner & engineer. This isn’t a guidebook to read, it is a workbook to do – so get scribbling, thinking and doodling – the future is in your hands.Richard DaviesDirectorMarches Energy Agency
00
4
Low Carbon Leadership - A workbook for decision makers, Marches Energy Agency in partnership with Energy Saving Trust

Contents
Introduction 6
Step 1 Calculating carbon footprints 8
Step 2 Setting targets 13
Step 3 Choosing your actions 17
Step 4 Creating your community vision 27
Step 5 Planning to make it happen 30
Step 6 Shout about it 33
Glossary 34
Services from the Energy Saving Trust 35
How to use this workbook
This workbook is designed as the basis for creating bespoke carbon reduction plans. With a spare hour here and there and internet access, this book enables an elected member, officer, LSP partner or interested community member to understand and create a low carbon route map for their community. It allows community carbon footprints to be understood in context. It enables carbon reduction strategies to be plotted and targets to be chosen. Most crucially of all, it allows an exploration of what actions will be needed to meet these targets and when these actions will be taken.
The ‘community’ we refer to throughout the book is at the scale of the unitary, borough or district local authority. The book can be worked through either by a single person, or by a team. For use by local authorities or LSP’s a small team would be recommended. Crucial decision making sections (steps 1 and 2) should be carried out by those who are ultimately accountable for climate change within the organisation, ideally the Chief Officer and portfolio holder working together. More sector specific sections (steps 3 and 4) should be carried out by people working in the relevant sectors. The final sections (steps 5 and 6) focus on making plans and taking the first steps and should ideally be used by everyone involved.
00
5
Low Carbon Leadership - A workbook for decision makers, Marches Energy Agency in partnership with Energy Saving Trust

CO2CO2CO2
4000 BC 3000 BC 2000 BC 1000 BC 0
Wo
rld
po
pu
lati
on
20
Mill
ion
Wo
rld
po
pu
lati
on
200
Mill
ion
INTRODUCTION
We must reduce our carbon dioxide emissions sharply and soon...Local communities and local authorities are right at the heart of mitigating climate change. This task requires a powerful vision for communities, challenging the `why?’ and outlining `how, where, when, what and who’. Looking at the bigger picture, progress so far in mitigating climate change is at best mixed. Many of the emission reductions achieved to date are a consequence of deindustrialisation and the `dash for gas’. However, there is a groundswell of ambition amongst local authorities. Reports of communities saying `yes’ to climate change action are countrywide.
“The Industrial Revolution may be said to have begun in the 1780s, after James Watt developed his steam engine. At this time, ice core records show that levels of carbon dioxide in the atmosphere were around 280 parts per million (ppm). Give or take 10 ppm, this had been their level for the past 6,000 years, since the beginning of the first cities.” Robert May
The impetus for this action has been provided by National Indicator 186 - `Per Capita Carbon Dioxide Reduction’, which puts a responsibility on local authorities to go beyond declarations and strategies to meaningful and practical action. An additional incentive to local authorities is provided by National Indicator 185 (Percentage CO2 reduction from Local Authority operations). The upcoming Carbon Reduction Commitment and its carbon allowance scheme further promotes action through rewarding those organisations taking the most effective action to reduce their CO2 emissions. Nevertheless, there is no golden bullet. There
First cities - Mesopotamia
Invention of the wheel
Invention of writing
Beginning of Egyptian civilisationBirth of Julius Caesar
Watermill invented in India
Standing stones erected at Stonehenge
is no definitive carbon reduction model. A combination of awareness of all these national policies and of the specific local actions that can deliver them is what is needed.
This workbook seeks to address this. It works primarily at the district, unitary or borough scale, however it could be scaled down to parish, town or any other size of community, should appropriate community CO2 emissions data be available. The key function of the workbook is to clarify and quantify specific actions that will enable carbon reduction targets to be met. Bearing in mind the scale
and urgency of this task, we have tried to keep the book simple to use. To do this, we have made a number of assumptions. The book assumes that CO2 emissions will remain about steady unless action is taken. It assumes that only the actions planned out using this book will contribute towards a community’s target CO2 reduction. The book uses a lot of national average CO2 savings for the actions recommended. If you can improve on any of these simplifications, please do so. However we don’t think this is essential - the simple approach will really help you to grapple with what’s important: the how, where, when, what and who.
00
6

CO2
CO2
CO2
CO
2
1000 AD 2000 AD
280
260
240
220
200
300
320
340
360
380
400
Wo
rld
po
pu
lati
on
310
Mill
ion
Wo
rld
po
pu
lati
on
6.4
5 B
illio
n
CO
2(p
pm
)
“Life is a race between education and catastrophe” H G Wells
Six steps to low carbon futureThere are 6 key steps to take in the journey to a low carbon community. This workbook is your guide through each of these steps. Tick them off here as you complete each one.
Calculate your carbon footprint Set CO2 reduction targets Choose specific actions Create a community vision Plan out how to achieve this vision Tell people about it and how they can help
First moon landing
Television invented
Ford Model T begins production
Wright Brothers first succesful flight
First Steam Locomotive
Columbus’ first voyage to the Americas
First windmill built in Persia
Central heating invented in Rome
Earliest incandescent light bulb developedEurope’s first
successful coal fired blast furnace built at Coalbrookdale by Abraham Darby
00
7

Calculating carbon footprints is the essential first step in any attempt at measured carbon reduction. A carbon footprint gives the benchmark from which all targets should be set and all progress measured. It gives a greater understanding of where action most urgently needs to be taken and allows an initial exploration into progress that may have already been made.
Footprints are often given in terms of carbon dioxide (CO2) per capita, as shown in the image opposite, which illustrates the different average carbon footprints of the countries of the UK. This way of expressing footprints is a useful gauge against other countries or regions. However it is important not to forget that this per capita footprint is made up of varying proportions of domestic, industrial & commercial and transport related CO2 emissions. These proportions offer key information as to how to formulate reduction plans between the sectors.
The following pages will help you discover and explore both the per capita footprint and the unique proportions of domestic, industrial & commercial and transport emissions that make up your borough/unitary/district carbon footprint. They will thus inform your steps forward to definitive carbon reduction.
STEP 1 - CALCULATING CARBON FOOTPRINTS
UK: 7.9 tonnes CO2 per capita
England: 7.7 tonnes per capita
Scotland: 8.5 tonnes per capita
Wales: 9.0 tonnes per capita
Northern Ireland: 9.0 tonnes per capita
The dataset for CO2 emissions highlighted in this step is that used for the Department for Communities and Local Government National Indicator 186 – Per Capita Reduction of CO2 emissions in the Local Authority Area. It excludes a range of emissions which are seen as being beyond the control of local authorities. This is explained in more detail on the next page. It is critical that you use the right dataset!
Average footprints in the UK
00
8
Low Carbon Leadership - A workbook for decision makers, Marches Energy Agency in partnership with Energy Saving Trust

How big are your feet?
* This combines National Atmospheric Emissions Inventory (NAEI) data with local energy consumption data from the Department for Business, Enterprise and Regulatory Reform (BERR) to produce a nationally consistent set of CO2 emission estimates to LA level. It includes emissions from the production of goods which are exported and excludes emissions from the production of goods which are imported. The data also excludes emissions from industry in the EU Emissions Trading Scheme, as well as emissions from refineries, power stations, gas and solid fuel production, motorways, shipping and aviation.
Activity time 20 minutes
Working out the carbon footprint for your area is thankfully a relatively straightforward exercise. Data is easily available on the internet, published by DEFRA*. Follow the 7 steps below to find carbon emissions information for your borough or district and for your region.
1. Go to http://www.defra.gov.uk/environment/statistics/globatmos/download/regionalrpt/local-regionalco2-ni186indicator.xls This will open up the spreadsheet (you can save it onto your PC). If this link has changed, search for ‘emissions of carbon dioxide for local authority areas’ in your search engine.
2. Click on the worksheet tab ‘Summary indicator dataset 2006’. 2005 data is also available for comparison if you like. This will bring up a page listing CO2 emissions by borough/unitary/district authority and by region. This is the dataset specific to the National Indicator 186.
3. Scroll through the list to find data for your patch and region. Firstly extract information about the CO2 emissions from the domestic, transport and industry & commerce sectors. Fill in your figures in the boxes on the right.
4. Calculate your total by adding together all figures.
5. Calculate your per capita rating by dividing the total you’ve calculated by your area’s population count (as given in the spreadsheet).
6. Find your regional per capita footprint and insert into appropriate box.
7. You know you can’t resist it - have a flick through some of the stats for other Local authority areas and check out how you compare to your rivals!
How can you win if you’re not keeping score?
By sector(a) Domestic footprint g (kilotonnes)
(b) Transport footprint g (kilotonnes)
(c) Industry & commerce footprint g (kilotonnes)
Some key figures(e) Total footprint (a)+(b)+(c) g (kilotonnes)
(f) Population g (thousands)
(g) Per capita footprint (e)/(f) g (tonnes/capita)
Comparing your figures to regional and national footprintsUK average footprint per capita 7.9 tonnes
Regional average footprint per capita g tonnes
“88.2% of statistics are made up on the spot”
Vic Reeves
00
9
Low Carbon Leadership - A workbook for decision makers, Marches Energy Agency in partnership with Energy Saving Trust

0%
50%
25%75%
5%95%
10%90%
15%85%
35%65%
40%
20%80%
30%70%
45%55%
60%
STEP 1 - CALCULATING CARBON FOOTPRINTS
Activity time 5 minutes
So how are things looking? Make up a pie chart using this blank chart to get a clearer picture of how your carbon emissions are split between each of the three sectors (domestic, transport and industry & commerce). We’ve marked off percentages to make it easier for you.
Simply convert the figures you found on the previous page to percentages of the total and dig out the coloured pens!
To calculate each sector’s percentage, divide the sector’s emissions by the total emissions. Multiply this figure by 100 and you’ll have your percentage.
Putting it into perspective Activity time 5 minutes
The average per capita footprint in the UK is 7.9 tonnes
We are (tick relevant box):
Above average gAbout the same gBelow average g
Using your total footprint in kilotonnes, make the following calculations:
VOLUME = g hot air balloons (multiply by 189)
WEIGHT = g Blue whales (multiply by 5)
CO2 = g large wind turbines (2.2MW) (multiply by 0.39)
Visualising our carbon footprint
STEP 1 - CALCULATING CARBON FOOTPRINTS
00
10
Low Carbon Leadership - A workbook for decision makers, Marches Energy Agency in partnership with Energy Saving Trust

Every footprint is different. Finding out the figures is the first step, but exploring why those figures are the way they are is a key step towards planning its reduction. Use the boxes below to jot down some notes about why you think your footprint is the way it is. We’ve given you a few leads to get you thinking.
Activity time 20 minutes
What are the key factors adding to this carbon footprint?
• What might be affecting it in domestic/industry/transport sectors?
• Think about the type of fuel being used, degree of commuting to work that happens, type and degree of industrial activity and economic vibrancy.
• Consider the rural/urban split. A rural area will tend to have a higher footprint due to, for example, lack of access to gas supply and increased need for personal car use. An urban area will tend to have a lower footprint due to things like better provision of public transport.
What are we already doing?• Are there local companies taking on energy efficiency?
• Are there specific communities working together to tackle climate change?
• Are local organisations seeking to be part of the solution and collaborating to come up with ambitious ideas?
Understanding our footprint
00
11
Low Carbon Leadership - A workbook for decision makers, Marches Energy Agency in partnership with Energy Saving Trust

The Carbon TestSo how are you doing in your bid to take action on climate change? Take this simple test to find out how you score. These are some of the basics that you should have in place.
Score 2 points for each yes or agree, 1 point for if you are planning it and 0 points for each no or disagree.
1. I have low energy lighting throughout (or very nearly throughout) my home.
2. The electricity supplied to my house is from a renewable tariff.
3. I know what my personal (or family) carbon footprint is.
4. At work we have signed a corporate commitment to tackle climate change (e.g Nottingham Declaration).
5. We know the carbon footprint of our offices and other buildings we control.
6. At work we are tackling the easy things that provide good carbon and financial savings.
7. We have a designated climate change champion in the organisation.
8. Staff receive regular briefings on climate change and most know why it is a key issue for this organisation.
9. We are actively reducing our “commute to work” carbon footprint .
10. We are working with our Energy Saving Trust advice centres to point our stakeholders and/or community towards the Energy Saving Trust’s advice and support.
11. We work with our suppliers and partners to ensure that the things we buy and the services we provide are a part of the climate change solution (not a part of the problem).
12. We explain to our stakeholders, customers and the communities we serve why climate change is a top priority for us.
13. We actively promote and support renewable energy projects within the organisation and in the wider community.
14. We champion the idea of “low carbon futures” within our local strategic partnership and collaborate with partners on our decarbonisation project.
TAKE A BREAK
How did you do?0 – 7 Points: Runaway climate change
You’ve really got the opportunity to plan a cohesive strategy from scratch. Work your way through this book to formulate your plans both at home and in the workplace! You need to start right now.
8 – 14 Points: CO2 still rising.
You’ve made a good start! Look back at the questions that you answered no to and use the following sections in the workbook to help fill those gaps.
15 – 21 Points: Approaching CO2 stability
Its going well, but there are still some issues you haven’t dealt with yet. Continue putting your plans into action and use the rest of the workbook to find some new initiatives to put that extra sparkle into your strategy.
22 – 28 Points: CO2 reduction.
Wow! Now’s the time to shout about what you’ve achieved so far, share that expertise and help and inspire others to match your results. Why not aim for some of the big and exciting stuff mentioned throughout the rest of the workbook?
NOW, this is a start, these were the basics. Time to start looking at the bigger picture. Your next step is to set some targets.
00
12
Low Carbon Leadership - A workbook for decision makers, Marches Energy Agency in partnership with Energy Saving Trust

Now you know your footprint, your next step is to plan its reduction over time. How much will you reduce it by 2020? How much by 2050? By understanding the figures, you’ll be better equipped to plan specific actions each year that will meet the targets you’ve set. We’ll come to the actions later. For now, let’s talk targets.
Some existing CO2 reduction targets
UK government 60% cut by 2050
Birmingham 60% cut by 2026
California 80% cut by 2050
Stockholm 25% cut by 2006 (met target)
European Union 20% cut by 2020
(Stockholm are now planning to be fossil fuel free by 2050)
Putting it into perspective
A 60% cut in emissions by 2050 means a reduction of 2.5 % each year.
An 80% cut in emissions by 2050 means a reduction of 4 % each year.
A 90% cut in emissions by 2050 means a reduction of 6% each year.
Note that each yearly percentage given above is calculated as a percentage of the previous year’s carbon footprint and not as a percentage of the original footprint.
What are the targets for?The targets are based on scientists’ and policy makers’ understanding of what we need to do to stabilise climate change. Most targets aim to stop CO2 levels in the atmosphere from rising above 550 parts per million. This needs to be done to stop global average temperatures from rising any more than 2°C. By stabilising temperatures here, we are much more likely to prevent a number of known natural feedbacks that threaten to amplify the effects of climate change through the release of natural stores of greenhouse gases. We will also prevent some of the worst impacts of climate change. A few years ago, it was thought that a 60% cut in emissions below 1990 levels by 2050 would be enough to do this. More recent scientific findings are warning that nothing less than an 80% cut will do the job. With a 60% reduction, it is now being predicted that we will slip past the 450ppm CO2 level to 550ppm and that at this level, runaway climate change could be irreversible. We have until 2015 to really get to grips with things and by 2030 need to have made some significant reductions.
STEP 2 - SETTING TARGETS
00
13
Low Carbon Leadership - A workbook for decision makers, Marches Energy Agency in partnership with Energy Saving Trust
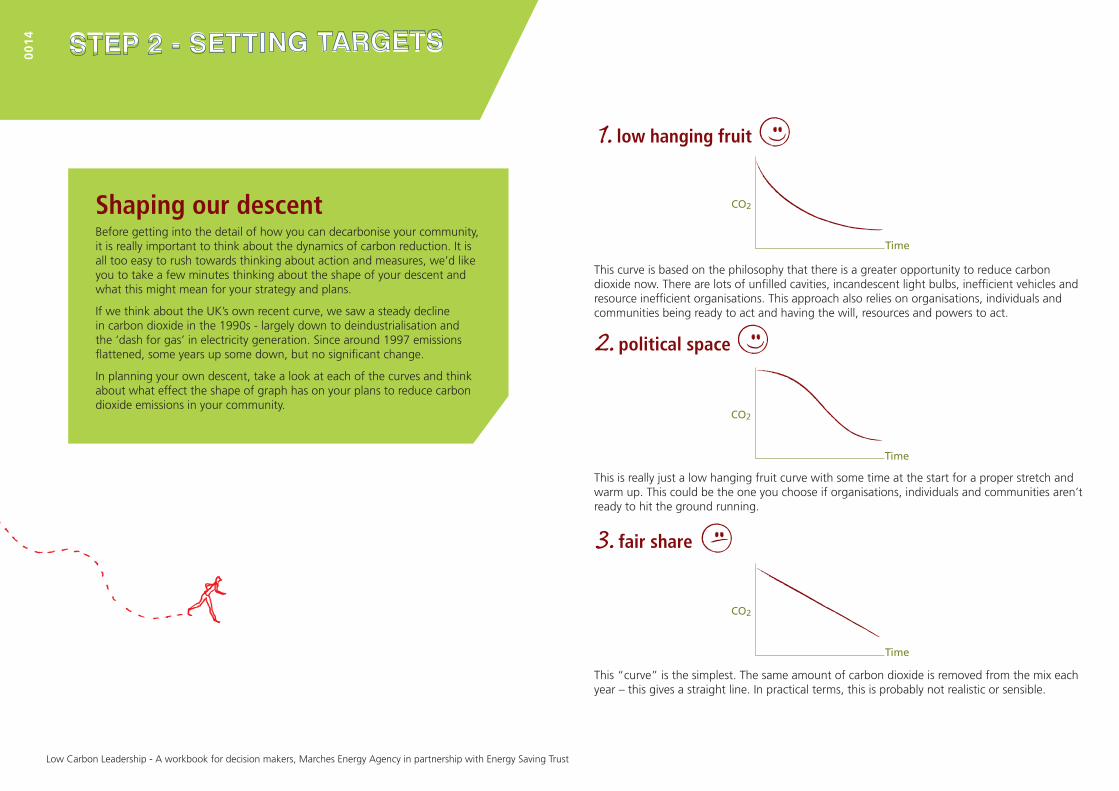
Shaping our descentBefore getting into the detail of how you can decarbonise your community, it is really important to think about the dynamics of carbon reduction. It is all too easy to rush towards thinking about action and measures, we’d like you to take a few minutes thinking about the shape of your descent and what this might mean for your strategy and plans.
If we think about the UK’s own recent curve, we saw a steady decline in carbon dioxide in the 1990s - largely down to deindustrialisation and the ‘dash for gas’ in electricity generation. Since around 1997 emissions flattened, some years up some down, but no significant change.
In planning your own descent, take a look at each of the curves and think about what effect the shape of graph has on your plans to reduce carbon dioxide emissions in your community.
1. low hanging fruit
This curve is based on the philosophy that there is a greater opportunity to reduce carbon dioxide now. There are lots of unfilled cavities, incandescent light bulbs, inefficient vehicles and resource inefficient organisations. This approach also relies on organisations, individuals and communities being ready to act and having the will, resources and powers to act.
2. political space
This is really just a low hanging fruit curve with some time at the start for a proper stretch and warm up. This could be the one you choose if organisations, individuals and communities aren’t ready to hit the ground running.
3. fair share
This “curve” is the simplest. The same amount of carbon dioxide is removed from the mix each year – this gives a straight line. In practical terms, this is probably not realistic or sensible.
CO2
Time
CO2
Time
STEP 2 - SETTING TARGETS
CO2
Time
00
14
Low Carbon Leadership - A workbook for decision makers, Marches Energy Agency in partnership with Energy Saving Trust

So you’ve heard about the targets and you’ve heard about the reduction curves. Now’s the time to put it all together and apply it to your community.
Setting our targetActivity time 5 minutes – 1 hour
It’s that moment you’ve been waiting for! Of course you may already have made up your mind what your target will be for 2050. If so, great! Write it in the box below.
If not, do a bit more investigating to help you decide. Try a web search to find out what targets areas around the country are setting. Or if you want to get your head around the science behind the figures a bit more, try the following sources for more information:
The Energy Saving Trust’s ‘Emission Impossible’ illustrates the steps needed to achieve an 80% reduction of CO2 emissions by 2050.
4www.energysavingtrust.org.ukIPCC Their fourth assessment report is packed full of the latest in climate change science. Try their summary for policy makers for a more digestible read.
4www.ipcc.chThe Met Office A wealth of information and links about climate change science. Click through to their climate change section.
4www.metoffice.gov.ukGlobal Commons Institute An in-depth look at the principles behind setting international targets – contraction and convergence.
4www.gci.org.ukUK Climate Impacts Programme Information about how climate change is predicted to affect the UK
4www.ukcip.org.uk
Our target for 2050:
% reduction
4. Future techno
This curve puts the ball into the inventors’ court. Will fusion, really cheap photovoltaics, wave power or third generation biofuels be market ready in 2035? If so let’s not try too hard over the next decade or two. Remember that 42 years ago the mobile phone, computer and space flight were but dreams. However, it needs to be asked - will this be too little too late?
5. Collapse
To understand this curve, please get the book of the same title written by Jared Diamond out of the library. Collapse isn’t pretty and isn’t something any community should allow. Peak oil or runaway climate change isn’t something we want to experience – so get to the end of this workbook, make a plan and get on with it!
6. Oops! Too much shopping…..
This curve does what it says on the graph. We consume too many non-renewable and unsustainable resources and remain out of balance with the ability of the earth to provide.
O2
CO2
Tim
Time T me
CO2
T me ime T
Time
O2
CO2
i e
Time
00
15
Low Carbon Leadership - A workbook for decision makers, Marches Energy Agency in partnership with Energy Saving Trust

Plotting for success Activity time 20 minutes
Once you’ve set your target, choose a reduction curve from the previous page and sketch it in the graph printed on the pull out activities sheet inserted into the cover of this book.
Make sure your curve starts at the top at a level of 0% on the y axis and finishes at your target reduction level by 2050.
Fill in your total footprint at the 0% mark on the y axis.
Now use the graph to read off what percentage cut you need to have made by the end of every 5 year period in order for you to reach your target in 2050. Write these percentages in the appropriate boxes.
Convert each 5 yearly target into tonnes of CO2 to be reduced. (Divide the percentage target by 100 and then multiply by your total footprint). Write these reduction targets into the appropriate boxes on the graph.
Now you’ve got the figures, its just a case of finding out what it will take to meet them! Read on into the next section to find out how.
STEP 2 - SETTING TARGETS0
01
6
Low Carbon Leadership - A workbook for decision makers, Marches Energy Agency in partnership with Energy Saving Trust

STEP 3 – CHOOSING YOUR ACTIONS
This section – step 3 – is the heart of the workbook. It is going to help you put your target in context – to convert it into a mix of measures and to let you shape and see the challenge and the opportunity ahead.
Throughout this section, we make some assumptions that we need to mention. We assume that only you can make a difference to your community’s carbon emissions. We also assume that if you don’t try to make things happen, then CO2 emissions hold steady. Clearly, the world of carbon emissions is much more complicated than this. Many things have an effect on carbon emissions. For example, the price of oil and the state of the economy. However in the real world we know lots is already happening, many organisations and individuals are playing their part – insulating their lofts, buying new A++ rated fridges or introducing cycle to work schemes. So if you know about a planned activity put it into the mix of actions.
How can the targets be met? Given that you have identified your carbon footprint and explored a target, it’s now time to investigate the range of actions that will deliver your aims. In step 3, you’ll be looking at the kinds of actions that can be taken by the three key sectors: households, industry & commerce and transport. You’ll be guided through a series of calculations, that will give you some idea of how these actions can help you to meet your targets. We hope that by exploring some of the options and alternatives and playing at being a ‘carbon accountant’ for your community, you will gain a good understanding of the opportunities and challenges that lie ahead.
But before you get stuck in, you should consider where you would like to make your savings. What proportion of savings should be achieved by each sector? Where is the low hanging fruit? Where do you have the most influence? Which is the most compelling vision?
So get your calculator, a good, sharp pencil and plenty of scrap paper ready, it’s time to choose some actions!
00
17
Low Carbon Leadership - A workbook for decision makers, Marches Energy Agency in partnership with Energy Saving Trust

A note about domestic wind power.For homes in locations suitable for micro wind generation, a 1kW turbine could provide CO2 savings of 0.378 tonnes per year, and cash savings of £80. However, many UK homes are located in areas which are unsuitable for wind power, for two main reasons. Firstly, people generally do not like to live in windy places, so that towns and cities tend to be found in more sheltered locations where average wind speeds are too low for significant generation. Secondly the ideal conditions for wind power require open space; in built up urban and suburban environments the proximity of other buildings, trees, and other large objects will reduce the wind speed and create unwanted turbulence.
STEP 3: - CHOOSING YOUR ACTIONS
In this section you will start to investigate your carbon reduction budget. You will estimate how much domestic carbon reducing measures can contribute to your chosen target.
Putting it into perspectiveActivity time 15 minutes
Work your way through the table on the following page, filling in the empty boxes to work out how many homes in your community could benefit from each technology and to work out the maximum CO2 savings that could be achieved from each measure.
To do this, you’ll first need to find data for the number of homes in your community (visit the ‘Neighbourhood’ section of www.statistics.gov.uk if you don’t already know). Calculate the appropriate percentage of this total figure for each measure and enter the resulting number of homes into the column marked ‘Number of suitable homes in community’. For technologies without a given percentage in the opportunity column, make you own estimated percentage based on your knowledge of local housing stock and use this to estimate the total number of homes. You’re allowed to phone a friend at this point if you need a second opinion! Multiply these figures by the relevant CO2 savings and then divide by 1000, to find out the maximum potential CO2 savings for each measure in kilotonnes of CO2.
Cutting CO2 from the domestic sector
While there are numerous ways that a house can save energy, not all energy saving measures are suitable for every house. What’s more, some houses have already begun saving energy - some are already insulated or already have low energy light bulbs, for example. In order to estimate the potential CO2 savings from this sector, it is necessary to put things into perspective and to estimate what proportion of housing stock can use each technology.
In the activity below, you’ll be presented with and will make estimations for the percentage of UK homes for which each technology is suitable. Using these percentages, you’ll be able to estimate how many homes can use the technologies in your community and how much CO2 can therefore potentially be saved.
A note about heatingIt should be noted that CO2 savings from measures that improve the warmth of homes are highly dependent on the type of fuel being displaced. Savings are higher if the heating fuel displaced is electric, rather than oil and higher if it is oil being displaced rather than gas.
The savings figures for insulation quoted in this table are based on weighted averages of domestic fuel use according to the GB stock average.
For replacement heating systems (log burning stoves, ground source heat pumps etc), the figures are based on best estimates of the mix of heating systems that might be displaced by each given measure. As a general rule of thumb, if you have a higher than average number of homes on the gas grid, you’d expect to see lower CO2 savings; for areas with limited access to the gas grid, the CO2 savings would be higher than quoted.
00
18
Low Carbon Leadership - A workbook for decision makers, Marches Energy Agency in partnership with Energy Saving Trust

TechnologyAnnual household CO2
savings*(tonnes)
Opportunity**(% of UK homes suitable)
Number of suitable homes in community
(calculate number as appropriate % of total homes)
Total annual CO2 savings (CO2 x suitable homes /1000)
(Kilotonnes)
Cavity Wall insulation 0.64 tCO2 29%
Loft Insulation 0.30 tCO2 52%
Solid wall insulation(external) 2.18 tCO2 -
Solid wall insulation(internal) 2.06 tCO2 -
Draught proofing 0.04 tCO2 100%
A rated boilers 0.786 tCO2 66%
Whole House Low Energy Lightbulbs
(CFL’s only)0.17 tCO2 100%
Log burning stoves 0.39 tCO2 -
Wood pellet boilers 5.06 tCO2 -
Solar water heater (4m2) 0.36 tCO2 -
Ground source heat pump 1.88 tCO2 -
Photovoltaic panels (2.5kWp) 1.20 tCO2 -
Compare your results to your total target figure. How much can these measures contribute towards this? What would it take to meet your first five year target? How much do you think could realistically happen in one year?
*The CO2 savings in the table are from the Energy Saving Trust (2008) and are weighted for average fuel type and house size across the UK.
**Opportunity percentages are from the Energy Saving Trust (2008) and are based on appropriate published sources for the current state of the UK housing stock.
Top Tip We’ve used UK averages to generate the opportunity for each technology. You might have much better information for your community at your fingertips. If you do, then please use it. You might also want to get an expert opinion – your local Energy Saving Trust Advice Centre, for example (0800 512 012). The Energy Saving Trust’s Home Energy Efficiency Database (HEED) provides a wealth of information on the status of the housing in your community.
00
19
Low Carbon Leadership - A workbook for decision makers, Marches Energy Agency in partnership with Energy Saving Trust

With so many methods of reducing CO2 being discussed these days, we’ve put a number of these items to the test. Take a break and have a read through our guide to some new and innovative methods of electricity generation, transport and energy efficiency
What’s so good about them?Children seem to have boundless energy, this product taps this and converts it into electricity. Early models can power a class room’s lighting from just five to ten minutes play.
AvailabilityCurrently still under development, so not commercially available. The idea had been developed for African schools, but there would be no reason not to extend their use world wide, or to extend to other items such as a roundabout, a swing or a wide range of gym equipment.
We reckon: A good example of what can be achieved if you put your mind to it. In combination with low energy lighting, this little addition should go a long way. It also puts pupils directly in touch with energy generation. Beware of turning play into work however!
Energy producing See-saw
LED lightsWhat’s so good about them?CFLs (compact fluorescent lights) use a fifth of the electricity as incandescent bulbs, LEDs use up to a twentieth of the electricity. The savings on lighting and CO2 emissions will be great.
AvailabilityLED lights are already on the market, but are not as widely available as CFLS just yet. In two to three years, LEDs will be replacing CLFs. Currently they are useful for up-lighting and mood lighting and are used in some vehicle applications. Shortly they will be good enough to replace most lights.
We reckon: CFLs should be seen as an intermediate technology. LEDs are what everyone should have in a few years time. Lack of mercury in the bulbs will also be an advantage over CFLs. They also last up to 50 times longer than a standard bulb, leading to less waste.
GREAT FUTURE
POTENTIAL
STEP 3: - CHOOSING YOUR ACTIONS
What’s so good about them?No road tax, less than 100g of CO2 per kilometre and reduced costs of motoring. Also no congestion charge in London (and perhaps elsewhere in the near future). No new fuel or infrastructure is required, just fuel up and go. Change all your fleet over for large savings of CO2.
AvailabilityCurrent models include the VW Polo Bluemotion and the Seat Ecomotion, both diesels. Expect more to follow in the next year including the Smart Fortwo CDi, said to have the lowest CO2 emissions of any new car in the world. Only 88g of CO2 is released per kilometre, while its fuel consumption stands at 85.6 miles per gallon!
We reckon:When it’s time to replace your car then you should really consider one of these. A combination of less travelling, more cycling and walking, public transport, fuel efficient vehicles, alternative fuels and eco driving can really make a difference.
Ultra Low CO2 Cars (<100gCO2/km)
PRODUCTS ON TEST
LOW CO2DRIVING
00
20
Low Carbon Leadership - A workbook for decision makers, Marches Energy Agency in partnership with Energy Saving Trust

What’s so good about them?Jumpers allow us to turn the heating down and avoid the use of those nasty patio heaters. A helping hand in lowering CO2 emissions
AvailabilityWidely available in most styles and will not get you banned from shopping centres. Go for organic, fair trade varieties rather than those with unnatural fibres. Many high street brands are shortly to have energy or eco labels on them detailing the CO2 footprint of the product.
We reckon: There’s no such thing as bad weather, only inappropriate clothing.
What’s so good about them?With increased restrictions on train capacity for bikes, fold up bikes are suitable for going in a standard luggage rack and on the tube. They are actually very nippy and light weight.
AvailabilityBrompton or Dahon are the upper end of fold up bikes, with many other versions available as well. Cheaper models can be heavier and more cumbersome. The best models have a wide range of gears.
We reckon: A must for urban commuting, with many options available. The most efficient transport mode developed yet and zero emissions.
JumpersGreen Electricity Tariffs
Fold up bikesTURN OFFAND PULL ON
GET ON YOUR BIKE
What’s so good about them?Switching to a green electricity tariff is a really easy thing to do. It is a big consumer vote to energy utilities saying loud and clear ‘we want more climate friendly products and services’.
AvailabilityMost electricity suppliers offer a green tariff. They all have relative merits and benefits. Try and find an online league table which will help you decide which one is best for you.
We reckon:Switching to a green electricity tariff should be one of the very first steps you take towards reducing your environmental impact, and you shouldn’t stop there. There is lots of debate about whether switching makes a significant difference – we think it’s a really easy way of voting with your money – we need organisations to know that we care and that we want to do the right thing and that we need their help.
Low Carbon Leadership - A workbook for decision makers, Marches Energy Agency in partnership with Energy Saving Trust
00
21

Over the next two pages, you’ll explore some of the savings that can be made from within your community’s industrial & commercial sector.
Putting it into perspectiveActivity time 15 minutes
In this activity, you will estimate how much your community’s industry & commerce sector could save through installing a number of different energy saving measures. You will first calculate your community’s unique conversion factor. Then you will apply this to a range of technologies to discover estimated savings. The estimates are based on UK averages.
a) calculating your conversion factor
This will be worked out on a pro-rata basis for national average savings for this sector. Simply work out what proportion of the UK population live in your community. This will be your conversion factor.
Your population (see page 9) ÷ UK population (60,587,000) =
b) estimating your potential savings
Multiply your conversion factor by each of the CO2 savings listed in the table overleaf. Record each result in the appropriate box in the right hand column.
Cutting CO2 from industry & commerce
Doing this accurately is no easy task. Identifying sustainable energy measures and their CO2 savings from the industrial & commercial sector in your community can be a complex and lengthy procedure. No two communities are alike. No two businesses are alike. There is a lack of detailed information readily available about the state of the sector with regards to current CO2 emissions. This is especially true of small and medium enterprises (SMEs), which make up most businesses. At present, accurate figures for carbon emissions and savings can only be found by conducting detailed energy audits on a business by business basis. Due to the nature of business, many of the savings a company can make will relate to more than one community, further complicating this task.
Nevertheless, estimates can be made for the savings potential within your community’s industrial & commercial sector. What you will concentrate on in this section are activities over which you can have some control: that is local measures, or national measures with a strong local influence. You should see this section very much as the first step in working with this sector: a process to gain some insights into the sector and some of the measures which may deliver not only lower carbon emissions but also a more economically sustainable sector.
STEP 3: - CHOOSING YOUR ACTIONS0
02
2
Low Carbon Leadership - A workbook for decision makers, Marches Energy Agency in partnership with Energy Saving Trust

Measure CO2 saved nationally *(kilotonnes/year)
Potential CO2 savings for your community(multiply national figure by your conversion factor)
(kilotonnes/year)
Fit fixed period timers on stairwell lights 2,387
Replace incandescent light bulbs with compact fluorescent bulbs 1,915
Turn off lights when not in use 1,807
Reduce thermostat temperatures by 1oC 2,979
Optimise energy management of office equipment 1,471
Replace 38mm (T12) fluorescent tubes with 16mm 1,129
Install most energy efficient boiler 2,120
Fit thermostatic radiator valves to all radiators 1,933
Basic timer for lighting 605
• How do the savings you’ve found compare with your chosen target? • What would it take to meet your first five year target? • What sort of approach might be required to make this happen?• How many years would a campaign take to deliver the savings?
For further advice on reducing energy use in this sector, refer to the Carbon Trust website: www.carbontrust.co.uk
* The annual carbon dioxide savings from sustainable energy measures, with the greatest total cost-effective carbon dioxide savings in the commercial & public sector (BERR: Energy – its impact on the environment)
00
23
Low Carbon Leadership - A workbook for decision makers, Marches Energy Agency in partnership with Energy Saving Trust
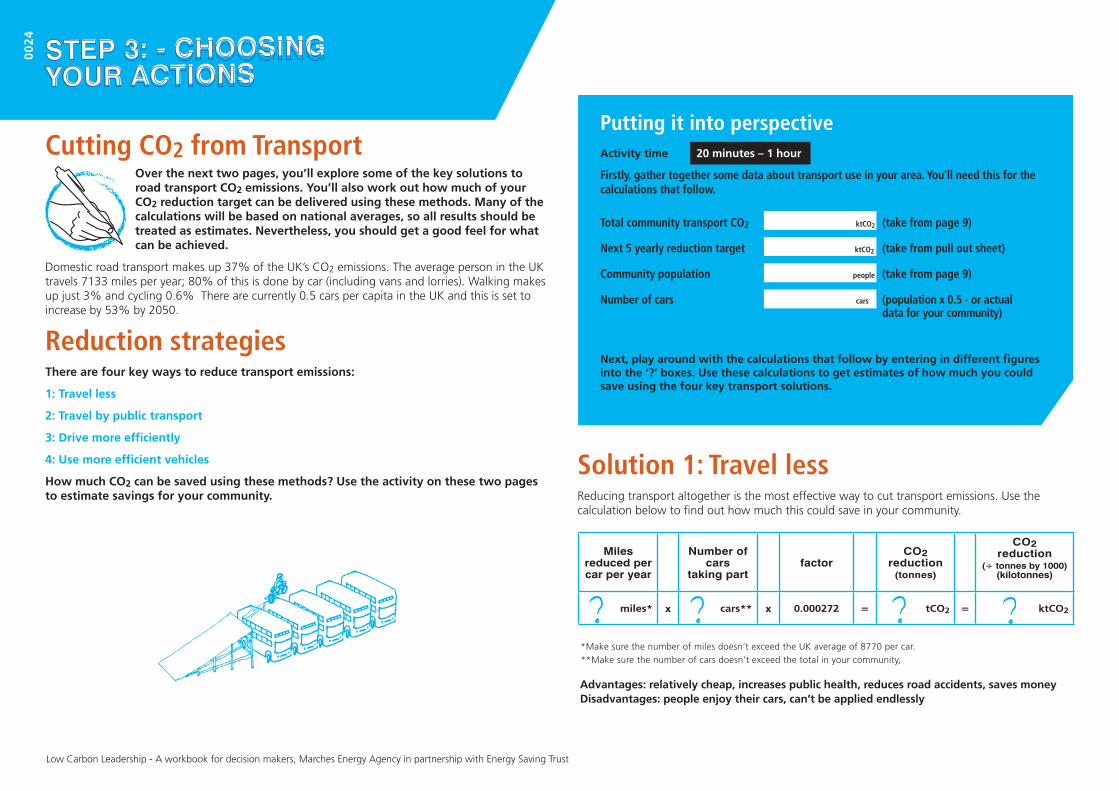
Domestic road transport makes up 37% of the UK’s CO2 emissions. The average person in the UK travels 7133 miles per year; 80% of this is done by car (including vans and lorries). Walking makes up just 3% and cycling 0.6% There are currently 0.5 cars per capita in the UK and this is set to increase by 53% by 2050.
Putting it into perspectiveActivity time 20 minutes – 1 hour
Firstly, gather together some data about transport use in your area. You’ll need this for the calculations that follow.
Total community transport CO2 ktCO2 (take from page 9)
Next 5 yearly reduction target ktCO2 (take from pull out sheet)
Community population people (take from page 9)
Number of cars cars (population x 0.5 - or actual data for your community)
Next, play around with the calculations that follow by entering in different figures into the ‘?’ boxes. Use these calculations to get estimates of how much you could save using the four key transport solutions.
Solution 1: Travel lessReducing transport altogether is the most effective way to cut transport emissions. Use the calculation below to find out how much this could save in your community.
*Make sure the number of miles doesn’t exceed the UK average of 8770 per car.
**Make sure the number of cars doesn’t exceed the total in your community,
Advantages: relatively cheap, increases public health, reduces road accidents, saves moneyDisadvantages: people enjoy their cars, can’t be applied endlessly
Over the next two pages, you’ll explore some of the key solutions to road transport CO2 emissions. You’ll also work out how much of your CO2 reduction target can be delivered using these methods. Many of the calculations will be based on national averages, so all results should be treated as estimates. Nevertheless, you should get a good feel for what can be achieved.
Reduction strategies There are four key ways to reduce transport emissions:
1: Travel less
2: Travel by public transport
3: Drive more efficiently
4: Use more efficient vehicles
How much CO2 can be saved using these methods? Use the activity on these two pages to estimate savings for your community.
Miles reduced per car per year
Number of cars
taking partfactor
CO2 reduction
(tonnes)
CO2 reduction
(÷ tonnes by 1000)(kilotonnes)
miles* x cars** x 0.000272 = tCO2 = ktCO2
Cutting CO2 from Transport
STEP 3: - CHOOSING YOUR ACTIONS
00
24
Low Carbon Leadership - A workbook for decision makers, Marches Energy Agency in partnership with Energy Saving Trust

Solution 2: Travel by public transportUse of public transport cuts emissions by around two-thirds. The following calculation will enable you to estimate the CO2 that could be saved in your community each year by using more of it.
*number of trips must not exceed the UK average of 1037. **must not exceed the total people in your area.***assumes the UK average of 6.9 miles per trip
Advantages: improves public health, reduces road accidents, reduces air pollution, increases social interaction
Disadvantages: requires infrastructure improvements, especially in rural areas.
Solution 3: Drive more efficientlyEco driving techniques save up to 10% on vehicle emissions (Transport Learning 2005). Use this calculation to see how much eco driving could save your community each year.
Solution 4: Use more efficient vehiclesThe average UK car emits 169gCO2/km (SMMT 2005). More efficient ‘A’ Band cars have emissions of less than 100gCO2/km. Estimate potential yearly savings using the following calculation:
*must not exceed the total number of cars.
**assumes each driver drives the UK average of 8770 miles per year.
Advantages: Increases public health, reduces air pollution, reduces road accidents, saves money
Disadvantages: training everybody would be costly, some enforcement will be needed
Number of vehicles switched
factorCO2
reduction(tonnes)
CO2 reduction
(÷ tonnes by 1000)(kilotonnes)
vehicles* x 0.98** = tCO2 = ktCO2
Advantages: big winsDisadvantages: costly, 60% reduction will never be achieved using this method alone.
Sources of further info:Free transport advice is available from the Energy Saving Trust Advice Centre 0800 512 012
Fleet advice is available from the Energy Saving Trust’s website:
www.energysaving trust.org.uk/fleet
Other sources of information:www.ecodrive.org
www.cfit.gov.uk
www.transportleaning.net
www.dft.gov.uk/actonco2
Number of trip switches per person
(yearly)
Number of people
taking partfactor
CO2 reduction(tonnes)
CO2 reduction
(÷ tonnes by 1000)(kilotonnes)
trips* x people** x 0.00129*** = tCO2 = ktCO2
Number of drivers trained in
eco-driving
factorCO2
reduction(tonnes)
CO2 reduction
(÷ tonnes by 1000)(kilotonnes)
drivers* x 0.358** = tCO2 = ktCO2
*must not exceed the total number of cars **assumes each driver drives the UK average of 8770 miles per year
Once you’ve played around with these figures, how do they all add up? What would it take to meet your next 5 yearly target? How much could cutting transport emissions contribute towards your ultimate target for 2050?
00
25
Low Carbon Leadership - A workbook for decision makers, Marches Energy Agency in partnership with Energy Saving Trust

STEP 3: - CHOOSING YOUR ACTIONS
Climate Heroes and Climate Villains What should you be encouraging or discouraging in your community? Here are a few ideas from us about some of the key technologies to bear in mind. Why not add a few of your own ideas to the list?
SunpipesEnabling passive solar design and the elimination of lighting altogether for daylight periods, these can be retrofitted as well. A significant development that will lead to better lighting conditions through the use of natural light and reduction in CO2 associated with lighting
Climate Heroes
District heatingUsually making use of a CHP unit, this generates heat (and electricity) for a defined locality. Users can be across all sectors, domestic, commercial and public buildings. Provides higher efficiencies and lower CO2 emissions. Potential for integrating biomass and renewable technologies as locally appropriate.
Intelligent lighting systemsCombining movement and light level sensors provides light at the right level, but only when needed. This avoids over illumination and lighting rooms when no one is present. A must for public buildings and increasingly being used domestically.
Hybrid busA hybrid diesel engine with regenerative braking enables this bus to reduce CO2 emissions by up to 30%. It also has a larger capacity -100 passengers compared to 82 for a standard bus. Trialled in London, now being used around the country.
Single car useWalking, cycling or public transport will all significantly reduce the CO2 emitted in to the atmosphere. If you can’t shift your mode, try sharing your trip and your emissions.
Plasma TVsThe incandescent light bulb of the TV world. Models typically use 700W compared to 150W for an LCD equivalent.
Patio heatersQuite literally global warming in action! Uses the same amount of gas as a home would for cooking for six months. It would emit on average around 50kg CO2 per year. An alternative technology would be wearing a jumper!
Incandescent light bulbsUsing 5 times as much energy as compact fluorescent light bulbs (CFLs) and up to 50 times as much energy as LED lights, this abominable technology will be outmoded by 2011. But why wait? Ban incandescent bulbs now and stop 80% of lighting electricity being wasted.
Climate Villains
00
26
Low Carbon Leadership - A workbook for decision makers, Marches Energy Agency in partnership with Energy Saving Trust

Creating a vision of the future is what this book is really all about. It is vitally important that you know from the start where you
Visions of the futureActivity time – 10 minutes
To help you visualise your community of the future, we’ve provided images of each of your three keys sectors on the pull out activity sheet. Use these to sketch out ideas and to make notes about how you envisage each sector developing to become more ‘low carbon’ in the future.
For some more inspiration in creating your community vision, read on through this section and the next. On the following pages, find out about some of the work that has happened so far in helping to create a low carbon future. In the following section, we’ve compiled a collection of visionary action plans being put forward by commentators such as Mark Lynas, Friends of the Earth and the Centre for Alternative Technology.
want to get to. How would you get there without this? Be bold. What will a low carbon community look like? How will people get around? What sort of industry and commerce will be thriving? How will the local authority be a beacon to the rest of the community?This is a chance to build on all the hard work done so far in the book, to build on the robust preparatory work you have carried out. This is also a chance to be creative and visionary. You are the leader here and leaders are defined by the vision they create for others to follow.
STEP 4 – CREATING YOUR COMMUNITY VISION
00
27
Low Carbon Leadership - A workbook for decision makers, Marches Energy Agency in partnership with Energy Saving Trust

Creating the Global Low Carbon Vision
STEP 4 – CREATING YOUR COMMUNITY VISION
Steps to understand human induced climate change have been ongoing for over 100 years, as this timeline shows. During this history of understanding and action, the groundwork has been put in place to now move on and transform all the rhetoric into some serious and far reaching action. As outlined in this timeline, the stage has been set to make your community vision for a low carbon future into a reality.
1890s: Swedish scientist Svante Arrhenius and an American, P C Chamberlain, independently consider the problems that might be caused by CO2 building up in the atmosphere. Both scientists realise that the burning of fossil fuels could lead to global warming, but neither suspects the process might already have begun.
1956: The Clean Air Act 1956 was an Act of the Parliament of the United Kingdom which responded to London’s Great Smog of 1952. It was in effect from 1955-1964 and sponsored by the Ministry of Housing and Local Government in England and the Department of Health for Scotland.
1957: US oceanographer Roger Revelle warns that humanity is conducting a “large-scale geophysical experiment” on the planet by releasing greenhouse gases. Colleague David Keeling sets up first continuous monitoring of CO2 levels in the atmosphere and finds a regular year-on-year rise.
1979: First World Climate Conference adopts climate change as major issue and calls on governments “to foresee and prevent potential man-made changes in climate.”
1985: First major international conference on the greenhouse effect at Villach, Austria, warns that greenhouse gases will “in the first half of the next century, cause a rise of global mean temperature which is greater than any in human history.”
1987: Warmest year since records began. The 1980s turn out to be the hottest decade on record, with seven of the eight warmest years recorded up to 1990.
1988: Global warming attracts worldwide headlines after scientists at Congressional hearings in Washington DC blame major US drought on its influence. Meeting of climate scientists in Toronto subsequently calls for 20% cuts in global CO2 emissions by 2005. UN sets up the Intergovernmental Panel on Climate Change (IPCC).
1990: The first report of the IPCC finds that the planet has warmed by 0.5°C in the past century. IPCC warns that only strong measures to halt rising greenhouse gas emissions will prevent serious global warming.
1900
1910
1920
1930
1940
1890
1890s to 1940: Average surface air temperatures increase by about 0.25 °C. Some scientists see the American Dust Bowl as a sign of the greenhouse effect at work.
Your contributionActivity time - 10 minutes
Sketch onto this timeline some of the things your community has done alredy to help mitigate climate change. In creating your community vision and before making your plans in step 5, it’s important to be clear what you will be building upon. This activity will help you map this out.
00
28
Low Carbon Leadership - A workbook for decision makers, Marches Energy Agency in partnership with Energy Saving Trust

1995: The hottest year recorded to date. In March, the Berlin Mandate is agreed by signatories at the first full meeting of the Climate Change Convention in Berlin. Industrialised nations agree on the need to negotiate real cuts in their emissions, to be concluded by the end of 1997.
1997: Kyoto Protocol agrees legally binding emissions cuts for industrialised nations, averaging 5.4%, to be met by 2010. The meeting also adopts a series of flexibility measures, allowing countries to meet their targets partly by trading emissions permits, establishing carbon sinks such as forests to soak up emissions, and by investing in other countries.
2000: Nottingham Declaration. The Nottingham Declaration on Climate Change requires local authorities to work with their local community to develop an action plan to tackle climate change at a local level.
2002: Energy Efficiency Commitment came into force. This commits energy suppliers and transporters to reduce energy use by helping their customers become more energy efficient at home.
2003: Globally it is the third hottest year on record, but Europe experiences the hottest summer for at least 500 years, with an estimated 30,000 fatalities as a result. Researchers later conclude the heat wave is the first extreme weather event almost certainly attributable to man-made climate change. Extreme weather costs an estimated record of $60 billion this year.
2004: The London Borough of Merton is the first to formalise the government’s renewable energy targets in its adopted Unitary Development Plan. In what has become known as the Merton Rule, this set the target for the use of onsite renewable energy to reduce annual CO2 emissions for all new major developments in the borough by 10%.
2005: The Kyoto Protocol comes into force. Signatories agree to discuss emissions targets for the second compliance period beyond 2012.
2006: The Climate Change and Sustainable Energy Act introduced in the UK, aiming to boost the number of heat and electricity microgeneration installations in the United Kingdom.
2007: The UK Climate Change Bill published as a draft law aiming to move the United Kingdom to a low-carbon economy and society. The bill is introduced as a result of cross-party pressure, led by environmental groups.
1998: The hottest year in the hottest decade of the hottest century of the millennium.
1992: Rio Earth Summit. The Climate Change Convention, signed by 154 nations in Rio, agrees to prevent “dangerous” warming from greenhouse gases and sets an initial target of reducing emissions from industrialised countries to 1990 levels by the year 2000.
1993: UK government set up the Energy Saving Trust, the leading climate change agency.
1950
1960
1970
1980
1990
2000
2007
1994: The Alliance of Small Island States demand 20% cuts in emissions by the year 2005 in order to cap sea-level rise at 20cm.
00
29
Low Carbon Leadership - A workbook for decision makers, Marches Energy Agency in partnership with Energy Saving Trust

STEP 5 – PLANNING TO MAKE IT HAPPEN
By now, you’ll have got to grips with the figures relating to your carbon reduction plans and will have earmarked some of the things that will enable you to achieve them, drawing them together into a comprehensive community vision. Now, in step five, it is time to start putting dates to some of your plans.
Visionary Plans Below are some of the things you might expect to be going on across the country while you’re progressing your plans. Have a browse through to get some inspiration before writing up your first set of plans.
InternationalA post-Kyoto Cap and Trade system is in place by 2009, generating £100 billion each year for low carbon investment.
Contraction and Convergence to supply the framework for long term global CO2 reduction, bringing in both developed and developing nations.
All developing nations agree to have carbon capture and storage for all coal fired power stations.
International agreement made on reduction of deforestation. (Lynas, 2007)
NationalBinding national carbon reduction targets lead to year on year steady reduction. (FoE, 2006)
Carbon Cap and Trade system introduced first for organisations and then for individuals.
Entire UK economy covered by an emissions trading scheme by 2020. (FoE, 2006)
Major investment made in tidal, wave and off-shore wind (Lynas, 2007)
Following high targets for renewable energy provision, wind power capacity increased to provide 45% of national electricity demand. (CAT, 2007)
Policy introduced to replace all private vehicles by renewably powered or zero emission vehicles by 2027 (CAT, 2007)
Road building programme converted into public transport expansion programme (Lynas, 2007)
U-turn made on airport expansion (Lynas, 2007)
Standards set for local, sustainable and healthy procurement of food in all public services (SEI, 2007)
LocalAll councils commit to a low carbon future for their communities. (Lynas, 2007)
Grant schemes for energy efficiency measures and/or promotion of their benefits results in 50% reduction in CO2 emissions from households. (SEI, 2007)
Cyclists and pedestrians are given precedence over cars in urban residential areas (Lynas, 2007)
Local authorities phase in a strategy to get all children to school by bus, bike or on foot. (Lynas, 2007)
Congestion charging introduced nationally (Lynas, 2007)
10% fewer cars on the road, with city centres car free. (FoE, 2006)
IndividualSupport of tourist industry in the UK means holidaying at or close to home increases (Lynas, 2007)
Targets set and met for households to supply 40% of the power in the national grid using microgeneration (Lynas, 2007)
Policies to support behavioural change reduces household energy use by 12% (SEI, 2007)
Local shopping and business networks expand, greatly reducing transport related CO2 emissions (Lynas, 2007)
Quality of life is the new status symbol – experience is the new luxury item, leading to more community interactive events and less consumption-related CO2 emissions. (Lynas, 2007)
References:Centre for Alternative Technology, Zero Carbon Britain; June 2007
Friends of the Earth, The Future Starts Here: The Route to a Low-Carbon Economy; 2006Mark Lynas, Eight years and 32 actions to save the planet; The Guardian, June 9th 2007
Stockholm Environment Institute, Towards a low footprint Scotland; March, 2007
00
30
Low Carbon Leadership - A workbook for decision makers, Marches Energy Agency in partnership with Energy Saving Trust

YOUR FIVE YEAR PLANMany climate scientists state that we have to take major steps in CO2 reduction by 2015 to get us on track for significant mitigation and at least 60% reduction by 2050. Big things have to be achieved each year for the next five years.
Activity time 10 minutes – 1 hour
Take a look at your target reduction for the next five years. How are you going to do it? What actions are you going to take? Who is responsible for making it happen?• Based on the work you have done so far, make a note of what technologies are to be installed and how many.• Make a note of how you will encourage this.• Make a note of how you will build up support for more difficult or controversial carbon reduction measures, which may not be installed until enough support is generated.
If you are really struggling at this stage for ideas – seek help. Engage your members, officers and communities. Consult and liaise with neighbouring councils. We are all in this together and the solutions are out there. There is a wealth of experience across the UK.
The Energy Saving Trust Practical Help, Advice and Information service for local authorities can be accessed for free on 0844 84 888 30
00
31
Low Carbon Leadership - A workbook for decision makers, Marches Energy Agency in partnership with Energy Saving Trust

THIS IS IT. Decide what you are going to do on Monday. The first steps to significant CO2 reduction.Jot down ideas for the first steps you will take in the space below.
As one idea for starters, use our example letter on the following page to start telling people about your intention to take great strides forward in combating climate change.
Idea number two: share the responsibility
Idea number three: tell everyone about the plans
Over to you…
“A thousand mile journey starts with just one step”
Chinese proverb
PLANNING WHAT TO DO ON MONDAY
STEP 5 – PLANNING TO MAKE IT HAPPEN
00
32
Low Carbon Leadership - A workbook for decision makers, Marches Energy Agency in partnership with Energy Saving Trust

STEP 6 - SHOUT ABOUT IT!
The final step is to tell people what you’re up to. Sharing your plans is a great way to encourage others that it’s worth joining in. Lead by example and share what you know about saving energy and reducing
carbon emissions whenever you can. Put out press releases, get on the radio, the tv, set up stalls in your town or city centres to get the good news out to your community. There are endless ways to get out there and shout about it. Get started now by using our letter template to write to your community telling them all about the target and plans you’ve made using this book.
Dear Householder,
I m writing to let you know about some of the exciting initiatives that Anytown Council has been putting into place within your community. In response to the now irrefutable evidence for human induced climate change, we are striving towards an ambitious CO2 reduction target of ___% by 2050. In doing this, we are helping to build a bright future for us all. I am also writing to let you know about some of the ways we re offering to help you to get involved in this challenge.
Anytown Council is currently working hard to meet this target in numerous ways, including:• The establishment of a climate change department to co ordinate and advise on our policies, as well as to aid our communities and businesses. • The development of an integrated transport system, making public transport a more viable alternative to car use in our area.• Launching a grant scheme for organisations to invest in low carbon technologies• The provision of a discount scheme to support household insulation and a wide range of energy efficient heating measures
While our target is ambitious, we take it very seriously. We realise that we can only reach this target with your support and would like to ask you to join us in working towards this target. There are so many ways that you can contribute, for example:• Switching to low energy lighting.• Insulating your home.• Walking, cycling or taking public transport whenever possible.• Loads more ideas are available from your local Energy Saving Trust Advice Centre (0800 512 012)
To help you find out more about what we re doing, what you can do to help out and how we can support you in that, we have set up a range of activities and events with a sustainable energy theme:• Anytown Park Green Festival, Sat 1st July.• Greenville and Lowtown Community Centres, workshops and themed talks, Mondays throughout July & August.• Greenville High School, activities throughout July.• A ytow Farmer s Market, I format o o gra ts a d free ow e ergy products every mo th.
More details can be found on our website. With your support, Anytown can make a huge difference to this important issue.
Yours sincerely,
Chief Executive, Anytown Council
“ tell them we’re committed”
“ tell them about the great things we’re doing”
“ tell them what they could do to join in with the challenge”“ tell them how we
are planning to help them find out more about it all”
The Smiths 123 Sunny Street Anytown Greenshire CO2 10W
Anytown Counci 1 Green Street Anytown Greenshire CO2 00o
00
33
Low Carbon Leadership - A workbook for decision makers, Marches Energy Agency in partnership with Energy Saving Trust

Carbon cap and trade: A limit or ‘cap’ on the total amount of carbon dioxide that can be emitted is set by a central authority (usually a government or international body). Emission permits are given out to companies or other groups, who are required to hold an equivalent number of allowances (or credits) representing the right to emit a specific amount. The total amount of allowances and credits cannot exceed the cap, limiting total emissions to that level. Companies that need to increase their emissions must buy credits from those who emit less. The transfer of allowances is referred to as a trade.
CFL: Compact Fluorescent Lamp.
CHP: Combined Heat and Power. Uses the waste heat generated from electricity production for domestic and industrial heating applications.
Contraction and Convergence (C&C): A proposed global framework for reducing greenhouse gas emissions to combat climate change. Conceived by the Global Commons Institute in the early 1990s, the Contraction and Convergence strategy consists of reducing overall emissions of greenhouse gases to a safe level, ‘Contraction’, where the global emissions are reduced because every country brings emissions per capita to a level which is equal for all countries, ‘Convergence’.
GLOSSARY
Dash for gas: Newly privatised energy companies of the 1980s building gas powered stations to reduce their reliance on coal.
Deindustrialisation: Decline in industrial activity in a region or economy.
Eco driving: Eco driving is a style or method of driving that minimises fuel consumption and greenhouse gas emissions. Eco driving involves, for example, accelerating or decelerating slowly, shifting up gears as soon as possible, maintaining correct tyre pressures and removing excess baggage. Eco driving techniques can achieve fuel savings of 5 - 15%.
Greenhouse gas: A gas, such as carbon dioxide, that contributes to the trapping of the sun’s warmth in a planet’s lower atmosphere.
Kilotonne: A kilotonne is one thousand tonnes
LSPs: Local Strategic Partnerships. LSP’s exist in nearly all local authority areas in England and Wales, bringing together representatives from the local statutory, voluntary, community and private sectors to address local problems, allocate funding, and to discuss strategies and initiatives.
Microgeneration: This is the small scale generation of zero or low-carbon heat and power. Technologies include micro wind power, photovoltaic panels, solar thermal systems and ground source heat pumps. Generation on this scale is used by individuals, small businesses and communities to meet their own needs.
Nottingham Declaration on Climate Change: A commitment from local authorities for the reduction of carbon dioxide. The Declaration is available online with an action pack and additional resources on how local authorities can tackle climate change.
www.energysavingtrust.org.uk
00
34
Low Carbon Leadership - A workbook for decision makers, Marches Energy Agency in partnership with Energy Saving Trust

SERVICES FROM ENERGY SAVING TRUST
Energy Saving Trust provides advice and support to householders, communities and local authorities through its programmes and services.
www.energysavingtrust.org.uk
Practical help Information and Advice service offers free sustainable energy advice to local authorities. Access to an online resource library of publications is available to local authorities and housing associations. Numerous free resources such as sustainable energy policy briefing notes and case study examples of energy saving in action are available. Practical help also offers an unlimited enquiries answering service for local authorities and housing associations, with up to 3 hour devoted to researching each enquiry. Local authorities can also request the outreach service of tailor-made presentations, workshops or bespoke events.
The Local authority one-to-one support programme is a two year package of support to help local authorities develop and implement a sustainable energy action plan. Focus is placed on developing a strategic approach to sustainable energy across all services and activities. The support aims to facilitate carbon reductions in the local authority’s community through its role as a key influencer.
For further information call the local authorities helpline on 0844 84 888 30.
The Energy Saving Trust Advice Centres are a network of 21 regional centres providing domestic energy efficiency, renewable energy and sustainable transport advice. They are ideal local delivery partners for promoting sustainable energy to your residents. Funded by EST, the Advice Centres have a long track record of providing home energy efficiency advice and are now developing their services to include advice on wider issues such as water and waste.
This free service is available by calling 0800 512 012.
The Homes Energy Efficiency Database (HEED) has been developed by the Energy Saving Trust on behalf of Government to register the uptake of sustainable energy measures and related survey data throughout the UK housing stock. The database registers these installations on a property-by-property basis with data from a wide variety of sources including energy suppliers, government scheme managing agents, local authorities and other landlords, EEAC home energy checks as well as EST programmes.
The “Community Action for Energy (CAfE)” programme provides advice, support and training to the community / voluntary sector with the aim of facilitating the implementation of community based sustainable energy projects. It also aims to work with energy professionals such as local authority officers to help them work with community groups in their area. All its services are free and include a community helpline, a selection of training courses, up to 1.5 days consultancy for projects under way, travel bursaries and much more.
For further information call the helpline on 08701 261 444.
Green Fleet Reviews
Energy Saving Trust transport advice programme is available to organisations in England and Scotland, and offers practical solutions to help reduce costs and improve the environmental performance of car and van fleets.
Low Carbon Leadership - A workbook for decision makers, Marches Energy Agency in partnership with Energy Saving Trust
00
35
