lost productivity, the high cost of doing nothing dee. w
TRANSCRIPT

University of Michigan Health Management Research CenterUniversity of Michigan Health Management Research Center
Lost Productivity, the High Cost of Lost Productivity, the High Cost of Doing NothingDoing Nothing
THE UNIVERSITY OF MICHIGANHEALTH MANAGEMENT RESEARCH CENTER
THE UNIVERSITY OF MICHIGANHEALTH MANAGEMENT RESEARCH CENTER
Dee. W. Edington

University of Michigan Health Management Research CenterUniversity of Michigan Health Management Research Center
UM-HMRC Corporate
Consortium
UM-HMRC Corporate
ConsortiumBank OneProgressiveWe EnergiesGeneral Motors Crown EquipmentFoote Health SystemMedical Mutual of OhioSt Luke’s Health SystemCuyahoga Community College Blue Cross Blue Shield Rhode IslandUnited Auto Workers-General MotorsWisconsin Education Association TrustSouthwest Michigan Healthcare CoalitionAustralian Health Management Corporation
KelloggGulf Power
Delphi AutomotiveFlorida Power & Light
Affinity Health System
*The consortium members provide health care insurance for over two million Americans. Data are available from eight to 18 years.
Meet on First Wednesday of each December in Ann Arbor

University of Michigan Health Management Research CenterUniversity of Michigan Health Management Research Center
Health Management as a Business Strategy
Along the way, “…someone moved the cheese…”
Health or Economics?
Healthy People or Productive People?
Why are You Here?

University of Michigan Health Management Research CenterUniversity of Michigan Health Management Research Center
New way to do Health and Productivity ManagementIn America and Worldwide
X
Health Action Council

University of Michigan Health Management Research CenterUniversity of Michigan Health Management Research Center
“The Total Value of Healthcare”(Managing health status) To
“The Cost of Healthcare”(Treating disease) To
Moving the Paradigm From
“Health is Free”(Healthcare Costs < Total Benefits)
For Example: Quality, Safety,…

University of Michigan Health Management Research CenterUniversity of Michigan Health Management Research Center
Agenda
Health Management as a Serious Health Management as a Serious Business StrategyBusiness Strategy
Health Action Council: January 26, 2006
1.1. DoDo--Nothing StrategyNothing Strategy
2.2. Key Beliefs Key Beliefs
3.3. Build the Business Case: Business Concepts Build the Business Case: Business Concepts
4.4. How Do We Do It?How Do We Do It?
5.5. SummarySummary

University of Michigan Health Management Research CenterUniversity of Michigan Health Management Research Center
Section I
The Do-Nothing Strategy

University of Michigan Health Management Research CenterUniversity of Michigan Health Management Research Center
The Natural Flow
of Health Risks and Behaviors

University of Michigan Health Management Research CenterUniversity of Michigan Health Management Research Center
Lifestyle Scale for Individuals or for any Population
Lifestyle Scale for Individuals or for any Population
ChronicChronicSigns &Signs &
SymptomsSymptomsFeelingFeeling
OKOKPrematurePrematureDeath/Death/
DisabilityDisability
HighHigh--LevelLevelWellness/Wellness/MaximumMaximum
PerformancePerformance
Edington. Corporate Fitness and Recreation. 2:44, 1983

University of Michigan Health Management Research CenterUniversity of Michigan Health Management Research Center
1640 (35.0%)
4,163 (39.0%)
678(14.4%)
Risk TransitionsTime 1 – Time 2Risk TransitionsTime 1 – Time 2 High Risk
(>4 risks)High RiskHigh Risk(>4 risks)(>4 risks)
Low RiskLow Risk(0 (0 -- 2 risks)2 risks)
Medium RiskMedium Risk(3 (3 -- 4 risks)4 risks)
2,373 (50.6%)
21,750 (77.8%)
4,546(42.6%)
10,670 (24.6%)
4,691 (10.8%)
27,951 (64.5%)
11,495 (26.5%)
5,226 (12.1%)
26,591 (61.4%)
892(3.2%)
1,961 (18.4%)
5,309 (19.0%)
Modified from Edington, AJHP. 15(5):341-349, 2001Mean of three years between measures

University of Michigan Health Management Research CenterUniversity of Michigan Health Management Research Center
The Natural Flow
of Health Care Costs

University of Michigan Health Management Research CenterUniversity of Michigan Health Management Research Center
23,043 (34.0%)
25,856 (20.3%)
6,936(10.2%)
Cost TransitionsTime 1 – Time 2 High Cost
($5000+)High Cost($5000+)
Low CostLow Cost(<$1000)(<$1000)
Medium CostMedium Cost($1000($1000--$4999)$4999)
37,701 (55.7%)
119,271 (74.1%)
75,500(59.1%)
127,644 (35.8%)
67,680 (19.0%)
160,951 (45.2%)
130,785 (36.7%)
73,427 (20.6%)
152,063 (42.7%)
9,4389,438(5.9%)(5.9%)
26,288 26,288 (20.6%)(20.6%)
32,242 (20.0%)32,242 (20.0%)
N=356,275 Non-Medicare Trad/PPO
Modified from Edington, AJHP. 15(5):341-349, 2001

University of Michigan Health Management Research CenterUniversity of Michigan Health Management Research Center
Total Medical and Pharmacy Costs Total Medical and Pharmacy Costs Paid by Quarter for Three GroupsPaid by Quarter for Three Groups
0
1000
2000
3000
4000
5000
6000
7000
8000
9000
Q_12 Q_10 Q_8 Q_6 Q_4 Q_2 Q0 Q2 Q4 Q6 Q8 Q10 Q12
Serious disease
Minor Disease
No Disease
Musich,Schultz,Burton,Edington. DM&HO. 12(5):299-326, 2004
University of Michigan Health Management Research CenterUniversity of Michigan Health Management Research Center
Are We Willing to Accept the
Consequences of the
Do-Nothing Strategy?

University of Michigan Health Management Research CenterUniversity of Michigan Health Management Research Center
Section II
Key Beliefs if One is to Invest in
Health Management as a
Serious Business Strategy

University of Michigan Health Management Research CenterUniversity of Michigan Health Management Research Center
Three Key Business Beliefs
1. Individuals Can Maintain Low-Risk Health Status even as they Age
2. A Health Plan and an Employer can Help its Members Maintain Low-Risk Health Status
3. The Major Economic Benefit is in Paying Attention to Individuals with Low-Risk Health Status

University of Michigan Health Management Research CenterUniversity of Michigan Health Management Research Center
Section III
Key Business Concepts
To Build the Business Case for
Successful Health and Productivity Management Programs

University of Michigan Health Management Research CenterUniversity of Michigan Health Management Research Center
Business Concept
The Risks-Costs-Disease
Relationship

University of Michigan Health Management Research CenterUniversity of Michigan Health Management Research Center
$2,098
$4,530
$5,813$7,123
$4,401
$3,216
$1,550$2,667
$3,364
$4,718
$3,069$2,480
$1,351 $2,110
$2,912
$3,894
$2,605 $2,200
$1,122$1,523 $2,081
$2,941$1,851 $1,641
$0$1,000$2,000$3,000$4,000$5,000$6,000$7,000
19-34 35-44 45-54 55-64 65-74 75+
Costs Associated with RisksAssociated with RisksMedical Paid Medical Paid Amount x Age x Riskx Age x Risk
Low Risk
Medium RiskHigh Risk
Non--Participant
Edington. AJHP. 15(5):341-349, 2001

University of Michigan Health Management Research CenterUniversity of Michigan Health Management Research Center
3.10%5.30%
8.30%
15.80%
2.70%4.10%
6.00%
10.30%
1.60% 2.50%
5.70%
8.90%
0.0%
5.0%
10.0%
15.0%
20.0%
Less than25
25-29.9 30-34.9 35+Low RiskLow Risk
Self-Reported Diabetes Associated with Levels of Body Mass Index
Percent with Percent with DiabetesDiabetes
Med RiskMed Risk
BMI LevelsBMI Levels
HighHigh
Musich, Lu, McDonald, Champagne, Edington. AJHP. 18(3): 264-268, 2004

University of Michigan Health Management Research CenterUniversity of Michigan Health Management Research Center
Business Concept
Risks Travel in Clusters

University of Michigan Health Management Research CenterUniversity of Michigan Health Management Research Center
% in Overall High RiskCategory (N-16,879)
68%52%50%48%45%43%41%40%38%36%34%30%
Health Measure(among those at high risk)
Perceived healthLife SatisfactionStressDiastolic blood pressureAlcoholSystolic blood pressurePhysical activitySafety beltSmokingCholesterolHDLBMI
Likelihood of Association with Other RisksLikelihood of Association with Other Risks
Percentages show those at high risk
for a particular health measure
who have at least four other health
risks.
Population = 16,879 LifeSteps active
screened participants
Braunstein, Yi, Hirschland, McDonald, Edington. Am. J. Health Behavior.25(4):407-417. 2001

University of Michigan Health Management Research CenterUniversity of Michigan Health Management Research Center
Cluster AnalysisHealth Measure
SmokingAlcoholPhysical activitySafety belt usageBody mass indexSystolic blood pressureDiastolic blood pressureCholesterolHDL cholesterolSelf-perceived healthLife satisfactionStressIllness days
Cluster 1:Risk taking(N=6688)
Overall RisksLow risk (0-2 risks)Medium risk (3-4 risks)High risk (5+ risks)Average Number of risks
50.2%35.7%14.1%
2.8
97.6%2.4%
00.6
26.5%48.9%24.7%
3.6
18.9%35.9%45.2%
4.4
31%10%28%36%27%9%5%19%34%13%4%9%21%
0%0%0 %0 %25 %0 %0 %19 %10 %0 %0 %0 %0 %
16%3%19%22%38%81%61%27%33%9%2%2%12%
27%5%26%31%27%23%20%22%24%28%73%76%26%
Cluster 2:Low Risk(N=3164)
Cluster 3:Biometrics(N=3100)
Cluster 4:Psychological
(N=3927)
Baunstein, Yi, Hirschland, McDonald, Edington. Am. J. Health Behavior. 25(4):407-417, 2001

University of Michigan Health Management Research CenterUniversity of Michigan Health Management Research Center
Business Concept
Relationships of Risks and Disease
with
Measures of Productivity

University of Michigan Health Management Research CenterUniversity of Michigan Health Management Research Center
Relative Costs of Poor Health: Total
Value of Health
Presenteeism AbsenteeismAbsenteeismSTDLTD
Direct Costs:Medical & Pharmacy
Indirect Costs:
Edington, Burton. A Practical Approach to Occupational and Environmental Medicine (McCunney). 140-152. 2003

University of Michigan Health Management Research CenterUniversity of Michigan Health Management Research Center
Same Risk and Behavior Factors
Drive
All the Outcome Measures
University of Michigan Health Management Research CenterUniversity of Michigan Health Management Research Center
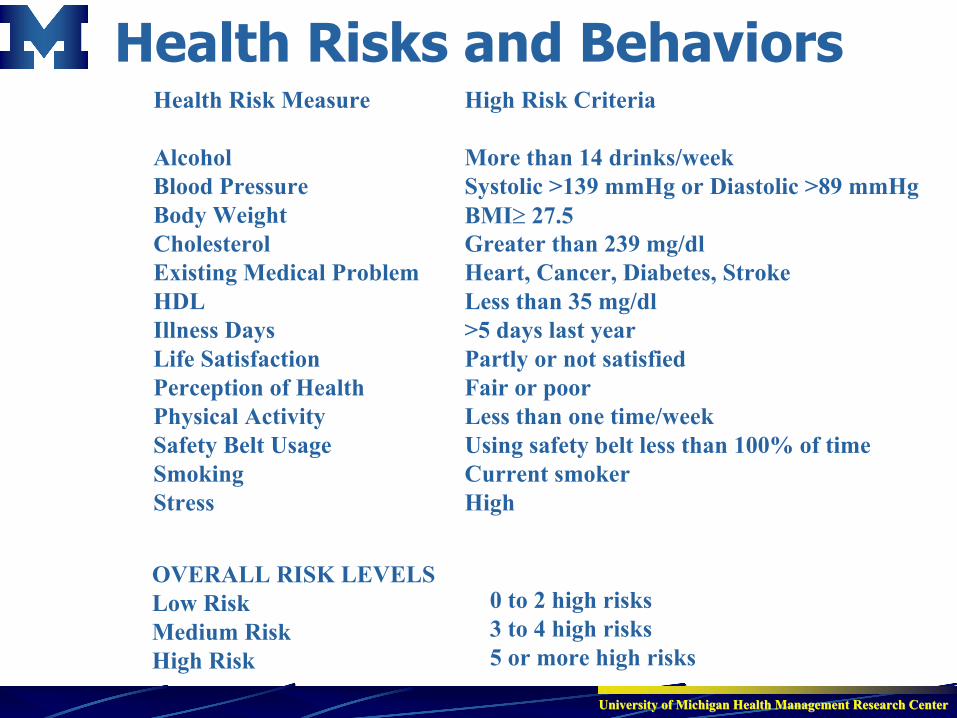
Health Risks and BehaviorsHealth Risk Measure
AlcoholBlood PressureBody WeightCholesterolExisting Medical ProblemHDLIllness DaysLife SatisfactionPerception of HealthPhysical ActivitySafety Belt UsageSmoking Stress
High Risk Criteria
More than 14 drinks/weekSystolic >139 mmHg or Diastolic >89 mmHgBMI≥ 27.5Greater than 239 mg/dlHeart, Cancer, Diabetes, StrokeLess than 35 mg/dl>5 days last yearPartly or not satisfiedFair or poorLess than one time/weekUsing safety belt less than 100% of timeCurrent smokerHigh
OVERALL RISK LEVELSLow RiskMedium RiskHigh Risk
0 to 2 high risks3 to 4 high risks5 or more high risks

University of Michigan Health Management Research CenterUniversity of Michigan Health Management Research Center
$1,157
$1,278
$1,336
$1,418
$1,460
$1,592
$1,593
$1,607
$1,750
$1,756
$1,817
$2,416
$2,557
$3,434
$5,145
$691
$1,428
$1,473
$1,434
$1,421
$1,415
$1,374
$1,416
$1,310
$1,144
$1,277
$1,318
$1,228
$1,234
$1,303
$1,129
$0 $1,000 $2,000 $3,000 $4,000 $5,000 $6,000
Zero Risks
Alcohol Drinks >14 weekly*
Safety Belt Usage <100%
Current Smoker
Cholesterol>239
Job partly or not satisfied
Life partly or not satisfied
Health Age
Stress (high)
20% or more overweight*
Physical Activity <1x/week*
Physical Health (fair or poor)
High BP (SBP >139, DBP >89)*
Use Medication/Drugs*
Existing Medical Problem*
Illness Days >6/yr*
Low RiskHigh Risk
Medical/Drug Cost Comparison by Risk Status
*p<.05.
Yen, Witting, Edington. AJHP. 6:46-54, 1991
University of Michigan Health Management Research CenterUniversity of Michigan Health Management Research Center
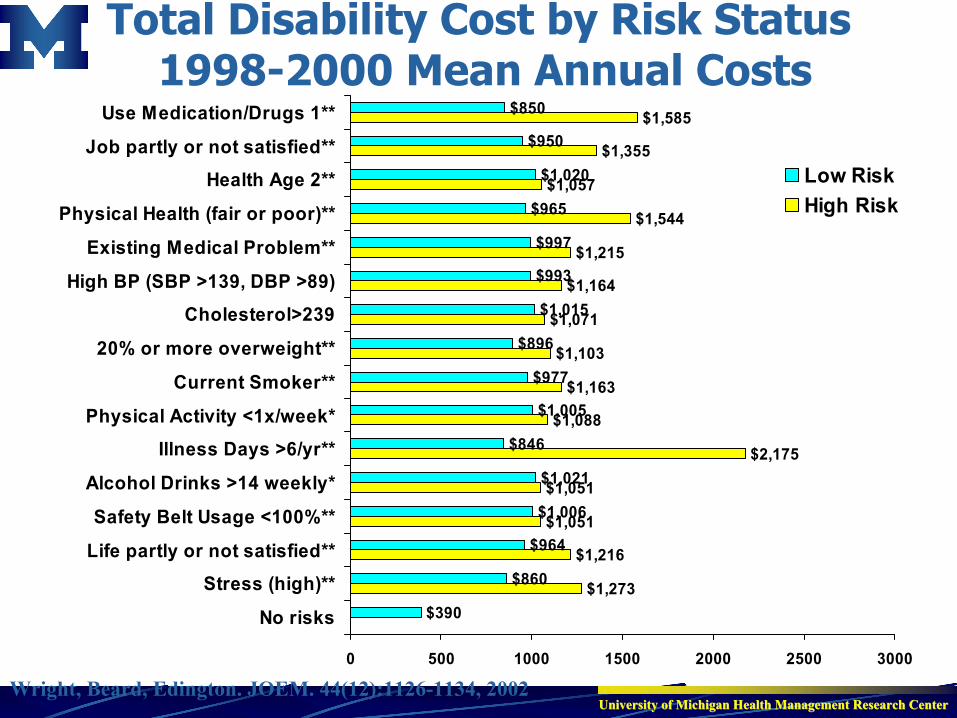
Total Disability Cost by Risk Status1998-2000 Mean Annual Costs
Wright, Beard, Edington. JOEM. 44(12):1126-1134, 2002
$1,273
$1,216
$1,051
$1,051
$2,175
$1,088
$1,163
$1,103
$1,071
$1,164
$1,215
$1,544
$1,057
$1,355
$1,585
$390
$860
$964
$1,006
$1,021
$846
$1,005
$977
$896
$1,015
$993
$997
$965
$1,020
$950
$850
0 500 1000 1500 2000 2500 3000
No risks
Stress (high)**
Life partly or not satisfied**
Safety Belt Usage <100%**
Alcohol Drinks >14 weekly*
Illness Days >6/yr**
Physical Activity <1x/week*
Current Smoker**
20% or more overweight**
Cholesterol>239
High BP (SBP >139, DBP >89)
Existing Medical Problem**
Physical Health (fair or poor)**
Health Age 2**
Job partly or not satisfied**
Use Medication/Drugs 1**
Low RiskHigh Risk
University of Michigan Health Management Research CenterUniversity of Michigan Health Management Research Center
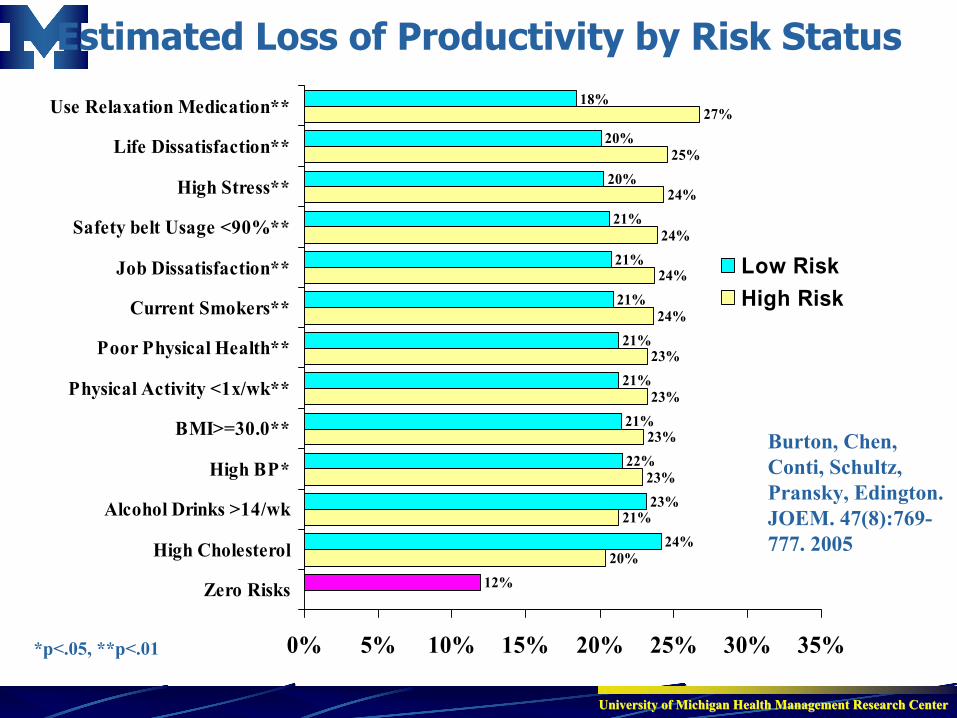
20%
21%
23%
23%
23%
23%
24%
24%
24%
24%
25%
27%
23%
22%
21%
21%
21%
21%
21%
21%
20%
20%
18%
24%
12%
0% 5% 10% 15% 20% 25% 30% 35%
Zero Risks
High Cholesterol
Alcohol Drinks >14/wk
High BP*
BMI>=30.0**
Physical Activity <1x/wk**
Poor Physical Health**
Current Smokers**
Job Dissatisfaction**
Safety belt Usage <90%**
High Stress**
Life Dissatisfaction**
Use Relaxation Medication**
Low RiskHigh Risk
Estimated Loss of Productivity by Risk Status
*p<.05, **p<.01
Burton, Chen, Conti, Schultz, Pransky, Edington. JOEM. 47(8):769-777. 2005

University of Michigan Health Management Research CenterUniversity of Michigan Health Management Research Center
Business Concept
Excess Costs follow Excess Risks

University of Michigan Health Management Research CenterUniversity of Michigan Health Management Research Center
$840 $1,261
$3,321
$0
$1,000
$2,000
$3,000
$4,000
$5,000
$6,000
Low Risk (0-2Risks)
HRA Non-Participant
Medium Risk(3-4 Risks)
High Risk (5+Risks)
Excess CostsBase Cost
Excess Medical Costs due to Excess Risks
$2,199
$3,039$3,460
$5,520
Edington, AJHP. 15(5):341-349, 2001

University of Michigan Health Management Research CenterUniversity of Michigan Health Management Research Center
$175 $292
$757
$0
$500
$1,000
$1,500
Low Risk (0-2Risks) N=685
HRA Non-Participant
N=4,649
Medium Risk(3-4 Risks) N-
520
High Risk (5+Risks) N=366
Excess CostsBase Cost
Excess Disability Costs due to Excess Risks
$491$666
$783
$1,248
Wright, Beard, Edington. JOEM. 44(12):1126-1134, 2002
36% of Absence, STD, Worker’s Comp
University of Michigan Health Management Research CenterUniversity of Michigan Health Management Research Center
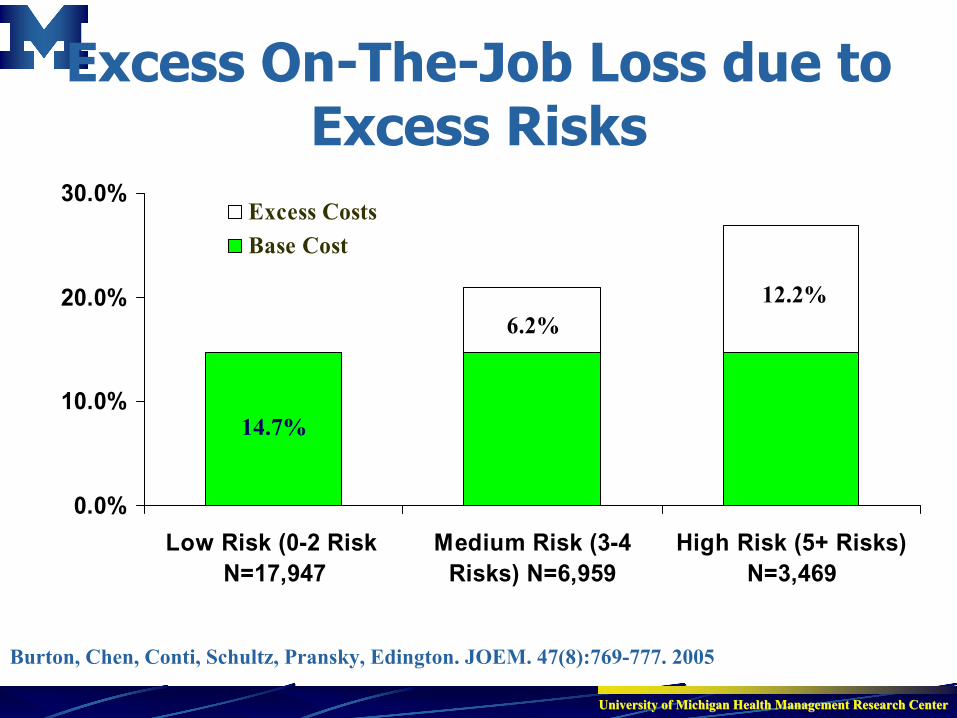
6.2%12.2%
0.0%
10.0%
20.0%
30.0%
Low Risk (0-2 Risk N=17,947
Medium Risk (3-4Risks) N=6,959
High Risk (5+ Risks)N=3,469
Excess CostsBase Cost
Excess On-The-Job Loss due to Excess Risks
Burton, Chen, Conti, Schultz, Pransky, Edington. JOEM. 47(8):769-777. 2005
14.7%

University of Michigan Health Management Research CenterUniversity of Michigan Health Management Research Center
Business Concept
Stratification of the Population
for Intervention

University of Michigan Health Management Research CenterUniversity of Michigan Health Management Research Center
Stratification In the Health Promotion Stratification In the Health Promotion OpportunityOpportunity
0
1000
2000
3000
4000
5000
6000
7000
8000
9000
Q_12 Q_10 Q_8 Q_6 Q_4 Q_2 Q0 Q2 Q4 Q6 Q8 Q10 Q12
Serious disease
Minor Disease
No Disease
Health Promotion Opportunity

University of Michigan Health Management Research CenterUniversity of Michigan Health Management Research Center
Predictability to be at High Cost
0.100.07
0.08
0.140.18 0.18
0.19
0.75
0.83
0.79
0.64
0.570.54
0.52
0
0.1
0.2
0.3
0.4
0.5
0.6
0.7
0.8
0.9
base t1 t2 t3 t4 t5 t6
Time
%Low intervention (71%)High Intervention (29%)
Sp=(1-0.10)=0.90Sp=(1-0.07)=0.93
Sp=(1-0.08)=0.92
Sp=(1-0.14)=0.86
Se=0.75
Se=0.83
Se=0.79
Se=SensitivitySp=Specificity

University of Michigan Health Management Research CenterUniversity of Michigan Health Management Research Center
Business Concept
Change in Costs
follow
Change in Risks

University of Michigan Health Management Research CenterUniversity of Michigan Health Management Research Center
Change in Costs follow Change in Risks
-$600
-$400
-$200
$0
$200
$400
$600
3 2 1 0 1 2 3Cos
t red
uced
Cos
t inc
reas
ed
Risks Reduced Risks Increased
Updated from Edington, AJHP. 15(5):341-349, 2001.
Overall: Cost per risk reduced: $215; Cost per risk avoided: $304 Actives: Cost per risk reduced: $231; Cost per risk avoided: $320 Retirees<65: Cost per risk reduced: $192; Cost per risk avoided: $621 Retirees>65: Cost per risk reduced: $214; Cost per risk avoided: $264

University of Michigan Health Management Research CenterUniversity of Michigan Health Management Research Center
Change in Productivity Loss follows Change in Risks
-6.0%-5.0%-4.0%-3.0%-2.0%-1.0%0.0%1.0%2.0%
2 1 0 1 2
Perc
ent r
educ
edpe
rcen
t inc
reas
ed
Risks Reduced Risks Increased
Burton, Chen, Schultz, Edington JOEM. In-Press 2006

University of Michigan Health Management Research CenterUniversity of Michigan Health Management Research Center
0%
50%
100%
150%
200%
250%
0 1 2 3 4 5 6 7 8 9 10
Cost Savings Associated with Program Involvement from 1985 to 1995
Programming Year
Zero or One HRA (N=804)Two or More HRAs (N=522)
Annual Increase = 12.6%
Annual Increase = 4.2%

University of Michigan Health Management Research CenterUniversity of Michigan Health Management Research Center
Yearly Average Disability Absence Yearly Average Disability Absence Days by ParticipationDays by Participation
Pre-Program Program Years
$200Work Day X
1.2 Work DaysParticipant
YearX 2,596 participants = $623,040
Year
The average annual increase in absence days (1995 – 2000):
Participants: 2.4
Non-Participants: 3.6
Schultz, Musich, McDonald,Hirschland,Edington.JOEM 44(8):776-780, 2002
6.6 6.98.7
14.1
6.6
17.215.7
23.321.2
17.6
128.8
0
5
10
15
20
25
95 96 97 98 99 0
ParticipantNon-Participant

University of Michigan Health Management Research CenterUniversity of Michigan Health Management Research Center
Medical and Drug Cost (Paid)*
$1,500
$2,000
$2,500
$3,000
$3,500
$4,000
2001 2002 2003 2004
Year
Paid Non-Impr
Improved
*per employee , Improved=374, Non-Improv=103HRA in 2002 and 2004Improved=Same or lowered risks*Medical and Drug, not adjusted for inflation
Slopes differ
P=0.0132
Impr slope=$117/yr
Nimpr slope=$614/yr

University of Michigan Health Management Research CenterUniversity of Michigan Health Management Research Center
Section IV
How To Do It

University of Michigan Health Management Research CenterUniversity of Michigan Health Management Research Center
Where are the Opportunities for Where are the Opportunities for Population Health Management?Population Health Management?
0
1000
2000
3000
4000
5000
6000
7000
8000
9000
Q_12 Q_10 Q_8 Q_6 Q_4 Q_2 Q0 Q2 Q4 Q6 Q8 Q10 Q12
Serious disease
Minor Disease
No Disease
Health Promotion Opportunity
Disease Management Opportunity
Medical & Care Management Opportunity
Medical and Drug Costs only

University of Michigan Health Management Research CenterUniversity of Michigan Health Management Research Center
Implementation: Health Management as a Serious Corporate Strategy
A. Driven from the top through leadership performance objectives and healthy work environment objectives
B. Driven by employee participation in health risk assessments to identify areas that are critical to decreasing vitality in the family and at work. Resources made available in low-risk maintenance and risk reduction opportunities, with incentives
C. Measurement of key indicators
A. 80% participation over any three-year period
B. 70% low-risk
Members or Employees

University of Michigan Health Management Research CenterUniversity of Michigan Health Management Research Center
Health Management as a Serious Business Strategy: Four Levels of Interventions
Worksite Environment Values and BeliefsWorkplace Policies
Benefit Design
Population
Website Health PoliciesSpecial Promotions Employee Assistance Risk Reduction ActivitiesLow-Risk Maintenance
Know Your Numbers Physical ActivityNutrition Awareness
Medical Facility
Individual(Stratification by
Individual)
Coaching SessionsLow-Risk MaintenanceDisease Management High-Risk Reduction
Health AdvocateTriage to Resources
Health Risk Appraisals
Incentives
Measurement

University of Michigan Health Management Research CenterUniversity of Michigan Health Management Research Center
Total Health Total Health & &
ProductivityProductivityManagementManagement
Create an Integrated and Sustainable Approach
On-site Medical• Diabetes education pilot• Injury and medical management
Health Advocate• Provide Direction• Get the Care You Need• Coaching & Outreach
Health Plan DesignEnvironmental Design
Behavioral Health• Work/Family•Work Life Plus
Health Portal• Stay healthy• Health information• Make informed choices
Health Risk Assessment• Assess and track health behaviors• Maintain health• Address health risks
Fitness Centers• Low risk maintenance• High risk reduction
Wellness Programs• Active expansion• Retiree communications/awareness program
Disease Management• High Acuity (identified high cost disease)
• Low Acuity (identified lower cost disease; lifestyle behavior focus)
Case Management
• STD, LTD• Workers’ Compensation• Scattered Absence
Absence Management
Long Term Strategy—Short Term Solutions

University of Michigan Health Management Research CenterUniversity of Michigan Health Management Research Center
Section V
Summary

University of Michigan Health Management Research CenterUniversity of Michigan Health Management Research Center
2. Success metric 1: Percent Participation (80%,60%,40%)
3. Success metric 2: Percent of the Population at Low Risk (70+%)
4. Effective strategies: Low-Risk Maintenance and Risk Reduction
5. General concept for outcome measures: Benefits follow #2 and #3
Corporate Health Management Programs as a Serious Economic
Strategy: Learnings
6. Specific to outcome measures: Effective Programs Equal Benefits
1. Risk and Disease Identification: Know your target population
Overall Strategy: Manage the Person, not the risk or the disease.

University of Michigan Health Management Research CenterUniversity of Michigan Health Management Research Center
Thank you for your attention.Please contact us if you have any questions.
Phone: (734) 763 — 2462Fax: (734) 763 — 2206
Email: [email protected]
Website: www.hmrc.umich.edu
Phone: (734) 763 — 2462Fax: (734) 763 — 2206
Email: [email protected]
Website: www.hmrc.umich.eduDee W. Edington, Ph.D. , Director Health Management Research Center University of Michigan 1027 E. Huron St. Ann Arbor MI 48104-1688