loretta j. mester federal reserve bank of cleveland … · market discipline working for and...
TRANSCRIPT

MARKETDISCIPLINEWORKINGFORANDAGAINSTFINANCIALSTABILITY:THETWOFACESOFEQUITYCAPITALINU.S.COMMERCIALBANKING
JOSEPHP.HUGHESRUTGERSUNIVERSITY
LORETTAJ.MESTERFEDERALRESERVEBANKOFCLEVELAND
ANDTHEWHARTONSCHOOL,UNIVERSITYOFPENNSYLVANIA
CHOON‐GEOLMOONHANYANGUNIVERSITY
DECEMBER2016
Abstract ThesecondBaselCapitalAccordpointstomarketdisciplineasatooltoreinforcecapitalstandardsandsupervisioninpromotingbanksafetyandsoundness.TheBankforInternationalSettlementscontendsthatmarketdisciplineimposesstrongincentivesonbankstooperateinasafeandefficientmanner–inparticular,tomaintainanadequatecapitalbasetoabsorbpotentiallossesfromtheirriskexposures.
Using2007and2013dataontop‐tier,publiclytradedU.S.bankholdingcompanies,wefindthatmarketdisciplinerewardsrisk‐takingatsomeofthelargestU.S.financialinstitutions.Inparticular,wefindevidenceoftwofacesofequityinvestment–dichotomouscapitalstrategiesformaximizingvalue.Atbankswithhigher‐valuedinvestmentopportunities,amarginalincreaseintheirequitycapitalratioisassociatedwithbetterfinancialperformance,whileatbankswithlower‐valuedinvestmentopportunities,amarginaldecreaseintheirequitycapitalratioisassociatedwithbetterfinancialperformance.BecausethelargestU.S.financialinstitutionstendtohavelower‐valuedinvestmentopportunities,ourresultssuggestthattheymayhaveamarket‐basedincentivetoreducetheircapitalratio.Totheextentthatmarketdisciplinerewardsreducingthecapitalratioamongthelargestbanks,itwouldtendtounderminefinancialstability.Ourresultssupporttheneedforregulatorycapitalrequirements.
*TheviewsexpressedinthispaperdonotnecessarilyreflectthoseoftheFederalReserveBankofClevelandortheFederalReserveSystem.HughesthankstheWhitcombCenterforResearchinFinancialServicesattheRutgersBusinessSchoolforitssupportofdataservicesusedinthisresearch.
CorrespondencetoHughesatDepartmentofEconomics,RutgersUniversity,NewBrunswick,NJ08901‐1248;[email protected],ExecutiveOffice,FederalReserveBankofCleveland,P.O.Box6387,Cleveland,OH44101‐1387;Loretta.Mester@clev.frb.org.ToMoonatDepartmentofEconomicsandFinance,CollegeofEconomicsandFinance,HanyangUniversity,Seoul133‐791,Korea;[email protected]. JEL Codes: C58, G21, G28. Key Words: banking, efficiency, capital structure, charter value

1
MARKETDISCIPLINEWORKINGFORANDAGAINSTFINANCIALSTABILITY:THETWOFACESOFEQUITYCAPITALINU.S.COMMERCIALBANKING
Introduction
ThesecondBaselCapitalAccordrestsonthreecomplementarypillars.TheBankfor
InternationalSettlementsdescribesthethirdpillar:1“Pillar3recognisesthatmarketdisciplinehas
thepotentialtoreinforceminimumcapitalstandards(Pillar1)andthesupervisoryreviewprocess
(Pillar2),andsopromotesafetyandsoundnessinbanksandfinancialsystems.Marketdiscipline
imposesstrongincentivesonbankstoconducttheirbusinessinasafe,soundandefficientmanner,
includinganincentivetomaintainastrongcapitalbaseasacushionagainstpotentialfuturelosses
arisingfromriskexposures.”
Consistentwiththisview,beforethefinancialcrisis,formerFederalReserveBoard
ChairmanAlanGreenspanalsoplacedemphasisonmarketdisciplineasasourceoffinancial
stability:“Exceptwheremarketdisciplineisunderminedbymoralhazard,forexample,becauseof
federalguaranteesofprivatedebt,privateregulationgenerallyhasprovedfarbetterat
constrainingexcessiverisk‐takingthanhasgovernmentregulation.”2Laterheexpressedsurprise
thatmarketdisciplinedidnotrestrainrisk‐takingatthelargestfinancialinstitutions:“...thoseof
uswhohavelookedtotheself‐interestoflendinginstitutionstoprotectshareholders’equity
(myselfespecially)areinastateofshockeddisbelief.”3
Atleastonebankerhassuggestedthatmarketforcesdonotnecessarilyleadtolessrisk‐
taking.CharlesPrince,thenCEOandchairmanofCitigroup,famouslyobserved,“Whenthemusic
1SeeBankforInternationalSettlements(2001),p.1.
2Greenspan(2005).
3Greenspan(2008).

2
stops,intermsofliquidity,thingswillbecomplicated.Butaslongasthemusicisplaying,you'vegot
togetupanddance.We'restilldancing.”4
Inthispaperweinvestigatetheroleofmarketdisciplineinbanks’risk‐taking,inparticular,
therelationshipbetweenequitycapitallevelsandbankfinancialperformance.Weapplythe
measurementsandtechniquesdevelopedbyHughes,Lang,Moon,andPagano(1997)and
describedinHughes,Lang,Mester,Moon,andPagano(2003)andmorerecentlyinHughes,Mester,
andMoon(2016),to2007and2013dataontop‐tier,publiclytradedU.S.bankholdingcompanies.
Wefindevidencesuggestingthatmarketdisciplinerewardsrisk‐takingatsomeofthelargestU.S.
financialinstitutions.Inparticular,wefindevidenceoftwofacesofequityinvestment–
dichotomouscapitalstrategiesformaximizingvalue.Atbankswithhigher‐valuedinvestment
opportunities,onthemarginanincreaseintheirequitycapitalratioisassociatedwithbetter
financialperformance,whileatbankswithlower‐valuedinvestmentopportunities,amarginal
decreaseintheirequitycapitalratioisassociatedwithbetterfinancialperformance.
BecausethelargestU.S.financialinstitutionstendtohavelower‐valuedinvestment
opportunities,ourresultssuggestthattheymayhaveamarket‐basedincentivetoreducetheir
capitalratio.Totheextentthatmarketdisciplinerewardsreducingthecapitalratioamongthe
largestbanks,itwouldtendtounderminefinancialstability.Ourresultssupporttheneedfor
regulatorycapitalrequirements.Theyarealsoconsistentwithotherpapersintheliteraturethat
suggestthatmarketdisciplinemayhaveactuallyencouragedrisk‐takingatlargefinancial
institutionsleadinguptothecrisis.Forexample,LaevenandLevine(2009)examinedthelargest
banksinanumberofcountriesandconcludedthatlarge,diversifiedshareholdersatthesebanks
generallypreferriskierinvestmentstrategiesthanmanagers,andthattheyexercisesufficient
corporatepowertoeffecttheriskierstrategies.
4Prince,asquotedbyNakamotoandWighton(2007).

3
Therestofthepaperisorganizedasfollows.SectionIreviewstheliteratureoncapital
strategies.SectionIIdescribesthetwomeasuresoffinancialperformancethatweuseto
investigatetheroleofequitycapitalinthefinancialperformanceofU.S.commercialbanks.
SectionIIIpresentsameasureofthevalueofbanks’investmentopportunities.SectionIVdiscusses
thedata.SectionVpresentsourresults,andSectionVIconcludes.
I.LiteratureReview
Marcus(1984)investigatesthedifferentrisk‐takingincentivesofbankswithhigh‐valued
investmentopportunitiesversusthosewithlow‐valuedopportunities.Heshowsthatvalue
maximizationforbankswithlow‐valuedinvestmentopportunitiesinvolvestakingmoreriskto
exploittheoptionvalueofexplicitandimplicitdepositinsurance,while,forbankswithhigh‐valued
opportunities,valuemaximizationentailslessriskyinvestmentstrategiestoprotecttheircharters.
Entryintobankingrequiresacharterissuedbyaregulatoryauthority.Restrictionsonbankentry
createmarketpower,whichmakesvaluableinvestmentopportunitiesevenmorevaluable.In
contrast,competitivemarketstendtounderminechartervalue.5Inthecaseofbankswithhigh‐
valuedopportunities,totheextentthatmarketdisciplineencouragesmanagerstoadoptvalue‐
maximizinginvestmentstrategies,thesestrategiesentaillessrisk‐takingandsopromotefinancial
stability,while,inthecaseofbankswithlow‐valuedopportunities,marketdisciplinewould
encouragemorerisk‐takingandwouldtendtoworkagainstfinancialstability.
Acontrastingincentivethatencouragesrisk‐takingresultsfrommispriceddeposit
insurance.Thegenerallackofrisk‐pricingandtheimplicitinsuranceobtainedfromthetoo‐big‐to‐
faildoctrineweakenthelinkbetweenthecostofborrowedfundsandtheriskinessofinvestment
strategies.Thus,thecostoffundsdoesnotrespondfullytomoreriskyinvestmentstrategieswith
higherexpectedreturns.Forbanksoperatinginmorecompetitivemarketsandinmarketswith
5Keeley(1990)findsevidencethatincreasingcompetitioninU.S.bankingmarketsduringthe1980serodedchartervalueandledtoincreasingfinancialleverage.

4
lessvaluableinvestmentopportunities,smallerexpectedbankruptcycostsmakemorerisky
investmentstrategiesthatexploittheoptionvalueofdepositinsuranceandthetoo‐big‐to‐fail
doctrinevaluemaximizing.
Using1994dataonU.S.bankholdingcompanies,Hughes,Lang,Moon,andPagano(1997)
findevidenceofthesedichotomousinvestmentstrategies.Keeley(1990)considerstheperiod
duringwhichinterstatebranchingregulationswereliberalized,whichincreasedcompetition
amongbanksandreducedtheirchartervalues.Helinksthedeclineinchartervalueswith
increasedfinancialleverageinU.S.banking.Grossman(1992)considerstheperiodafterthe
passageofdepositinsuranceforU.S.thriftsin1934andfindsevidencethatinsuredthriftsadopted
moreriskyinvestmentstrategiesthanuninsuredthrifts.
CalomirisandNissim(2007)regresstheratioofthemarketvalueofequitytoitsbookvalue
onvariablescharacterizingbanks’investmentstrategiesandfindthatthemarket‐to‐bookequity
ratioisnegativelyrelatedtocapitalforbankswithlowercapitalratiosandpositivelyrelatedfor
bankswithhighercapitalratios.Thus,bankswithalowercapitalratioappeartobe
overcapitalized,whilethosewithahighercapitalratio,undercapitalized.DeJongheandVander
Vennet(2005)usethenoise‐adjustedmeasureofTobin’sqratiotomeasureperformanceandfind
anonmonotonicrelationshipofmarketvalueandthebook‐valueratioofequitycapitaltoassets–a
relationshipqualitativelythesameastheonefoundbyCalomirisandNissim(2007).
McConnellandServaes(1995)proposeahypothesisfornonfinancialfirmsthatyields
implicationssimilartoMarcus(1984).Firmswithhigh‐valuedinvestmentopportunitiesforwhich
theunderinvestmentproblemisparticularlyacutemaximizevaluebyemployinglessfinancial
leverage.Ontheotherhand,firmswithlow‐valuedinvestmentopportunitiesforwhich
overinvestmentfromfreecashflowreducesvaluemaximizevaluebyusingmorefinancialleverage

5
toputperformancepressureonmanagers.Theauthorsrefertothesedichotomousstrategiesas
the“twofacesofdebt.”
II.MeasuringFinancialPerformance6
Unlikeaccounting‐basedmeasuresofperformancethatgaugecurrentandpast
performance,afirm’smarketvalueprovidesthemarket’sexpectationofthefirm’scurrentand
futurecashflowsdiscountedataratethatreflectsthemarket’sassessmentofthefirm’sexposure
tomarket‐pricedrisk.AsinHughes,Mester,andMoon(2016),wemeasurebanks’performanceby
themarketvalueoftheirassetsandbythedifferencebetweentheirbest‐practicemarketvalueof
assetsandtheirachievedmarketvalue,adjustedtoeliminatestatisticalnoise.Whilemarketvalue
iscorrelatedwithagencyproblems,thedifferencebetweenpotentialandrealizedmarketvalue–
lostmarketvalue–moredirectlygaugestheextentofagencyproblems.
Thebest‐practicemarketvalueofassetsisobtainedfromtheestimationofastochastic
frontier–anupperenvelopeofmarketvalueasafunctionofthebook‐valueinvestmentinassets–
forpubliclytraded,top‐tierU.S.bankholdingcompanies.Thefrontieranswersthequestion:what
isthebest‐practicemarketvalueofassetsobservedforanygivenbook‐valueinvestmentinassets?7
Theeliminationofstatisticalnoisefromthedifferencebetweenthebest‐practiceandobserved
marketvaluesmeansthatthislostmarketvaluerepresentssystematicunderperformance.We
normalizethelostmarketvaluebythebest‐practicevaluesothatitisameasureofthemarket‐
valueinefficiencyratio.Asameasureofsystematicunderperformance,market‐valueinefficiency
6ThissectionfollowstheoriginalexpositionofHughes,Lang,Moon,andPagano(1997),whichisrestatedmorerecentlyinHughes,Mester,andMoon(2016)andHughes,Jagtiani,andMester(2016).
7ThistechniqueofmeasuringperformancewasproposedbyHughes,Lang,Moon,andPagano(1997)andwasusedbyHughes,Lang,Mester,andMoon(1999)tostudybankconsolidation;byHughes,Lang,Mester,Moon,andPagano(2003)tostudybankassetsalesandacquisitions;andbyHughes,Mester,andMoon(2001)andHughesandMester(2013b)toevaluatebankscaleeconomiesmeasuredalonganexpansionofbankoutputthatmaximizesthebank’svalue.Note,thatthispathisnotgenerallyequivalenttothepaththatminimizesthebank’scost.SeeHughesandMester(2013a,2013b)forfurtherdiscussion.

6
capturessuchmanagerialphenomenaassub‐parinvestmentstrategies,perquisiteconsumption,
takingtoolittleortoomuchrisktoenhancecontrol,nepotism,prejudicialdiscrimination,andsub‐
parlocationaldecisions.Whilethemarketvalueofassetsnormalizedbythebookvalue,a
commonlyusedproxyforTobin’sq,measuresachievedperformance,themarket‐valueinefficiency
ratiogaugestheshortfallbetweenbest‐practiceandachievedperformanceand,assuch,measures
theextentofagencycosts.
Ineachofthetwoyears,weusemaximumlikelihoodtechniquestoestimatethehighest
potentialvalueofabank’sinvestmentinitsassetsbyfittinganupperenvelopeofthemarketvalue
ofbanks’assets(MVA)totheirreplacementcost,proxiedbytheirbookvaluenetofgoodwill(BVA):
MVAi=+(BVAi)+(BVAi)2+i, (1)
wherei=i−iisacompositeerrortermusedtodistinguishstatisticalnoise,i~iidN(0,2),
fromthesystematicshortfall,i(0),frombanki’shighestpotential(frontier)marketvalue.We
assumethatiisdistributednormallyforthe2007frontier,i(0)~iidN(0,2),and,forthe
2013frontier,exponentially,i(>0)~θexp(−θu).Thequadraticspecificationallowsthefrontier
tobenonlinear.Thefrontiervalue,FMVAi,isgivenbythedeterministickernelofthestochastic
frontier,
FMVAi=+(BVAi)+(BVAi)2. (2)
Thestochasticfrontier,SFMVAi,consistsofthedeterministickernelandthetwo‐sidederrorterm:
SFMVAi=FMVAi+i.Figure1illustratestherelationshipofthedeterministickerneltoobserved
marketvalueatanygivenbook‐valueinvestmentinassets.
Thedifferencebetweenabank'sstochasticfrontiermarketvalueandtheobservedmarket
valuedefinesthebank’smarket‐valueshortfall,i,whichismeasuredindollarsoflostmarket
value.Formally,abank’sshortfallisdefinedeitherbythedifferencebetweenitspotentialvalueon

7
thestochasticfrontieranditsobservedmarketvalueor,equivalently,bythedifferencebetweenits
valueonthedeterministickernelanditsnoise‐adjustedmarketvalue:
i=SFMVAi−MVAi=FMVAi−(MVAi−i), (3)
whereMVAi−iisthenoise‐adjustedobservedmarketvalueofassets.Sincetheshortfall,i,cannot
bedirectlymeasured,itisestimatedastheexpectationoficonditionaloni:
shortfalli=E(i|i)=FMVAi−(MVAi−E(i|i)). (4)
Formoredetailsonthistechnique,seeBauer(1990)andJondrow,Lovell,Materov,and
Schmidt(1982).Themarket‐valueinefficiencyratioexpressestheshortfallasaproportionof
thehighestpotentialvalue:
market‐valueinefficiencyratioi=shortfalli/FMVAi=E(i|i)/FMVAi. (5)
We can use the noise‐adjustedobservedmarketvalueexpressedin(3)to adjust the
standardproxyforTobin’sqratio,
Tobin’sqratio=MVAi/BVAi, (6)
fornoise:
noise‐adjustedTobin’sqratio=(MVAi−i)/BVAi. (7)
Anumberofstudieshaveusedthemarket‐valueinefficiencyratioaswellasthenoise‐adjustedq
ratiotomeasureperformance.8
Figure1(reproducedfromHughes,Jagtiani,andMester,2016)providesanillustrationof
theconcepts.Inthisexample,bankiinvests100inassetsandachievesamarketvalueadjustedfor
statisticalnoise,i,of108.Itshighestpotentialvalueis120.Theshortfallofitsachievedvalue 8See,forexample,Hughes,Lang,Mester,andMoon(1999);HabibandLjungqvist(2005);DeJongheandVanderVennet(2005);HughesandMoon(2003);Hughes,Mester,andMoon(2001);Hughes,Lang,Mester,Moon,andPagano(2003);Baele,DeJonghe,andVanderVennet(2007);andHughesandMester(2013a,2013b).

8
fromitspotentialis12(=120‐108).Itsmarket‐valueinefficiencyratiois0.10(=12/120),andits
noise‐adjustedTobin’sqratiois1.08(=108/100).
III.MeasuringtheValueofInvestmentOpportunities9
Inadditiontomeasuringfinancialperformance,Tobin’sqratioisalsousedtomeasurethe
valueofinvestmentopportunities.Forexample,Yermack(2006)usestheqratiotomeasureand
controlforthevalueofinvestmentopportunitiesinregressionsintendedtoexplainthepersonal
useofcompanyjetsbytheCEO.InregressionstoexplainCEOcompensation,Core,Holthausen,and
Larcker(1999)usethemarket‐to‐bookratiotocontrolforthevalueofinvestmentopportunities.
TheaccuracyofTobin’sqratioasameasureofthevalueofafirm’sinvestmentopportunitiesis
compromisedwhenagencyproblemsreduceafirm’smarketvalue.Toavoidthisbias,themeasure
shouldbeindependentoftheactionsofafirm’smanagement,anditshouldgaugethehighest
potentialvalueofafirm’sinvestmentopportunities.Thestochasticfrontierestimationcanbeused
toobtainthehighestpotentialvalueofassetsintheparticularmarketsinwhichafirmoperates.This
frontierdiffersfromthefrontierin(1)usedtoestimatethehighestpotentialvalueoverallmarkets
inwhichfirmsinthesampleoperate.Inthecaseoftheefficiencyfrontier(1),abank’shighest
potentialvalueisgaugedfromitspeerswiththesamebook‐valueinvestmentinassets.Inthecase
oftheinvestmentopportunityfrontier,abank’speersarenotjustthoseofthesamesize,butalso
thoseoperatingundersimilarmarketconditionssuchasthemacroeconomicgrowthrateand
marketconcentration.Sincethisfrontierisestimatedovertheentiresampleofbanks,the
estimatedhighestpotentialvalueoftheinvestmentopportunitiesofanyindividualbankis
independentofitsownachievedvalue.
Weobtainthispotentialvaluebyaddingvariablestothefrontierin(1)thatcapturethe
economicopportunitiesofthemarketsinwhichabankoperates–theweightedten‐yearaverage
9ThissectionfollowstheoriginalexpositionofHughes,Lang,Moon,andPagano(1997),whichisrestatedmorerecentlyinHughes,Mester,andMoon(2016)andHughes,Jagtiani,andMester(2016).
9
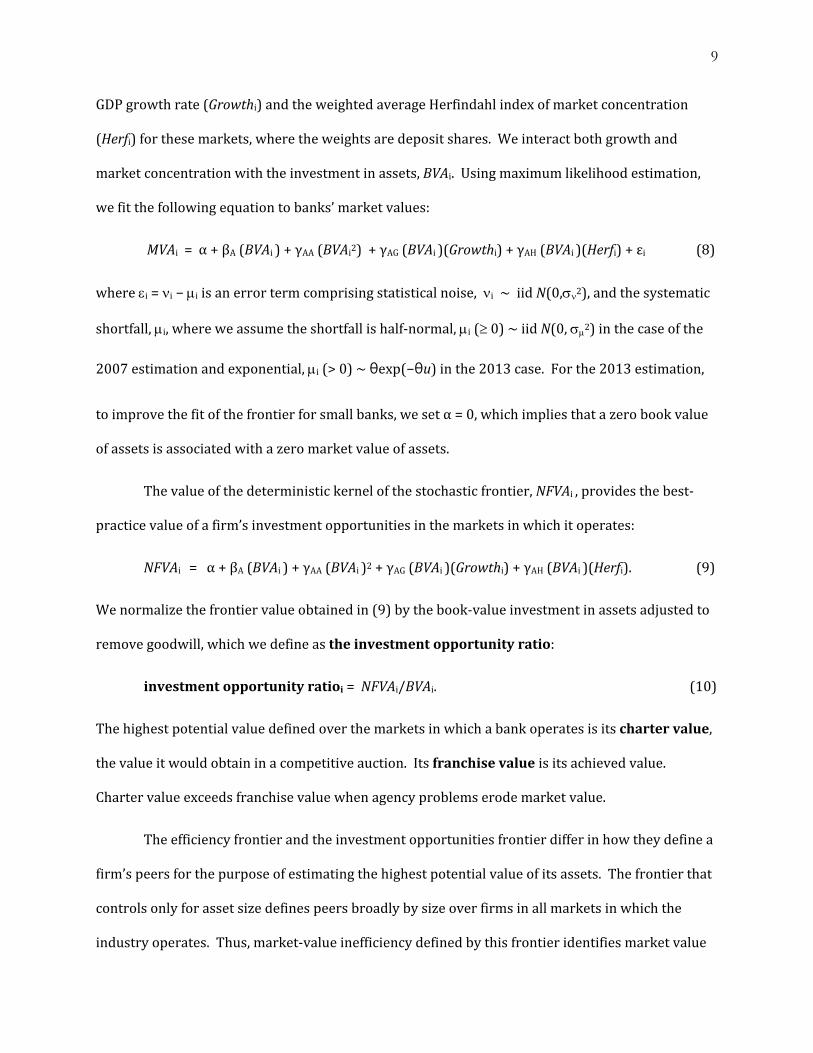
GDPgrowthrate(Growthi)andtheweightedaverageHerfindahlindexofmarketconcentration
(Herfi)forthesemarkets,wheretheweightsaredepositshares.Weinteractbothgrowthand
marketconcentrationwiththeinvestmentinassets,BVAi.Usingmaximumlikelihoodestimation,
wefitthefollowingequationtobanks’marketvalues:
MVAi=α+βA(BVAi)+γAA(BVAi2)+γAG(BVAi)(Growthi)+γAH(BVAi)(Herfi)+εi (8)
wherei=i−iisanerrortermcomprisingstatisticalnoise,i~iidN(0,2),andthesystematic
shortfall,i,whereweassumetheshortfallishalf‐normal,i(0)~iidN(0,2)inthecaseofthe
2007estimationandexponential,i(>0)~θexp(−θu)inthe2013case.Forthe2013estimation,
toimprovethefitofthefrontierforsmallbanks,wesetα=0,whichimpliesthatazerobookvalue
ofassetsisassociatedwithazeromarketvalueofassets.
Thevalueofthedeterministickernelofthestochasticfrontier,NFVAi,providesthebest‐
practicevalueofafirm’sinvestmentopportunitiesinthemarketsinwhichitoperates:
NFVAi=α+βA(BVAi)+γAA(BVAi)2+γAG(BVAi)(Growthi)+γAH(BVAi)(Herfi). (9)
Wenormalizethefrontiervalueobtainedin(9)bythebook‐valueinvestmentinassetsadjustedto
removegoodwill,whichwedefineastheinvestmentopportunityratio:
investmentopportunityratioi=NFVAi/BVAi. (10)
Thehighestpotentialvaluedefinedoverthemarketsinwhichabankoperatesisitschartervalue,
thevalueitwouldobtaininacompetitiveauction.Itsfranchisevalueisitsachievedvalue.
Chartervalueexceedsfranchisevaluewhenagencyproblemserodemarketvalue.
Theefficiencyfrontierandtheinvestmentopportunitiesfrontierdifferinhowtheydefinea
firm’speersforthepurposeofestimatingthehighestpotentialvalueofitsassets.Thefrontierthat
controlsonlyforassetsizedefinespeersbroadlybysizeoverfirmsinallmarketsinwhichthe
industryoperates.Thus,market‐valueinefficiencydefinedbythisfrontieridentifiesmarketvalue

10
fromfirmsoperatinginthemostvaluablemarketsandpenalizesfirmsoperatinginlessvaluable
markets–justascapitalmarketspenalizesuchmarketdisadvantages.Ontheotherhand,the
frontierthatcontrolsforassetsizeaswellasmarketconditionsestimatespotentialvalueforpeers
ofsimilarsizeandmarketopportunities.Thisvalueforanyfirmisgenerallylessthanthatobtained
fromtheformerfrontier.
IV.TheData
Weuse2007dataon219publiclytraded,top‐tierbankholdingcompaniesand2013data
on303companiestoestimatetheefficiencyfrontierandtheinvestmentopportunitiesfrontier.
Dataonownershipandboardstructurelimitthe2007sampleto142holdingcompaniesandthe
2013sampleto167companies.Balance‐sheetandincomestatementdataareobtainedfromthe
Y9‐CCallReportsfiledquarterlywithregulatorsandavailableonthewebsiteoftheFederal
ReserveBankofChicago.CompustatgivesdataonmarketvaluewhiletheCorporateLibrary
providesdataonownershipstructure.AlistofvariablesandtheirdefinitionsisgiveninTable1,
whilesummarystatisticsfor2013and2007aregiveninTables2and3,respectively.
V.FinancialPerformanceandCapitalStructure
Toexploretherelationshipbetweenbanks’financialperformanceandcapitalstructure,we
regressperformancemeasuredbyln(marketvalueofassets)andbythemarket‐valueinefficiency
ratiooncapitalstructureandasetofcontrolvariables,includingassetsize,assetallocation,off‐
balance‐sheetactivities,assetquality,ownershipstructure,andthevalueofinvestment
opportunities.Whilethemarketvalueofassetsmeasuresachievedfinancialperformanceandis
thuscorrelatedwithagencycosts,themarket‐valueinefficiencyratiomoredirectlymeasures
agencycostsasthedifferencebetweenbest‐practiceperformanceandnoise‐adjustedachieved
performance.

11
A.ControllingforCapitalStructure
Theinfluenceofcapitalstructurecandifferbetweenlargerandsmallerbanks.Thebetter
diversificationoflargerbankscouldimplythat,foranygivenexpectedreturn,thelowerassociated
returnriskyieldsalowerriskofinsolvencyforanygivenequitycapitalratio.Tocapturethis
difference,weinteracttheratioofequitycapitalwiththelogofassets.
Theinfluenceofcapitalstructurecanalsodifferbetweenbankswithlower‐andhigher‐
valuedinvestmentopportunities.Asexplainedpreviously,forthosewithlower‐valued
opportunities,higherrisk‐takingmightbecorrelatedwithhighermarketvalue,while,forthose
withlower‐valuedopportunities,lowerrisk‐takingmightbecorrelatedwithhighervalue.Forthe
former,ahigherrisk‐takingstrategycanbeassociatedwithalowercapitalratio,and,forthelatter,
alowerrisk‐takingstrategy,withahighercapitalratio.Tocapturethispossibility,weinteractthe
equitycapitalratiowiththeinvestmentopportunityratio.
Asaresultoftheseinteractionsofthecapitalratiowiththelogofassetsandtheinvestment
opportunityratio,thederivativeofperformancewithrespecttothecapitalratiowilldependnot
justonthecapitalratiobutalsoonthesizeofthebankandthevalueofthebank’sinvestment
opportunities.
Animportantcomponentofdebtthatdistinguishesthebusinessstrategyofbanksistheir
relianceondeposits.Consequently,weincludetheratioofdepositstototalborrowedfunds.
B.ControllingforAssetAllocation,Off‐Balance‐SheetActivities,andAssetQuality
Weaccountfortheconsolidatedassetsofbanksbyincludingtwoterms:thelogofthebook
valueofassetsandthelogsquared.Wecharacterizetheallocationofassetsbytheratiooftotal
loanstoassetsandtheratioofliquidassetstoassets.Liquidassetsaredefinedasthesumofcash,
balancesatotherfinancialinstitutions,federalfundssold,securities,andsecuritiessoldunder
agreementtorepurchase.Off‐balance‐sheetactivitiesarerepresentedbytheratioofnoninterest

12
incometototalincome.Weaccountforthecompositionoftheloanportfoliowiththefollowing
ratios:residentialrealestateloanstoassets,commercialrealestateloanstoassets,consumerloans
toassets,andbusinessloanstoassets.Loanqualityistakenintoaccountbytheratioof
nonperformingloanstoassets,wherenonperformingloansisthesumofpast‐dueandnonaccrual
loans,grosscharge‐offs,andforeclosedrealestateowned.
C.ControllingforOwnershipStructure
JensenandMeckling(1976)pointoutthattheproportionofoutstandingsharesownedby
aninsiderrepresentstheinsider’spriceofadollaroffirmvalueallocatedtotheinsider’sprivate
benefitandarguethathigherinsiderownershipincreasesthepriceofagencygoodsand,thus,
betteralignstheinterestsofinsideownerswiththoseofoutsideowners–aphenomenontheycall
theconvergence‐of‐interestshypothesis.CitingastudybyWeston(1979)thatfindsthatnofirm
whereinsidersown30percentormoreofoutstandingshareshaseverbeenacquiredinahostile
takeover,Morck,Shleifer,andVishny(1988)hypothesizethatincreasedinsiderownership
enhancesinsiders’controlandmakesitmoredifficulttofirethemortoreplacethembyahostile
takeover–aphenomenontheycallentrenchment.Theyaddtothealignment‐of‐interests
hypothesisasecond,contrastingone,theentrenchmenthypothesis.Asinsiderownership
increases,managers’interestsarebetteralignedwiththoseofoutsideownerssomanagerstendto
consumefeweragencygoods;however,managersalsobecomemoreentrenched–moredifficultto
fire–whichimpliestheytendtoconsumemoreagencygoods.UsingU.S.dataonfirms,Morck,
Shleifer,andVishny(1988)estimateapiece‐wiselinearrelationshipbetweenTobin’sqratioand
ownershipbyofficersanddirectors.Forlevelsofinsiderownershipbetween0and5percent,they
findastatisticallysignificant,positiverelationship;between5and25percent,asignificantnegative
relationship;andover25percent,weakerevidenceofapositiverelationship.Theyinterpretthe
positivesignsasevidencethattheconvergence‐of‐interestshypothesisdominatesentrenchment
andthenegativesign,thatentrenchmentdominatesconvergence.DeYoung,Spong,andSullivan

13
(2001)reachsimilarconclusionsfromregressionsthatrelateperformancetoaquadratic
specificationofownershipatbanks.HughesandMester(2013a)useacubicspecificationof
ownershipandfindthethreeregimesofMorck,Shleifer,andVishny(1988),alsoatU.S.banks.
Thesespecificationsassumethattherelationshipbetweenperformanceandagivenlevelof
insiderownershipisindependentofthesizeofthefirm.However,ownershipatlargefinancial
institutionsislimitedbythepersonalwealthofinsiders.Thus,theperformanceincentivesof
owning5percentofoutstandingsharesatalargebankarelikelytodifferfromthoseatasmall
bank.Weallowassetsizetoinfluenceperformanceincentivesbyinteractingtheproportionof
outstandingsharesownedbyinsidersandthesquaredproportionwiththelogarithmic
transformationofassetsize.Asaresultoftheseinteractions,thederivativeofperformancewith
respecttoinsiderownershipdependsnotjustontheproportionofinsiderownership,butalsoon
thelogofassetsizeandtheinteractionofinsiderownershipandthelogofassetsize.
Inaddition,theperformanceincentivescreatedbymanagerialownershipmaydifferbythe
valueofinvestmentopportunitiesthebankexperiences.Higher‐valuedinvestmentopportunities
mayrelieveperformancepressuresonmanagersandallowthemtoconsumemoreagencygoods
whileachievingarelativelyhighmarketvalue.Weinvestigatethisincentivebyinteractingthe
proportionandthesquaredproportionofoutstandingsharesownedbyinsiderswiththe
investmentopportunityratio.Wefollowasimilarstrategywithrespecttotheproportionof
outstandingsharesownedbyblockholders:weinteractthisproportionwiththelogofassetsand
withtheinvestmentopportunityratio.
14
D.ThePerformanceEquations
Weapplythegeneral‐to‐specificmodelingstrategytoidentifythebestspecificationforeach
year’stwoperformanceequations.10Ineachregression,westartwiththesamegeneral
specification,whichincludesalltheexplanatoryvariablesdescribedabove.Therootexplanatory
variablesweconsiderincludetheln(bookvalueofassets)andln(bookvalueofassets)squared;
assetquality,measuredbytheratioofnonperformingloanstototalassets;theproportionof
outstandingcommonsharesownedbyofficersanddirectorsattheendoftheprioryearinteracted
withtheln(bookvalueofassets),andinteractedwiththeinvestmentopportunityratio;the
proportionofoutstandingsharesownedbyblockholders,thatis,holdersof5percentormoreof
outstandingsharesattheendoftheprioryearinteractedwithtwovariables,theln(bookvalueof
assets)andtheinvestmentopportunityratio;11theratiosofloanstoassets,residentialrealestate
loanstoassets,commercialrealestateloanstoassets,consumerloanstoassets,andbusinessloans
toassets;theratioofliquidassetstoassets;off‐balance‐sheetactivitiesmeasuredbytheratioof
noninterestincometototalincome;theratioofdepositstototalborrowedfunds;andtheratioof
equitycapitaltoassetsanditsinteractionwithtwovariables,theln(bookvalueofassets)andthe
investmentopportunityratio.Table1givesthedefinitionsofthesevariables.
Ourinitialspecificationincludesthese20controlvariablesandaninterceptterm.Wefocus,
inpart,ontheeffectsofthecapitalratio’sinteractionwithassetsizeandwiththevalueof
investmentopportunitiesonperformance;consequently,wekeepthesetwovariablesinthe
processofapplyingthegeneral‐to‐specificmodelingstrategy.Hence,exceptforthesetwo
variables,weremovetheexplanatoryvariableassociatedwiththelargestreductionintheAkaike
10Hendry(1983)providesthefirstcompleteapplication.Campos,Ericsson,andHendry(2005)giveandoverviewofthetechnique.Maddala(2001,pp.483‐484)providesatextbook‐levelintroductiontothegeneral‐to‐specificapproach.
11Weusedlaggedownershipstructuretodealwiththeendogeneityofcontemporaneousownership.Inprinciple,onecouldaddresstheendogeneityissueusinginstrumentalvariables,butwecouldnotdeterminegoodinstrumentsthatexplainownershipbutnotfinancialperformance.

15
InformationCriterion(AIC),one–by‐onesequentiallyuntiltheAICstopsdecreasing.Wecarryout
thisstrategyfortheregressionsinvolvingeachofthetwoperformancemeasuresforeachofthe
twoyears.12
Insummary,thegeneralspecificationsoftheperformanceequationsweestimateareas
follows:
Pi=a+Xβ+εi. (11)
wherePi=Performance,asmeasuredbyln(marketvalueofassetsin$1000s)andmarket‐value
inefficiency,andXisthesetofregressors:
nonperformingloans/assets,
insiderownership*ln(bookvalueofassetsin$1000s),
insiderownership*investmentopportunityratio,
insiderownershipsquared*ln(bookvalueofassetsin$1000s),
insiderownershipsquared*investmentopportunityratio,
blockholderownership*ln(bookvalueofassetsin$1000s),
blockholderownership*investmentopportunityratio,
totalloans/totalassets,
residentialrealestateloans/totalassets,
commercialrealestateloans/totalassets,
consumerloans/totalassets,
businessloans/totalassets,
liquidassets/totalassets,
noninterestincome/totalincome,
deposits/totalborrowedfunds,
12Forthe2013ln(marketvalueofassets)regressions,reportedinTable4,theAICdeclinesfrom581.8334forthegeneralspecificationto589.7162forthefinalspecification.Forthe2013market‐valueinefficiencyregressions,theAICdeclinesfrom655.8724forthegeneralspecificationto664.9186forthefinalspecification.Forthe2007ln(marketvalueofassets)regressions,reportedinTable8,theAICdeclinesfrom550.9030forthegeneralspecificationto567.2802forthefinalspecification.Forthe2007market‐valueinefficiencyregressions,theAICdeclinesfrom566.3939forthegeneralspecificationto577.2006forthefinalspecification.

16
equitycapital/totalassets,
equitycapitalratio*ln(bookvalueofassetsin$1000s),
equitycapitalratio*investmentopportunityratio,
ln(bookvalueofassetsin$1000s),
ln(bookvalueofassetsin$1000s)squared.
E.PerformanceIncentivesofCapitalStructure:TheTwoFacesofEquity
Tables4and8reporttheresultsoftheperformanceregressionsfor2013and2007,
respectively.Thegeneralandfinalspecificationsarereportedforeachperformancemeasure.We
focusonthetwofinalspecificationsforeachyearand,withinthosespecifications,theresultsfor
therelationshipofperformancetothecapitalstrategy.
BasedontheestimatedparametersreportedinTable4for2013,thederivativeof
ln(marketvalueofassets($1000))withrespecttothecapitalratiois:
∂ln marketvalueassets)/∂capitalratio=4.83162+(0.23864)(ln(book‐valueassets(1000s))
+(0.65724)(investment‐opportunityratio). (12)
(Coefficientsinboldprintarestatisticallydifferentfrom0ata10percentorbetterlevel.)The
estimatedvalueofthederivativeispositivefor132banksandnegativefor35and97ofthepositive
valuesand15ofthenegativevaluesaresignificantlydifferentfrom0.Onthemargin,areductionin
thecapitalratioatthese15banksexhibitinganegativevalueisassociatedwithahighermarket
value,whichsuggeststhatmarketdisciplinemayworkagainstfinancialstabilityatthesebanks.
Table5liststhese15banksindescendingorderofconsolidatedassets.Notethateachhasmore
than$50billioninassets,whichmakesthemsubjecttoincreasedregulatoryscrutinyunderthe
Dodd‐FrankAct.
Thecomparablederivativewhenperformanceattheendof2013ismeasuredbymarket‐
valueinefficiencyis

17
∂market‐valueinefficiency/∂capitalratio=12.84052+(0.45283)(ln(book‐valueassets(1000s))
+(4.25213)(investment‐opportunityratio). (13)
Inthiscase,133bankshaveanegativevalue,with110beingstatisticallysignificant,and33havea
positivevalue,with20beingstatisticallysignificant.13Thus,atthemargin,areductioninthe
capitalratioatthese20banksiscorrelatedwithreducedmarket‐valueinefficiency,whichsuggests
marketdisciplineatthesebankscouldworkagainstfinancialstability.Table5reportsthesebanks
indescendingorderbyassetsize.Eachholdsconsolidatedassetsgreaterthan$50billion.
Toillustrate,considerthelargestbankonthelistinTable5,JPMorganChase.Thevalueof
thederivativeofln(market‐valueassets)withrespecttotheequitycapitalratioisestimatedtobe
0.99720,indicatingthatadecreaseintheequitycapitalratioof0.01isassociatedwitha+0.997
percentincreaseinmarketvalue.Thenextthreelargestfinancialinstitutionsexhibitasimilar
effect.Thevalueofthederivativeofmarket‐valueinefficiencywithrespecttotheequitycapital
ratioforJPMorganChaseisestimatedtobe1.29674,indicatingthatadecreaseintheequitycapital
ratioof0.01isassociatedwithadecreaseof0.0129674initsmarket‐valueinefficiencyratio.
Twoofthenextthreelargestfinancialinstitutionsexhibitaperformanceeffectofsimilar
magnitude.
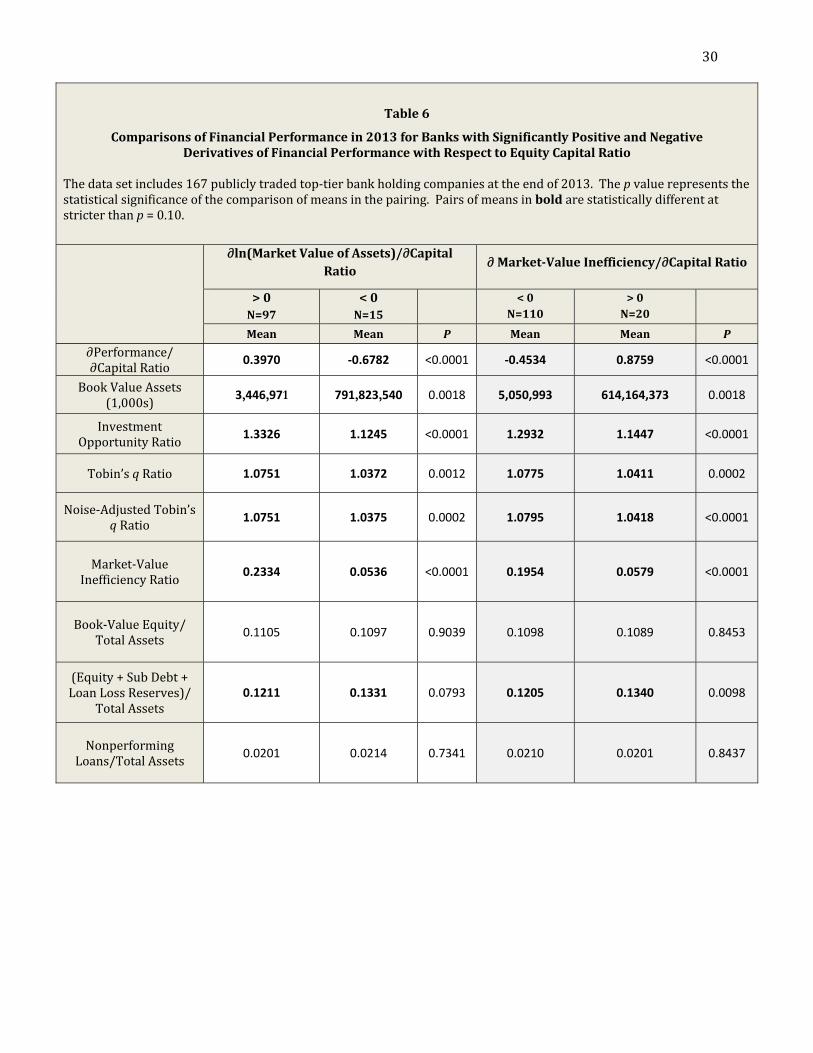
Tables6and7comparethemeansofkeyvariablesforthegroupsofbankswithpositive
andnegativederivativesfor2013.Asshownincolumns2and5ofTable6,forthebankswhose
performanceispositivelyrelatedtotheircapitalratio(whichisthemajority),anincreaseof0.01in
thecapitalratioisassociatedwithanaverageincreaseof0.3970percentinmarketvalueanda
0.4534percentdecreaseinmarket‐valueinefficiency(thatis,withhigherefficiency).Forbanks
whoseperformanceisnegativelyrelatedtotheircapitalratio(whichisasmallnumberofbanks),
anincreaseof0.01intheircapitalratioisassociatedwithanaveragedecreaseof0.6782percentin
13Weobtainedestimatesofmarket‐valueinefficiencyforthe166observationsforwhichwehaddataonthemarketvalueofassets.

18
theirmarketvalueandanaverageincreaseof0.8759intheirmarket‐valueinefficiency.Thus,for
thissmallnumberofbanks,therearemarketincentivestoreducetheircapitalratiosonthemargin.
Butnotethattheaveragesizeofbanksinthiscategoryisconsiderablylargerthanthatofbanksin
theothercategorythatexperiencetheincentivetoincreasetheircapitalratio.The15bankswhose
ln(marketvalueofassets)isnegativelyrelatedtothecapitalratioholdonaverage$791.8billionin
assetsasopposedtothe97withapositivederivativethatholdonaverage$3.4billioninassets.
Similarly,the20bankswhosemarket‐valueinefficiencyispositivelyrelatedtothecapitalratio
holdonaverage$614.2billioninassets,whilethe110bankswithanegativederivativeholdon
average$5.1billioninassets.Thebankswhoseperformanceisnegativelyrelatedtotheircapital
ratioholdmorethan$50billioninassets,whichmakesthemsubjecttoincreasedregulatory
scrutinyundertheDodd‐FrankAct.TheselargebanksonaverageachievealowerTobin’sqratio
butalsoexhibitlower‐valuedinvestmentopportunities.Nevertheless,theyachieveahigher
proportionoftheirpotentialmarketvalue–alowermarket‐valueinefficiencyratio.Hence,it
appearsthattheyexploittheirlower‐valuedinvestmentopportunitiesmoreeffectively.Finally,
theyholdonaverageahigherratioofTier1andTier2capitaltoassets.14Table7comparesmeans
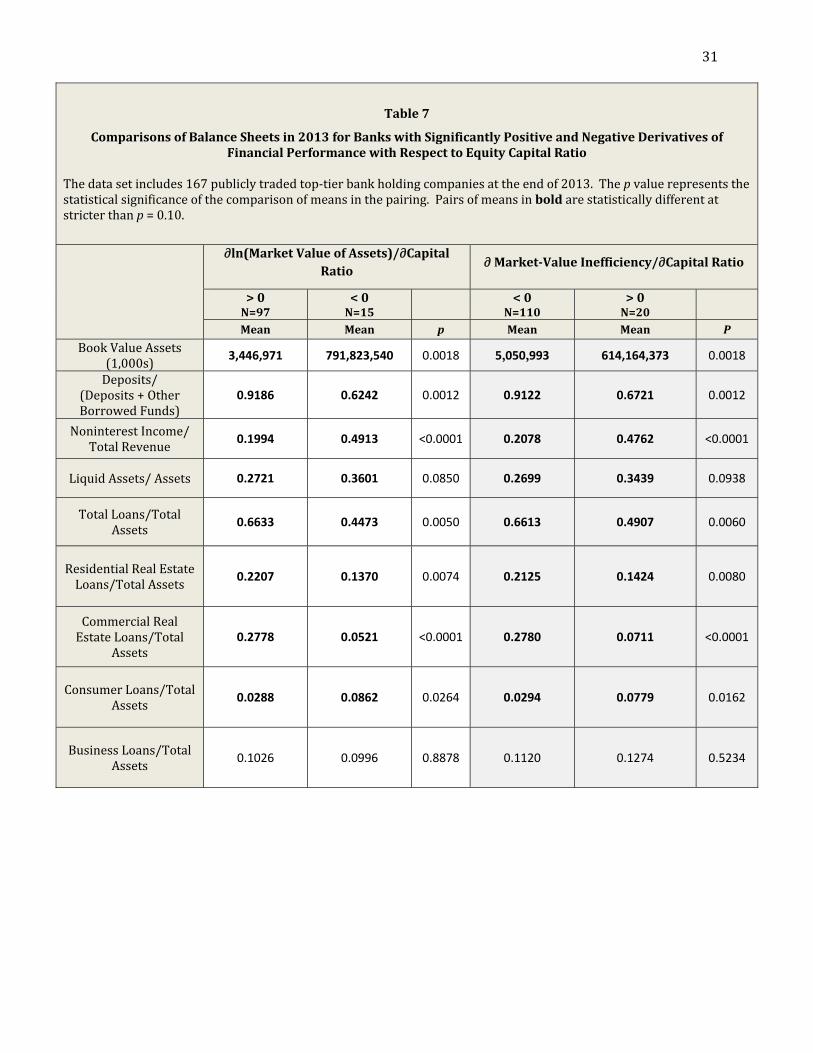
ofvariablesthatcharacterizeassetallocation,off‐balance‐sheetactivities,andrelianceondeposits
forthesetwogroupsofbanks.Asexpected,thesedifferencesreflectthewell‐knowndifferences
betweenlargerandsmallerbanks.
Tables8‐11repeattheanalysisaboveusing2007data.Table8reportstheresultsofthe
performanceregressions.Thederivativeofln(marketvalueofassets($1000))withrespecttothe
capitalratiois:
∂ln marketvalueassets)/∂capitalratio=0.13844+(0.13707)(ln(book‐valueassets(1000s))
+(1.80742)(investment‐opportunityratio). (14)
14TheTier1capitalratioisgivenbythevariableecap_assets,whiletheratiocomprisingthesumofTier1andTier2isgivenbyfcap_assets.

19
Theestimatedvalueofthederivativeispositivefor33banksandnegativefor109,showingthat
rightbeforethecrisishit,fewbanksappearedtohaveamarket‐drivenincentivetoincreasetheir
capitalratio,whilemanyappearedtoexperiencetheoppositeincentive.Noneofthe33positively
valuedderivativesisstatisticallysignificant;only29ofthe109negativelyvaluedderivativesare
statisticallysignificant,butthesebanksareamongthelargestbanksinthesample.PanelAof
Table9liststhederivativesforthe17bankswhoseassetsexceeded$50billionin2007.Notethat
forallofthesebanks,theirderivativesofperformancewithrespecttotheequitycapitalratioare
statisticallysignificantlynegative.PanelBofTable9showsall29bankswithstatistically
significantnegativederivatives,orderedbytheirstatisticalsignificance.Thecapital‐market
incentivetoreducethecapitalratioextendsfromthelargestbankstomuchsmallerbanks.Tables
10and11comparethemeansofkeyvariablesforthese29bankswiththoseofthe33bankswith
positivebutstatisticallyinsignificantderivatives.These29banksareonaveragemuchlargerand
exhibitthetypicalcharacteristicsoflargerbanks.
Whenperformanceismeasuredbymarket‐valueinefficiency,thederivativeofperformance
withrespecttotheequitycapitalratiois
∂market‐valueinefficiency/∂capitalratio=3.18169+(0.27177)(ln(book‐valueassets(1000s))
+(1.02550)(investment‐opportunityratio).(15)
Theestimatedderivativeisnegativefor96banks(with61ofthesestatisticallysignificant)and
positivefor46banks(with13ofthesestatisticallysignificant).Thus,increasingthecapitalratiois
associatedwithreducedmarket‐valueinefficiency(thatis,betterperformance)at61banks.But
reducingthecapitalratioatthe13bankswithasignificantpositivederivativeisassociatedwith
reducedmarket‐valueinefficiency.Thissuggeststhatmarketdisciplinemightworkagainst
financialstabilityatthesebankstotheextentthatitgivesanincentivetolowercapitalratios.As
showninTable9,all13bankswithasignificantpositivederivativehadassetsgreaterthan$50
billionin2007.

20
Toillustrate,considerthelargestbankonthelistinTable9,Citigroup.Thevalueofthe
derivativeofln(market‐valueassets)withrespecttotheequitycapitalratioisestimatedtobe
1.07774,indicatingthatadecreaseintheequitycapitalratioof0.01isassociatedwitha
+1.07774percentincreaseinmarketvalue.Thenexttwolargestfinancialinstitutionsexhibita
similareffect.Thevalueofthederivativeofmarket‐valueinefficiencywithrespecttotheequity
capitalratioforCitigroupisestimatedtobe1.60196,indicatingthatadecreaseintheequitycapital
ratioof0.01isassociatedwithadecreaseof0.0160196initsmarket‐valueinefficiencyratio.
Thenexttwolargestfinancialinstitutionsexhibitaperformanceeffectofsimilarmagnitude.These
resultssuggestthatthecapitalmarketappearstorewardriskiercapitalstrategiesin2007.
Ofcourse,ourresultsarebasedonsimpleregressions,andthereareseveralcaveatsthat
oneshouldapplytoavoidover‐interpretingtheseresults.Inparticular,wecannotinfercausation
fromtheseresults.Wetaketheresultsasmerelysuggestiveofastatisticallysignificantassociation
thatcallsforfurtheranalysis.Butwealsotakethemasacautionthatoneshouldbecarefulnotto
assumethatmarketdisciplinewilldriveincentivesleadingtoamorestablefinancialsystem.A
naturalconclusionwouldbethatregulatorycapitalrequirementsarenecessary.
V.Conclusions
Usingmeasuresofperformanceandinvestmentopportunitiesderivedfromstochastic
frontieranalysisand2007and2013dataontop‐tier,publiclytradedU.S.bankholdingcompanies,
wefindevidenceoftwofacesofequityinvestment.Atbankswithhigher‐valuedinvestment
opportunities,onthemarginanincreaseintheirequitycapitalratioisassociatedwithbetter
financialperformance,whileatbankswithlower‐valuedinvestmentopportunities,amarginal
decreaseintheirequitycapitalratioisassociatedwithbetterfinancialperformance.Becausethe
largestU.S.financialinstitutionstendtohavelower‐valuedinvestmentopportunities,ourresults
suggestthattheymayhaveamarket‐basedincentivetoreducetheircapitalratio.Totheextent

21
thatmarketdisciplinerewardsreducingthecapitalratioamongthelargestbanks,itwouldtendto
underminefinancialstability.Ourresultssupporttheneedforregulatorycapitalrequirements.

22
BibliographyBankforInternationalSettlements,BaselCommitteeonBankingSupervision,(September2001).“Pillar3–MarketDiscipline,”WorkingPapersNo7,http://www.bis.org/publ/bcbs_wp7.htm.Baele,L.,DeJonghe,O.,andVanderVennet,R.(2007).Doesthestockmarketvaluebankdiversification?JournalofBankingandFinance31,1999‐2023.Bauer,PaulW.(1990).Recentdevelopmentsintheeconometricestimationoffrontiers,JournalofEconometrics46,39–56.Calomiris,C.W.andNissim,D.(2007).Activity‐basedvaluationofbankholdingcompanies,WorkingPaper12918,NationalBureauofEconomicResearch.Campos,J.,Ericsson,N.R.,andHendry,D.F.(2005).General‐to‐specificmodeling:anoverviewandselectedbibliography,IntroductioninJ.Campos,N.R.Ericsson,andDavidF.Hendry(eds.),General‐to‐SpecificModeling,EdwardElgarPublishing,Cheltenham.Core,J.E.,Holthausen,R.W.,andLarcker,D.F.(1999).Corporategovernance,chiefexecutiveofficercompensation,andfirmperformance,JournalofFinancialEconomics51,371‐406.DeJonghe,O.andVanderVennet,R.(2005).Competitionversusagencycosts:ananalysisofchartervaluesinEuropeanbanking,WorkingPaper,GhentUniversity.DeYoung,R.,Spong,K.andSullivan,R.J.(2001).Who’smindingthestore?Motivatingandmonitoringhiredmanagersatsmall,closelyheldcommercialbanks.JournalofBankingandFinance25,1209‐1243.Greenspan,Alan(2005).Risktransferandfinancialstability,RemarkstotheFederalReserveBankofChicago’sForty‐FirstAnnualConferenceonBankStructure,Chicago,IL,May5,2005.Greenspan,Alan(2008).TestimonyattheHearingonrheFinancialCrisisandtheRoleofFederalRegulators,beforetheCommitteeonOversightandGovernmentReform,U.S.HouseofRepresentatives,October23,2008,https://www.gpo.gov/fdsys/pkg/CHRG‐110hhrg55764/html/CHRG‐110hhrg55764.htm.Grossman,R.S.(1992).Depositinsurance,regulations,andmoralhazardinthethriftindustry:evidencefromthe1930s,AmericanEconomicReview82,800‐821.Habib,M.A.andLjungqvist,A.(2005).Firmvalueandmanagerialincentives:astochasticfrontierapproach,JournalofBusiness78,2053‐2093.Hendry,D.F.(1983).Econometricmodelling:theconsumptionfunctioninretrospect,ScottishJournalofPoliticalEconomy30,193‐220.Hughes,J.P.,Jagtiani,J.,andMester,L.J.(2016).Isbiggernecessarilybetterincommunitybanking?DepartmentofEconomics,RutgersUniversity,WorkingPaper201604.Hughes,J.P.,Lang,W.,Mester,L.J.,andMoonC.‐G.(1999).Thedollarsandsenseofbankconsolidation,JournalofBankingandFinance23,291‐324.

23
Hughes,J.P.,Lang,W.,Mester,L.J.,MoonC.‐G.,andPagano,M.(2003).Dobankerssacrificevaluetobuildempires?Managerialincentives,industryconsolidation,andfinancialperformance,JournalofBankingandFinance27,417‐447.Hughes,J.P.,Lang,W.,MoonC.‐G.andPagano,M.(1997).Measuringtheefficiencyofcapitalallocationincommercialbanking,WorkingPaper98‐2,FederalReserveBankofPhiladelphia(revisedasWorkingPaper2004‐1,RutgersUniversityEconomicsDepartment).Hughes,J.P.andMester,L.J.(2013a).Aprimeronmarketdisciplineandgovernanceoffinancialinstitutionsforthoseinastateofshockeddisbelief,Chapter2inEfficiencyandProductivityGrowth:ModellingintheFinancialServicesIndustry,F.Pasiouras(ed.),JohnWileyandSons:WestSussex,U.K.,19‐47.Hughes,J.P.andMester,L.J.(2013b).Whosaidlargebanksdon’texperiencescaleeconomies?Evidencefromarisk‐return‐drivencostfunction,JournalofFinancialIntermediation22,559‐585.Hughes,J.P.,Mester,L.J.andMoon,C.‐G.(2016).MeasuringagencycostsandthevalueofinvestmentopportunitiesofU.S.bankholdingcompanieswithstochasticfrontierestimation,forthcomingintheResearchHandbookonCompetitioninBankingandFinance,J.A.BikkerandL.Speirdijk(eds.).Hughes,J.P.,Mester,L.J.,andMoon,C.‐G.(2001).Arescaleeconomiesinbankingelusiveorillusive?Evidenceobtainedbyincorporatingcapitalstructureandrisk‐takingintomodelsofbankproduction,JournalofBankingandFinance25,2169‐2208.Hughes,J.P.andMoonC.‐G.(2003).Estimatingmanagers’utility‐maximizingdemandforagencygoods,WorkingPaper2003‐24,DepartmentofEconomics,RutgersUniversity.Jensen,M.C.andMeckling,W.H.(1976).Theoryofthefirm:managerialbehavior,agencycosts,andownershipstructure,JournalofFinancialEconomics5,305‐360.Jondrow,J.,Lovell,C.A.K.,Materov,I.S.,andSchmidt,P.(1982).Ontheestimationoftechnicalefficiencyinthestochasticfrontierproductionfunctionmodel,JournalofEconometrics19,233–238.Keeley,M.C.(1990).Depositinsurance,risk,andmarketpowerinbanking,AmericanEconomicReview80,1183‐1200.Laeven,L.,andLevine,R.(2009).Bankgovernance,regulationandrisktaking,JournalofFinancialEconomics93,259‐275.Maddala,G.S.(2001).IntroductiontoEconometrics,ThirdEdition,MacmillanPublishingCo.,NewYork.Marcus,A.J.(1984).Deregulationandbankfinancialpolicy,JournalofBankingandFinance8,557‐565.McConnell,J.J.andServaes,H.(1995).Equityownershipandthetwofacesofdebt,JournalofFinancialEconomics39,131‐157.

24
Morck,R.,Shleifer,R.M.andVishny,R.W.(1988).Managementownershipandmarketvaluation:anempiricalanalysis,JournalofFinancialEconomics20,293‐316.Nakamoto,M.andWighton,D.(2007),Citigroupchiefstaysbullishonbuy‐outs,FinancialTimes,July9,2007.Weston,J.F.(1979).Thetendertakeover,MergersandAcquisitions,74‐82.Yermack,D.(2006).Flightsoffancy:corporatejets,CEOperquisites,andinferiorshareholderreturns,JournalofFinancialEconomics80,211‐242.

24
Figure115
Market‐ValueFrontierStochasticfrontierestimationyieldsthepotentialmarketvalueofassetsasaquadraticfrontierofthebookvalueofassetsnetofgoodwill.Theerrorterm,i=i−i,iscomposedofstatisticalnoise,i~iidN(0,2),andthesystematicshortfallfrombanki’shighestpotential(frontier)marketvalue.Forthe2007data,weadoptthehalf‐normaldistribution,i(0)~iidN(0,2),forthisshortfall;andforthe2013data,theexponentialdistribution,i(>0)~θexp(−θu).Thequadraticspecificationallowsthefrontiertobenonlinear.Inthisexample,bankiinvests100inassetsandachievesamarketvalueadjustedforstatisticalnoise,i,of108.Itshighestpotentialvalueis120.Theshortfallofitsachievedvaluefromitspotentialis12(=120‐108).Itsmarket‐valueinefficiencyratiois0.10(=12/120),anditsnoise‐adjustedTobin’sqratiois1.08(=108/100).
15ThisfigureisfromHughes,Jagtiani,andMester(2016)andalsoappearsinHughes,Mester,andMoon(2016).
MarketValueofAssets
DeterministicKernelofthePotential‐ValueFrontierFMVAi=+(BVAi)+(BVAi)2
BookValueofAssets(netofgoodwill)
120
108
100
MVShortfall=12
MVInefficiency=12/120
HighestPotentialMarketValueofAssets=+(BVAi)+(BVAi)2
Noise‐AdjustedAchievedMarketValueofAssets=MVAi−i
AchievedMarketValueofAssets=MVAi−i
i

25
Table1
DataDefinitions
Book‐valueofassetsrepresentsbookvalue(thousands)oftotalconsolidatedassetsattheendoftheyear.Adjustedbookvalueisobtainedbysubtractinggoodwillfrombookvaluetoremovecomponentsderivedfrommarketvalue.Themarketvalueofassetsisproxiedbytheratioofthesumofthebookvalueofliabilitiesandthemarketvalueofequitytotheadjustedbookvalueofassets.
Themarket‐valueinefficiencyratioisameasureofrelativeagencycostsgivenbythedifferencebetweenthehighestpotentialvalueofabank’sassetsoverallmarketsfoundinthesampleandthebank’snoise‐adjustedachievedmarketvalue(lostmarketvalue)dividedbythehighestpotentialvalueofassetsoverallmarkets,whichisestimatedbyastochasticfrontiertechnique.ThevalueofaBHC’sinvestmentopportunitiesismeasuredbyfittingastochasticfrontiertothemarketvalueofassetsasafunctionofthebookvalueofassetsand,inthebank’slocalmarkets,themarket‐weighted,10‐yearaveragemacroeconomicgrowthrateandtheBHC’smarket‐weightedHerfindahlindexofconcentration.Theinvestmentopportunityratioisthehighestpotentialvalueofthebank’sassetsinthemarketsinwhichitoperatesdividedbythebookvalueofassetsadjustedtoremovegoodwill.
Tobin’sqratioistheratioofthemarketvalueofassetstotheadjustedbookvalueofassetswherethemarketvalueofassetsisproxiedbythesumofthemarketvalueofequityandthebookvalueofliabilities.Thenoise‐adjustedTobin’sqratioismarketvalueofassetslessstatisticalnoisederivedfromstochasticfrontierestimation.
Thenonperformingassetsratioisthesumofpast‐dueandnonaccrualloans,grosscharge‐offs,andforeclosedrealestateowneddividedbytotalassets.
Liquidassetsaredefinedasthesumofcash,balancesatotherfinancialinstitutions,federalfundssold,securities,andsecuritiessoldunderagreementtorepurchase.
Theratioofequitycapitaltoassetsisgivenbythesumofcommonstock,retainedearnings,andperpetualpreferredstockdividedbytotalassets.Theratiooffinancialcapitaltoassetsisthesumofequitycapital,loan‐lossreserves,andsubordinateddebtdividedbytotalassets.
Insiderownershipistheproportionofoutstandingsharesownedbyofficersanddirectorsintheyearbefore,i.e.,in2006or2012.Blockholderownershipisthepercentofoutstandingsharesheldbyblockholders(holdersof5percentormoreofoutstandingsharesbasedon13Dfilings)atyear‐end2006or2012.

26
Table2
2013Data:SummaryStatistics
Thedatasetincludes167publiclytradedtop‐tierbankholdingcompaniesattheendof2013.
PanelA:AssetsandFinancialPerformance
N Mean Median Std.Dev.
Minimum
Maximum
BookValueAssets(1,000s) 167 81,361,076 6,039,126 322,211,407 711,515 2,415,689,000
InvestmentOpportunityRatio 167 1.271 1.261 0.103 0.988 1.620
Tobin’sqRatio 167 1.072 1.065 0.055 0.926 1.313
Noise‐AdjustedTobin’sqRatio 166 1.073 1.071 0.039 0.943 1.199
Market‐ValueInefficiency 166 0.169 0.144 0.107 0.000 0.479
PanelB:CapitalStructureandAssetQuality
Book‐ValueEquity/TotalAssets 167 0.113 0.112 0.025 0.069 0.229
(Equity+SubDebt+LoanLossReserves)/TotalAssets 167 0.126 0.125 0.026 0.076 0.241
Deposits/(Deposits+OtherBorrowedFunds)
167 0.876 0.909 0.144 0.104 1.000
NonperformingLoans/TotalAssets 167 0.021 0.018 0.017 0.000 0.166
PanelC:OwnershipStructure
OfficerandDirectorOwnership 167 0.094 0.056 0.119 0.000 0.722
BlockholderOwnership 167 0.185 0.166 0.118 0.000 0.867
PanelD:AssetAllocationandOff‐Balance‐SheetActivities
LiquidAssets/Assets 167 0.282 0.248 0.124 0.019 0.785
NoninterestIncome/TotalRevenue 167 0.259 0.237 0.195 ‐1.129 0.928
TotalLoans/TotalAssets 167 0.633 0.658 0.148 0.055 0.962
ResidentialRealEstateLoans/TotalAssets
167 0.199 0.195 0.109 0.000 0.631
CommercialRealEstateLoans/TotalAssets
167 0.229 0.227 0.122 0.000 0.592
ConsumerLoans/TotalAssets 167 0.041 0.016 0.077 0.000 0.823
BusinessLoans/TotalAssets 167 0.121 0.102 0.082 0.000 0.408

27
Table3
2007Data:SummaryStatistics
Thedatasetincludes142publiclytradedtop‐tierbankholdingcompaniesattheendof2007.
PanelA:AssetsandFinancialPerformance
n Mean Median Std.Dev.
Minimum
Maximum
BookValueAssets(1,000s) 142 57,427,092 4,088,173 269,582,515 659,896 2,187,631,104
InvestmentOpportunityRatio 142 1.103 1.094 0.035 1.025 1.185
Tobin’sqRatio 142 1.071 1.066 0.043 0.978 1.230
Noise‐AdjustedTobin’sqRatio 142 1.069 1.066 0.039 0.983 1.200
Market‐ValueInefficiency 142 0.308 0.314 0.162 0.000 0.719
PanelB:CapitalStructureandAssetQuality
Book‐ValueEquity/TotalAssets 142 0.095 0.094 0.020 0.052 0.176
(Equity+SubDebt+LoanLossReserves)/TotalAssets 142 0.110 0.109 0.022 0.063 0.182
Deposits/(Deposits+OtherBorrowedFunds)
142 0.814 0.830 0.127 0.145 0.991
NonperformingLoans/TotalAssets
142 0.017 0.014 0.013 0.001 0.101
PanelC:OwnershipStructure
OfficerandDirectorOwnership 142 0.120 0.077 0.134 0.000 0.694
BlockholderOwnership 142 0.098 0.078 0.102 0.000 0.725
PanelD:AssetAllocationandOff‐Balance‐SheetActivities
LiquidAssets/Assets 142 0.215 0.192 0.091 0.034 0.555
NoninterestIncome/TotalRevenue
142 0.179 0.162 0.081 0.038 0.496
TotalLoans/TotalAssets 142 0.702 0.723 0.102 0.356 0.885
ResidentialRealEstateLoans/TotalAssets 142 0.220 0.219 0.099 0.023 0.526
CommercialRealEstateLoans/TotalAssets 142 0.269 0.264 0.130 0.005 0.663
ConsumerLoans/TotalAssets 142 0.047 0.032 0.042 0.001 0.216
BusinessLoans/TotalAssets 142 0.134 0.120 0.078 0.023 0.463

28
Table42013FinancialPerformanceRegressions
Thedatarepresent167top‐tier,publiclytradedU.S.bankholdingcompaniesatyear‐end2013.ThedataareobtainedfromtheY9‐CCallReports,Compustat,andtheCorporateLibrary.Performanceismeasuredbytheln(marketvalueofassets)andmarket‐valueinefficiency.RegressionsareestimatedwithOLS,andstandarderrorsareheteroscedasticityconsistent.DefinitionsofthevariablesaregiveninTable1.
Variable
DependentVariableln(MarketValueofAssets) Market‐ValueInefficiency
GeneralSpecification FinalSpecification GeneralSpecification FinalSpecification
ParameterEstimate
Pr>|t|ParameterEstimate
Pr>|t|ParameterEstimate
Pr>|t|ParameterEstimate
Pr>|t|
Intercept ‐0.14431 0.7328 ‐0.29960 0.0849 4.41800 <0.0001 4.66226 <0.0001NonperformingLoans/Assets
‐0.52670 0.0023 ‐0.58965 0.0001 0.42848 0.0160 0.41012 0.0112
ManagerialOwnershipln(B.V.Assets)
0.09900 0.0071 0.09287 0.0086 ‐0.07219 0.0169 ‐0.01517 <0.0001
ManagerialOwnershipInv’tOpp’tyRatio
‐1.02906 0.0177 ‐0.94935 0.0204 0.71128 0.0441
ManagerialOwnership2ln(B.V.Assets)
‐0.11904 0.0212 ‐0.11285 0.0239 0.11877 0.0087 0.03014 <0.0001
ManagerialOwnership2Inv’tOpp’tyRatio
1.06986 0.0836 0.99316 0.0923 ‐1.11336 0.0391
BlockholderOwnershipln(B.V.Assets)
0.00203 0.8093 0.00751 0.4137 0.00282 0.0435
BlockholderOwnershipInv’tOpp’tyRatio
‐0.05257 0.5818 ‐0.03351 0.0838 ‐0.05700 0.6017
Loans/Assets 0.38694 <0.0001 0.30128 <0.0001 ‐0.08701 0.3181
ResidentialRealEstateLoans/Assets
‐0.29420 <0.0001 ‐0.25281 <0.0001 0.08081 0.0354
CommercialRealEstateLoans/Assets
‐0.14888 0.0023 ‐0.11629 0.0043 0.05012 0.1493
ConsumerLoans/Assets ‐0.07224 0.2171 0.00900 0.8771
BusinessLoans/Assets ‐0.30346 <0.0001 ‐0.25269 <0.0001 0.14150 0.0074 0.05449 0.1119
LiquidAssets/Assets 0.17951 0.0774 0.13567 0.0986 0.00967 0.9146
NoninterestIncome/TotalIncome
0.01632 0.4145 ‐0.01015 0.5246
Deposits/TotalBorrowedFunds
‐0.00973 0.7186 ‐0.06009 0.0428 ‐0.07357 0.0116
EquityCapital/Assets 4.09352 0.1405 4.83162 0.0535 ‐12.24445 <0.0001 ‐12.84052 <0.0001EquityCapital/Assetsln(B.V.Assets)
‐0.18899 0.0823 ‐0.23864 0.0141 12.84052 <0.0001 0.45283 <0.0001
EquityCapital/AssetsInv’tOpp’tyRatio
‐0.67394 0.4656 ‐0.65724 0.4311 4.03722 <0.0001 4.25213 <0.0001
ln(B.V.Assets) 0.99567 <0.0001 1.01369 <0.0001 ‐0.42580 <0.0001 ‐0.45100 <0.0001(ln(B.V.Assets))2 0.0003460 0.8086 0.01015 <0.0001 0.01080 <0.0001Number+,‐CapitalRatioDerivatives
132+,35‐ 33+,133‐
Number+,‐StatisticallySignificantCapitalRatioDerivatives
97+,15‐ 20+,110‐
Adj.
R2=0.999N=167
Adj.R2=0.999
N=167Adj.
R2=0.914N=166
Adj.R2=0.914
N=166

29
Table5DerivativeofPerformancewithRespecttoEquityCapitalRatio
for2013BanksSubjecttoEnhancedPrudentialSupervisionUndertheDodd‐FrankAct
Thefullsampleconsistsof167publiclytraded,top‐tier,U.S.bankholdingcompaniesatyear‐end2013.ThedataareobtainedfromtheY9‐CCallReports,Compustat,andtheCorporateLibrary.Performanceismeasuredbytheln(marketvalueofassets)andmarket‐valueinefficiency.Thevalueofthederivativesofln(marketvalueassets(1000s))andmarket‐valueinefficiencywithrespecttoequitycapitalisgivenforthe21bankswhoseconsolidatedassetsexceed$50billionin2013,whichsubjectsthemtoenhancedprudentialsupervisionunderthe2010Dodd‐FrankAct. ln(MarketValueAssets(1000s)) Market‐ValueInefficiencyRatio
NameBook‐ValueAssets(1000s)
∂ln(marketvalueassets)/∂(equitycapitalratio)
pvalue
NameBook‐ValueAssets(1000s)
∂(marketvalue
inefficiency/
∂(equitycapitalratio)
pvalue
1JPMORGANCHASE&CO
2,415,689,000 ‐0.99720 0.0186JPMORGANCHASE&CO
2,415,689,000 1.29674 0.0067
2BANKOFAMERICACORP
2,104,995,000 ‐0.98004 0.0196BANKOFAMERICACORP
2,104,995,000 1.33588 0.0046
3 CITIGROUP 1,880,382,000 ‐0.91374 0.0203 CITIGROUP 1,880,382,000 1.03006 0.0223
4WELLS
FARGO&CO1,527,015,000 ‐0.91295 0.0216
WELLSFARGO&CO
1,527,015,000 1.25207 0.0052
5GOLDMANSACHS
911,595,000 ‐0.77960 0.0264GOLDMANSACHS
911,595,000 0.95224 0.0184
6MORGANSTANLEY
832,702,000 ‐0.76961 0.0272MORGANSTANLEY
832,702,000 0.98639 0.0137
7BANKOFNEWYORKMELLON
374,310,000 ‐0.64148 0.0401BANKOFNEW
YORKMELLON
374,310,000 1.02986 0.0038
8 USBC 364,021,000 ‐0.63616 0.0408 USBC 364,021,000 1.02584 0.0037
9PNCFNCLSVC
GROUP320,596,232 ‐0.62675 0.0447
PNCFNCLSVCGROUP
320,596,232 1.10354 0.0016
10 CAPITALONE 297,282,098 ‐0.58763 0.0457 CAPITALONE 297,282,098 0.93282 0.0057
11STATESTREET
243,028,090 ‐0.55566 0.0520STATESTREET
243,028,090 0.94583 0.0038
12 SUNTRUSTBK 175,380,779 ‐0.48244 0.0653 SUNTRUSTBK 175,380,779 0.71779 0.0166
13 BB&TCORP 183,009,992 ‐0.47257 0.0649 BB&TCORP 183,009,992 0.82806 0.0062
14FIFTHTHIRD
BC129,685,180 ‐0.43037 0.0826
FIFTHTHIRDBC
129,685,180 0.82057 0.0040
15 REGIONSFC 117,661,732 ‐0.38704 0.0935 REGIONSFC 117,661,732 0.64639 0.0172
16NORTHERNTRUSTCORP
102,947,333 ‐0.36513 0.1045NORTHERNTRUSTCORP
102,947,333 0.65037 0.0138
17 KEYCORP 92,991,716 ‐0.32508 0.1250 KEYCORP 92,991,716 0.50223 0.0466
18 M&TBKCORP 85,162,391 ‐0.30277 0.1409 M&TBKCORP 85,162,391 0.45389 0.0648
19 COMERICA 65,356,580 ‐0.26408 0.1760 COMERICA 65,356,580 0.49241 0.0341
20 HUNTINGTONBSHRS
59,476,344 ‐0.25163 0.1908 HUNTINGTONBSHRS
59,476,344 0.51472 0.0240
21 ZIONSBC 56,031,127 ‐0.17253 0.3450 ZIONSBC 56,031,127 0.06803 0.7497
30
Table6
ComparisonsofFinancialPerformancein2013forBankswithSignificantlyPositiveandNegativeDerivativesofFinancialPerformancewithRespecttoEquityCapitalRatio
Thedatasetincludes167publiclytradedtop‐tierbankholdingcompaniesattheendof2013.Thepvaluerepresentsthestatisticalsignificanceofthecomparisonofmeansinthepairing.Pairsofmeansinboldarestatisticallydifferentatstricterthanp=0.10.
∂ln(MarketValueofAssets)/∂CapitalRatio
∂Market‐ValueInefficiency/∂CapitalRatio
>0N=97
<0N=15
<0
N=110>0N=20
Mean Mean P Mean Mean P
∂Performance/∂CapitalRatio
0.3970 ‐0.6782 <0.0001 ‐0.4534 0.8759 <0.0001
BookValueAssets(1,000s)
3,446,971 791,823,540 0.0018 5,050,993 614,164,373 0.0018
InvestmentOpportunityRatio
1.3326 1.1245 <0.0001 1.2932 1.1447 <0.0001
Tobin’sqRatio 1.0751 1.0372 0.0012 1.0775 1.0411 0.0002
Noise‐AdjustedTobin’sqRatio
1.0751 1.0375 0.0002 1.0795 1.0418 <0.0001
Market‐ValueInefficiencyRatio
0.2334 0.0536 <0.0001 0.1954 0.0579 <0.0001
Book‐ValueEquity/TotalAssets
0.1105 0.1097 0.9039 0.1098 0.1089 0.8453
(Equity+SubDebt+LoanLossReserves)/
TotalAssets0.1211 0.1331 0.0793 0.1205 0.1340 0.0098
NonperformingLoans/TotalAssets
0.0201 0.0214 0.7341 0.0210 0.0201 0.8437
31
Table7
ComparisonsofBalanceSheetsin2013forBankswithSignificantlyPositiveandNegativeDerivativesofFinancialPerformancewithRespecttoEquityCapitalRatio
Thedatasetincludes167publiclytradedtop‐tierbankholdingcompaniesattheendof2013.Thepvaluerepresentsthestatisticalsignificanceofthecomparisonofmeansinthepairing.Pairsofmeansinboldarestatisticallydifferentatstricterthanp=0.10.
∂ln(MarketValueofAssets)/∂CapitalRatio
∂Market‐ValueInefficiency/∂CapitalRatio
>0N=97
<0N=15
<0N=110
>0N=20
Mean Mean p Mean Mean P
BookValueAssets(1,000s)
3,446,971 791,823,540 0.0018 5,050,993 614,164,373 0.0018
Deposits/(Deposits+OtherBorrowedFunds)
0.9186 0.6242 0.0012 0.9122 0.6721 0.0012
NoninterestIncome/TotalRevenue
0.1994 0.4913 <0.0001 0.2078 0.4762 <0.0001
LiquidAssets/Assets 0.2721 0.3601 0.0850 0.2699 0.3439 0.0938
TotalLoans/TotalAssets
0.6633 0.4473 0.0050 0.6613 0.4907 0.0060
ResidentialRealEstateLoans/TotalAssets
0.2207 0.1370 0.0074 0.2125 0.1424 0.0080
CommercialRealEstateLoans/Total
Assets0.2778 0.0521 <0.0001 0.2780 0.0711 <0.0001
ConsumerLoans/TotalAssets
0.0288 0.0862 0.0264 0.0294 0.0779 0.0162
BusinessLoans/TotalAssets
0.1026 0.0996 0.8878 0.1120 0.1274 0.5234

32
Table82007FinancialPerformanceRegressions
The data represent 142 top‐tier, publicly traded U. S. bank holding companies at year‐end 2007. The data areobtained from the Y9‐C Call Reports, Compustat, and the Corporate Library. Performance is measured by theln(marketvalueofassets)andmarket‐valueinefficiency.RegressionsareestimatedwithOLS,andstandarderrorsareheteroscedasticityconsistent.DefinitionsofthevariablesaregiveninTable1.
Variable
DependentVariable
ln(MarketValueofAssets) Market‐ValueInefficiency
GeneralSpecification FinalSpecification GeneralSpecification FinalSpecification
ParameterEstimate
Pr>|t|ParameterEstimate
Pr>|t|ParameterEstimate
Pr>|t|ParameterEstimate
Pr>|t|
Intercept 0.13844 0.7533 ‐0.05189 0.8545 7.31855 <0.0001 7.34252 <0.0001NonperformingLoans/Assets
‐0.67809 0.0088 ‐0.66483 0.0099 0.75173 <0.0001 0.76133 <0.0001
ManagerialOwnershipln(B.V.Assets)
0.03316 0.6017 ‐0.19395 0.0063 ‐0.18588 0.0086
ManagerialOwnershipInv’tOpp’tyRatio
‐0.45266 0.6027 2.53973 0.0079 2.42871 0.0105
ManagerialOwnership2ln(B.V.Assets)
‐0.04628 0.6356 ‐0.00481 0.0148 0.27328 0.0084 0.25987 0.0133
ManagerialOwnership2Inv’tOpp’tyRatio
0.56530 0.6741 ‐3.53148 0.0130 ‐3.34379 0.0199
BlockholderOwnershipln(B.V.Assets)
‐0.00580 0.7327 0.05921 0.0007 0.05778 <0.0001
BlockholderOwnershipInv’tOpp’tyRatio
0.06358 0.8062 ‐0.84565 0.0008 ‐0.82201 0.0001
Loans/Assets 0.38876 0.0094 0.36718 0.0006 0.12573 0.4033 0.07407 0.0229ResidentialRealEstateLoans/Assets
0.00466 0.9535 ‐0.01902 0.8100
CommercialRealEstateLoans/Assets
‐0.01280 0.8554 ‐0.00864 0.9011
ConsumerLoans/Assets 0.13241 0.2500 0.10526 0.1690 ‐0.13041 0.1297 ‐0.13423 0.0601
BusinessLoans/Assets 0.01654 0.8791 0.00795 0.9314
LiquidAssets/Assets 0.43322 0.0007 0.43352 0.0002 0.04819 0.7105
NoninterestIncome/TotalIncome
0.21069 <0.0001 0.21166 <0.0001 ‐0.01514 0.7332
Deposits/TotalBorrowedFunds
‐0.04135 0.2873 ‐0.01087 0.7687
EquityCapital/Assets ‐1.17943 0.5936 ‐2.87239 0.2571 ‐3.18169 0.2045EquityCapital/Assetsln(B.V.Assets)
‐0.10135 0.2957 ‐0.13707 0.0069 0.27304 0.0302 0.27177 0.0265
EquityCapital/AssetsInv’tOpp’tyRatio
2.42668 0.0310 1.80742 0.0093 ‐1.27077 0.2608 ‐1.02550 0.3608
ln(B.V.Assets) 0.94103 <0.0001 0.95667 <0.0001 ‐0.75182 <0.0001 ‐0.75002 <0.0001(ln(B.V.Assets))2 0.00192 0.1910 0.00164 0.1521 0.01891 <0.0001 0.01884 <0.0001Number+,‐CapitalRatioDerivatives
33+,109
‐ 46+,96‐
Number+,‐StatisticallySignificantCapitalRatioDerivatives
0+,29‐ 13+,61‐
Adj.R2=0.999
N=142 Adj.R2=0.999
N=142 Adj.R2=0.964
N=142 Adj.R2=0.966
N=142

33
Table9
DerivativeofPerformancewithRespecttoEquityCapitalRatio
for2007BanksSubjecttoEnhancedPrudentialSupervisionUndertheDodd‐FrankAct
Thefullsampleconsistsof142publiclytraded,top‐tier,U.S.bankholdingcompaniesatyear‐end2007.ThedataareobtainedfromtheY9‐CCallReports,Compustat,andtheCorporateLibrary.Performanceismeasuredbytheln(marketvalueofassets)andmarket‐valueinefficiency.Thevalueofthederivativesofln(marketvalueassets(1000s))andmarket‐valueinefficiencywithrespecttoequitycapitalisgivenforthe17bankswhoseconsolidatedassetsexceed$50billionin2007,whichsubjectsthemtoenhancedprudentialsupervisionunderthe2010Dodd‐FrankAct.
PanelA
ln(MarketValueAssets(1000s)) Market‐ValueInefficiencyRatio
NameBook‐ValueAssets(1000s)
∂ln(marketvalueassets)/∂(equitycapitalratio)
pvalue
NameBook‐ValueAssets(1000s)
∂(marketvalue
inefficiency/∂(equity
capitalratio)
pvalue
1 CITIGROUP 2,187,631,104 ‐1.07774 0.0086 CITIGROUP 2,187,631,104 1.60196 0.0365
2BANKOF
AMERCORP1,720,688,384 ‐0.98173 0.0095
BANKOFAMERCORP
1,720,688,384 1.50090 0.0441
3JPMORGANCHASE&CO
1,562,146,944 ‐1.01067 0.0091JPMORGANCHASE&CO
1,562,146,944 1.49857 0.0396
4WELLSFARGO
&CO575,441,984 ‐0.75080 0.0135
WELLSFARGO&CO
575,441,984 1.15738 0.0649
5 USBC 237,615,008 ‐0.65042 0.0167 USBC 237,615,008 0.92884 0.0728
6 SUNTRUSTBK 179,573,936 ‐0.58261 0.0210 SUNTRUSTBK 179,573,936 0.83603 0.0879
7 REGIONSFC 141,043,936 ‐0.58355 0.0203 REGIONSFC 141,043,936 0.78971 0.0829
8PNCFNCLSVC
GROUP138,976,256 ‐0.60743 0.0184
PNCFNCLSVCGROUP
138,976,256 0.80040 0.0751
9 BB&TCORP 132,617,600 ‐0.57566 0.0208 BB&TCORP 132,617,600 0.77329 0.0844
10FIFTHTHIRD
BC110,961,512 ‐0.61655 0.0172
FIFTHTHIRDBC
110,961,512 0.76190 0.0686
11 KEYCORP 99,567,392 ‐0.55542 0.0219 KEYCORP 99,567,392 0.70620 0.0862
12NORTHERNTR
CORP67,611,224 ‐0.45462 0.0358
NORTHERNTRCORP
67,611,224 0.57391 0.1255
13 M&TBKCORP 64,875,640 ‐0.48587 0.0295 M&TBKCORP 64,875,640 0.58363 0.1085
14 COMERICA 62,756,752 ‐0.50095 0.0270 COMERICA 62,756,752 0.58575 0.1009
15UNIONBANCAL
CORP55,727,748 ‐0.36682 0.0643
UNIONBANCALCORP
55,727,748 0.48660 0.1833
16HUNTINGTON
BSHRS54,629,164 ‐0.55056 0.0206
HUNTINGTONBSHRS
54,629,164 0.58698 0.0798
17 ZIONSBC 52,947,444 ‐0.36397 0.0652 ZIONSBC 52,947,444 0.47505 0.1856

34
Table9,continued
Thederivativesoftheln(marketvalueofassets)areorderedbytheirstatisticalsignificanceforallvaluessignificantatleastat10percent.
PanelB
ln(MarketValueAssets(1000s))
NameBook‐ValueAssets(1000s)
∂ln(marketvalueassets)/∂(equitycapitalratio)
pvalue
1 CITIGROUP 2,187,631,104 ‐1.07774 0.0086
2 JPMORGANCHASE&CO 1,562,146,944 ‐1.01067 0.0091
3 BANKOFAMERCORP 1,720,688,384 ‐0.98173 0.0095
4 WELLSFARGO&CO 575,441,984 ‐0.75080 0.0135
5 USBC 237,615,008 ‐0.65042 0.0167
6 FIFTHTHIRDBC 110,961,512 ‐0.61655 0.0172
7 PNCFNCLSVCGROUP 138,976,256 ‐0.60743 0.0184
8 REGIONSFC 141,043,936 ‐0.58355 0.0203
9 HUNTINGTONBSHRS 54,629,164 ‐0.55056 0.0206
10 BB&TCORP 132,617,600 ‐0.57566 0.0208
11 SUNTRUSTBK 179,573,936 ‐0.58261 0.0210
12 KEYCORP 99,567,392 ‐0.55542 0.0219
13 COMERICA 62,756,752 ‐0.50095 0.0270
14 M&TBKCORP 64,875,640 ‐0.48587 0.0295
15 NORTHERNTRCORP 67,611,224 ‐0.45462 0.0358
16 FIRSTHORIZONNATCORP 37,017,240 ‐0.41211 0.0430
17 NEWYORKCMNTYBC 30,599,738 ‐0.38809 0.0496
18 BANKOFHICORP 10,472,942 ‐0.36231 0.0502
19 UNIONBANCALCORP 55,727,748 ‐0.36682 0.0643
20 ZIONSBC 52,947,444 ‐0.36397 0.0652
21 ASSOCIATEDBANCCORP 21,592,084 ‐0.33739 0.0698
22 FIRSTMERITCORP 10,407,565 ‐0.31606 0.0741
23 TCFFC 16,067,612 ‐0.31430 0.0810
24 COMMERCEBSHRS 16,212,371 ‐0.31314 0.0820
25 WEBSTERFNCLCORP 17,208,062 ‐0.30487 0.0891
26 WHITNEYHC 11,029,846 ‐0.29230 0.0928
27 CENTRALPACIFICFNCLCORP 5,680,386 ‐0.27814 0.0947
28 FULTONFNCLCORP 15,923,098 ‐0.29563 0.0956
29 FIRSTCITIZENSBSHRS 16,229,958 ‐0.29242 0.0987

35
Table10
ComparisonsofFinancialPerformancein2007forBankswithPositiveandSignificantlyNegativeDerivativesofFinancialPerformancewithRespecttoEquityCapitalRatio
Thedatasetincludes142publiclytradedtop‐tierbankholdingcompaniesattheendof2007.Thereare33bankswithapositivevaluedderivativeoftheln(marketvalueofassets),butnoneofthesevaluesarestatisticallysignificant.Hence,lackinganystatisticallysignificantpositivevalues,these33banksareusedinthecomparisonofmeanswiththe29bankswhosenegativederivativeissignificantlydifferentfrom0.Inthecaseofthederivativeofmarket‐valueinefficiencywithrespecttothecapitalratio,thereare61bankswithastatisticallysignificantnegativederivativeand13bankswithastatisticallysignificantpositivederivative.Thepvaluerepresentsthestatisticalsignificanceofthecomparisonofmeansinthepairing.Pairsofmeansinboldarestatisticallydifferentatstricterthanp=0.10. ∂ln(MarketValueofAssets)/∂Capital
Ratio∂Market‐ValueInefficiency/∂CapitalRatio
>0N=33
<0N=29
<0N=61
>0N=13
Mean Mean P Mean Mean P
∂Performance/∂CapitalRatio 0.0756 ‐0.5042 <0.0001 ‐0.3769 0.9637 <0.0001
BookValueAssets(1,000s)
1,815,671 263,905,273 0.0172 2,154,360 554,126,921 0.0207
InvestmentOpportunityRatio
1.1295 1.0852 <0.0001 1.1128 1.0813 0.0015
Tobin’sqRatio 1.0645 1.0749 0.3599 1.0626 1.0703 0.4943
Noise‐AdjustedTobin’sqRatio
1.0490 1.0779 0.0051 1.0530 1.0715 0.0592
Market‐ValueInefficiencyRatio
0.4968 0.1036 <0.0001 0.4577 0.0631 <0.0001
Book‐ValueEquity/TotalAssets
0.0915 0.0923 0.8665 0.0917 0.0909 0.8866
(Equity+SubDebt+LoanLossReserves)/
Assets0.1010 0.1204 0.0004 0.1008 0.1260 <0.0001
NonperformingLoans/Assets
0.0191 0.0173 0.6544 0.0176 0.0215 0.2162

36
Table11
ComparisonsofBalanceSheetsforBanksin2007withPositiveandSignificantlyNegativeDerivativesofFinancialPerformancewithRespecttoEquityCapitalRatio
Thedatasetincludes142publiclytradedtop‐tierbankholdingcompaniesattheendof2007.Thereare33bankswithapositivevaluedderivativeoftheln(marketvalueofassets),butnoneofthesevaluesarestatisticallysignificant.Hence,lackinganystatisticallysignificantpositivevalues,these33banksareusedinthecomparisonofmeanswiththe29bankswhosenegativederivativeissignificantlydifferentfrom0.Inthecaseofthederivativeofmarket‐valueinefficiencywithrespecttothecapitalratio,thereare61bankswithastatisticallysignificantnegativederivativeand13bankswithastatisticallysignificantpositivederivative.Thepvaluerepresentsthestatisticalsignificanceofthecomparisonofmeansinthepairing.Pairsofmeansinboldarestatisticallydifferentatstricterthanp=0.10. ∂ln(MarketValueofAssets)/∂Capital
Ratio∂Market‐ValueInefficiency/∂CapitalRatio
>0N=33
<0N=29
<0N=61
>0N=13
Mean Mean P Mean Mean P
BookValueAssets(1,000s)
1,815,671 263,905,273 0.0172 2,154,360 554,126,921 0.0207
Deposits/(Deposits+OtherBorrowedFunds)
0.8678 0.6833 <0.0001 0.8649 0.6341 0.0010
NoninterestIncome/TotalRevenue 0.1275 0.2496 <0.0001 0.1468 0.2776 <0.0001
LiquidAssets/Assets 0.2029 0.2065 0.8840 0.2128 0.1794 0.2132
TotalLoans/TotalAssets
0.7410 0.6670 0.0121 0.7244 0.6427 0.0741
ResidentialRealEstateLoans/TotalAssets 0.1951 0.2510 0.0465 0.2170 0.2180 0.9720
CommercialRealEstateLoans/Total
Assets0.3694 0.1617 <0.0001 0.3256 0.1243 <0.0001
ConsumerLoans/TotalAssets 0.0383 0.0618 0.0444 0.0419 0.0816 0.0022
BusinessLoans/TotalAssets
0.1226 0.1432 0.2703 0.1168 0.1531 0.0951