lockdowns disrupt consumer services sectors again in july
TRANSCRIPT
https://www.aigroup.com.au/resourcecentre/economics/
Lockdowns disrupt consumer services
sectors again in July
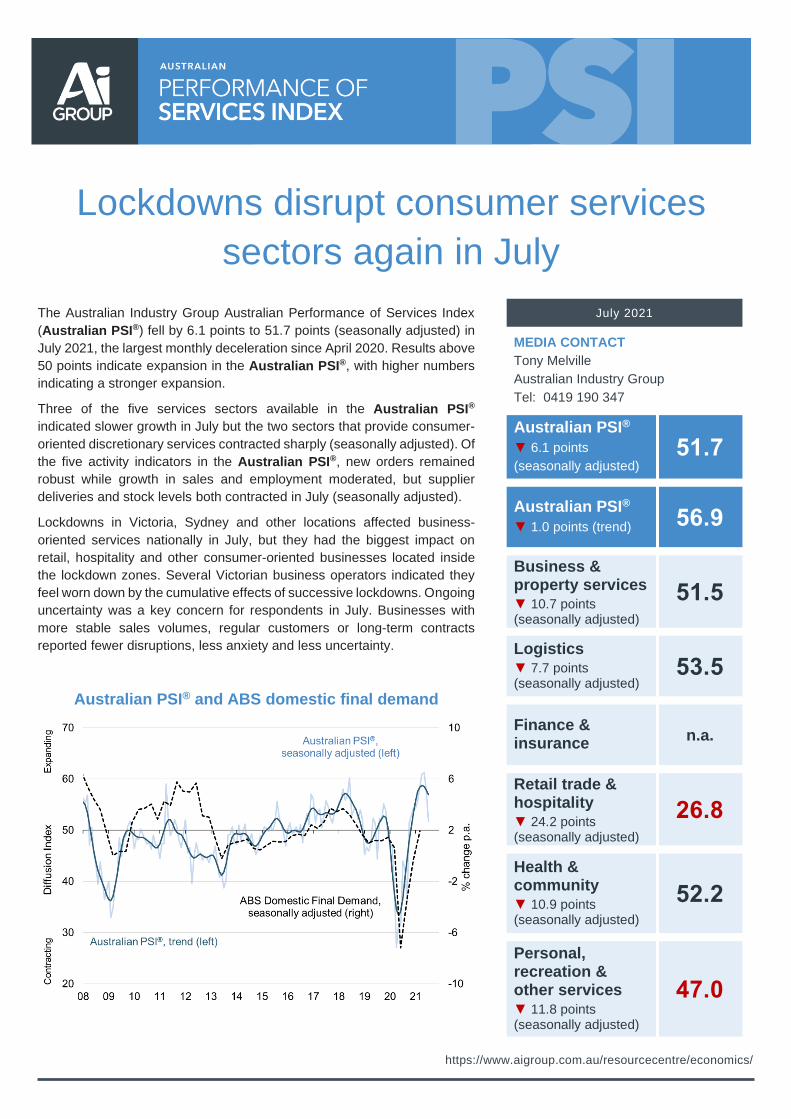
The Australian Industry Group Australian Performance of Services Index
(Australian PSI®) fell by 6.1 points to 51.7 points (seasonally adjusted) in
July 2021, the largest monthly deceleration since April 2020. Results above
50 points indicate expansion in the Australian PSI®, with higher numbers
indicating a stronger expansion.
Three of the five services sectors available in the Australian PSI®
indicated slower growth in July but the two sectors that provide consumer-
oriented discretionary services contracted sharply (seasonally adjusted). Of
the five activity indicators in the Australian PSI®, new orders remained
robust while growth in sales and employment moderated, but supplier
deliveries and stock levels both contracted in July (seasonally adjusted).
Lockdowns in Victoria, Sydney and other locations affected business-
oriented services nationally in July, but they had the biggest impact on
retail, hospitality and other consumer-oriented businesses located inside
the lockdown zones. Several Victorian business operators indicated they
feel worn down by the cumulative effects of successive lockdowns. Ongoing
uncertainty was a key concern for respondents in July. Businesses with
more stable sales volumes, regular customers or long-term contracts
reported fewer disruptions, less anxiety and less uncertainty.
Australian PSI® and ABS domestic final demand
July 2021
MEDIA CONTACT
Tony Melville
Australian Industry Group
Tel: 0419 190 347
Australian PSI®
▼ 6.1 points
(seasonally adjusted) 51.7
Australian PSI®
▼ 1.0 points (trend) 56.9
Business & property services ▼ 10.7 points (seasonally adjusted)
51.5
Logistics ▼ 7.7 points (seasonally adjusted)
53.5
Finance & insurance
n.a.
Retail trade & hospitality ▼ 24.2 points (seasonally adjusted)
26.8
Health & community ▼ 10.9 points (seasonally adjusted)
52.2
Personal, recreation & other services ▼ 11.8 points (seasonally adjusted)
47.0
For more detail about the Ai Group Australian PSI® visit: https://www.aigroup.com.au/resourcecentre/economics/
Business-oriented services sectors: The business oriented sectors in the Australian PSI® expanded in July (seasonally
adjusted) but the pace of expansion moderated substantially. Activity from the construction sector and low interest rates
remain key drivers for respondents involved in the property and business services sector. Logistics (transport, storage and
wholesale trade) saw a fall in demand for freight transport and related services and reduced access to sites as a result of
lockdowns. Respondents in the business-oriented sectors became more pessimistic later in the month, as the effects of
successive lockdowns across mulitple locations became cumulative.
Consumer-oriented services sectors: Of the three consumer-orientied sectors, only health & education services
expanded in July, albeit at a slower pace (seasonally adjusted). The retail trade & hospitality sector reported large falls in
activity, while ‘personal, recreation and other services’ also shrank. Lockdowns in Victoria and NSW dampened demand
for tourism-related businesses nationally, but the hospitality and retail effects were felt most intensely in those two states.
Activity restrictions, loss of customer income and ongoing uncertainty all inhibited sales during July.
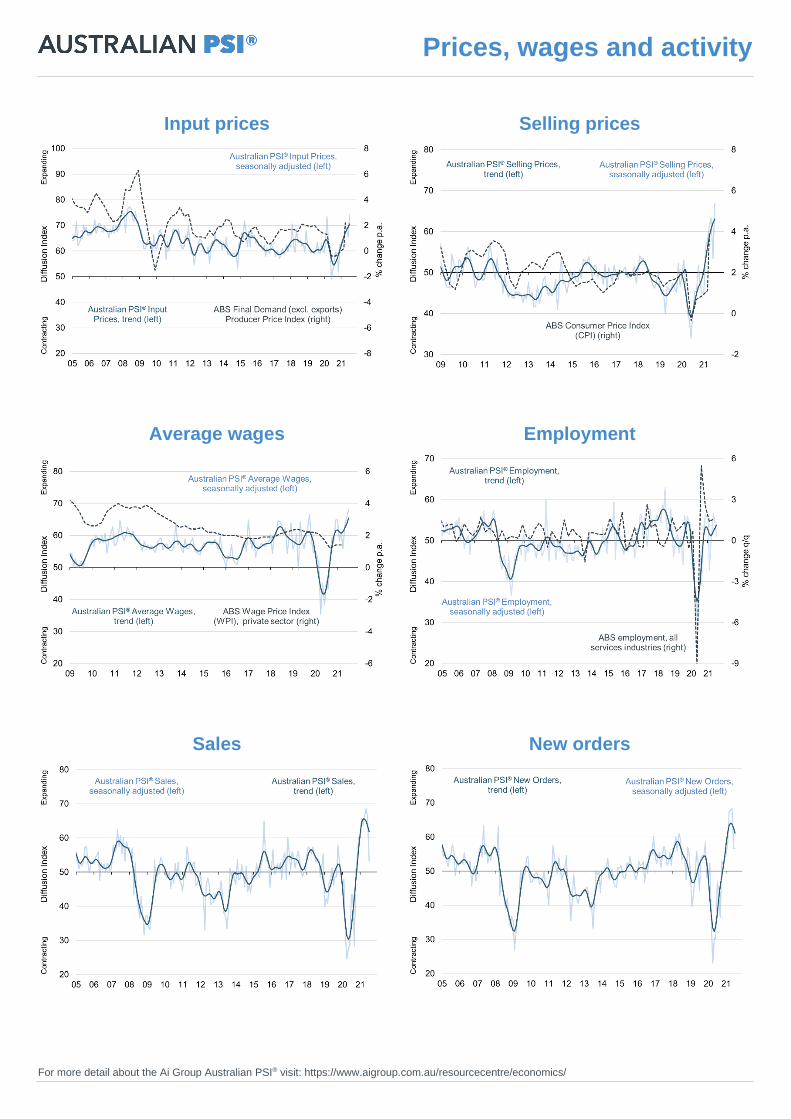
Services prices and wages: The input price index increased further in July (seasonally adjusted). This marked thirteen
months of input price increases following a record low for this index in June 2020. The average wage index rose to a new
record high in July, indicating increasing wage pressures for services businesses that are seeking skilled staff. Selling
prices increased for a sixth consecutive month, as more businesses pass on their rising input costs to their customers.
Services activity, orders, employment and deliveries: The sales index expanded but slowed significantly in July,
indicating a slow patch following months of solid recovery (seasonally adjusted). New orders remained elevated following
a series high in May 2021. Employment growth in services sectors eased in July but remained positive for a fourth month.
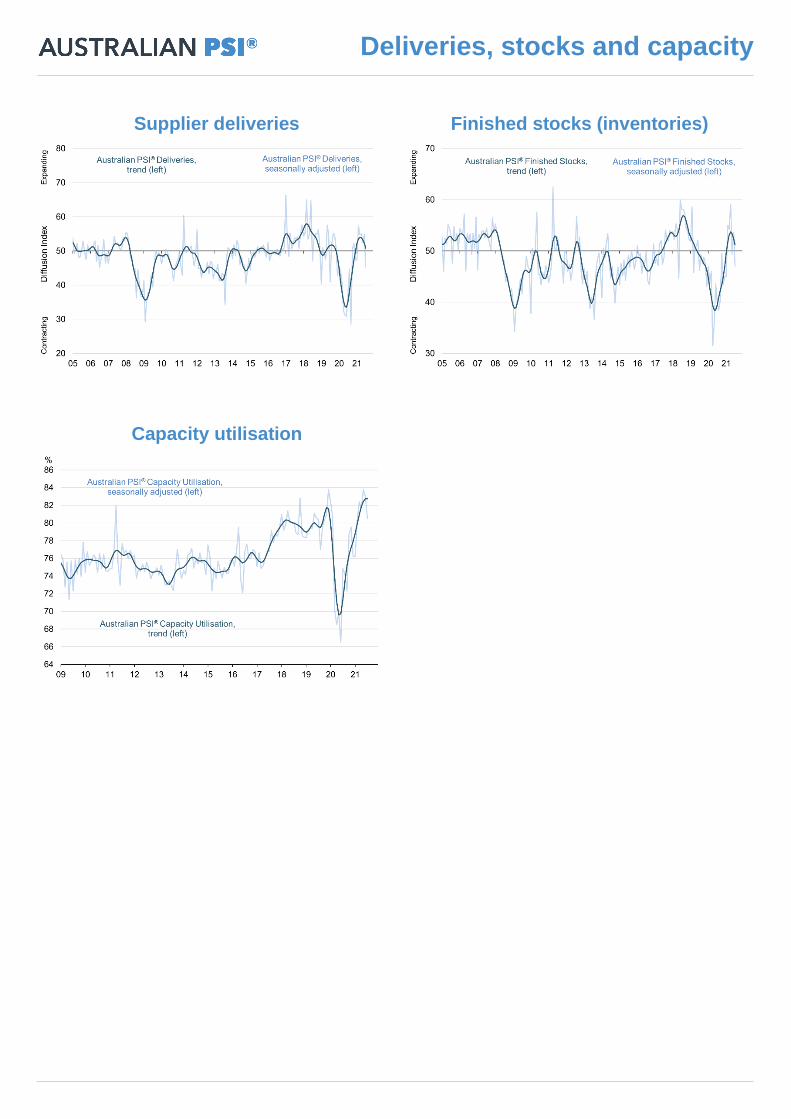
The supplier deliveries and inventories indexes both contracted in July, following several months of recovery earlier in 2021.
Capacity utilisation fell by 2.5 percentage points to 80.5% of available capacity being utilised across the services sectors
in July 2021. This index has been elevated for at least the past four months and is well above its own long term average of
76.4%. This ongoing strength in capacity utilisation suggests that many businesses will need to increase their business
investment and employment levels to facilitate further growth in capacity during the remainder of 2021.
Services highlights: For some participants the rapid recovery in the first half of 2021 led to stable demand and activity
despite the lockdowns that affected much of the country in July. Activity levels remained solid but fell from the highs seen
earlier in 2021. For business-oriented businesses, demand for professional and related services is being mainained by low
interest rates, continuing ‘boom’ activity in residential construction and stable demand from mining sector customers.
Services concerns: The Victorian and New South Wales lockdowns impacted businesses nationally in July, further
compounded by intermittent activity restrictions in other parts of the country. Businesses in Victoria and NSW reported the
largest constraints and direct impacts from these lockdowns. Uncertainty is an ongoing concern for many respondents.
They reported difficulty with planning during lockdowns and restrictions. The prospect of future lockdowns remains a risk.
Australian PSI® key numbers (seasonally adjusted)
Index this month
Change from
last month
12-month average
Australian PSI® sectors
Index this
month
Change from
last month
12-month average
Australian PSI® (s.a.) 51.7 -6.1 50.1 Australian PSI® (trend) 56.9 -1.0 50.0
Activity indexes seasonally adjusted
Business-oriented services Seasonally adjusted
Sales 53.2 -12.9 50.6 Business & property 51.5 -10.7 50.9
Employment 51.0 -3.2 50.2 Logistics 53.5 -7.7 47.5
New Orders 56.7 0.1 50.8 Finance & insurance na na na
Supplier deliveries 45.3 -9.6 48.8 Consumer-oriented services Seasonally adjusted
Finished stocks 47.0 -6.7 48.9
Capacity Utilisation (%) 80.5 -2.5 76.4 Retail trade & hospitality 26.8 -24.2 47.9
Prices and wages Health & education 52.2 -10.9 51.9
Input Prices 74.1 8.7 63.9 Personal, recreational 47.0 -11.8 53.3
Selling Prices 66.7 13.2 48.7 & other services
Average Wages 68.0 2.0 57.0
Results above 50 points indicate expansion. Trend indexes in the Australia PSI® are calculated with a Henderson 13-month filter formula.
na. Results are not available for this sector in this period due to unusually low survey response numbers. All sectors are included in the total results.
Summary
For more detail about the Ai Group Australian PSI® visit: https://www.aigroup.com.au/resourcecentre/economics/
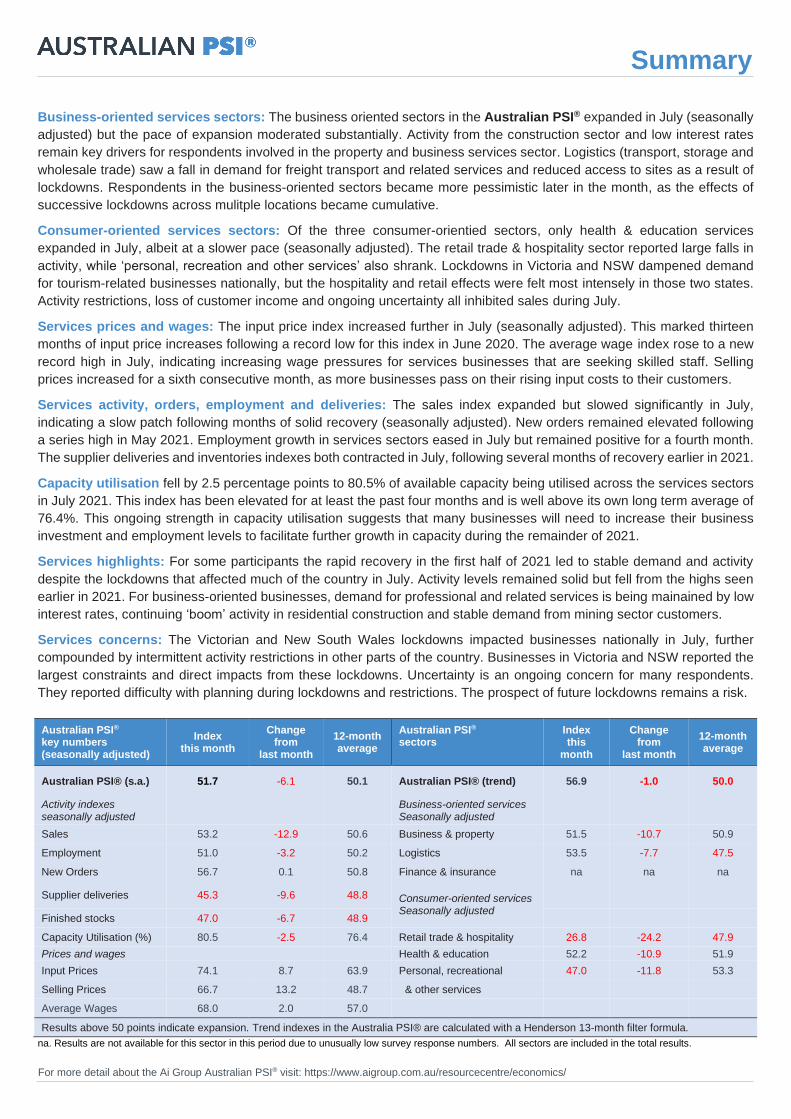
Business and property services
• Business & property services include professional
services (accounting, legal and consulting), IT, media,
telecommunications, administrative services, real estate &
property management services. This sector produced
$289.8bn in real value-added output in the year to Q1 2021
(equal to 15.0% of GDP, ABS data).
• Business & property services employed 2,049,000 people
in May 2021 (15.6% of total employment).
• The index for business & property services fell by 10.7
points to 51.5 points (seasonally adjusted) in July 2021,
indicating a strong moderation in conditions following four
months of solid recovery.
• There were mixed results from this large sector as a
proportion of respondents reported deflating actvity due to
a resurgence in restrictions, particularly in Victoria. For
those reporting good conditions, positive factors included
ongoing low interest rates and strong activity from
construction and mining services customers.
Logistics services
• Logistics includes wholesale trade, transport and storage
services. It produced $147.2bn in real value-added output
in the year to Q1 2021 (equal to 7.6% of GDP, ABS data).
• Logistics employed 1,011,600 people in May 2021 (7.7%
of total employment).
• The logistics index fell by 7.7 points to 53.5 points in July,
indicating a slower pace of growth following five months of
solid recovery.
• Responses collected earlier in July listed easing
restrictions as a positive impact on conditions. Later in the
month, a return to restricted activity in Victoria as well as
increases in restrictions in NSW were reported to have
significantly dampened trade. A fall in customer demand,
reduced access to customer sites, difficulties sourcing
stock locally and closures of some customers all inhibited
activity for logistics businesses throughout July.
• Some logistics respondents reported ongoing strength in
sales to construction sector customers, fulfilment of export
orders and a pickup in domestic customers seeking to
source products locally rather than from overseas.
Business services sectors
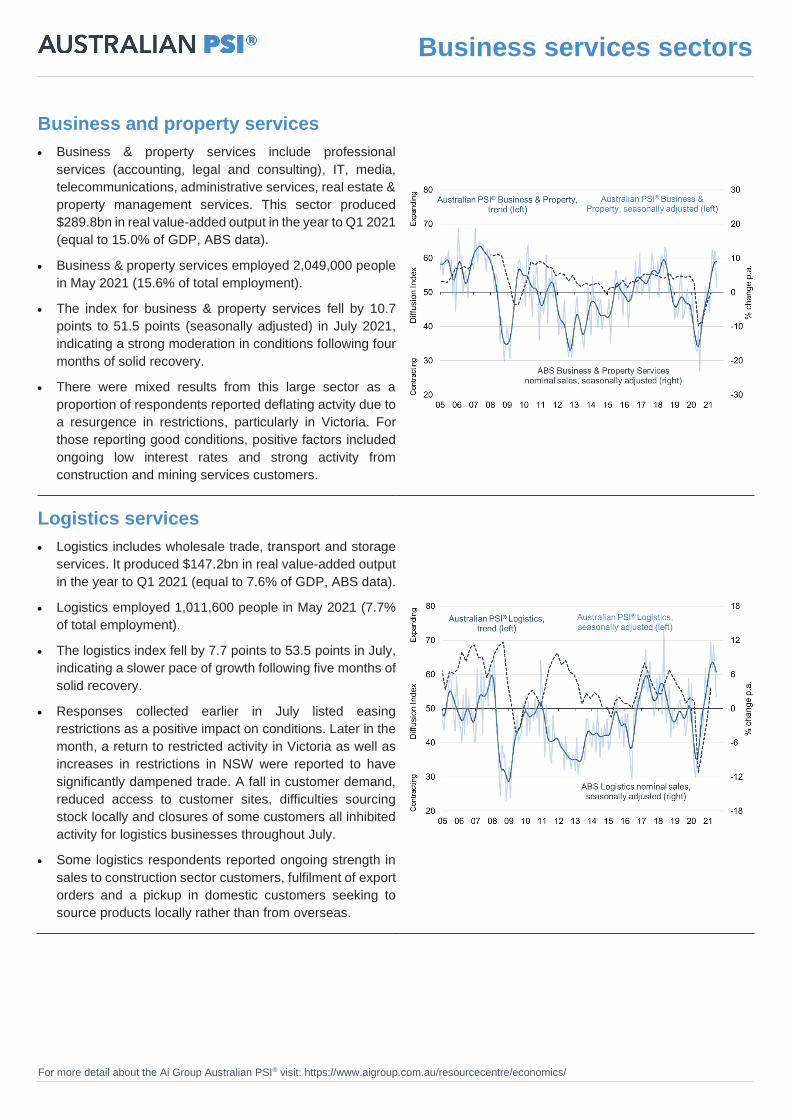
Retail trade & hospitality services
• The retail trade & hospitality sector (including shops,
restaurants, cafes, take-aways, hotels & accommodation)
produced $117.5bn in real value-added output in the year
to Q1 2021 (equal to 6.1% of GDP, ABS).
• It employed 2,182,900 people in May 2021 (16.6% of total
employment). Most retail & hospitality workers are part-
time (under 35 hours per week).
• The index for the retail trade & hospitality sector fell 24.2
points to 26.8 points in July (seasonally adjusted). This
was the lowest result for this index since April 2020.
• The fifth Victorian lockdown was felt most keenly within
Victoria, but accommodation businesses nationally
reported a loss of customers from that state. Other state
border restrictions during July affected tourism-related
businesses nationally. Some retailers indicated a lack of
recovery prior to the latest lockdowns. Businesses that
were less directly affected by lockdowns said they were
concerned about stock and staff shortages in July.
Health, education & community services
• Health, education & community services produced
$241.1bn in real value-added output in the year to Q1 2021
(12.5% of GDP, ABS).
• This group of industries employed 2,980,200 people in
May 2021 (22.7% of total employment). 56% of workers in
education and 25% of workers in health and welfare are
employed directly by the public sector.
• The index for this sector fell by 10.9 points to 52.2 points
(seasonally adjusted in July). Demand for health and
welfare services remained consistent, but education and
related businesses in this sector reported a fall in demand.
Personal, recreational & other services
• Personal, recreational, & other services produced $44.5bn
in real value-added output in the year to Q1 2021 (equal to
2.3% of GDP, ABS data).
• This sector employed 783,000 people in May 2021 (6.0%
of total employment).
• The index for ‘recreational, personal & other’ services fell
by 11.8 points to 47.0 points (seasonally adjusted)
indicating deteriorating conditions in July. Some
businesses reported consistent demand from regular
customers, but many others reported a fall in customer
demand and/or disruption due to activity restrictions.
Consumer services sectors
For more detail about the Ai Group Australian PSI® visit: https://www.aigroup.com.au/resourcecentre/economics/
Input prices
Selling prices
Average wages
Employment
Sales
New orders
Prices, wages and activity
Supplier deliveries
Finished stocks (inventories)
Capacity utilisation
Deliveries, stocks and capacity
Business services sectors
The Australian PSI® classifies each business according to their main activity using the industry data codes and definitions
set out in the ANZSIC 2006. These match ABS data that use the same codes. The 6 sectors in the Australian PSI® are:
1. Business, Property, Information & Telecommunications services - Divisions J, L, M and N - includes businesses
engaged in renting, hiring, or otherwise allowing the use of tangible or intangible assets (except copyrights), and
businesses providing related services; businesses mainly engaged in providing professional, scientific and technical
services; and businesses mainly engaged in performing routine support activities for the day-to-day operations of
other businesses or organisations; businesses mainly engaged in: creating, enhancing and storing information
products in media that allows for their dissemination; transmitting information products using analogue and digital
signals (via electronic, wireless, optical and other means); and providing transmission services and/or operating the
infrastructure to enable the transmission and storage of information and information products.
2. Logistics (Wholesale Trade, Transport & Storage) - Divisions I and F - includes businesses engaged in the
purchase and onselling, the commission-based buying, and/or the commission-based selling of goods, without
significant transformation, to businesses; businesses mainly engaged in providing transportation of passengers and
freight by road, rail, water or air. Other transportation activities such as postal services, pipeline transport and scenic
and sightseeing transport are included in this division.
3. Finance & Insurance - Division K - includes businesses engaged in financial transactions involving the creation,
liquidation, or change in ownership of financial assets, and/or in facilitating financial transactions.
Consumer services sectors
4. Retail Trade & Hospitality (Accommodation & Food Services) - Divisions G and H - includes businesses engaged
in the purchase and on-selling of goods, without significant transformation, to the public. The Retail Trade Division
also includes units that purchase and on-sell goods to the public using non-traditional means, including the internet.;
businesses providing short-term accommodation for visitors and/or meals, snacks, and beverages for consumption
by customers both on and off-site.
5. Education, Health & Community Services - Divisions P and Q - includes businesses engaged in the provision
and support of education and training, human health care, welfare and social assistance services.
6. Arts, Recreation, Personal & Other Services - Divisions R and S - includes businesses engaged in the
preservation and exhibition of objects and sites of historical, cultural or educational interest; the production of original
artistic works and/or participation in live performances, events, or exhibits intended for public viewing; and the
operation of facilities or the provision of services that enable patrons to participate in sporting or recreational
activities. Other Services includes a broad range of personal services; religious, civic, professional and other interest
group services; selected repair and maintenance activities; and private households employing staff.
What is the Australian PSI®? The Australian Industry Group Australian Performance of Services Index (Australian PSI®) is a national
composite index based on the diffusion indices for sales, new orders, deliveries, inventories and employment with varying weights. An
Australian PSI® reading above 50 points indicates that the services sector is generally expanding; below 50, that it is declining. The
distance from 50 indicates the strength of the expansion or decline. Australian PSI® results are based on responses from a national
sample of businesses. The Australian PSI® uses the ANZSIC industry classifications for industry sectors and sector weights derived
from ABS industry output data. Seasonal adjustment and trend calculations follow ABS methodology. For further economic analysis
and information from the Australian Industry Group, visit http://www.aigroup.com.au/resourcecentre/economics.
© The Australian Industry Group, 2021. This publication is copyright. Apart from any fair dealing for the purposes of private study or research permitted
under applicable copyright legislation, no part June be reproduced by any process or means without the prior written permission of The Australian Industry
Group.
Disclaimer: The Australian Industry Group provides information services to its members and others, including economic policy and information services.
None of the information provided here is represented or implied to be legal, accounting, financial or investment advice and does not constitute financial
product advice. The Australian Industry Group does not invite and does not expect any person to act or rely on any statement, opinion, representation or
interference expressed or implied in this publication. All readers must make their own enquiries and obtain their own professional advice in relation to any
issue or matter referred to herein before making any financial or other decision. The Australian Industry Group accepts no responsibility for any act or
omission by any person relying in whole or in part upon the contents of this publication.
Data definitions