lobster outlook 2018 - new brunswick · 18 inventory situation on lobster products • there are...
TRANSCRIPT

1
Lobster Outlook 2018John Sackton
Seafood DatasearchShippagan, Moncton, Shediac
March 20-22, 2018

2
Background• 40 Years in Seafood Industry
• Crab, shrimp and lobster market analyst since 1997
• Preseason price and market outlooks on shrimp, crab, lobster – Atlantic Canada, Alaska, US West Coast
• Price arbitrator for Alaska crab
• Shrimp, Crab, Lobster Analyst for NFI
• Co-Founder of NFI’s Global Seafood Market Conference
• Publisher of Seafood.com News

3
Outline for Today• OverviewofLobsterMarkets:US,China,Europe• Reviewof2017pricing(springandfall)• DifferencesinProductFormSupply
– TailsandMeat,Frozenwholecooks,Live• RoleofLobsterinUSShellfishMarket
– Foodservicesales– Retailsales
• RoleofLobsterinChina• OtherCanadianMarketsforLiveandFrozenLobster• Outlookfor2018
3

4
Global lobster supply
54,092 48,04658,137 57,706
66,265 66,09074,055 77,018
84,807 86,198 92601 91682
34,17629,019
31,710 36,820
43,640 47,593
57,748 57,97356,257 55,521
59,85350311
8,620
7,013
7,4038,176
8,9889,183
9,795 9,66610,174 10,747
11,789
7520
2006 2007 2008 2009 2010 2011 2012 2013 2014 2015 2016 2017
MetricTons
After9YearsofGrowthTotalLobsterLandingsWillDeclinein2017Canada Maine OtherUS
Seafood Datasearch and Urner Barry

5
US Domestic lobster supply fell in 2017
• Source:CustomsDataandIndustryLandingsestimates
5
-150,000,000
-100,000,000
-50,000,000
0
50,000,000
100,000,000
150,000,000
200,000,000
250,000,000
300,000,000
350,000,000
2011 2012 2013 2014 2015 2016 2017yrest
POUNDS
USlandings CanadaImports(live) USImportsMeat USImportsTails(homarus)
USimportsTails(rock/Spiny) USexportsLive(NotCa) CanadaExports(live)
6
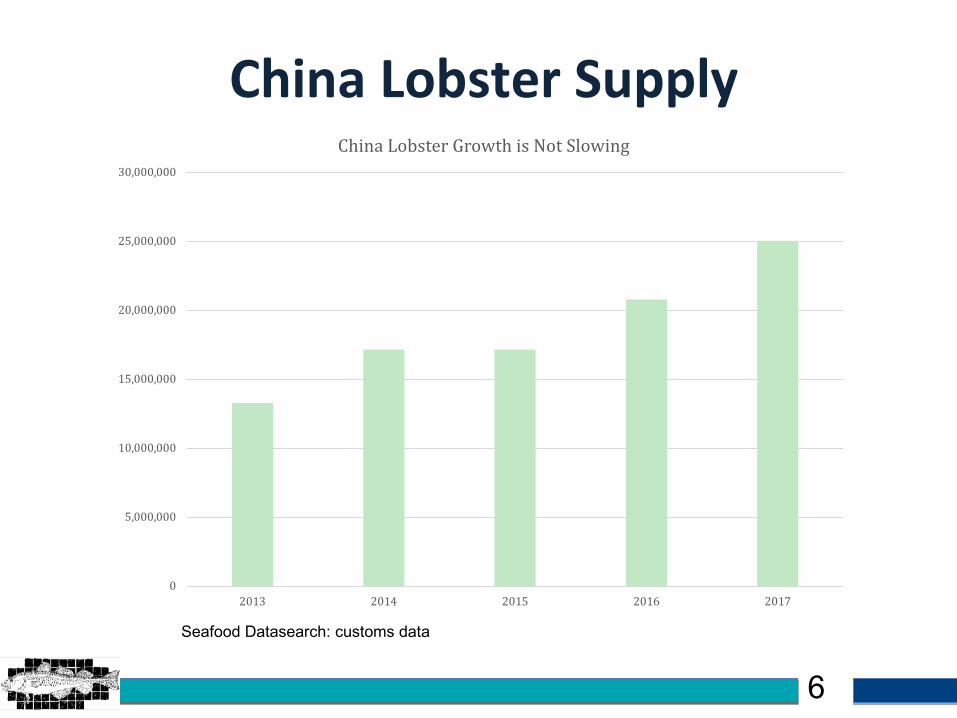
China Lobster Supply
0
5,000,000
10,000,000
15,000,000
20,000,000
25,000,000
30,000,000
2013 2014 2015 2016 2017
ChinaLobsterGrowthisNotSlowing
Seafood Datasearch: customs data

7
European Lobster Supply
0
2,000
4,000
6,000
8,000
10,000
12,000
14,000
16,000
18,000
20,000
2013 2014 2015 2016 2017
EUImportsofAllHomarusLobster
CALive USLive CAFzn USFzn
Seafood Datasearch: customs data

8
Overall Comparison of CA Live Exports
0
10000
20000
30000
40000
50000
60000
2013 2014 2015 2016 2017
LiveLobsterExportsbyMarket
CAChina CAEurope CAUS Other
Seafood Datasearch: Intracen customs data
9
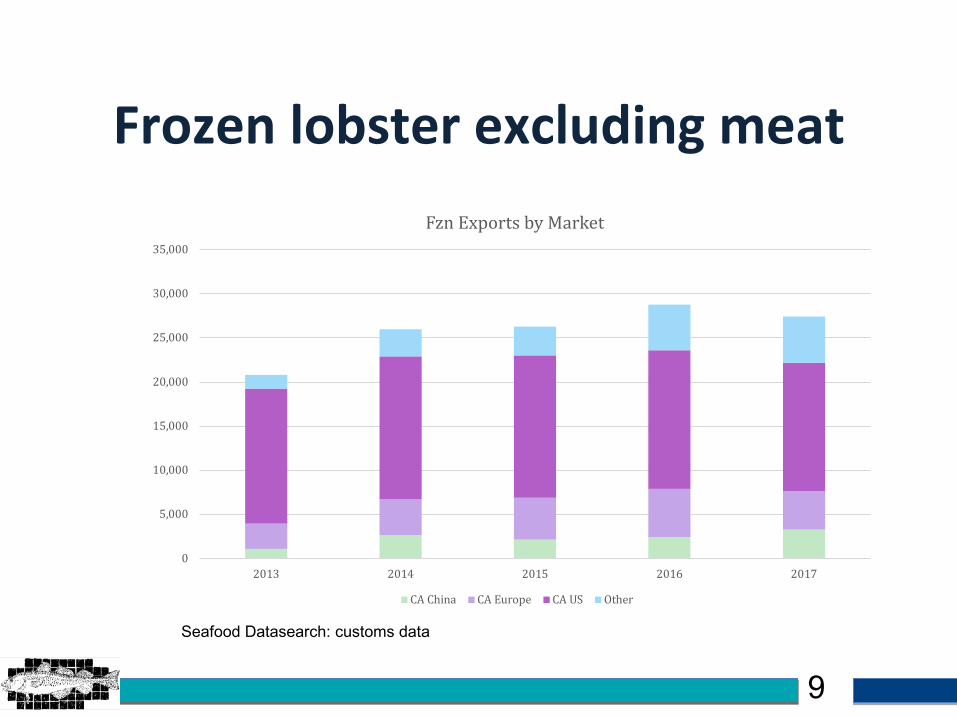
Frozen lobster excluding meat
0
5,000
10,000
15,000
20,000
25,000
30,000
35,000
2013 2014 2015 2016 2017
FznExportsbyMarket
CAChina CAEurope CAUS Other
Seafood Datasearch: customs data

10
Meat exports
0
2,000,000
4,000,000
6,000,000
8,000,000
10,000,000
12,000,000
2013 2014 2015 2016 2017
LobsterMeat
Seafood Datasearch: customs data

11
US Meat and tail pricingCK meat vac pack
Tails – left axisMeat – right axis
Seafood Datasearch and Urner Barry

12
US Live Pricing
Seafood Datasearch and Urner Barry
13
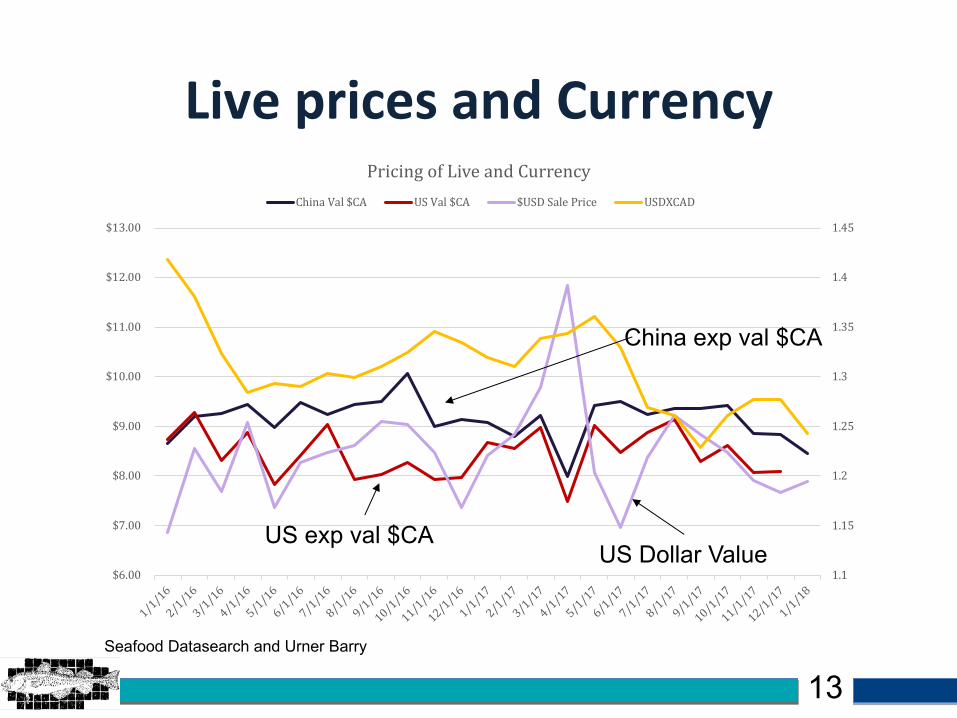
Live prices and Currency
1.1
1.15
1.2
1.25
1.3
1.35
1.4
1.45
$6.00
$7.00
$8.00
$9.00
$10.00
$11.00
$12.00
$13.00
1/1/162/1/163/1/164/1/165/1/166/1/167/1/168/1/169/1/16
10/1/16
11/1/16
12/1/161/1/172/1/173/1/174/1/175/1/176/1/177/1/178/1/179/1/17
10/1/17
11/1/17
12/1/171/1/18
PricingofLiveandCurrencyChinaVal$CA USVal$CA $USDSalePrice USDXCAD
Seafood Datasearch and Urner Barry
China exp val $CA
US exp val $CAUS Dollar Value

14
Canadian Export Price to China
$-
$2.00
$4.00
$6.00
$8.00
$10.00
$12.00
0
2000000
4000000
6000000
8000000
10000000
12000000
14000000
1/1/16
2/1/16
3/1/16
4/1/16
5/1/16
6/1/16
7/1/16
8/1/16
9/1/16
10/1/16
11/1/16
12/1/16
1/1/17
2/1/17
3/1/17
4/1/17
5/1/17
6/1/17
7/1/17
8/1/17
9/1/17
10/1/17
11/1/17
12/1/17
1/1/18
LiveVolumeandPricetoUSandChina($CA)
Chinaqty usqty ChinaVal$CA USVal$CA
Seafood Datasearch

15
Shore Prices
3.5
4
4.5
5
5.5
6
6.5
7
7.5
8
8.5
04/05/16
05/05/16
06/05/16
07/05/16
08/05/16
09/05/16
10/05/16
11/05/16
12/05/16
01/05/17
02/05/17
03/05/17
04/05/17
05/05/17
06/05/17
07/05/17
08/05/17
09/05/17
10/05/17
ShorePrices2016and2017PEICNR NBN.ShoreCNR PEI NBN.Shore NSN.Shore Newfoundland
Seafood Datasearch

16
Tail - 20-24%
Claw knuckle leg meat:9% to 13%
Live - 100%
Whole Cooked - 86%(average cook loss, can be reduced about 5% with STP)
Yield is key to understanding Lobster pricing and why live lobster
demand sets shore prices
Calculations based on averageof 22% for tails and 11% for meat

17
Breakdown of 500 lbs lobster by raw material pounds and cost at various shore
pricesCostatShorePrice
Livelbs WholeCooklbs
Tailslbs Meat;bs Processed(tails/meat)
100% 86% 22% 11%lbs 500 430 110 55 1655.00 $5.00 5.81 22.73 45.45 15.156.00 $6.00 6.98 27.27 54.55 18.187.00 $7.00 8.14 31.82 63.64 21.21
At a $6.00 shore price, a lobster processor would havean input cost of $6.98 for whole cooks, and $18.18 formeat and tails. (Converted to US at $1.25 = $5.58, $14.54)
18
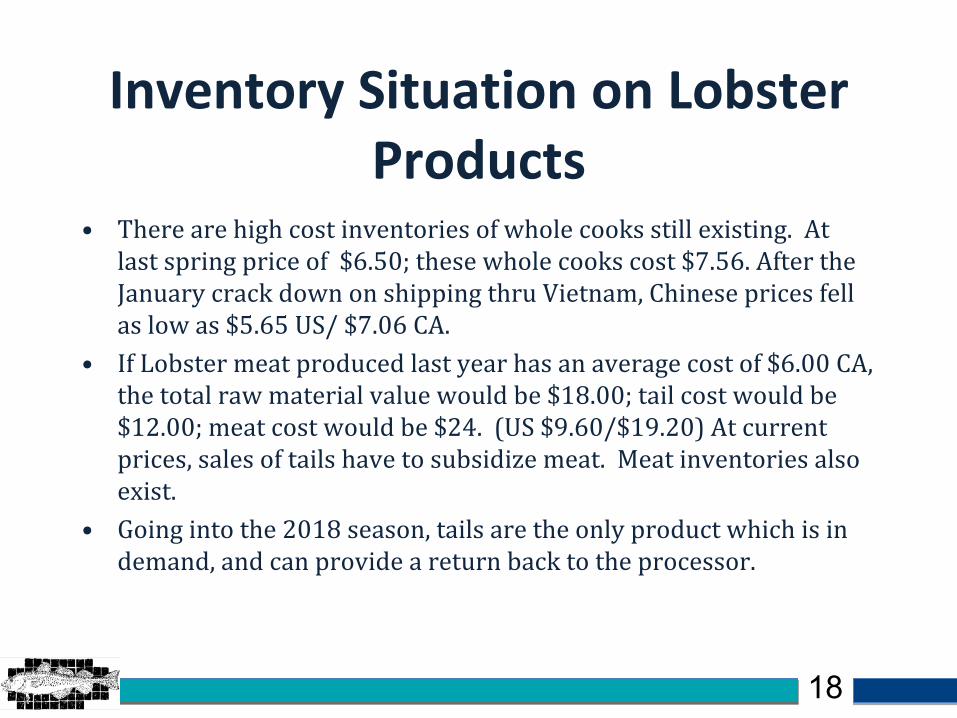
Inventory Situation on Lobster Products
• Therearehighcostinventoriesofwholecooksstillexisting.Atlastspringpriceof$6.50;thesewholecookscost$7.56.AftertheJanuarycrackdownonshippingthruVietnam,Chinesepricesfellaslowas$5.65US/$7.06CA.
• IfLobstermeatproducedlastyearhasanaveragecostof$6.00CA,thetotalrawmaterialvaluewouldbe$18.00;tailcostwouldbe$12.00;meatcostwouldbe$24.(US$9.60/$19.20)Atcurrentprices,salesoftailshavetosubsidizemeat.Meatinventoriesalsoexist.
• Goingintothe2018season,tailsaretheonlyproductwhichisindemand,andcanprovideareturnbacktotheprocessor.

19
Lobster tails
• Processorscutbackontailproductionin2017.
• LowerexportsfromMainewerealsoafactor.
• Result:currentmarketshortagefortails,withrisingprices
6-7 oz
3-4 oz

20
Lobster meat
• HighPricesin2015ledtoover- productionandcustomerstakingmeatoffmenus
• Oversupplycontinuedin2017.
• Currentpricingappearstobestabilizing
21
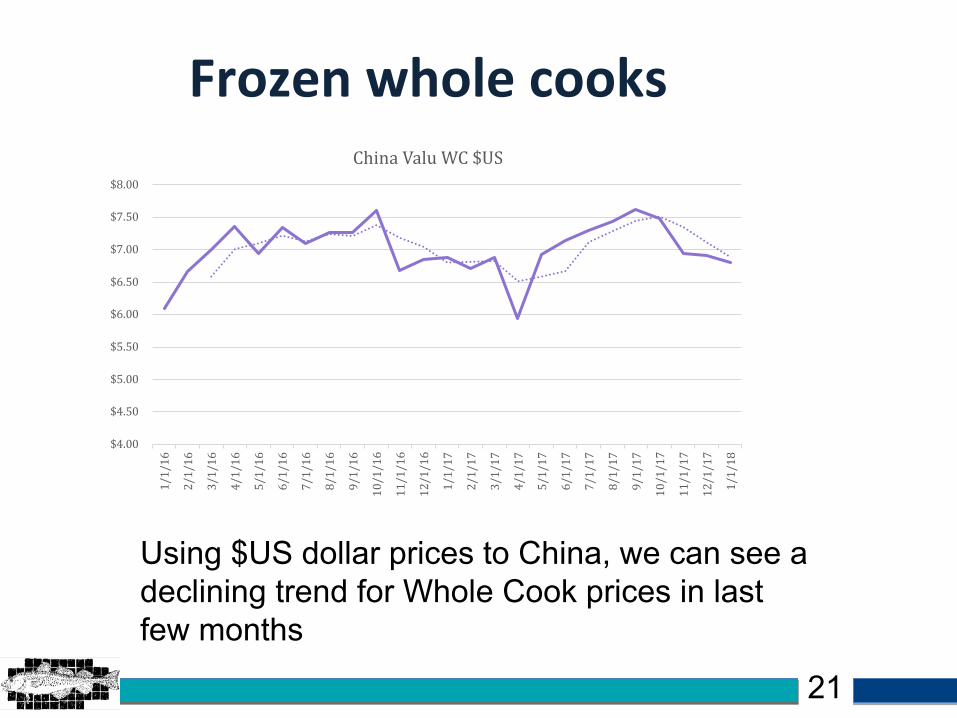
Frozen whole cooks
$4.00
$4.50
$5.00
$5.50
$6.00
$6.50
$7.00
$7.50
$8.001/1/16
2/1/16
3/1/16
4/1/16
5/1/16
6/1/16
7/1/16
8/1/16
9/1/16
10/1/16
11/1/16
12/1/16
1/1/17
2/1/17
3/1/17
4/1/17
5/1/17
6/1/17
7/1/17
8/1/17
9/1/17
10/1/17
11/1/17
12/1/17
1/1/18
ChinaValuWC$US
Using $US dollar prices to China, we can see a declining trend for Whole Cook prices in last few months

22
US Lobster Supply with Maine Production
0
20,000,000
40,000,000
60,000,000
80,000,000
100,000,000
120,000,000
140,000,000
160,000,000
180,000,000
2014 2015 2016 2017
pounds
USLobsterSupplywithMaineProduction
USLiveTotal TotalWholeCooks Tails Meat

23
Breakdown of US Lobster by Product in 2017
USLiveTotal64%
USWholeCooks1%
CAWholeCooks2%
Tails19%
Meat14%
2017
USLiveTotal USWholeCooks CAWholeCooks Tails Meat
Seafood Datasearch and Urner Barry

24
US processing
0
20,000,000
40,000,000
60,000,000
80,000,000
100,000,000
120,000,000
140,000,000
2014 2015 2016 2017
USLobsterProcessing
UsLiveDomestic USLiveImports UsForProcessing USWholeCook USTails USMeat
Seafood Datasearch and Urner Barry

25
Live Lobster
Seafood Datasearch and Urner Barry

26
Estimating Whole Cook Volume• Wholecooksaretheweakestmarketatthistime.
• Estimatingpercentagesoffrozenlobstergoingintowholecooksandtailsisdifficult.
• Thisyeartherewillbeastrongmarketincentivetoproducetailsandmeat,fewerwholecooks.

27
Estimate by Yield
0
5,000
10,000
15,000
20,000
25,000
30,000
35,000
2013 2014 2015 2016 2017
CanadaexportstoWorld
30612-Fznlobster 160530-lobstermeat
Seafood Datasearch
28
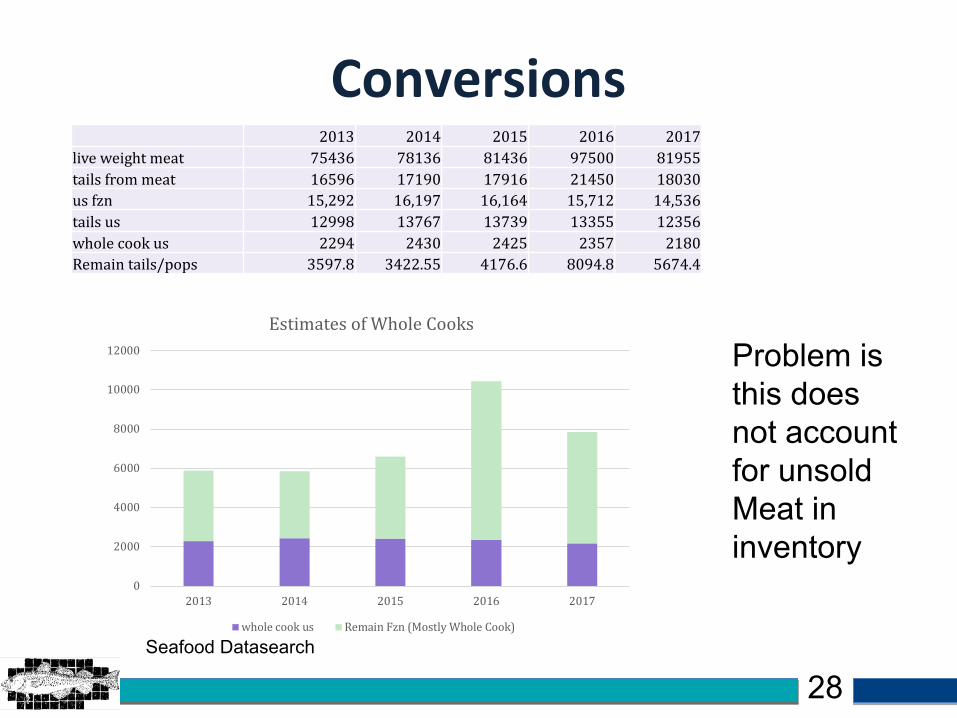
Conversions2013 2014 2015 2016 2017
liveweightmeat 75436 78136 81436 97500 81955tailsfrommeat 16596 17190 17916 21450 18030usfzn 15,292 16,197 16,164 15,712 14,536tailsus 12998 13767 13739 13355 12356wholecookus 2294 2430 2425 2357 2180Remaintails/pops 3597.8 3422.55 4176.6 8094.8 5674.4
0
2000
4000
6000
8000
10000
12000
2013 2014 2015 2016 2017
EstimatesofWholeCooks
wholecookus RemainFzn(MostlyWholeCook)
Problem is this doesnot accountfor unsoldMeat in inventory
Seafood Datasearch

29
Estimate by Exports2016 2017
0
500,000
1,000,000
1,500,000
2,000,000
2,500,000
0
1,000,000
2,000,000
3,000,000
4,000,000
5,000,000
6,000,000
Jan Feb
March
April
May
June Ju
lyAugSept Oc
tNov
Dec
CanadianExportsofFrozenin-shellLobster,bymonth,2016,inkg
0
500,000
1,000,000
1,500,000
2,000,000
2,500,000
3,000,000
0
1,000,000
2,000,000
3,000,000
4,000,000
5,000,000
6,000,000
Jan Feb
March
April
May
June Ju
lyAugSept Oc
tNov
Dec
CanadianExportsofFrozenin-shellLobster,bymonth,2017,inkg
Seafood Datasearch and industry

30
Surge in whole cook exports in June and July at High Prices
3,229,934
4,419,704
0500,000
1,000,0001,500,0002,000,0002,500,0003,000,0003,500,0004,000,0004,500,0005,000,000
2016 2017
June-July
Seafood Datasearch and industry
31
Summary
• Highpricedwholecookshaveslowedthemarket;manysellersarelosingmoney.
• DisruptionofVietnam-Chinabordertradeatendof2017hadbigimpact.
• Resultisthatmarketforwholecooksisweakerthanlastyear.

32
Live Homarus has come to dominate China Lobster Supply
0
1,000,000
2,000,000
3,000,000
4,000,000
5,000,000
6,000,000
7,000,000
2012-Q4
2013-Q1
2013-Q-2
2013-Q3
2013-Q4
2014-Q1
2014-Q2
2014-Q3
2014-Q4
2015-Q1
2015-Q2
2015-Q3
2015-Q4
2016-Q1
2016-Q2
2016-Q3
2016-Q4
2017-Q1
2017-Q2
2017-Q3
ChartTitle
LiveLobster RockLobster FznHomarus
Seafood Datasearch Customs data

33
72% of total supply in 2017 was homarus
LiveHomarus60%
LiveRock28%
FznHomarus12%
ChinaLobsterin2017
LiveHomarus LiveRock FznHomarus
Seafood Datasearch Customs data

34
Live Homarus imports to china
0
2,000,000
4,000,000
6,000,000
8,000,000
10,000,000
12,000,000
14,000,000
16,000,000
18,000,000
2013 2014 2015 2016 2017
ChinaLiveHomarusImportGrowth
Q2 Q3 Q4 Q1
Seafood Datasearch Customs data
35
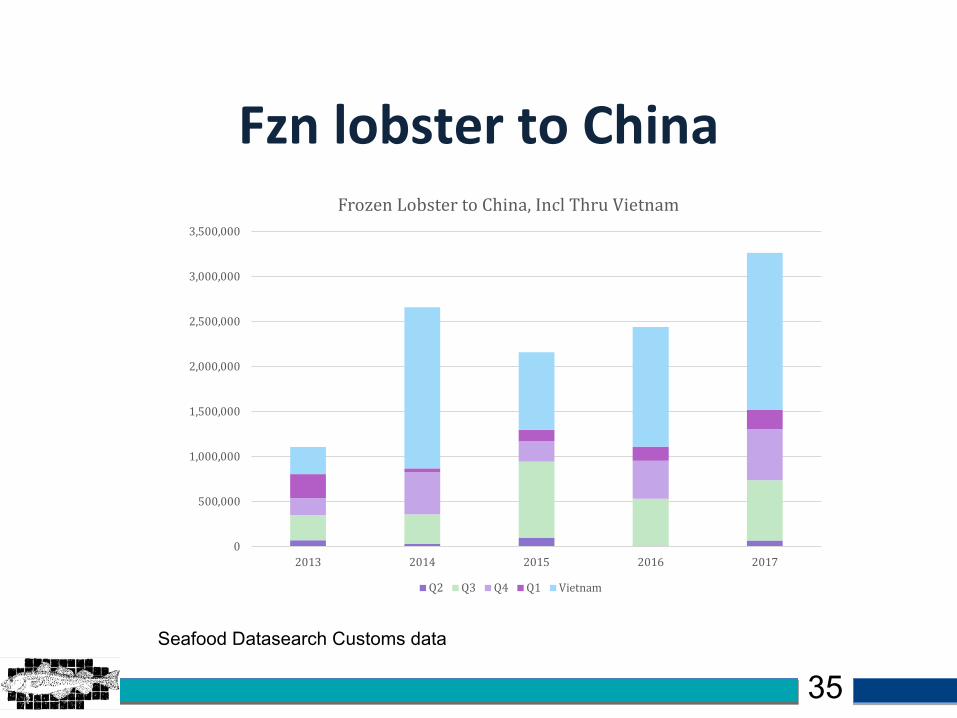
Fzn lobster to China
0
500,000
1,000,000
1,500,000
2,000,000
2,500,000
3,000,000
3,500,000
2013 2014 2015 2016 2017
FrozenLobstertoChina,InclThruVietnam
Q2 Q3 Q4 Q1 Vietnam
Seafood Datasearch Customs data

36
Fzn Exports Peak in Q 3 and 4
0
100,000
200,000
300,000
400,000
500,000
600,000
700,000
800,000
900,000
2012-Q4
2013-Q1
2013-Q-2
2013-Q3
2013-Q4
2014-Q1
2014-Q2
2014-Q3
2014-Q4
2015-Q1
2015-Q2
2015-Q3
2015-Q4
2016-Q1
2016-Q2
2016-Q3
2016-Q4
2017-Q1
2017-Q2
2017-Q3
FznHomarustochinabyQtr
FznHomarus
Seafood Datasearch Customs data

37
Exports of whole cooks to Vietnam surged in 2017
0
100,000
200,000
300,000
400,000
500,000
600,000
jan Feb Mar apr may jun jul aug sep oct nov dec
KgFznWholeCooktovietnam
2015 2016 2017 2018
Seafood Datasearch Customs data

38
Growth of China Demand is not slowing
• Althoughwholecookmarketisweak,Chinademandisnotslowing.
• Canadianexportsoflivelobsterandfrozenincreased.
02,000,0004,000,0006,000,0008,000,00010,000,00012,000,00014,000,00016,000,00018,000,000
2016 2017
ChartTitle
fzn live
Live + 16%Fzn + 27%

39
Competitive Price Pressure• ButChinaisbecomingamorecompetitiveandpricesensitivemarket.
• Pressuretocutcostsforexportsbycuttingoutcommissionagents
• LargebuyerslikeAlibabaexertheavypressureonprices
• Inanoversupplymarket,Chinesebuyershaveanadvantage

40
China Outlook: More Competitive
• 2018willgiveChinesebuyerschancetosqueezepricesonfrozenlobster.– HeavylandingswillhavetobeprocessedaswholecooksduetolaborshortageinPEI.
– Yetsomehighpricedwholecookedinventorystillunsold
– Borderdisruptionhashurtmarket– Processorswillbereluctanttosellataloss.– Asaresult,thiswillimpactshorepricing.

41
Timing of Season• Timingoflandingsisacriticalfactorinsettingseasonalprices.
• Heavylandingspushpricesdown;• LaborisbecomingmoreofanissueforprocessinginPEI,NB.
• Resultiswhenplantcapacityformeatandtailsexceeded,nochoicebuttodowholecooks.
• Smallcannersalsomostlywholecooks.

42
Price and Inventory Pressure• Marketpressuresontailsvs.wholecooksmovinginoppositedirection.
• Shortageoftailsisdrivingupprices.• Couldleadtoacutbackinbuying.• Weaknessofwholecooksisadragonprices.
• Inventoriesofwholecooksstillexist.• Meatinventoriesaremorecleanedup.

43
Currency factor in US sales
2017 has been slightly strong vs dollar than 2016 (bad for exporters)
April - May
current

44
Outlook and PredictionsPositiveSignals
• Chinademandcontinuestoincrease
• 2018willbefirstfullyearofCETAagreement
• USEconomycontinuestobestrong.
• Meatpricesappeartobestabilizing.
• Livepricesinnormalrange.
• Tailpricesstronger
NegativeSignals
• Wholecookmarketisweak• Chinaisamorecompetitivebuyerwithdownwardpricepressure.
• Buyershavenotfullyreactedtotheincreaseintailprices.
• Laborissuesforceplantstoproducewholecooksevenwhenmarketwantstails
• Currencyisnegative
45
Thank you.Time for Questions