load capacity assessment of “antonio dovali jaime ... · load capacity assessment of “antonio...
TRANSCRIPT
Tailor Made Concrete Structures – Walraven & Stoelhorst (eds)© 2008 Taylor & Francis Group, London, ISBN 978-0-415-47535-8
Load capacity assessment of “Antonio Dovali Jaime” bridge using staticand dynamic tests
O. Ortiz, J. Téllez & F.J. BurgosCaminos y Puentes Federales de Ingresos y Servicios Conexos, México
A. Patrón, E. Reyes & V. RoblesConsultora Mexicana de Ingeniería S.A. de C.V. – Procesamiento de Ingeniería Estructural S.C., México
C. CremonaLaboratoire Central des Ponts et Chaussées, France
M.E. Ruiz-SandovalUniversidad Autonoma Metropolitana – Azcapotzalco, México
ABSTRACT: The “Antonio Dovali Jaime” Bridge is an important cable stayed bridge, located in the southeast ofMexico.The bridge has a total length of 1170 m and the main span is 288 m. It was open to traffic in 1984, and wasthe first cable-stayed bridge in Mexico. In order to asses the current state of the bridge an extensive program of nondestructive tests was carried out; the field tests included measurements of stresses, a complete geometric surveyof deformed configurations due to vehicle loads, and different series of ambient vibration measurements. Themain results of the tests were: load-deformation relationships and dynamic properties (modal shapes, dampingand frequencies) of first vibration modes. The results were employed to validate and improve a 3D finite elementmodel of the bridge. The results obtained from FEM calculations were used to asses the actual state of the bridge.
1 INTRODUCTION
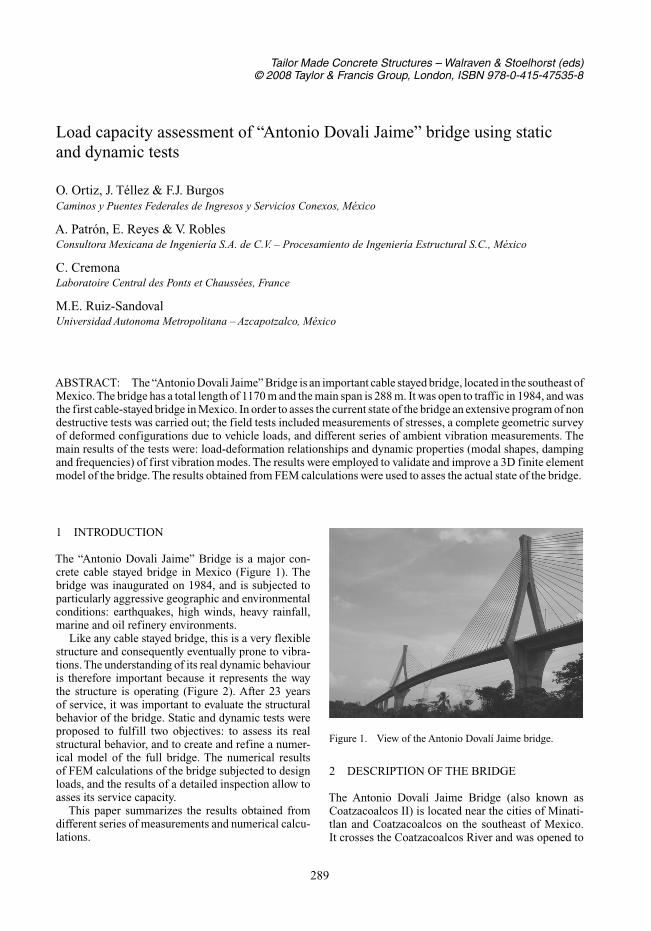
The “Antonio Dovali Jaime” Bridge is a major con-crete cable stayed bridge in Mexico (Figure 1). Thebridge was inaugurated on 1984, and is subjected toparticularly aggressive geographic and environmentalconditions: earthquakes, high winds, heavy rainfall,marine and oil refinery environments.
Like any cable stayed bridge, this is a very flexiblestructure and consequently eventually prone to vibra-tions. The understanding of its real dynamic behaviouris therefore important because it represents the waythe structure is operating (Figure 2). After 23 yearsof service, it was important to evaluate the structuralbehavior of the bridge. Static and dynamic tests wereproposed to fulfill two objectives: to assess its realstructural behavior, and to create and refine a numer-ical model of the full bridge. The numerical resultsof FEM calculations of the bridge subjected to designloads, and the results of a detailed inspection allow toasses its service capacity.
This paper summarizes the results obtained fromdifferent series of measurements and numerical calcu-lations.
Figure 1. View of the Antonio Dovalí Jaime bridge.
2 DESCRIPTION OF THE BRIDGE
The Antonio Dovalí Jaime Bridge (also known asCoatzacoalcos II) is located near the cities of Minati-tlan and Coatzacoalcos on the southeast of Mexico.It crosses the Coatzacoalcos River and was opened to
289

Figure 2. Example of traffic conditions on the A. Dovalibridge used as ambient excitation.
traffic on June 7th, 1984. It was one of the largest cablestayed bridges in the world when built. The bridge isa key link in the freeway that bypasses Coatzacoalcosand connects to the southwest part of Mexico (Yucatanpeninsula).
The total length of the bridge is 1170.00 m, but themain cable stayed part is 698.15 m long. The centralspan is 288 m long (Walther 1998). The main tow-ers are 147.12 m high, and the top of the pylon is61.29 m above the bridge deck.All the piers and towersare reinforced concrete and have a rectangular hollowbox cross section. The cable-stayed superstructure has18.10 m wide and consists of a 3.3 m deep prestressedconcrete box. The deck is supported by one centralplane of stays. There are 17 � 15 stay cables (33 to 61strands) per pylon spread in two fans. For each pylonthe stay are continuous and positioned in the pylon ona deviation saddle.
The main bridge and the access viaducts wereconstructed by cantilever method from piers (Fig. 3).
3 STATIC TESTS
A group of static tests was performed.The tests consid-ers the measurement of static response of the bridge(deflections) under known loads placed on differentpoints over the bridge.
3.1 Description of tests
In order to evaluate the response of different parts ofthe cable-stayed bridge under live loads, three differenttypes of static tests were defined (Fig. 4). For each load
Figure 3. View of the Antonio Dovalí Jaime bridge duringconstruction.
Figure 4. Load configurations for static tests.
case vertical deflections were measured in 18 pointsof the bridge (Fig. 5). The vehicles used for the testswere 8 three-axle trucks each one weighting 30 tons(Fig. 6). The horizontal deformations on the top of thepylons were also measured.
The static tests were realized early on the morn-ing, mainly to avoid thermal effects, and to minimizethe perturbation associate with the total closure of thebridge during static tests.
Deflections at the defined points were first mea-sured with only the dead load condition; successively,the position of each point was again measured duringthe application of each configuration load. The differ-ence in the elevation of each selected point betweenits dead-load position and its loaded position representthe load condition displacement.Also a final measure-ment of the deflections of the bridge was made afterthe static tests were concluded.
290
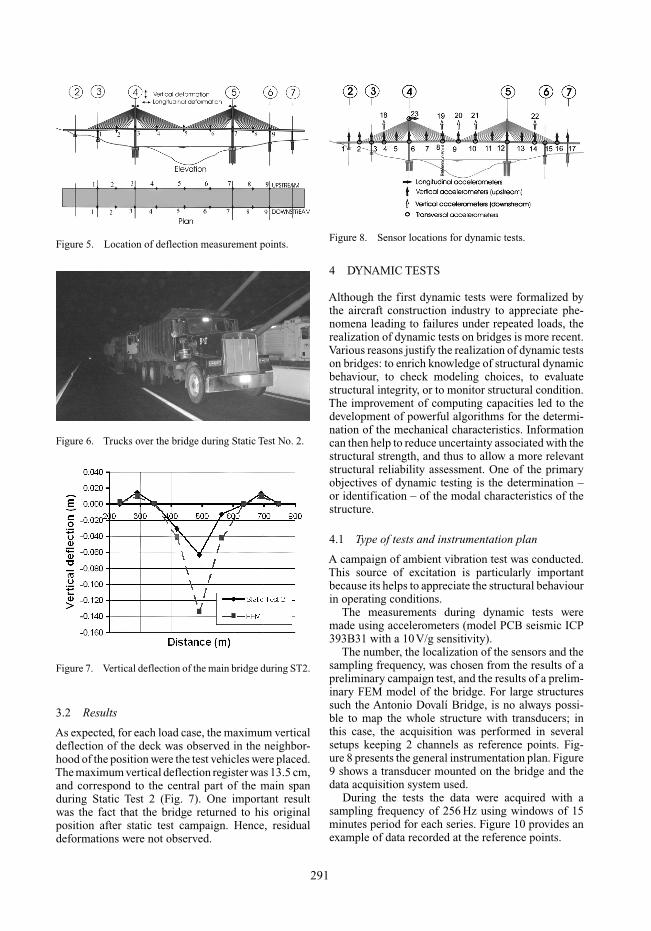
Figure 5. Location of deflection measurement points.
Figure 6. Trucks over the bridge during Static Test No. 2.
Figure 7. Vertical deflection of the main bridge during ST2.
3.2 Results
As expected, for each load case, the maximum verticaldeflection of the deck was observed in the neighbor-hood of the position were the test vehicles were placed.The maximum vertical deflection register was 13.5 cm,and correspond to the central part of the main spanduring Static Test 2 (Fig. 7). One important resultwas the fact that the bridge returned to his originalposition after static test campaign. Hence, residualdeformations were not observed.
Figure 8. Sensor locations for dynamic tests.
4 DYNAMIC TESTS
Although the first dynamic tests were formalized bythe aircraft construction industry to appreciate phe-nomena leading to failures under repeated loads, therealization of dynamic tests on bridges is more recent.Various reasons justify the realization of dynamic testson bridges: to enrich knowledge of structural dynamicbehaviour, to check modeling choices, to evaluatestructural integrity, or to monitor structural condition.The improvement of computing capacities led to thedevelopment of powerful algorithms for the determi-nation of the mechanical characteristics. Informationcan then help to reduce uncertainty associated with thestructural strength, and thus to allow a more relevantstructural reliability assessment. One of the primaryobjectives of dynamic testing is the determination –or identification – of the modal characteristics of thestructure.
4.1 Type of tests and instrumentation plan
A campaign of ambient vibration test was conducted.This source of excitation is particularly importantbecause its helps to appreciate the structural behaviourin operating conditions.
The measurements during dynamic tests weremade using accelerometers (model PCB seismic ICP393B31 with a 10V/g sensitivity).
The number, the localization of the sensors and thesampling frequency, was chosen from the results of apreliminary campaign test, and the results of a prelim-inary FEM model of the bridge. For large structuressuch the Antonio Dovalí Bridge, is no always possi-ble to map the whole structure with transducers; inthis case, the acquisition was performed in severalsetups keeping 2 channels as reference points. Fig-ure 8 presents the general instrumentation plan. Figure9 shows a transducer mounted on the bridge and thedata acquisition system used.
During the tests the data were acquired with asampling frequency of 256 Hz using windows of 15minutes period for each series. Figure 10 provides anexample of data recorded at the reference points.
291

Figure 9. Acceleration transducer installed and dataacquisition system.
0 100 200 300 400 500 600 700 800 900-0.03
-0.02
-0.01
0
0.01
0.02
0.03
Time [s]
a [m/s2]
Figure 10. Example of recorded accelerations (black:vertical, grey: transversal).
Figure 11 provides the spectrum of this recordeddata. These results show a glimpse of the lowest fre-quencies vibration modes of the bridge (comprisedbetween 0.4 and 3.5 Hz).
4.2 Modal identification
The experimental modal identification was carried outusing the random decrement technique coupled withthe Ibrahim Time Domain method (Cremona 2004).
0 0.5 1 1.5 2 2.5 3 3.5 4 4.5 50
0.002
0.004
0.006
0.008
0.01
Frequency [Hz]
PSD
0 0.5 1 1.5 2 2.5 3 3.5 4 4.5 50
0.5
1
1.5
Freq uenc y [Hz]
PS�10�3
Figure 11. Example of spectrum of measurement point onmain span (vertical & transversal).
Table 1. Identified modal parameters of the first 5 modes.
Period Damping ratioMode [sec] [%]
1 2.151 0.202 2.041 0.403 1.311 0.324 1.261 0.775 1.088 0.63
The identified mode shapes of the bridge are shown infigure 13.
The principle of the random decrement technique isto consider functions known as random decrementfunctions issued from averages of measurement seg-ments under triggering conditions. These functionsare damped functions, which makes it possible toapply traditional identification algorithms such as theIbrahim Time Domain technique. The processing ofmeasured data by these techniques was made usingLCPC-Sys_Ident toolbox.
Twelve modes were identified. Table 1 summarizesthe identified modal parameters for first modes of thebridge.
5 FEM MODELLING AND CORRELATIONWITH TESTS RESULTS
The experimental program was used to complement a3D finite element model of the full bridge.
The model was elaborated based on the original con-struction drawings, and the results of a detailed inspec-tion and geometrical survey of the bridge realized in2006.
292

Figure 12. View of the 3D finite element model of thebridge.
The model was made using the program SAP2000.A total of 833 nodes and 902 elements (cable andbeam) were employed in the FEM model (Fig. 12).
The mechanic characteristics of the constitutivematerials of the bridge (weight,Young’s modulus, etc.)were based on available technical data and typical“design” assumptions.
5.1 Model validation
The theoretical response of the bridge due to the staticload arrays were calculated using the FEM model.These results were compared with those obtained bythe tests. A relatively good agreement between themodel and static test results (similar deformed shapes)was found. However the deformations measured on thebridge during static load tests were less important thatthose numerically calculated (Fig. 7). This tendencywas the same one for all the static load cases.
The FEM model was also used to calculate themodal shapes and natural periods of the lowest modesof vibration of the bridge. The results are summa-rized on Figure 13. The results show also a reasonablygood agreement between numerical and test mea-surements: comparable modal shapes and vibrationperiods of same order. Nevertheless, the FEM modelunderestimates the periods of all vibration modes. Theresults shows the same tendency found in the staticcase: numerical model was more flexible than the realbridge. Despite the fact that the numerical model wasdetailed as much as possible, the stiffness appeared tobe underestimated consistently throughout the bridge.
5.2 Model updating
A parametric study was made changing some modelassumptions like Young’s modulus and density ofmaterials. However, normal variations in those param-eters were not sufficient to explain the differences
Figure 13. Calculated and identified modal shapes for firstfive modes.
obtained between FEM model and tests results. Theseunexpected differences prompted the authors to do anadditional search of information about the character-istics of the bridge. It was found that the stay cablesare protected against corrosion by a 5.6 mm thick steeltube injected with cement grout (Fig. 14).This solutionis not usual in cable stayed bridges were polyethy-lene ducts are normally used to protect stay againstcorrosion. It was also found that the bridge design-ers organized the erection stages of the main bridgein order to guarantee a permanent compression on theinjected grout of each stay (AFPC 1986).
This fact modifies the structural behaviour of thestay: the steel duct and the injected grout played a partin resisting the stresses due to live and dynamic loads.
293

Figure 14. Detail of stay protection.
Figure 15. Vertical deflection of the bridge during ST2.
Table 2. Comparison of periods of the first five measuredand calculated modes of the bridge (Updated Model).
Measured CalculatedMode [s] [s]
1 2.151 2.3532 2.041 2.0173 1.311 1.3534 1.261 0.9605 1.088 0.908
Consequently, the stiffness of the stays is bigger thanassumed.
Therefore, the additional stiffness of the stay wascalculated taking into account the pipe area and theequivalent “steel” area of grout. This assumptionincreases the stay stiffness by 100 % approximately.This improved considerably the correlation betweenFEM model and experimental results, for both staticand dynamic tests (see Figure 15 and Table 2).
With the above results the numerical model wasconsidered validated and acceptable to study the
Figure 16. Examples of construction stages considered.
response of the bridge to environmental and operationloads.
6 LOAD CAPACITY ASSESSMENT
The response of the bridge to the different “design”loads (earthquake, wind, live load) was calculated withthe updated FEM model. The results of these calcula-tions were used to verify the ultimate load and servicecapacity of the different structural elements of thebridge.
The “dead load” condition was calculated takinginto account the construction stages followed whenthe bridge was build (Fig. 16): cantilever construc-tion, installation of prestress cables, installation of staycables, etc. The creep and shrinkage of concrete wasalso considered in “dead load” numerical calculations.
The verification of the resistance and service capac-ity of the bridge was made following the specificationsof AASHTO-2002 code and Mexican bridge designspecifications. Figure 17 shows an example of the typeof verifications made.
Some relevant results were:
• Flexion moments on the deck of main bridge due tolive load were reduced by 10% thanks to the increaseof stays stiffness due to steel stay pipe and injectedgrout.
294
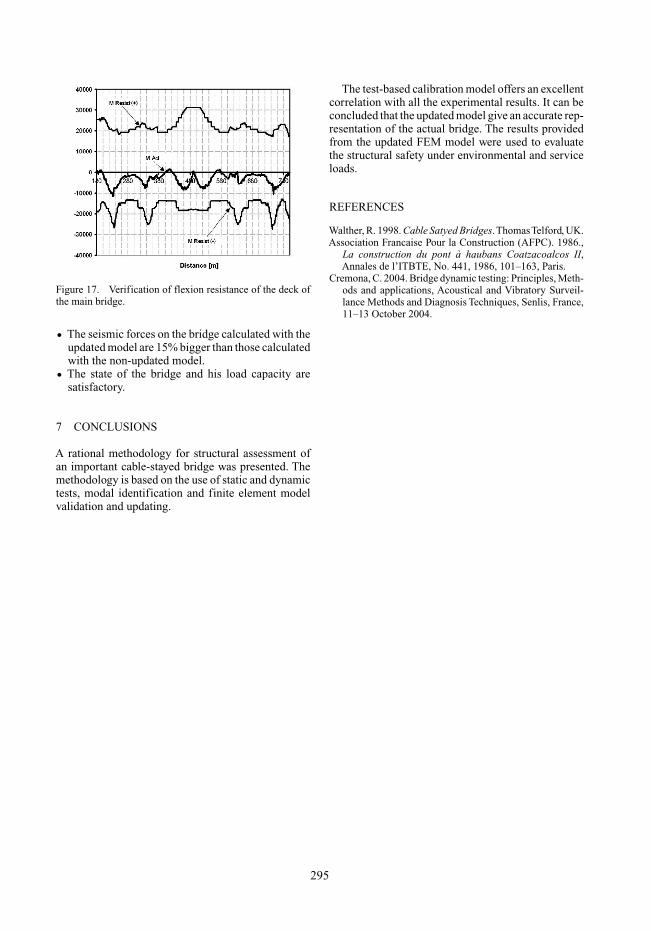
Figure 17. Verification of flexion resistance of the deck ofthe main bridge.
• The seismic forces on the bridge calculated with theupdated model are 15% bigger than those calculatedwith the non-updated model.
• The state of the bridge and his load capacity aresatisfactory.
7 CONCLUSIONS
A rational methodology for structural assessment ofan important cable-stayed bridge was presented. Themethodology is based on the use of static and dynamictests, modal identification and finite element modelvalidation and updating.
The test-based calibration model offers an excellentcorrelation with all the experimental results. It can beconcluded that the updated model give an accurate rep-resentation of the actual bridge. The results providedfrom the updated FEM model were used to evaluatethe structural safety under environmental and serviceloads.
REFERENCES
Walther, R. 1998. Cable Satyed Bridges.ThomasTelford, UK.Association Francaise Pour la Construction (AFPC). 1986.,
La construction du pont à haubans Coatzacoalcos II,Annales de l’ITBTE, No. 441, 1986, 101–163, Paris.
Cremona, C. 2004. Bridge dynamic testing: Principles, Meth-ods and applications, Acoustical and Vibratory Surveil-lance Methods and Diagnosis Techniques, Senlis, France,11–13 October 2004.
295
