living with the bay resiliency strategy - ny … · (key objective 5) living with the bay ... 28...
TRANSCRIPT

Living with the Bay
Prepared by:
Task e. Watershed Management Recommendation Report (Key Objective 5)
June 2017
Resiliency Strategy

#200-87963-17001
June 2017
PRESENTED TO PRESENTED BY
Governor’s Office of Storm Recovery
25 Beaver Street
New York, New York 10004
Tetra Tech
5 Hanover Square
New York, NY 10004
P +1-646-576-4034
F +1-212-480-2836
tetratech.com
Task e. Watershed Management Recommendation Report
(Key Objective 5)
Living with the Bay Resiliency Strategy

Living with the Bay
Resiliency Strategy
Task e. Watershed Management Recommendation Report (Key Objective 5)
i
TABLE OF CONTENTS
1.0 GENERAL .................................................................................................................................................................... 1
2.0 PROBLEM AREAS ...................................................................................................................................................... 1
3.0 PROJECTS FROM PROBLEM AREAS....................................................................................................................... 3
4.0 RECOMMENDATIONS (GENERAL)............................................................................................................................ 8
4.1 WATER STORAGE – WATER QUALITY AND SLOW STREAMS ........................................................................ 9
4.2 A GREENER EDGE – BIOSWALES AND MARSH RESTORATION .................................................................. 10
4.3 SPACE FOR THE RIVER - ECOHABITATS & TIDAL/SURGE PROTECTION ................................................... 12
4.4 BLUE-GREEN CORRIDOR – HISTORY, EDUCATION, & PUBLIC ACCESS .................................................... 14
5.0 PROJECT DESCRIPTIONS (PD) DEVELOPMENT .................................................................................................. 15
6.0 CONCLUSION ............................................................................................................................................................ 16
LIST OF FIGURES
Figure e-1: Problem Area Map ...................................................................................................................................2 Figure e-2: Example Problem Area Grouping ............................................................................................................3 Figure e-3: Project ID Exhibit ......................................................................................................................................4 Figure e-4: Examples of Water Storage Projects .......................................................................................................9 Figure e-5: Examples of Green Infrastructure Projects ........................................................................................... 10 Figure e-6: Examples of Marsh Restoration Interventions ...................................................................................... 11 Figure e-7: Examples of Fish Ladders and Living Shorelines ................................................................................. 12 Figure e-8: Examples of Tidal and Surge Management Projects ............................................................................ 13 Figure e-9: Examples of Blue-Green Corridor Theme Solutions ............................................................................. 14 Figure e-10: Project ‘A’ Description (See Appendix for all PDs) ............................................................................. 15
LIST OF TABLES
Table e-1: Potential LWTB Projects from the Identified Problem Areas…………………………………………………5 Table e-2: Project Information Summary Matrix *………………………………………………………………………...16
APPENDIX
Project Descriptions (36)
Disclaimer: The information provided in this document is based on the best available data and information
provided by others at the time of the preparation of this material and is subject to change.

Living with the Bay
Resiliency Strategy
Task e. Watershed Management Recommendation Report (Key Objective 5)
1
1.0 GENERAL
The contents of the deliverables associated with the prior tasks a, b, c and d fulfill the New York State Governor’s
Office of Storm Recovery’s (GOSR’s) first four (4) Key Objectives – 1) Statement of Purpose, Need, and Goals; 2)
Description and Assessment of the Waterbody (ies) and Watershed Resources; 3) Description and Assessment of
Local Laws, Programs and Practices; and 4) Watershed Characterization Report. The 92 problem areas identified
from Key Objective 4 - Watershed Characterization Report have been further analyzed and condensed into 36
projects basing on the drainage area and location for better evaluation purposes. The methodology and proposed
interventions for the various problem areas identified are included in task e. Watershed Recommendations Report
associated with Key Objective 5.
Based on the findings of the tasks a-d, the various types and causes of the problems currently experienced in the
Living with the Bay (LWTB) program area have been identified and quantified. In addition, this problem identification
has been vetted through multiple sources through numerous meetings and discussions with local municipal
jurisdictions, the LWTB Technical Advisory Committee (TAC), LWTB Citizens Advisory Committee (CAC), and the
public. This objective includes the conceptual designs of proposed interventions to mitigate flooding caused by tidal,
storm surge and rainfall events, erosion, improve water quality, preserve better life quality and improve recreation
and education opportunities.
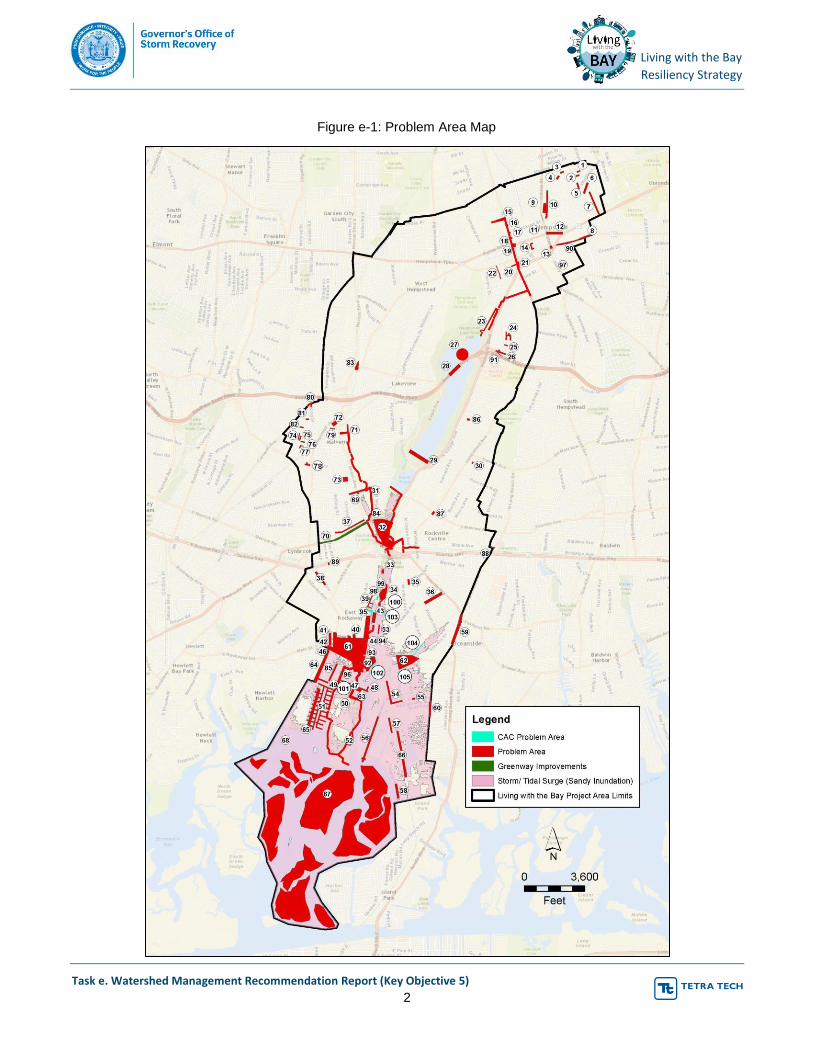
2.0 PROBLEM AREAS
LWTB program area has higher number of stakeholders and fall under seven municipal jurisdictions which are
Village of Hempstead, Village of Malverne, Village of Lynbrook, Village of Rockville Centre, Village of East
Rockaway, Town of Hempstead and Nassau County. The problem areas are identified through the efforts of tasks
a-d shown in Problem Area Exhibit (Figure e-2). Each problem area was assigned a numeric ID and the
approximate limits of the area are shaded in red.
Living with the Bay
Resiliency Strategy
Task e. Watershed Management Recommendation Report (Key Objective 5)
2
Figure e-1: Problem Area Map
Figure 2. Problem Area Map.
Figure 2. Problem Area Map.
Figure 2: Problem Area Map

Living with the Bay
Resiliency Strategy
Task e. Watershed Management Recommendation Report (Key Objective 5)
3
3.0 PROJECTS FROM PROBLEM AREAS
Problem areas located within common sub-basin drainage areas and with similar problem types were initially
grouped as part of this task. By grouping the problem areas within common drainage systems and similar problem
types will help evaluate and allocate the HUD funds efficiently. This also helps meet other LWTB goals to address
other issues besides flooding. The 92 problems areas were condensed into 40 projects with the responsible
maintenance entity(ies) assigned. Figure e-2 is an example showing problem areas 15, 16, 17, 18, 19, 20, and 21
located in the drainage system on Franklin Street condensed into a single Project B to mitigate flooding in the listed
problem areas. Project B specifically provides additional storage for the west branch of Horse Brook drain to
accommodate flows coming from Franklin Street, and thereby reducing the flooding on Franklin Street for a 10-year
storm event.
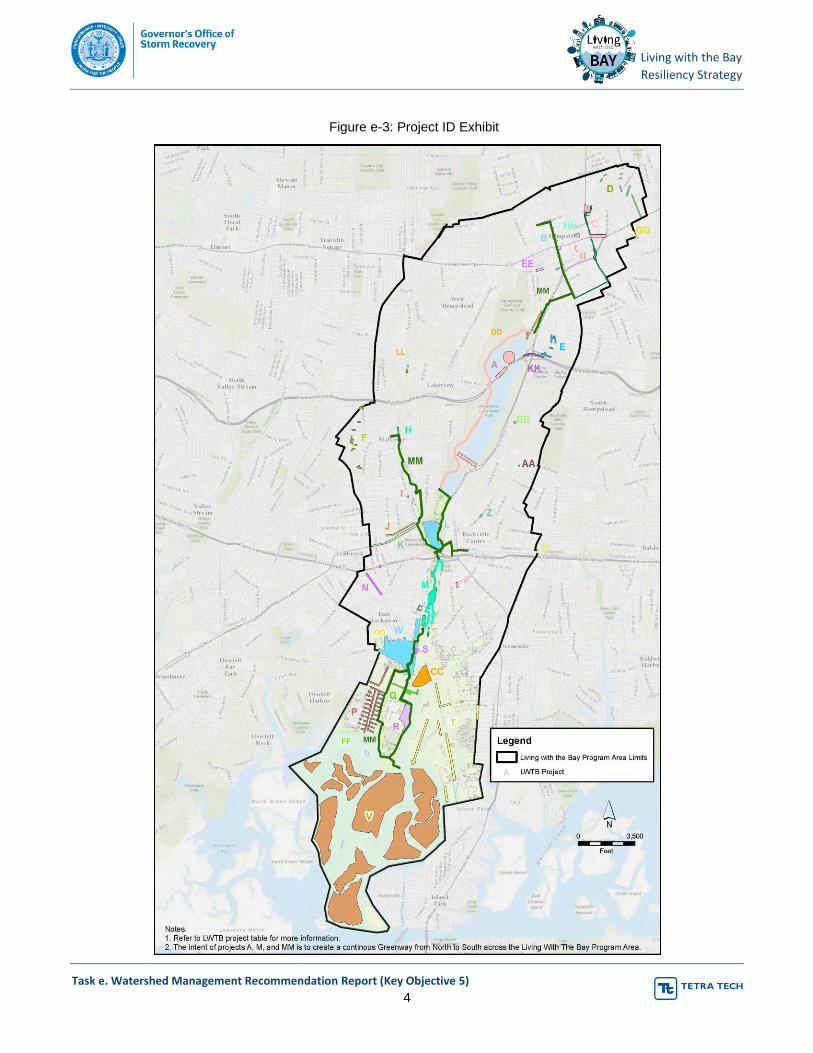
The Project locations are located onsite for some problem areas and offsite for other problem areas. This similar
methodology was applied to the problem areas and condensed into Projects represented by alphabetical letter
starting from A to Z and then from AA to OO for a total of 40 projects. The Projects are generally listed north to
south and the sequence of projects listed has no implication of priority or importance. The Projects are represented
on Project ID Exhibit (Figure e-3) and the list of projects are shown in the Table e-1. The exhibit shows grouped
problem areas as single color code representing project and in overall has all the projects shown in multiple colors.
Each project is assigned to a color code and is represented on both Table and Project ID exhibit.
Figure e-2: Example Problem Area Grouping
Figure 3. Problem Area Map.
Figure 3. Problem Area Map.
Figure 3: Problem Area Map
Living with the Bay
Resiliency Strategy
Task e. Watershed Management Recommendation Report (Key Objective 5)
4
Figure e-3: Project ID Exhibit

Living with the Bay
Resiliency Strategy
Task e. Watershed Management Recommendation Report (Key Objective 5)
5
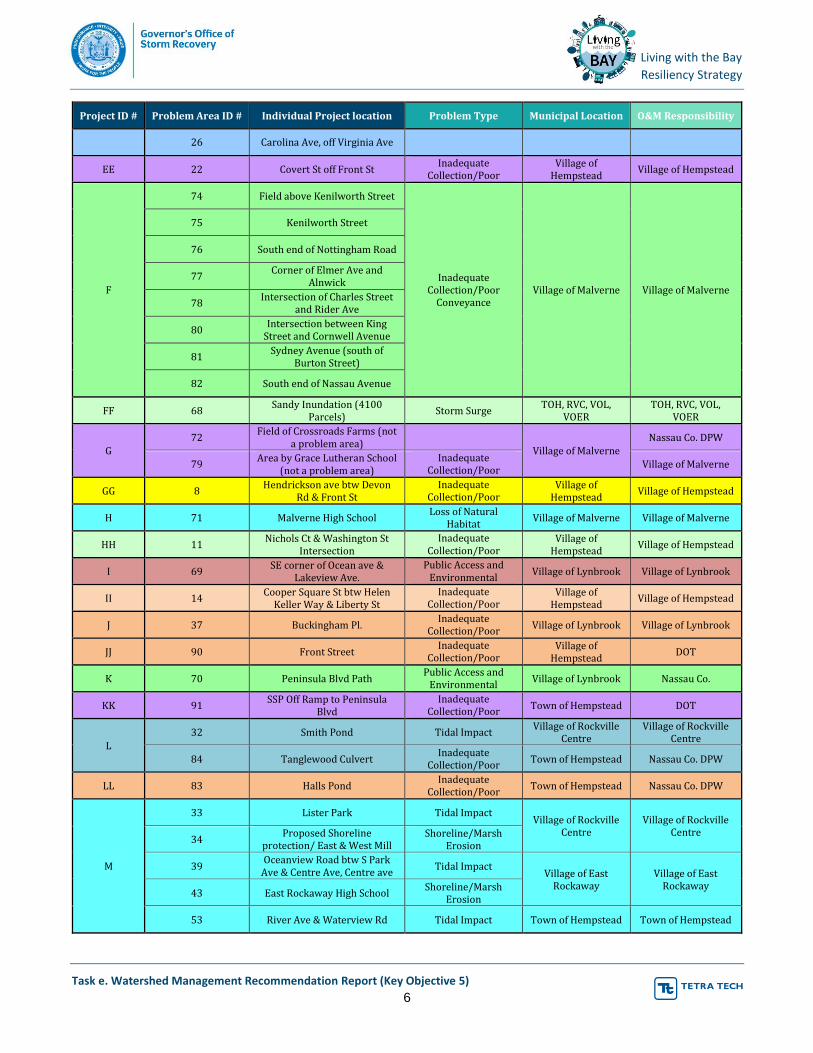
Table e-1: Potential LWTB Projects from the Identified Problem Areas
Project ID # Problem Area ID # Individual Project location Problem Type Municipal Location O&M Responsibility
A
27 Northeast Pond Water Quality
Town of Hempstead NYS Parks
28 Spillway over SSP Inadequate Collection/Poor
Conveyance 29 Lake Hempstead Dam
Greenway, Gateways and
Waterfront Acsess & Improvements
Public Access and Environmental
Education Education Center
AA 30 Beverly Lane and Lehigh Ct.
Intersection Inadequate
Collection/Poor Conveyance
Village of Rockville Centre
Village of Rockville Centre
B
15 Bedell St btw Terrace Ave & N
Franklin St
Inadequate Collection/Poor
Conveyance
Village of Hempstead
Nassau Co. DPW
16 W Columbia St & N Franklin St
Intersection
17 Jackson St & N Franklin St
Intersection
18 Centre St & N Franklin St
Intersection
19 Fulton Ave & N Franklin St
Intersection
20 Newmanns Ct off N Franklin St
21 S Franklin St & Peninsula Blvd
BB 86 Intersection of Roxen Road
and Glenwood Road Inadequate
Collection/Poor Conveyance
Village of Rockville Centre
Village of Rockville Centre
C
9 Hempstead Housing Authority
Inadequate Collection/Poor
Conveyance
Village of Hempstead
Nassau Co. DPW
10 Open Channel btw Yale St &
Jackson St
12 Fulton Ave btw Clinton St &
Benett Ave
13 Clinton St & Front St
Intersection
CC 92 Marina Point Shoreline/Marsh
Erosion Town of Hempstead Town of Hempstead
D
1 Cornell St, off Boylston St
Inadequate Collection/Poor
Conveyance
Village of Hempstead
Village of Hempstead
2 Amherst St, off Boylston St
3 Stewart Ave & James LL Burrel
Ave Intersection
4 Stewart Ave & Cornell St
Intersection
5 Remsen Ave, off Westbury
Blvd
6 Harriet Ave, off Harvard St
7 Surrey Lane, off Fulton Ave
DD 23 Creek Upstream of North
Ponds Shoreline/Marsh
Erosion Town of Hempstead Town of Hempstead
E 24 Green Ave, Rose Ave, Grant St Inadequate
Collection/Poor Conveyance
Village of Hempstead
Village of Hempstead 25
Green Ave & W Marshall St Intersection
Living with the Bay
Resiliency Strategy
Task e. Watershed Management Recommendation Report (Key Objective 5)
6
Project ID # Problem Area ID # Individual Project location Problem Type Municipal Location O&M Responsibility
26 Carolina Ave, off Virginia Ave
EE 22 Covert St off Front St Inadequate
Collection/Poor Conveyance
Village of Hempstead
Village of Hempstead
F
74 Field above Kenilworth Street
Inadequate Collection/Poor
Conveyance Village of Malverne Village of Malverne
75 Kenilworth Street
76 South end of Nottingham Road
77 Corner of Elmer Ave and
Alnwick
78 Intersection of Charles Street
and Rider Ave
80 Intersection between King
Street and Cornwell Avenue
81 Sydney Avenue (south of
Burton Street)
82 South end of Nassau Avenue
FF 68 Sandy Inundation (4100
Parcels) Storm Surge
TOH, RVC, VOL, VOER
TOH, RVC, VOL, VOER
G 72
Field of Crossroads Farms (not a problem area)
Village of Malverne
Nassau Co. DPW
79 Area by Grace Lutheran School
(not a problem area) Inadequate
Collection/Poor Conveyance
Village of Malverne
GG 8 Hendrickson ave btw Devon
Rd & Front St Inadequate
Collection/Poor Conveyance
Village of Hempstead
Village of Hempstead
H 71 Malverne High School Loss of Natural
Habitat Village of Malverne Village of Malverne
HH 11 Nichols Ct & Washington St
Intersection Inadequate
Collection/Poor Conveyance
Village of Hempstead
Village of Hempstead
I 69 SE corner of Ocean ave &
Lakeview Ave. Public Access and
Environmental Education
Village of Lynbrook Village of Lynbrook
II 14 Cooper Square St btw Helen
Keller Way & Liberty St Inadequate
Collection/Poor Conveyance
Village of Hempstead
Village of Hempstead
J 37 Buckingham Pl. Inadequate
Collection/Poor Conveyance
Village of Lynbrook Village of Lynbrook
JJ 90 Front Street Inadequate
Collection/Poor Conveyance
Village of Hempstead
DOT
K 70 Peninsula Blvd Path Public Access and
Environmental Education
Village of Lynbrook Nassau Co.
KK 91 SSP Off Ramp to Peninsula
Blvd Inadequate
Collection/Poor Conveyance
Town of Hempstead DOT
L
32 Smith Pond Tidal Impact Village of Rockville
Centre Village of Rockville
Centre
84 Tanglewood Culvert Inadequate
Collection/Poor Conveyance
Town of Hempstead Nassau Co. DPW
LL 83 Halls Pond Inadequate
Collection/Poor Conveyance
Town of Hempstead Nassau Co. DPW
M
33 Lister Park Tidal Impact Village of Rockville
Centre Village of Rockville
Centre 34
Proposed Shoreline protection/ East & West Mill
river
Shoreline/Marsh Erosion
39 Oceanview Road btw S Park
Ave & Centre Ave, Centre ave btw Lake & Oceanview Road,
and Roxbury Rd
Tidal Impact Village of East
Rockaway Village of East
Rockaway 43 East Rockaway High School
Shoreline/Marsh Erosion
53 River Ave & Waterview Rd Tidal Impact Town of Hempstead Town of Hempstead

Living with the Bay
Resiliency Strategy
Task e. Watershed Management Recommendation Report (Key Objective 5)
7
Project ID # Problem Area ID # Individual Project location Problem Type Municipal Location O&M Responsibility
N
38 Forest Ave Drainage
Improvements Inadequate
Collection/Poor Conveyance
Village of Lynbrook
Village of Lynbrook
89 NW Corner of Sunrise Hwy &
Vincent Avenue DOT
OO 41 Waldo Ave, off Main St Inadequate
Collection/Poor Conveyance
Village of East Rockaway
Village of East Rockaway
OO 42 Main st/ Lawson Ave / Waldo
Ave intersection Inadequate
Collection/Poor Conveyance
Village of East Rockaway
East Rockaway / Na Co
O 46 1. Lawson Ave btw Davis St & Franklin St 2. Lawson Ave btw
Lawrence st & North Blvd
Tidal Impact 1. East Rockaway 2.
TOH Nassau Co. DPW
P
49 Lawrence St, off Lawson Ave
Tidal Impact
Town of Hempstead Town of Hempstead 51
North Blvd, West Blvd, East Blvd, side streets off W&E
Blvd, Hewlett Point Ave 85 Rhame Avenue
Village of East Rockaway
Nassau Co. DPW
Q
45 Front St, off Main St Storm Surge
Village of East Rockaway
Nassau Co. DPW
47 Williamson St
Tidal Impact
48 6th Ave, 7th Ave, 8th Ave,
James St
50 Compton St, off Marjorie Ln Town of Hempstead
63 Harden East Rockaway DPW
Garage and John St Rec Center
R 52 Bay County Park Tidal Impact Town of Hempstead Nassau Co. DPW
S 44 East Rockaway LIRR Tidal Impact Village of East
Rockaway Village of East
Rockaway
T
54 Lawson Blvd btw Bayside Ave & Evans Ave, Evans Ave btw
Lawson Blvd & Yost Blvd
Tidal Impact
Town of Hempstead
Nassau Co. DPW
55 Evan Ave & Messick Ave
Town of Hempstead
56 Weidner Ave, off Bambrick St
57 Royal Ave btw Murdock Ave &
Hampton Rd
58 Hampton Rd, off Daly Blvd Inadequate Collection/Poor
Conveyance 60 Moore Ave & Fulton Ave
66 Lawson Blvd Drainage
Improvements Town of Hempstead Nassau Co. DPW
U
59 Long Beach Rd, off Lincoln Ave Inadequate
Collection/Poor Conveyance Town of Hempstead
Nassau Co. DPW
62 Critical Facility Resiliency:
Oceanside Fire Station Public Access and
Environmental Education
Town of Hempstead
V 67 Coastal Marsh Restoration Shoreline/Marsh
Erosion Town of Hempstead Town of Hempstead
W
40 Ocean Ave, off Pearl St
Storm Surge Village of East
Rockaway
Nassau Co. DPW
61 Downtown Resiliency and
Redevelopment Plan Village of East
Rockaway
X 35 S Park Ave & S Centre Ave
intersection Inadequate
Collection/Poor Conveyance
Village of Rockville Centre
Village of Rockville Centre
Y 88 Maple Ave and N Long Beach
Road Intersection Inadequate
Collection/Poor Conveyance
Village of Rockville Centre
Village of Rockville Centre
Z 87 Lakeview Ave and Hempstead
Ave Intersection Inadequate
Collection/Poor Conveyance
Village of Rockville Centre
Village of Rockville Centre

Living with the Bay
Resiliency Strategy
Task e. Watershed Management Recommendation Report (Key Objective 5)
8
4.0 RECOMMENDATIONS (GENERAL)
The projects involve various proposed interventions in order to solve the problems related to flooding, erosion, loss
of habitat, water quality, lack of public access and decrease in education opportunities. The solutions involved
typically adhere to the original LWTB ‘slow streams’ concept of provide additional storage through underground
storage or exfiltration, provide storage and increase water quality through green infrastructure projects, restore
habitat restoration, restore marshes and wetlands, restore stream banks, dam restoration, tidal surge protection,
grey infrastructure, greenways and providing recreational and education opportunities in the LWTB program area.
Green Infrastructure projects are recommended where practical over any hard infrastructure projects to capture
both storage and water quality components.
The Projects are divided into following four themes identified by the CAC and each theme is discussed below with
examples. A matrix was also created to show how the themes correlate through the projects.
Water Storage – Water Quality and Slow Streams
A Greener Edge – Bioswales and Marsh Restoration
Space for River – Ecohabitats and Tidal/ Surge Protection
Blue-Green Corridor – History, Education and Public Access

Living with the Bay
Resiliency Strategy
Task e. Watershed Management Recommendation Report (Key Objective 5)
9
Figure e-4: Examples of Water Storage Projects
4.1 WATER STORAGE – WATER QUALITY AND SLOW STREAMS
This theme includes solutions involving storing and treating the runoff from upstream drainage areas to reduce
flooding inundation and pollution. Additional storage is utilized to mitigate flooding occurring due to inadequate
conveyance or if the problem is located in a land-locked basin. By providing additional storage, the peak runoff from
the upstream of the problem area will be reduced and thereby attenuating the runoff on the downstream and thereby
helping to mitigate flooding. Depending on the limitations of open space, right-of-way width, and ground water table
elevation, different methods were evaluated for the Projects to provide storage. Open recharge basins are identified
when open space is available and to provide easier maintenance, underground storage or exfiltration chambers are
used in the case of limited space typically in parking lots, and green infrastructure techniques like bioswales and
raingardens are used in parking lots and roadside curbs to provide storage and improve water quality of the runoff
entering from upstream drainage area. The recharge basin and exfiltration chambers are typically utilized to provide
more storage volume and for a bigger storm event. Figure e-4 below provides examples for various projects that
fall under the Water Storage theme.
USDA NRCS WinTR-55 small watershed hydrology software was used to evaluate the storage volume depending
on Nassau County Type III rainfall distribution data for particular storm event and land use data. The storage volume
calculated was used in sizing the exfiltration chambers, recharge basins and green infrastructure bioswales. The
drainage areas were determined using USGS Stream Stats software.
Living with the Bay
Resiliency Strategy
Task e. Watershed Management Recommendation Report (Key Objective 5)
10
Figure e-5: Examples of Green Infrastructure Projects
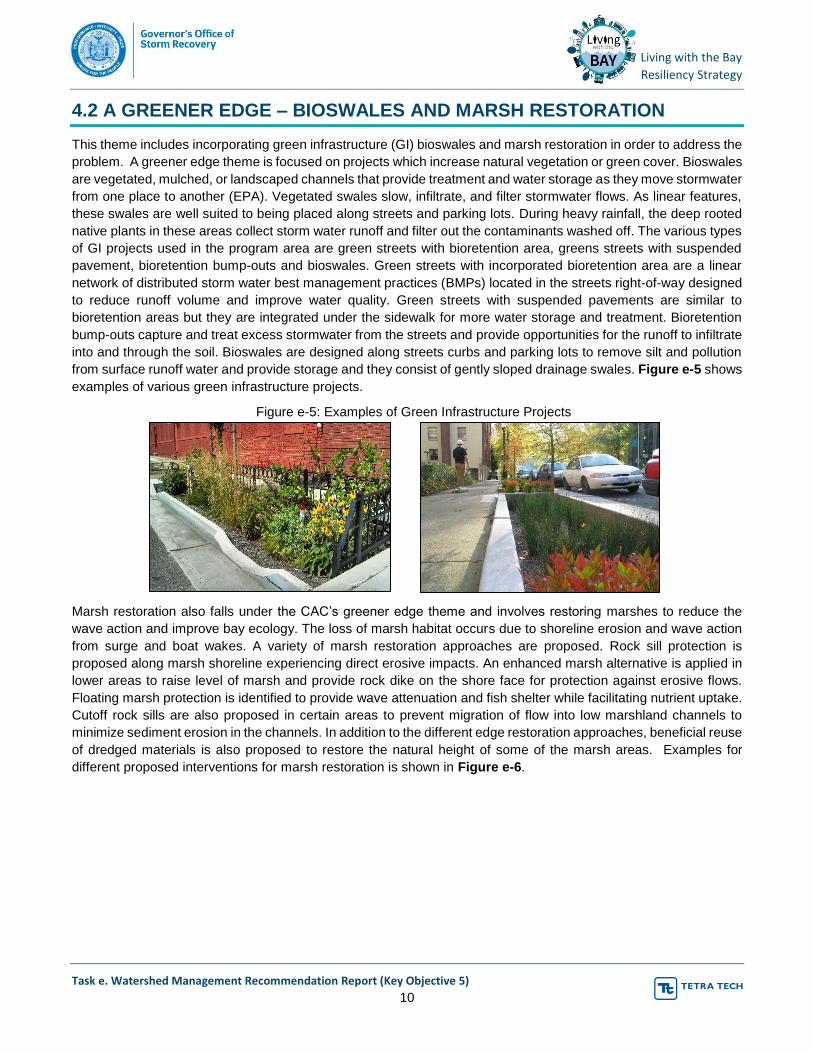
4.2 A GREENER EDGE – BIOSWALES AND MARSH RESTORATION
This theme includes incorporating green infrastructure (GI) bioswales and marsh restoration in order to address the
problem. A greener edge theme is focused on projects which increase natural vegetation or green cover. Bioswales
are vegetated, mulched, or landscaped channels that provide treatment and water storage as they move stormwater
from one place to another (EPA). Vegetated swales slow, infiltrate, and filter stormwater flows. As linear features,
these swales are well suited to being placed along streets and parking lots. During heavy rainfall, the deep rooted
native plants in these areas collect storm water runoff and filter out the contaminants washed off. The various types
of GI projects used in the program area are green streets with bioretention area, greens streets with suspended
pavement, bioretention bump-outs and bioswales. Green streets with incorporated bioretention area are a linear
network of distributed storm water best management practices (BMPs) located in the streets right-of-way designed
to reduce runoff volume and improve water quality. Green streets with suspended pavements are similar to
bioretention areas but they are integrated under the sidewalk for more water storage and treatment. Bioretention
bump-outs capture and treat excess stormwater from the streets and provide opportunities for the runoff to infiltrate
into and through the soil. Bioswales are designed along streets curbs and parking lots to remove silt and pollution
from surface runoff water and provide storage and they consist of gently sloped drainage swales. Figure e-5 shows
examples of various green infrastructure projects.
Marsh restoration also falls under the CAC’s greener edge theme and involves restoring marshes to reduce the
wave action and improve bay ecology. The loss of marsh habitat occurs due to shoreline erosion and wave action
from surge and boat wakes. A variety of marsh restoration approaches are proposed. Rock sill protection is
proposed along marsh shoreline experiencing direct erosive impacts. An enhanced marsh alternative is applied in
lower areas to raise level of marsh and provide rock dike on the shore face for protection against erosive flows.
Floating marsh protection is identified to provide wave attenuation and fish shelter while facilitating nutrient uptake.
Cutoff rock sills are also proposed in certain areas to prevent migration of flow into low marshland channels to
minimize sediment erosion in the channels. In addition to the different edge restoration approaches, beneficial reuse
of dredged materials is also proposed to restore the natural height of some of the marsh areas. Examples for
different proposed interventions for marsh restoration is shown in Figure e-6.

Living with the Bay
Resiliency Strategy
Task e. Watershed Management Recommendation Report (Key Objective 5)
11
Figure e-6: Examples of Marsh Restoration Interventions
Existing Conditions Rock Sill/Cutoff Rock Sill
Enhanced Marsh Floating Marsh

Living with the Bay
Resiliency Strategy
Task e. Watershed Management Recommendation Report (Key Objective 5)
12
4.3 SPACE FOR THE RIVER - ECOHABITATS & TIDAL/SURGE PROTECTION
This theme includes projects improving habitat restoration and providing tidal and surge protection. Habitat
restoration is the method practiced to renew or restore degraded or damaged ecosystems and habitats in the
environment. Fish ladders are structures allowing migrating fish passage over or around an obstacle on a river
(NOAA).
The ladders contain series of ascending pools that the fish reach by swimming against a stream of water. Fish travel
through the rushing water, rest in a pool, and then repeat the process until they are out of ladder. This general
principle is followed in any design of fish ladders and therefore improves fish habitat in water bodies.
Living shorelines use plants or other natural elements to stabilize estuarine coasts, bays and tributaries (NOAA).
Living shorelines trap sediments from tidal waters, improve water quality, provide fisheries habitat, increase
biodiversity, and promote recreation. They act as natural barriers against storm and provide wave attenuation and
add resiliency. For the LWTB projects, both fish ladders and living shorelines are proposed in the list of potential
projects. Figure e-7 shows examples of fish ladder and living shorelines applications.
Figure e-7: Examples of Fish Ladders and Living Shorelines
NOAA Fisheries / West Coast Region
SW Florida Water Management District/Hunter Springs Living Shoreline Project

Living with the Bay
Resiliency Strategy
Task e. Watershed Management Recommendation Report (Key Objective 5)
13
Tidal and surge management projects involve physical improvements to mitigate the impacts of a high tailwater
condition and typically include check valves, elevating bulkheads and raising roads. Bulkheads protect the shoreline
from hide tides and storm surge from inundating the inland. Vinyl sheeting with a tie-back system is typically used
and lasts a long time. Timber is also used but has a shorter life span and needs to be replaced more frequently.
Check valves are installed on outfall pipes to allow stormwater to exit during non-high tide event while managing to
prevent any back flow of tidal influences into the drainage system during high tide. Duck bill check valve and in-line
check valve are the most commonly used back flow prevention devices. In addition to check valves stormwater
treatment structures and catch basin filter bags are added to remove debris and silt from road runoff, cleaning the
stormwater before it enters into the receiving channel and, at the time, helping keep the check valve clean from
debris and properly operating. Raising roads brings road elevation above the high water levels along with allowing
for additional storm water storage during typical rain events. Examples of the tidal and surge management projects
are shown in Figure e-8.
Figure e-8: Examples of Tidal and Surge Management Projects

Living with the Bay
Resiliency Strategy
Task e. Watershed Management Recommendation Report (Key Objective 5)
14
Figure e-9: Examples of Blue-Green Corridor Theme Solutions
4.4 BLUE-GREEN CORRIDOR – HISTORY, EDUCATION, & PUBLIC ACCESS
This theme includes projects incorporating solutions improving accessibility to the waterfront, preservation of
cultural heritage and historical properties, and creating new education opportunities. Along the Blue-green corridor,
the multi-use pathway can also be used as a flood berm if constructed at the proper elevation, while at the same
time providing accessibility to the waterfront, increasing safety and ecological value, and creating new education
and recreation opportunities for communities around the river. The examples of blue-green corridor theme solutions
are shown in Figure e-9.
Living with the Bay
Resiliency Strategy
Task e. Watershed Management Recommendation Report (Key Objective 5)
15
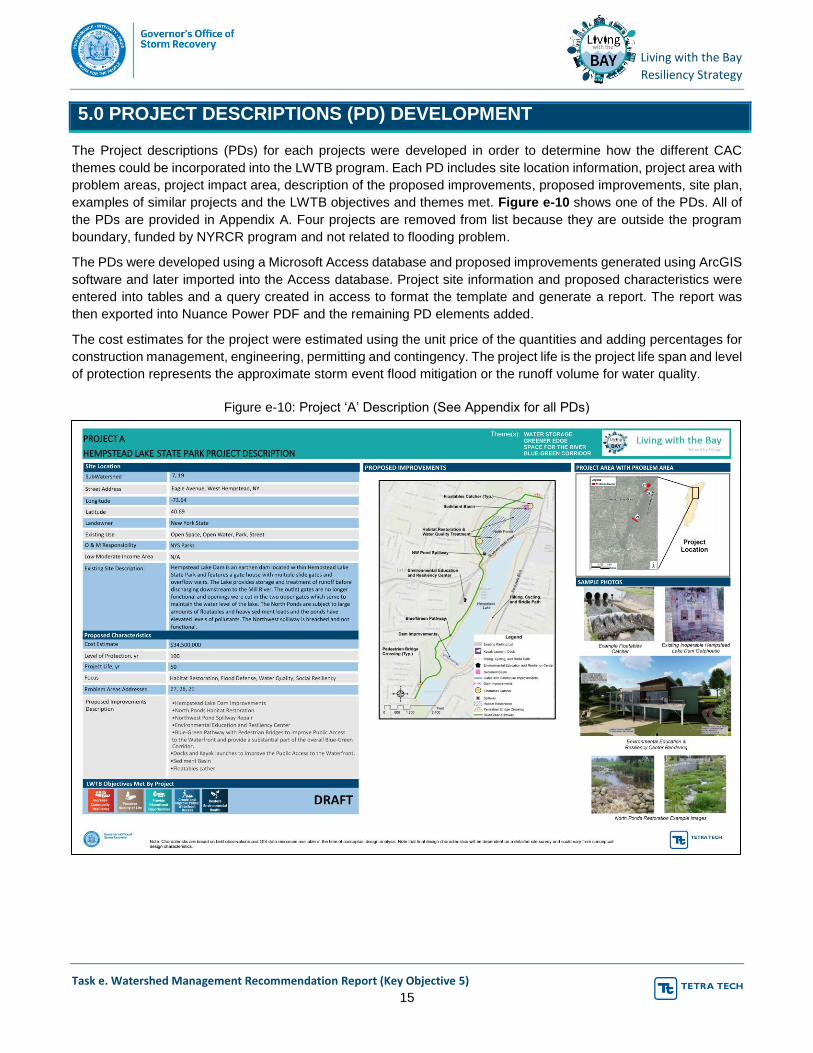
Figure e-10: Project ‘A’ Description (See Appendix for all PDs)
5.0 PROJECT DESCRIPTIONS (PD) DEVELOPMENT
The Project descriptions (PDs) for each projects were developed in order to determine how the different CAC
themes could be incorporated into the LWTB program. Each PD includes site location information, project area with
problem areas, project impact area, description of the proposed improvements, proposed improvements, site plan,
examples of similar projects and the LWTB objectives and themes met. Figure e-10 shows one of the PDs. All of
the PDs are provided in Appendix A. Four projects are removed from list because they are outside the program
boundary, funded by NYRCR program and not related to flooding problem.
The PDs were developed using a Microsoft Access database and proposed improvements generated using ArcGIS
software and later imported into the Access database. Project site information and proposed characteristics were
entered into tables and a query created in access to format the template and generate a report. The report was
then exported into Nuance Power PDF and the remaining PD elements added.
The cost estimates for the project were estimated using the unit price of the quantities and adding percentages for
construction management, engineering, permitting and contingency. The project life is the project life span and level
of protection represents the approximate storm event flood mitigation or the runoff volume for water quality.

Living with the Bay
Resiliency Strategy
Task e. Watershed Management Recommendation Report (Key Objective 5)
16
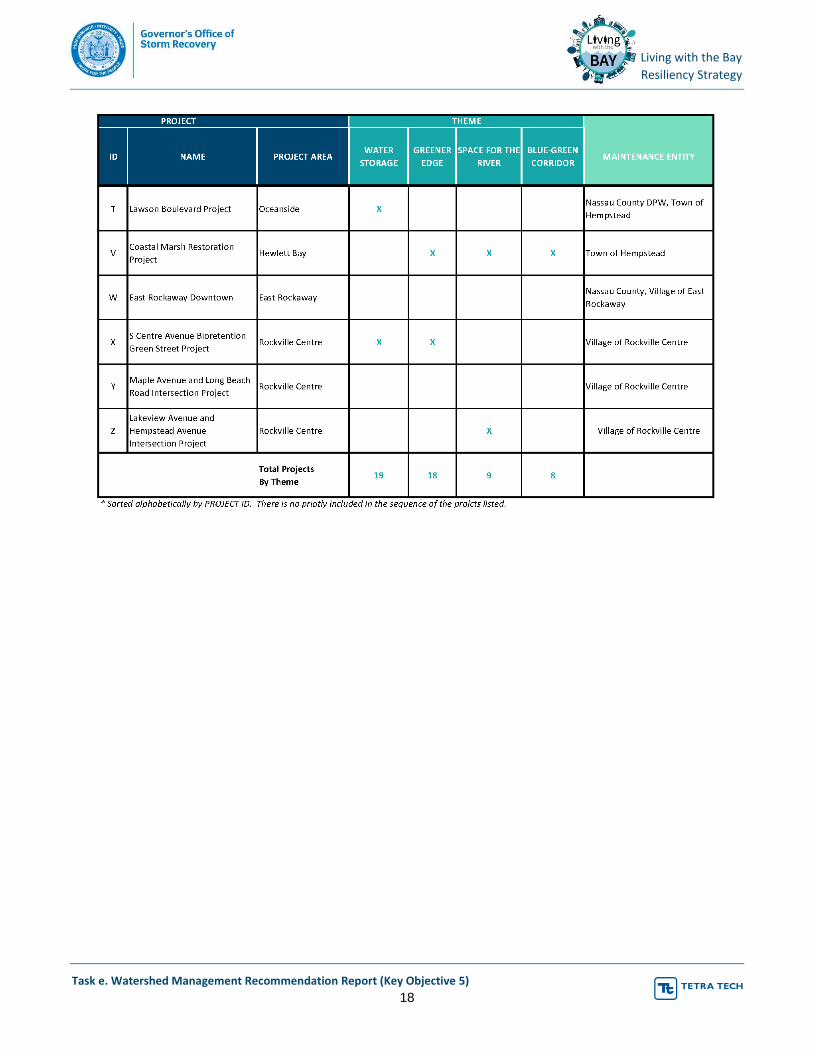
6.0 CONCLUSION
The final PDs were analyzed for LWTB objectives and a matrix (Table e-2) was created to compare the CAC’s
themes by project. In some cases, a single project covers more than one theme. The matrix shows that 19 projects
fall under water storage theme, 18 projects fall under greener edge theme, 9 projects fall under space for river
theme and 8 projects fall under blue-green corridor theme.
Table e-2: Project Information Summary Matrix *

Living with the Bay
Resiliency Strategy
Task e. Watershed Management Recommendation Report (Key Objective 5)
17
Living with the Bay
Resiliency Strategy
Task e. Watershed Management Recommendation Report (Key Objective 5)
18
