limited - bombay stock exchange€¦ · limited an lnj bhilwara group company rswm/sectt/2019...
TRANSCRIPT
Limited an LNJ Bhilwara Group Company
RSWM/SECTT/2019 August 16, 2019
PROUD TO BE INDIAN PRIVILEGED TO BE GLOBAL
BSE Limited Corporate Relationship Department, 1st Floor, New Trading Ring, Rotunda Building, P.J. Towers, Dalal Street,
National Stock Exchange of India Limited Listing Department,
MUMBAI - 400 001.
Scrip Code: 500350
Exchange Plaza, C-1, Block - G, Bandra-Kurla Complex, Bandra (East), MUMBAI - 400 051.
Scrip Code: RSWM
Sub : Notice of 58th Annual General Meeting (AGM) and Annual Report of the Company.
Dear Sir/ Madam,
lo terms of Regulatiou 34( 1) of the SEBI (List ing Obligations and Disclosure Req uirements) Regu lations, 2015, please find enclosed the Notice convening the 581h Annual General Meeting of the Company to be held on Wednesday, the I 1 th September 20 19 at 11 .30 A.Mat the Registered Office of the Company at Kharigram, Post Office - Gulabpura, Distt. Bhilwara - 311021, Rajasthan and the Annual Report for the financial year 2018-19.
The Notice of Annual General Meeting scheduled on 11th September, 2019 along with the Annual Report is being sent to the shareholders of the Company separately.
The above is also uploaded on the website of the Company www.rswm.in
Kindly take the same on record.
Thanking You,
Yours faithfully, For RSWM LIMITED
Y-SURENDER GUPTA COMPANY SECRETARY FCS-2615
Encl. : As above
(Formerly Rajasthan Spinning & Weaving Mills Limited)
Corporate Office : Regd. Office: Bhilwara Towers, A-12, Sector-1 Kharigram, Post Office Gulabpura - 311 021
Naida - 201 301 (NCR-Delhi), India Dist!. Bhilwara, (Rajasthan), India Tel : +91-120-4390300 (EPABX) Tel: +91-1483-223144 to 223150, 223478
Fax: +91-120-4277841 Fax: +91-1483-223361, 223479 Website: www.rswm.in Website: www.lnjbhilwara.com
GSTIN: 09AAACR9700M1Z1 GSTIN: 08AAACR9700M1Z3
Corporate Identification Number: L 17115RJ1960PLC008216

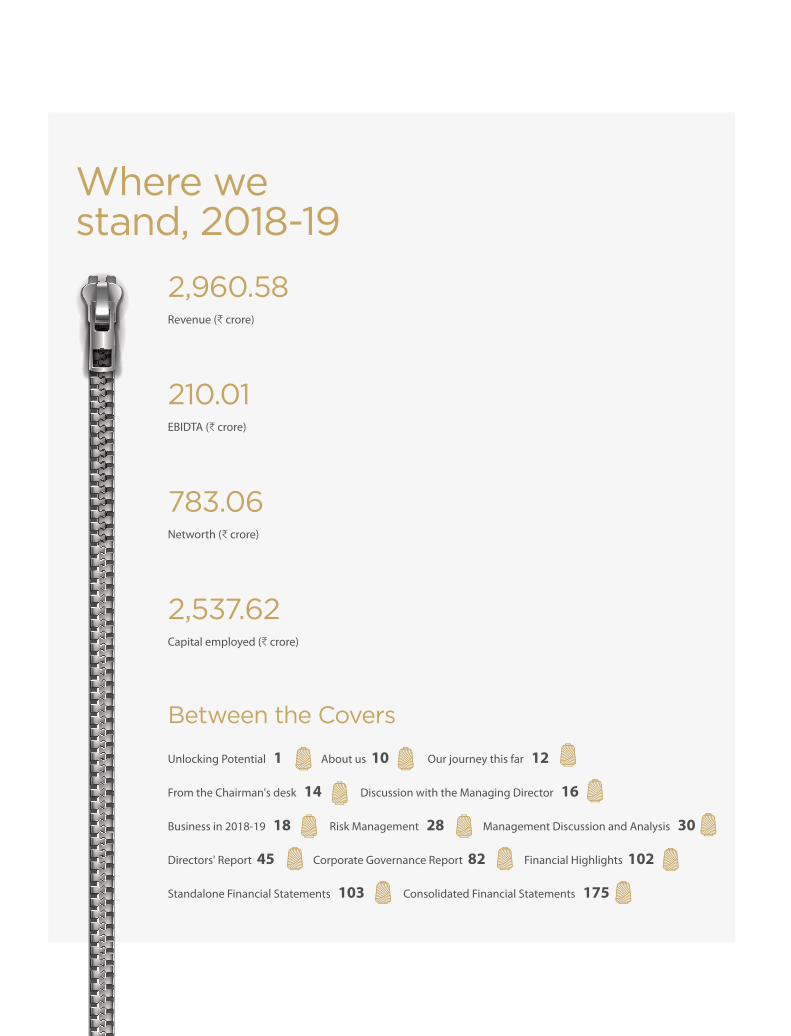
Where we stand, 2018-19
2,960.58Revenue (C crore)
210.01EBIDTA (C crore)
783.06Networth (C crore)
2,537.62Capital employed (C crore)
Between the Covers
Unlocking Potential 1 About us 10 Our journey this far 12
From the Chairman's desk 14 Discussion with the Managing Director 16
Business in 2018-19 18 Risk Management 28 Management Discussion and Analysis 30
Directors' Report 45 Corporate Governance Report 82 Financial Highlights 102
Standalone Financial Statements 103 Consolidated Financial Statements 175

1PB
There are times when faith must override apparent facts.
Our past efforts did not bring in the desired results; but that does not mean the path we were on lacked potential. It just meant, we must review our actions, reassess strategies and revamp our efforts.
And that’s what we did. We knew for a fact that our direction was right; we were aware of the potential we held. All we needed to do was bring in the right keys to unlock that potential.
Hence, we welcomed the necessary paradigm shifts; we tweaked our strategies to gain the most leverage out of our efforts, we reorganised our plans and actions in a way that would fortify our performances and results in the future.
We are unlocking our potential in a way we know best with strategy, skill and stubborn persistence!

ANNUAL REPORT20 1819
32
Unlocking potential
Of our denim businessDenim is a growing product. But our volumes dipped.
Denim is being bought everywhere. But we reported the largest loss in our history.
Our denim facility is one of the better units in India. But cut-throat competition forced us to throttle operations.
We resolved to challenge the state-of-affairs. We determined to change.
Leveraged the outsourcing route to strengthen our competitive edge in an increasingly cluttered business space.
Altered plant equipment, processes and people to improve product quality, increase the proportion of fresh fabric in the overall volumes has increased from 79% in 2017-18 to 85% in 2018-19 and to 90% by June 2019.
Brought a design developer on board for developing premium designs.
Corporate Overview Management Reports Financial Statements1 45 103
32
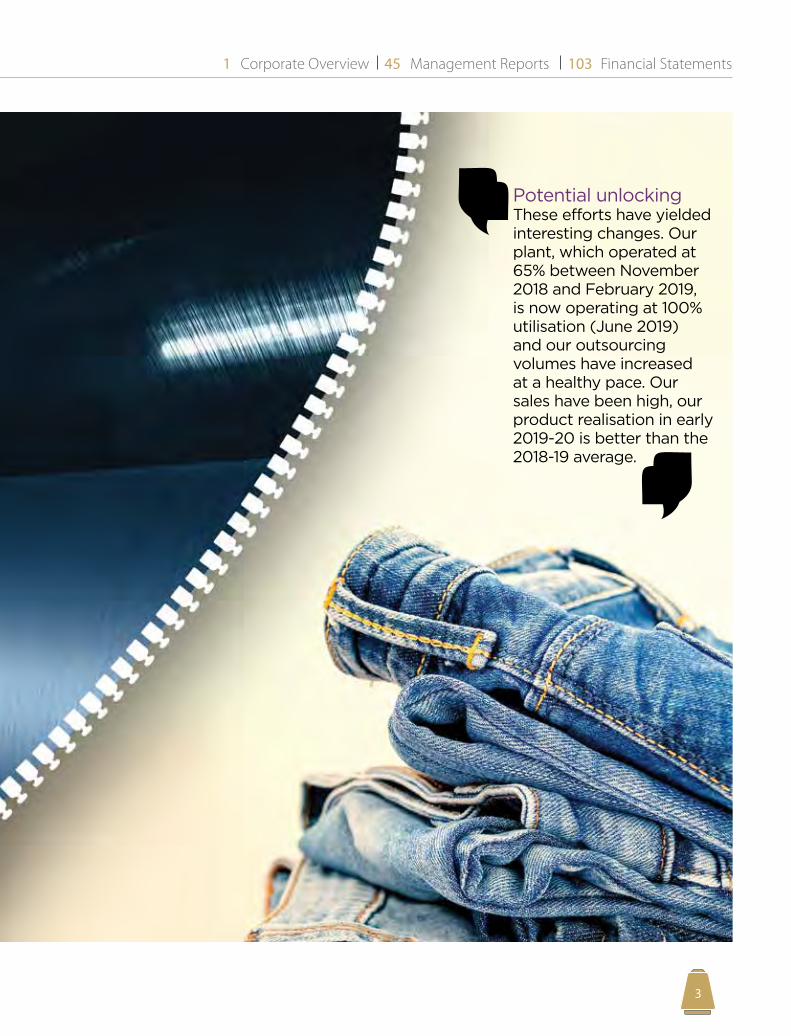
Potential unlocking These efforts have yielded interesting changes. Our plant, which operated at 65% between November 2018 and February 2019, is now operating at 100% utilisation (June 2019) and our outsourcing volumes have increased at a healthy pace. Our sales have been high, our product realisation in early 2019-20 is better than the 2018-19 average.
ANNUAL REPORT20 1819
54
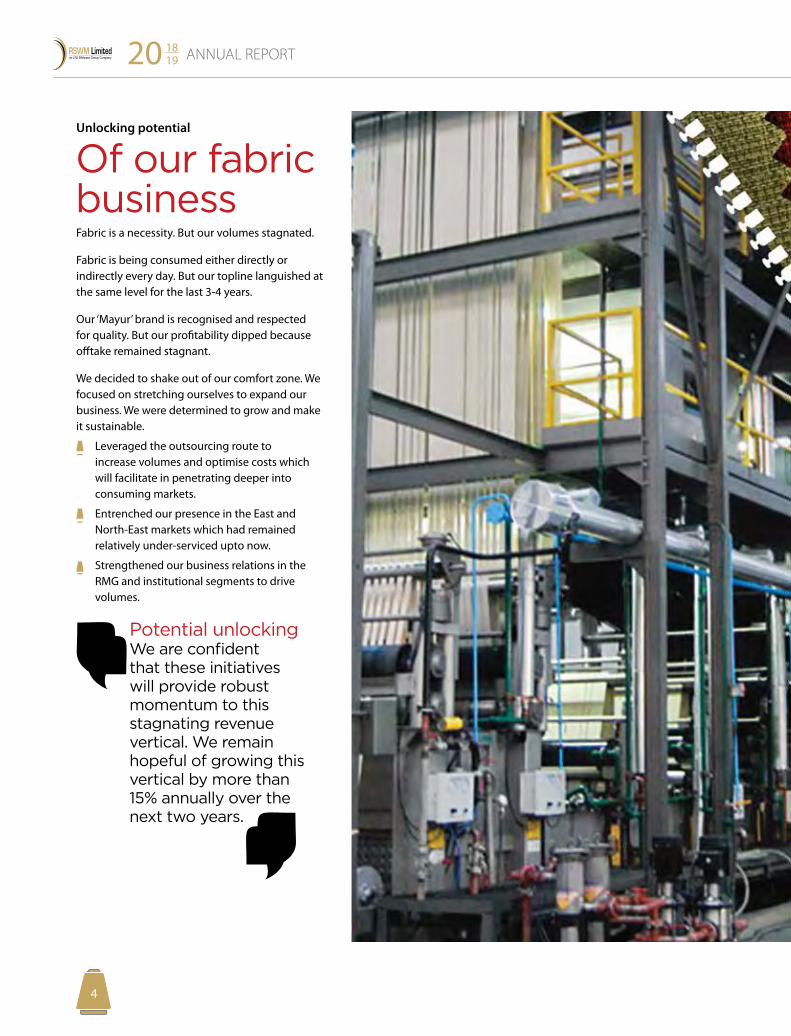
Of our fabric businessFabric is a necessity. But our volumes stagnated.
Fabric is being consumed either directly or indirectly every day. But our topline languished at the same level for the last 3-4 years.
Our ‘Mayur’ brand is recognised and respected for quality. But our profitability dipped because offtake remained stagnant.
We decided to shake out of our comfort zone. We focused on stretching ourselves to expand our business. We were determined to grow and make it sustainable.
Leveraged the outsourcing route to increase volumes and optimise costs which will facilitate in penetrating deeper into consuming markets.
Entrenched our presence in the East and North-East markets which had remained relatively under-serviced upto now.
Strengthened our business relations in the RMG and institutional segments to drive volumes.
Unlocking potential
Potential unlocking We are confident that these initiatives will provide robust momentum to this stagnating revenue vertical. We remain hopeful of growing this vertical by more than 15% annually over the next two years.
Corporate Overview Management Reports Financial Statements1 45 103
54
ANNUAL REPORT20 1819
76
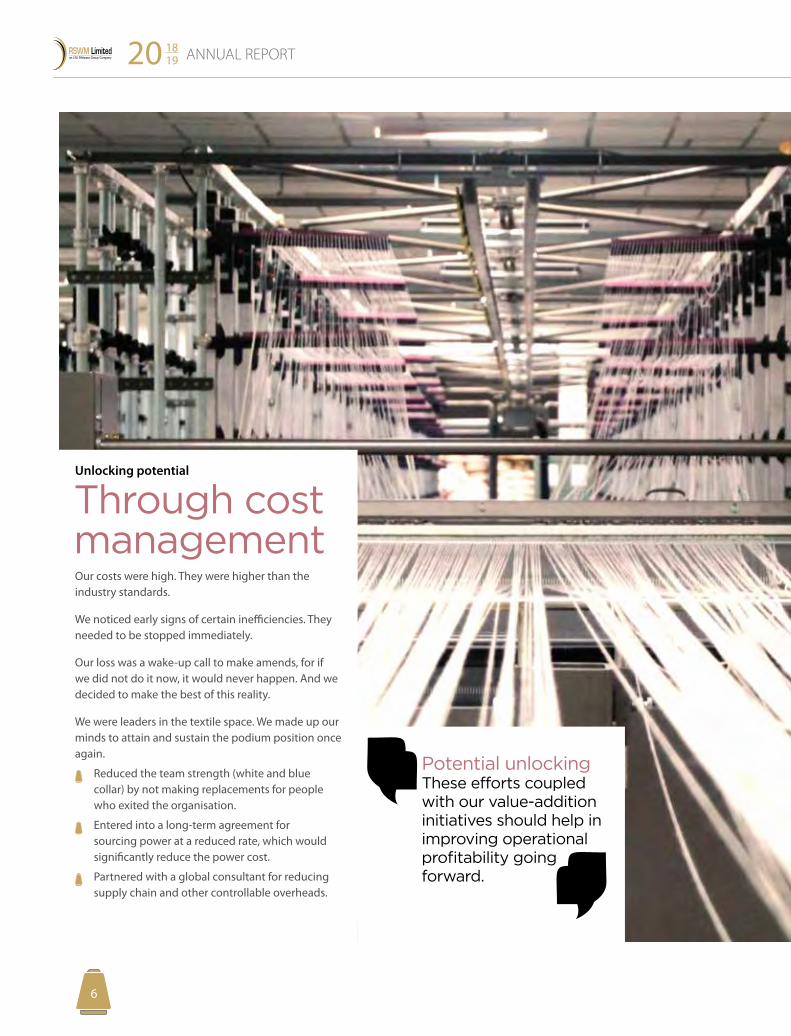
Through cost managementOur costs were high. They were higher than the industry standards.
We noticed early signs of certain inefficiencies. They needed to be stopped immediately.
Our loss was a wake-up call to make amends, for if we did not do it now, it would never happen. And we decided to make the best of this reality.
We were leaders in the textile space. We made up our minds to attain and sustain the podium position once again.
Reduced the team strength (white and blue collar) by not making replacements for people who exited the organisation.
Entered into a long-term agreement for sourcing power at a reduced rate, which would significantly reduce the power cost.
Partnered with a global consultant for reducing supply chain and other controllable overheads.
Unlocking potential
Potential unlocking These efforts coupled with our value-addition initiatives should help in improving operational profitability going forward.

Corporate Overview Management Reports Financial Statements1 45 103
76
ANNUAL REPORT20 1819
98
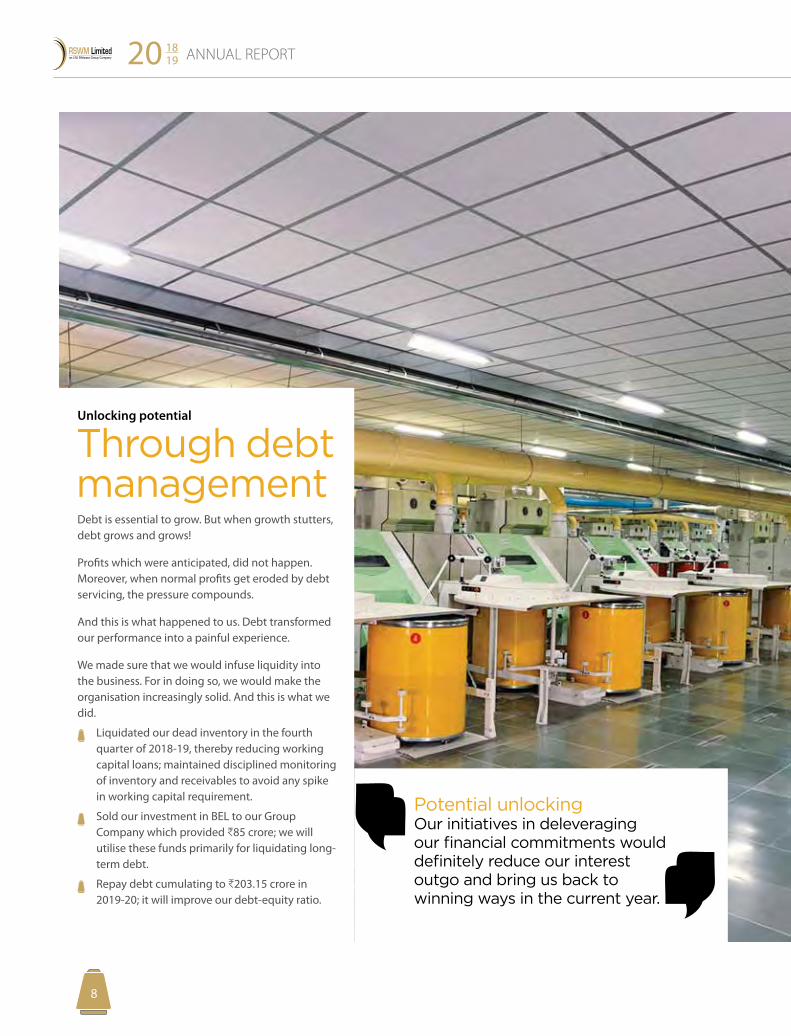
Through debt management
Unlocking potential
Debt is essential to grow. But when growth stutters, debt grows and grows!
Profits which were anticipated, did not happen. Moreover, when normal profits get eroded by debt servicing, the pressure compounds.
And this is what happened to us. Debt transformed our performance into a painful experience.
We made sure that we would infuse liquidity into the business. For in doing so, we would make the organisation increasingly solid. And this is what we did.
Liquidated our dead inventory in the fourth quarter of 2018-19, thereby reducing working capital loans; maintained disciplined monitoring of inventory and receivables to avoid any spike in working capital requirement.
Sold our investment in BEL to our Group Company which provided C85 crore; we will utilise these funds primarily for liquidating long-term debt.
Repay debt cumulating to C203.15 crore in 2019-20; it will improve our debt-equity ratio.
Potential unlocking Our initiatives in deleveraging our financial commitments would definitely reduce our interest outgo and bring us back to winning ways in the current year.

Corporate Overview Management Reports Financial Statements1 45 103
98
ANNUAL REPORT20 1819
1110
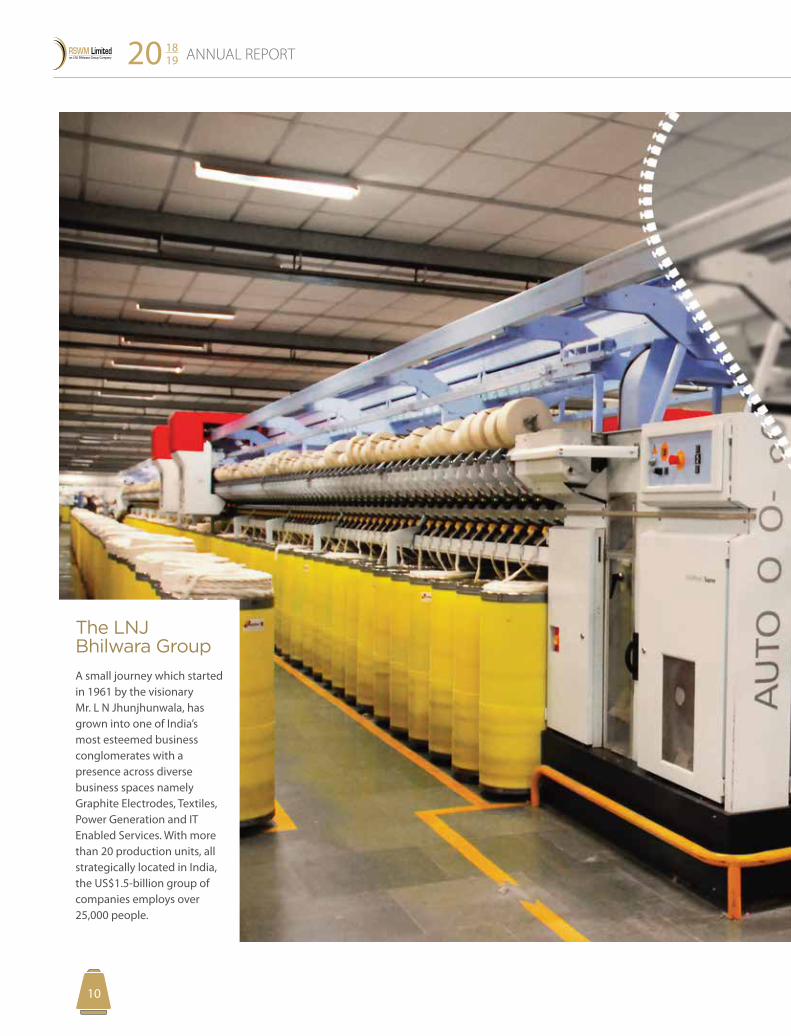
The LNJ Bhilwara Group
A small journey which started in 1961 by the visionary Mr. L N Jhunjhunwala, has grown into one of India’s most esteemed business conglomerates with a presence across diverse business spaces namely Graphite Electrodes, Textiles, Power Generation and IT Enabled Services. With more than 20 production units, all strategically located in India, the US$1.5-billion group of companies employs over 25,000 people.
Corporate Overview Management Reports Financial Statements1 45 103
1110
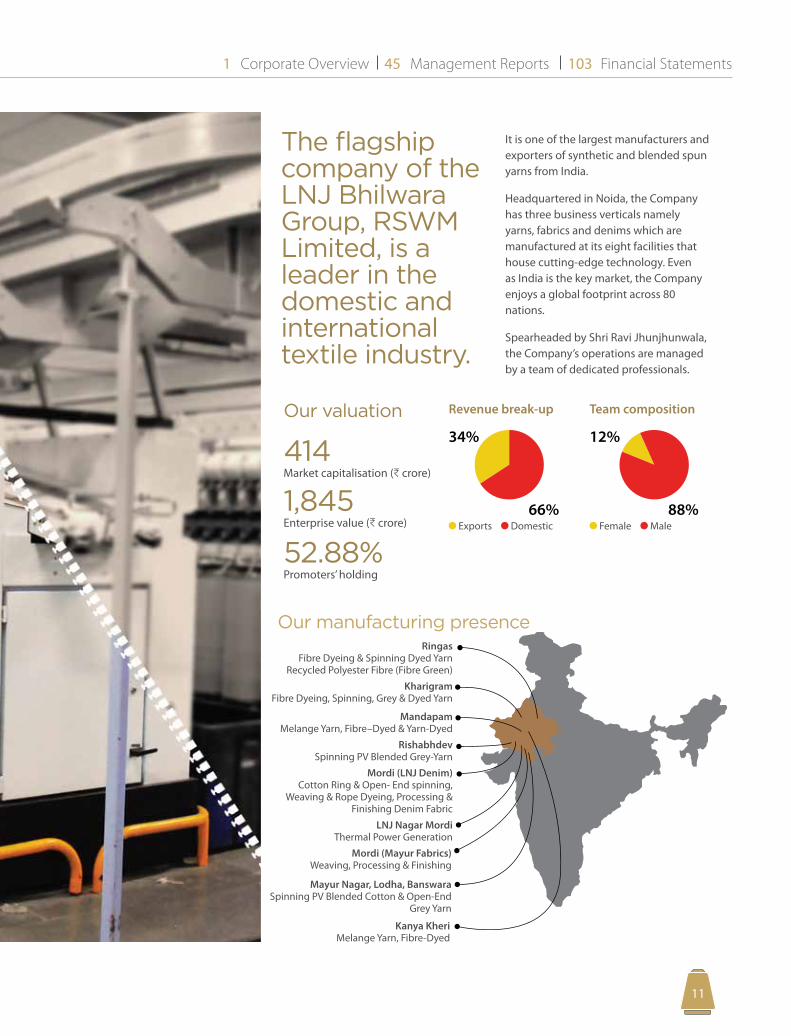
414Market capitalisation (C crore)
1,845Enterprise value (C crore)
52.88%Promoters’ holding
Our valuation
Our manufacturing presence Ringas
Fibre Dyeing & Spinning Dyed Yarn Recycled Polyester Fibre (Fibre Green)
Kharigram Fibre Dyeing, Spinning, Grey & Dyed Yarn
MandapamMelange Yarn, Fibre–Dyed & Yarn-Dyed
Rishabhdev Spinning PV Blended Grey-Yarn
Mordi (LNJ Denim) Cotton Ring & Open- End spinning,
Weaving & Rope Dyeing, Processing & Finishing Denim Fabric
LNJ Nagar Mordi Thermal Power Generation
Mordi (Mayur Fabrics)Weaving, Processing & Finishing
Mayur Nagar, Lodha, BanswaraSpinning PV Blended Cotton & Open-End
Grey Yarn
Kanya KheriMelange Yarn, Fibre-Dyed
The flagship company of the LNJ Bhilwara Group, RSWM Limited, is a leader in the domestic and international textile industry.
It is one of the largest manufacturers and exporters of synthetic and blended spun yarns from India.
Headquartered in Noida, the Company has three business verticals namely yarns, fabrics and denims which are manufactured at its eight facilities that house cutting-edge technology. Even as India is the key market, the Company enjoys a global footprint across 80 nations.
Spearheaded by Shri Ravi Jhunjhunwala, the Company’s operations are managed by a team of dedicated professionals.
Revenue break-up
66%
34%
Exports Domestic
Team composition
88%
12%
Female Male
ANNUAL REPORT20 1819
1312
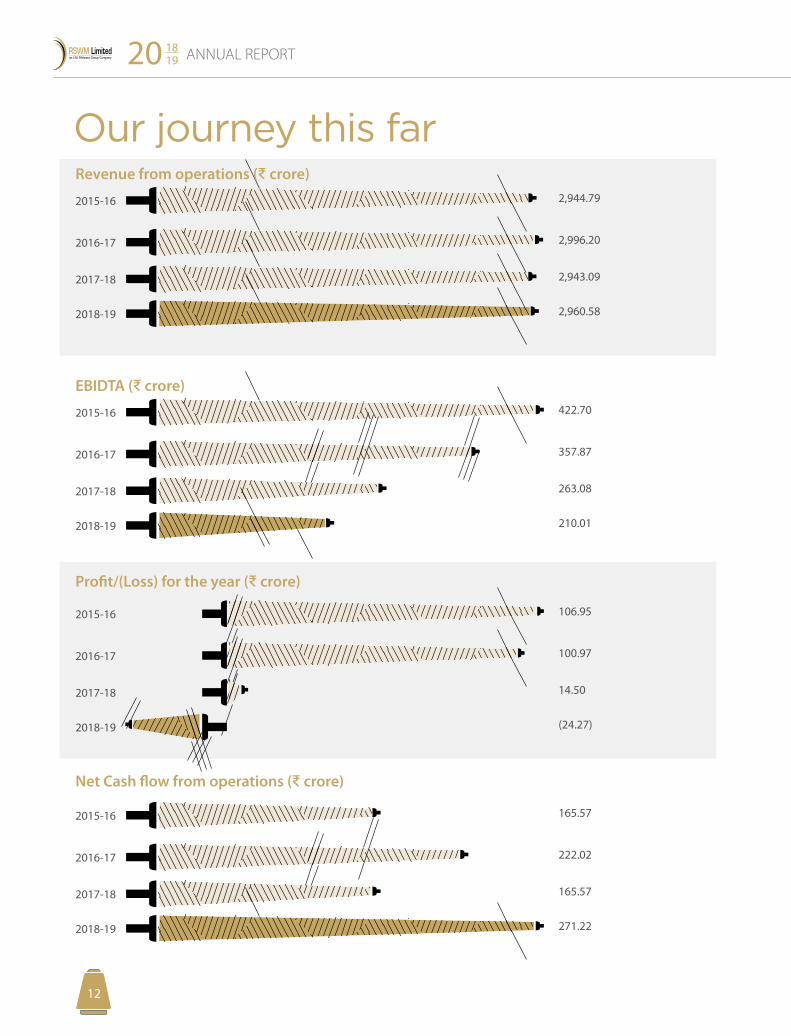
Our journey this farRevenue from operations (D crore)
2015-16
2016-17
2017-18
2018-19
2,944.79
2,996.20
2,943.09
2,960.58
Net Cash flow from operations (D crore)
2015-16
2016-17
2017-18
2018-19
165.57
222.02
165.57
271.22
EBIDTA (D crore)
2015-16
2016-17
2017-18
2018-19
422.70
357.87
263.08
210.01
Profit/(Loss) for the year (D crore)
2015-16
2016-17
2017-18
2018-19
106.95
100.97
14.50
(24.27)
Corporate Overview Management Reports Financial Statements1 45 103
1312
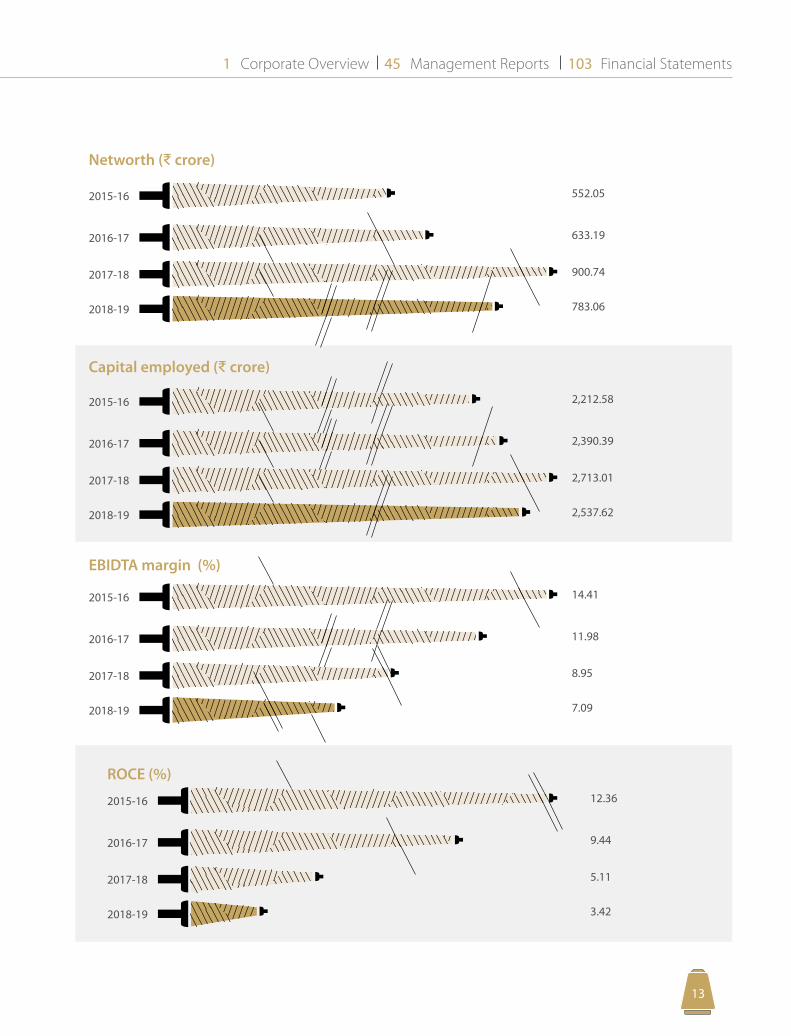
Capital employed (D crore)
2015-16
2016-17
2017-18
2018-19
2,212.58
2,390.39
2,713.01
2,537.62
EBIDTA margin (%)
2015-16
2016-17
2017-18
2018-19
14.41
11.98
8.95
7.09
ROCE (%)
2015-16
2016-17
2017-18
2018-19
12.36
9.44
5.11
3.42
Networth (D crore)
2015-16
2016-17
2017-18
2018-19
552.05
633.19
900.74
783.06
ANNUAL REPORT20 1819
1514
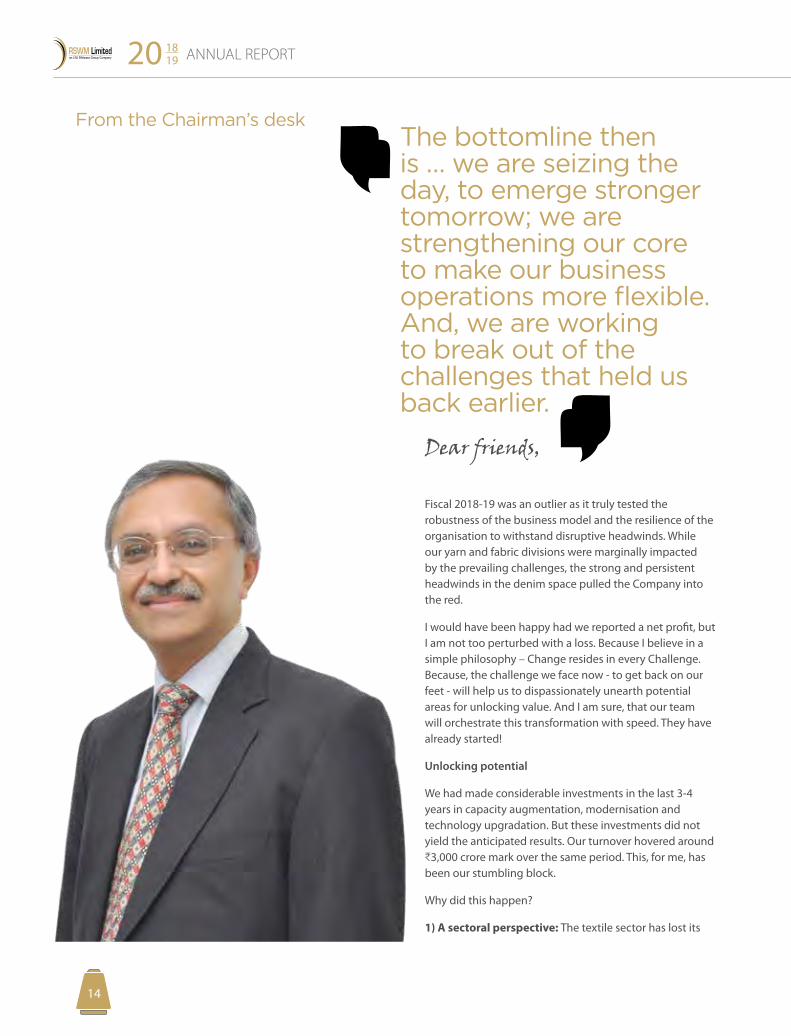
From the Chairman’s deskThe bottomline then is … we are seizing the day, to emerge stronger tomorrow; we are strengthening our core to make our business operations more flexible. And, we are working to break out of the challenges that held us back earlier.
Dear friends,
Fiscal 2018-19 was an outlier as it truly tested the robustness of the business model and the resilience of the organisation to withstand disruptive headwinds. While our yarn and fabric divisions were marginally impacted by the prevailing challenges, the strong and persistent headwinds in the denim space pulled the Company into the red.
I would have been happy had we reported a net profit, but I am not too perturbed with a loss. Because I believe in a simple philosophy – Change resides in every Challenge. Because, the challenge we face now - to get back on our feet - will help us to dispassionately unearth potential areas for unlocking value. And I am sure, that our team will orchestrate this transformation with speed. They have already started!
Unlocking potential
We had made considerable investments in the last 3-4 years in capacity augmentation, modernisation and technology upgradation. But these investments did not yield the anticipated results. Our turnover hovered around C3,000 crore mark over the same period. This, for me, has been our stumbling block.
Why did this happen?
1) A sectoral perspective: The textile sector has lost its
Corporate Overview Management Reports Financial Statements1 45 103
1514
momentum post demonetisation and the introduction of GST. In FY17, all segments within the textile sector registered a de-growth, except the Ready Made Garment (RMG) vertical which grew at a meagre 1%. In FY 18, all the segments performed better but the RMG space declined by about 1% which dealt a body blow to the textile sector. Market prices of all products in the textile value chain were significantly down owing to the competitive intensity prevailing in the domestic ecosystem. Margins got squeezed.
Moreover, we could not divert our output to international markets as other global textile hubs namely Bangladesh, Vietnam, and Cambodia (which are protected by their Governments) emerged more competitive. As a result, considerable global growth opportunities got diverted to these nations.
2) An internal reality: Our edge in the intensely competitive sectoral space dulled a little. This was owing to the additional costs that got built into the system with multiple rounds of investments. Inefficiencies started creeping in. The debt burden expanded with each passing year. And the consequent interest liability eroded business margins.
I am happy to state that we have not only drawn the contours of our potential unlocking blueprint, but have also made some headway in implementing important initiatives.
We are cutting costs. We are improving man-machine productivity and enhancing product quality. We are actively considering the ‘make-or-buy’ strategy based on multiple parameters. We are developing niche products that can enhance value-addition. We are entering new market spaces. We are adding more customers. We are closely monitoring our working capital. We are
implementing strategies to enhance our cash flow. All this is happening simultaneously.
The energy in the team is high. The passion to get back to winning ways is visible. The buzz is palpable. These realities gives me the confidence that success is just round the corner.
From a sectoral perspective, the opportunities are significant. Globally, trade wars arising out of protectionist policies by developed economies is creating interesting growth avenues for multiple sectors – textiles is one of them.
But the sector needs effective Government intervention, policies and legislations that allow domestic players to operate on a level playing field with global peers. When that happens, I am confident that the sector will witness robust growth and emerge as a true global textile hub.
At RSWM, the excitement is intense. For a number of things are happening at the same time, some are course corrections while others are new initiatives. The bottomline then is that we are seizing the day, to emerge stronger tomorrow; we are strengthening our core to make our business operations more flexible. And as we are working to break out of the challenges that held us back earlier, opinion makers suggest that sectoral tailwinds also herald promising times going forward.
Regards
Ravi Jhunjhunwala Chairman
The energy in the team is high. The passion to get back to winning ways is visible. The buzz is palpable. These realities gives me the confidence that success is just round the corner.
ANNUAL REPORT20 1819
1716
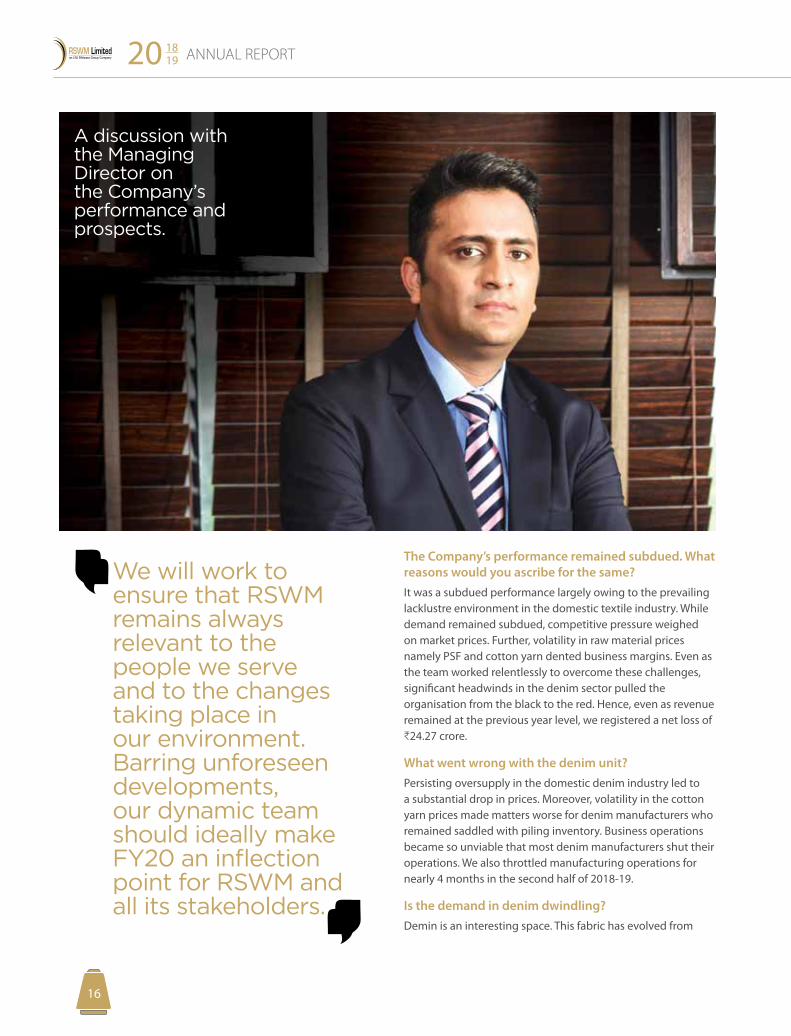
A discussion with the Managing Director on the Company’s performance and prospects.
The Company’s performance remained subdued. What reasons would you ascribe for the same?It was a subdued performance largely owing to the prevailing lacklustre environment in the domestic textile industry. While demand remained subdued, competitive pressure weighed on market prices. Further, volatility in raw material prices namely PSF and cotton yarn dented business margins. Even as the team worked relentlessly to overcome these challenges, significant headwinds in the denim sector pulled the organisation from the black to the red. Hence, even as revenue remained at the previous year level, we registered a net loss of C24.27 crore.
What went wrong with the denim unit?Persisting oversupply in the domestic denim industry led to a substantial drop in prices. Moreover, volatility in the cotton yarn prices made matters worse for denim manufacturers who remained saddled with piling inventory. Business operations became so unviable that most denim manufacturers shut their operations. We also throttled manufacturing operations for nearly 4 months in the second half of 2018-19.
Is the demand in denim dwindling?Demin is an interesting space. This fabric has evolved from
We will work to ensure that RSWM remains always relevant to the people we serve and to the changes taking place in our environment. Barring unforeseen developments, our dynamic team should ideally make FY20 an inflection point for RSWM and all its stakeholders.
Corporate Overview Management Reports Financial Statements1 45 103
1716
being only teenage fashion to corporate attire. It is being worn by all toddlers to senior citizens. There is no dearth of demand. The issue lies in the huge capacities created in anticipation of demand leading to oversupply. This oversupply is largely pertaining to vanilla products, the niche value-added segment continues to grow at a healthy uptick.
What corrective action are you taking for recalibrating the denim vertical?Fiscal 2019-20 is a new start for our denim unit. As a first step to make this a reality we eliminated the dead weight we were carrying – we sold off our inventory. We on-boarded an enthusiastic, experienced and energetic professional to head the denim business. We recruited a design developer for new product development. We have tweaked our processes to bring in stability to our operations. Our Grade A (fresh fabric) proportions has consistently been at 90% (in early 2019-20) against the fluctuating 75-85% band in 2018-19, which should help in superior realisation. We have prudently balanced our production planning between in-house and outsourced manufacturing to maximise profitability. The initial results from these efforts are satisfying as our infrastructure is operating at close to 100% utilisation and our sales volumes exceed our output.
The fabric business has remained largely range-bound. Is it going to be this way or are we looking at giving it a push?Our fabric business has always been a flanking vertical. Its capacity, volumes and revenue have remained low. Going forward, we are committed to growing this vertical in a phased manner. We will leverage multiple options to optimise our cost structure. Even as we continue to entrench ourselves in existing markets, we will enter new markets with speed and dexterity. These efforts, I expect will fructify in growing our topline by more than 50% over the next two years. Hopefully, sectoral tailwinds will support our effort.
Let us turn to the yarn business. Could you give some colour on the performance of this vertical?The domestic spinning sector remained challenging right through the year. It was a two-fold challenge. One, yarn prices continued the downward spiral owing to cut-throat competition. Two, substantial volatility in raw material prices like PSF and Cotton yarn saddled players with high cost inventory. As a result, margins were eroded and spinners incurred substantial losses. Some eminent names in the business were forced to shut operations. Having said that, I
am satisfied that we were able to maintain stable operations throughout the year.
That is quite a feat…It is a significant achievement. This transpired because we proactively envisioned this scenario and capitalised on the more stable and predictable export opportunities. Even though margins were compromised marginally, this strategy ensured that our shopfloor buzzed with activity and our cash box continued to ring.
What is your strategy to improve profitability moving forward?Our strategy is summed in two words ‘look inward.’ And there are two reason for adopting this strategy:
One, while revenue is out of our hand as we are price takers and not makers, costs are in our hands.
Two, as India gets closely woven into the global village, only the lean-mean fighting machines (corporates) will survive and thrive.
And this loss could not have been more well-timed. From my perspective, I welcome this dip as it is a wake-up call for all of us. An alarm that has forced us to choose our path, one of carrying the traditional overburden or one where we shrug of complacency and sharpen our minds and bodies to take on the challenge with renewed spirit. And we have selected the latter.
We have identified and started weeding out inefficiencies in the system. We have started cutting the flab. We have trimmed down our weight. And this trend will continue for the current and the following year, till we reach an optimum mix of experience, energy and enthusiasm in the organisation. This then will catapult the organisation into a new orbit of efficiency and will make success sustainable. The initial results of this multi-pronged exercise have already started producing results.
What is your message to shareholders?As India prepares to move a fast foot forward to higher efficiency, I continue to be in an optimistic mood. We will work to ensure that RSWM remains always relevant to the people we serve and to the changes taking place in our environment. Barring unforeseen developments, our dynamic team should ideally make FY20 an inflection point for RSWM and all its stakeholders.

ANNUAL REPORT20 1819
1918
Business in 2018-19
Corporate Overview Management Reports Financial Statements1 45 103
1918
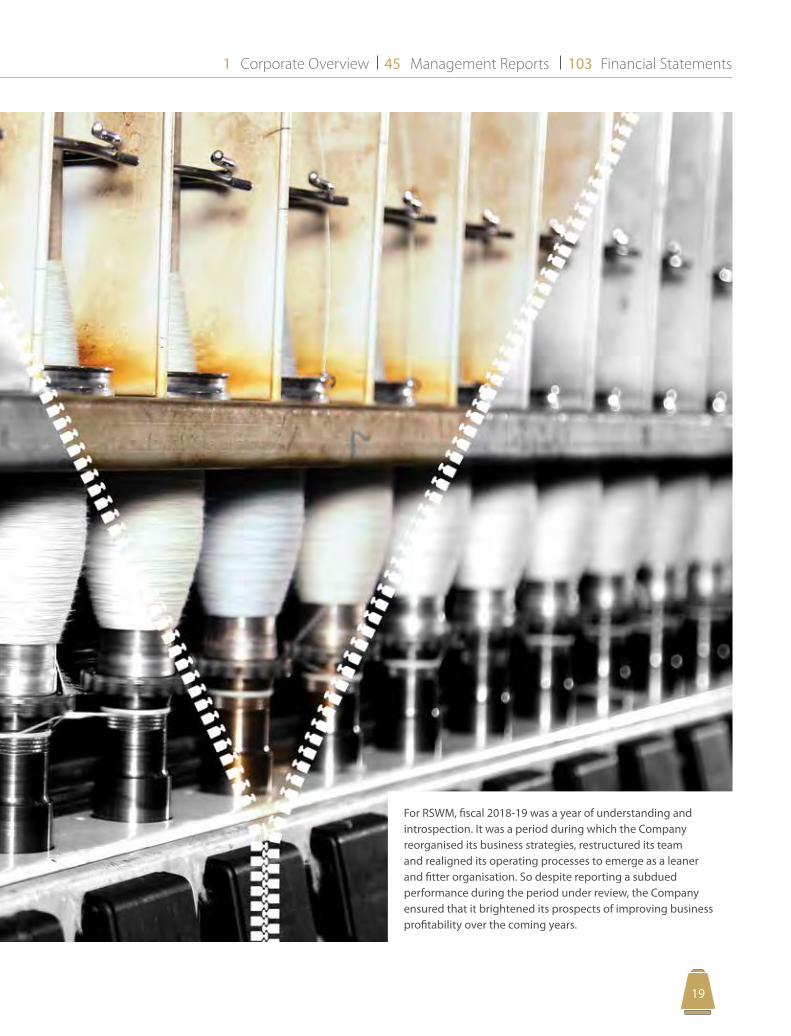
For RSWM, fiscal 2018-19 was a year of understanding and introspection. It was a period during which the Company reorganised its business strategies, restructured its team and realigned its operating processes to emerge as a leaner and fitter organisation. So despite reporting a subdued performance during the period under review, the Company ensured that it brightened its prospects of improving business profitability over the coming years.
ANNUAL REPORT20 1819
2120
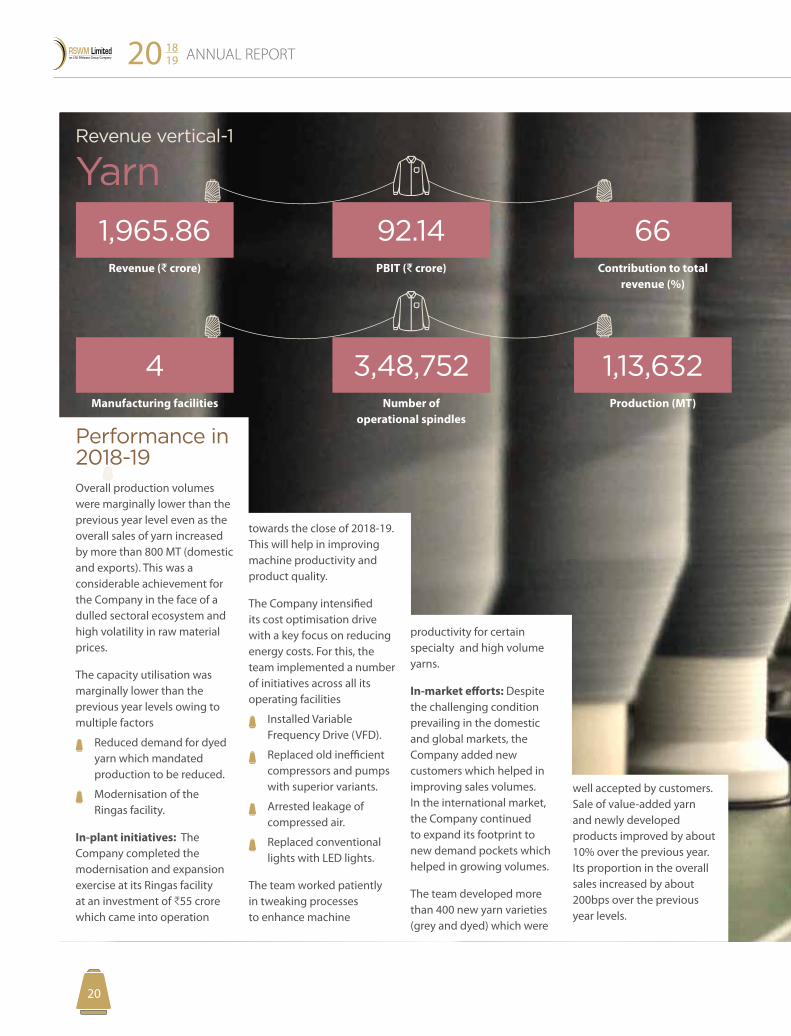
Revenue vertical-1
Yarn
66Contribution to total
revenue (%)
1,13,632Production (MT)
92.14PBIT (D crore)
3,48,752Number of
operational spindles
1,965.86Revenue (D crore)
4Manufacturing facilities
Performance in 2018-19Overall production volumes were marginally lower than the previous year level even as the overall sales of yarn increased by more than 800 MT (domestic and exports). This was a considerable achievement for the Company in the face of a dulled sectoral ecosystem and high volatility in raw material prices.
The capacity utilisation was marginally lower than the previous year levels owing to multiple factors
Reduced demand for dyed yarn which mandated production to be reduced.
Modernisation of the Ringas facility.
In-plant initiatives: The Company completed the modernisation and expansion exercise at its Ringas facility at an investment of C55 crore which came into operation
towards the close of 2018-19. This will help in improving machine productivity and product quality.
The Company intensified its cost optimisation drive with a key focus on reducing energy costs. For this, the team implemented a number of initiatives across all its operating facilities
Installed Variable Frequency Drive (VFD).
Replaced old inefficient compressors and pumps with superior variants.
Arrested leakage of compressed air.
Replaced conventional lights with LED lights.
The team worked patiently in tweaking processes to enhance machine
productivity for certain specialty and high volume yarns.
In-market efforts: Despite the challenging condition prevailing in the domestic and global markets, the Company added new customers which helped in improving sales volumes. In the international market, the Company continued to expand its footprint to new demand pockets which helped in growing volumes.
The team developed more than 400 new yarn varieties (grey and dyed) which were
well accepted by customers. Sale of value-added yarn and newly developed products improved by about 10% over the previous year. Its proportion in the overall sales increased by about 200bps over the previous year levels.
Corporate Overview Management Reports Financial Statements1 45 103
2120
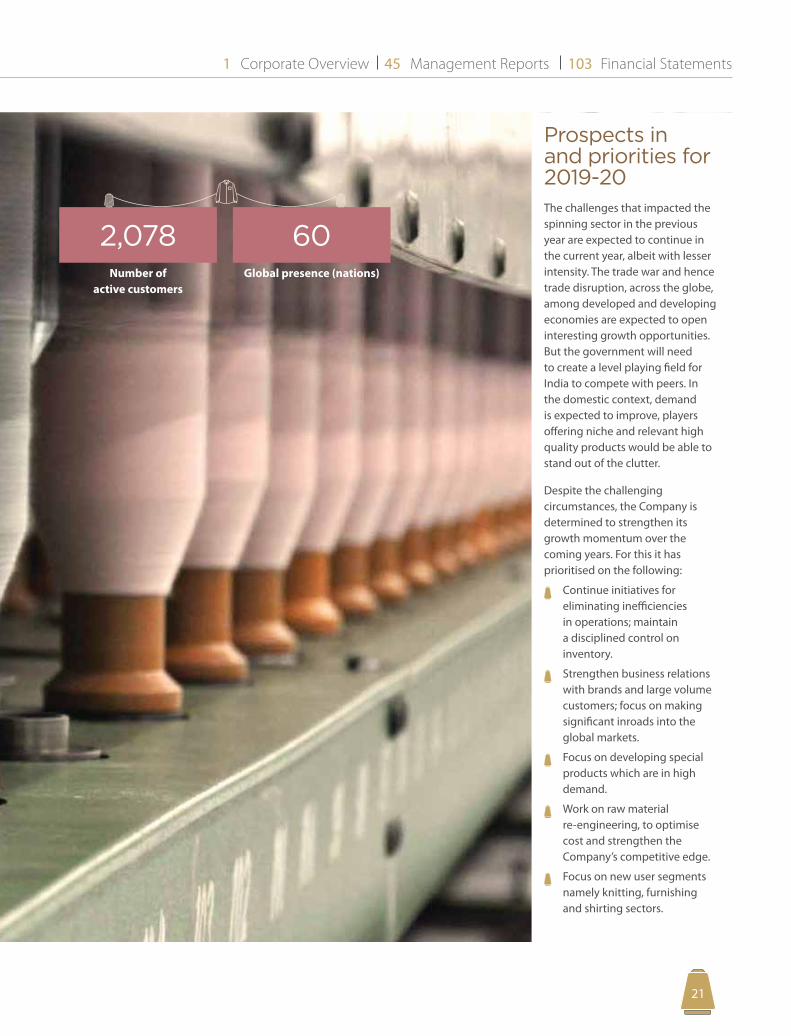
2,078Number of
active customers
60Global presence (nations)
Prospects in and priorities for 2019-20The challenges that impacted the spinning sector in the previous year are expected to continue in the current year, albeit with lesser intensity. The trade war and hence trade disruption, across the globe, among developed and developing economies are expected to open interesting growth opportunities. But the government will need to create a level playing field for India to compete with peers. In the domestic context, demand is expected to improve, players offering niche and relevant high quality products would be able to stand out of the clutter.
Despite the challenging circumstances, the Company is determined to strengthen its growth momentum over the coming years. For this it has prioritised on the following:
Continue initiatives for eliminating inefficiencies in operations; maintain a disciplined control on inventory.
Strengthen business relations with brands and large volume customers; focus on making significant inroads into the global markets.
Focus on developing special products which are in high demand.
Work on raw material re-engineering, to optimise cost and strengthen the Company’s competitive edge.
Focus on new user segments namely knitting, furnishing and shirting sectors.
ANNUAL REPORT20 1819
2322
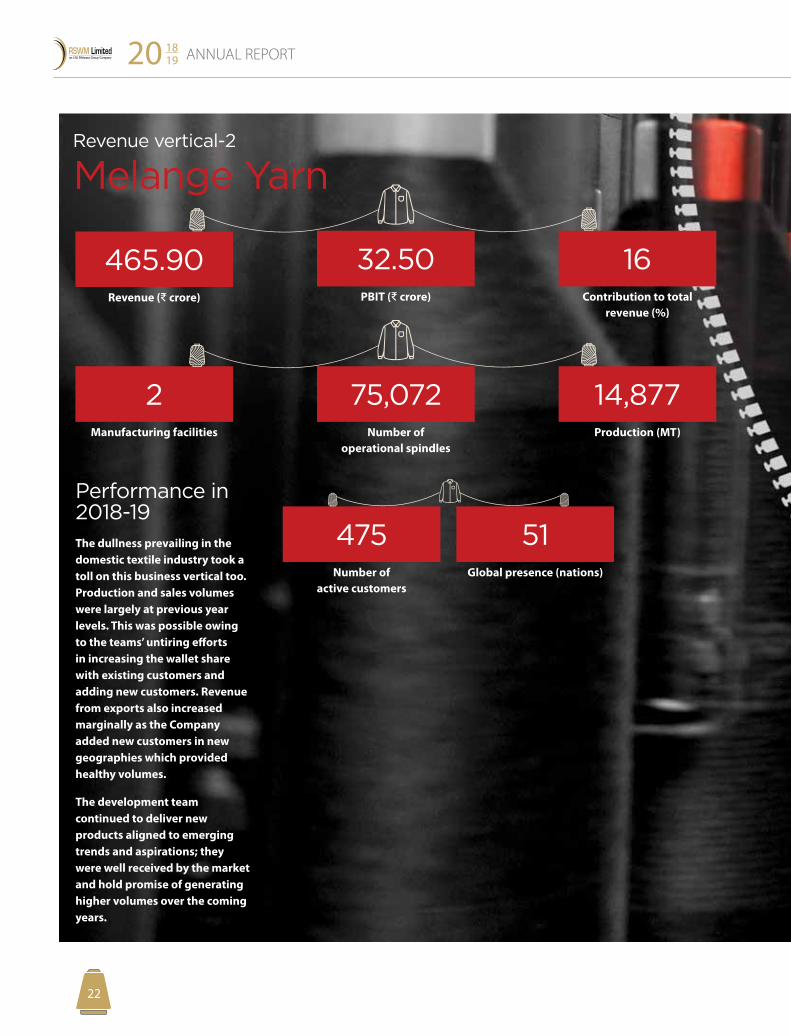
Revenue vertical-2
Melange Yarn
16Contribution to total
revenue (%)
32.50PBIT (D crore)
465.90Revenue (D crore)
14,877Production (MT)
75,072Number of
operational spindles
2Manufacturing facilities
475Number of
active customers
51Global presence (nations)
Performance in 2018-19The dullness prevailing in the domestic textile industry took a toll on this business vertical too. Production and sales volumes were largely at previous year levels. This was possible owing to the teams’ untiring efforts in increasing the wallet share with existing customers and adding new customers. Revenue from exports also increased marginally as the Company added new customers in new geographies which provided healthy volumes.
The development team continued to deliver new products aligned to emerging trends and aspirations; they were well received by the market and hold promise of generating higher volumes over the coming years.
Corporate Overview Management Reports Financial Statements1 45 103
2322
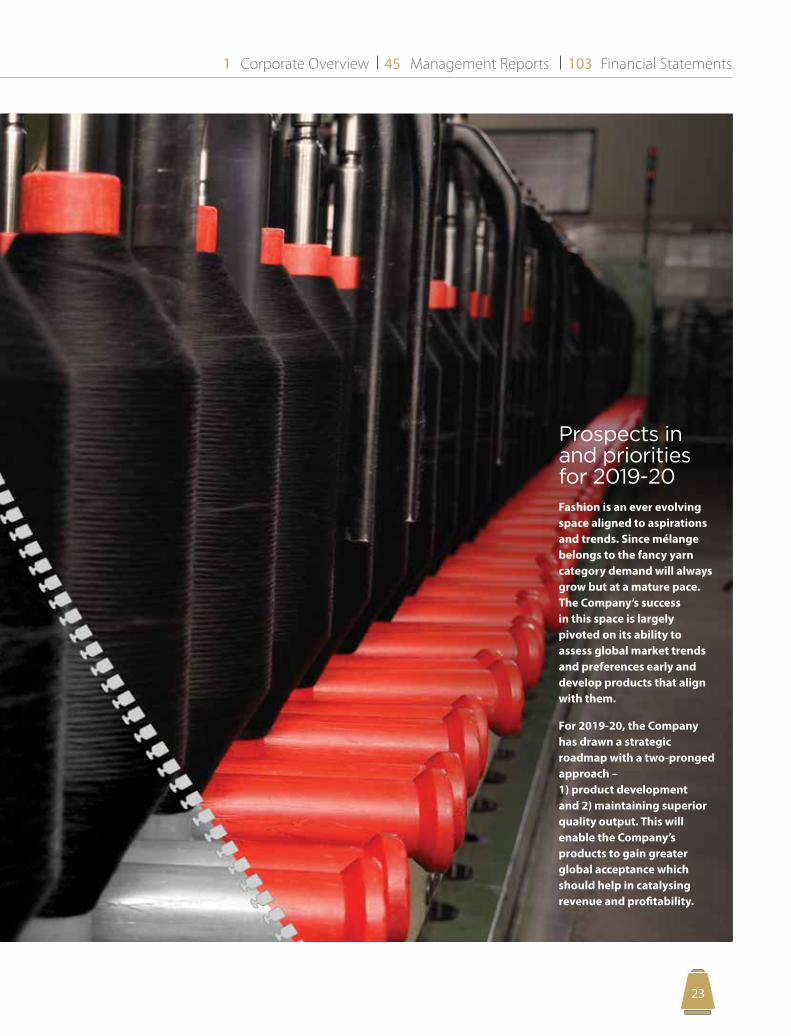
Prospects in and priorities for 2019-20Fashion is an ever evolving space aligned to aspirations and trends. Since mélange belongs to the fancy yarn category demand will always grow but at a mature pace. The Company’s success in this space is largely pivoted on its ability to assess global market trends and preferences early and develop products that align with them.
For 2019-20, the Company has drawn a strategic roadmap with a two-pronged approach – 1) product development and 2) maintaining superior quality output. This will enable the Company’s products to gain greater global acceptance which should help in catalysing revenue and profitability.
ANNUAL REPORT20 1819
2524
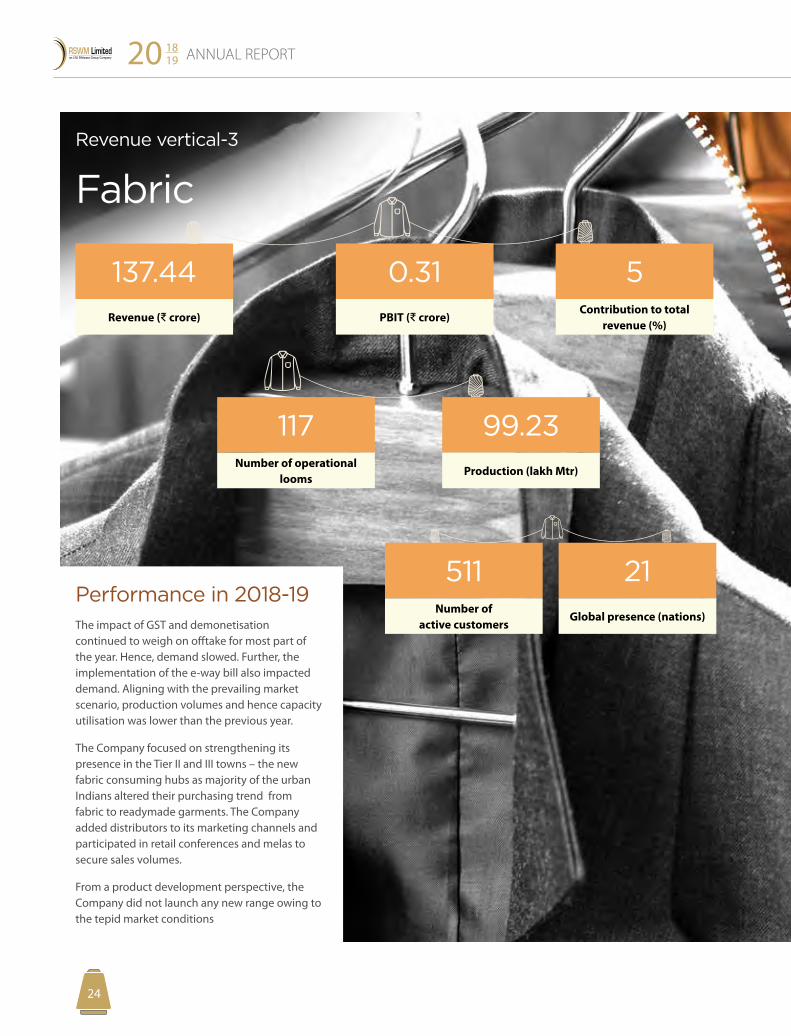
Revenue vertical-3
Fabric
5Contribution to total
revenue (%)
0.31
PBIT (D crore)
137.44
Revenue (D crore)
99.23
Production (lakh Mtr)
117Number of operational
looms
511Number of
active customers
21
Global presence (nations)
Performance in 2018-19The impact of GST and demonetisation continued to weigh on offtake for most part of the year. Hence, demand slowed. Further, the implementation of the e-way bill also impacted demand. Aligning with the prevailing market scenario, production volumes and hence capacity utilisation was lower than the previous year.
The Company focused on strengthening its presence in the Tier II and III towns – the new fabric consuming hubs as majority of the urban Indians altered their purchasing trend from fabric to readymade garments. The Company added distributors to its marketing channels and participated in retail conferences and melas to secure sales volumes.
From a product development perspective, the Company did not launch any new range owing to the tepid market conditions

Corporate Overview Management Reports Financial Statements1 45 103
2524
Prospects in and priorities for 2019-20The domestic fabric market is transitioning from the urban to the semi-urban as the urban Indian’s preference towards readymade garments has increased (owing to availability, choice and paucity of time). From a supply perspective, cheaper imports from China and other neighbouring nations continue to hamper growth.
In the face of these challenges, the Company has drawn a comprehensive blue print for 2019-20 which includes:
Focus on Tier II & III towns for marketing its products.
Strengthen the connect with the RMG and school uniform segments in select geographies to scale volumes.
Continue to prune costs and focus on prudent inventory management.
Leverage outsourcing opportunities prudently to shore production volumes.
Restart a new sub-collection VERONA in the market.
Increase participation in wholesale and retail conferences to increase retail activity.
ANNUAL REPORT20 1819
2726
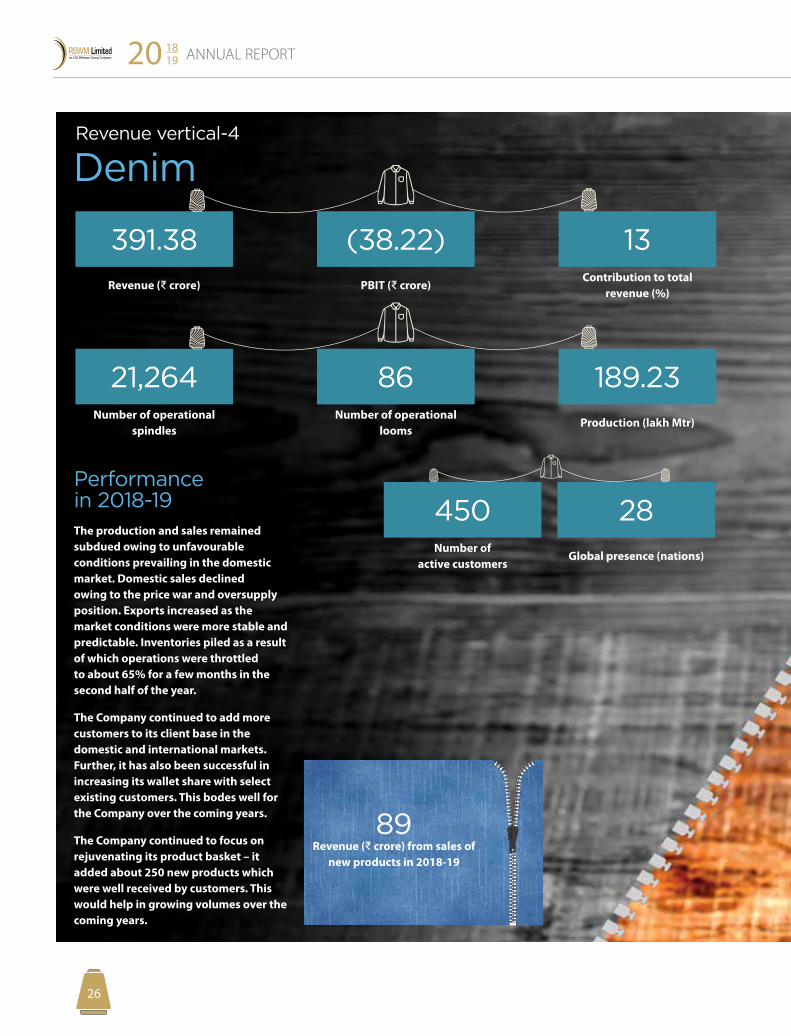
Revenue vertical-4
Denim
13Contribution to total
revenue (%)
(38.22)
PBIT (D crore)
391.38
Revenue (D crore)
189.23
Production (lakh Mtr)
86Number of operational
looms
21,264Number of operational
spindles
450Number of
active customers
28
Global presence (nations)
Performance in 2018-19The production and sales remained subdued owing to unfavourable conditions prevailing in the domestic market. Domestic sales declined owing to the price war and oversupply position. Exports increased as the market conditions were more stable and predictable. Inventories piled as a result of which operations were throttled to about 65% for a few months in the second half of the year.
The Company continued to add more customers to its client base in the domestic and international markets. Further, it has also been successful in increasing its wallet share with select existing customers. This bodes well for the Company over the coming years.
The Company continued to focus on rejuvenating its product basket – it added about 250 new products which were well received by customers. This would help in growing volumes over the coming years.
89Revenue (D crore) from sales of
new products in 2018-19

Corporate Overview Management Reports Financial Statements1 45 103
2726
Prospects in and priorities for 2019-20The domestic market continues to face severe fund flow disparity. The pricing pressure persists as brands and trade are not supporting a price increase. As such 2019-20 appears to remain challenging for the denim business.
Against this backdrop, the Company's strategy for 2019-20 is as follows:
Focus on value-addition
Explore outsourcing options for manufacturing wider width products.
Work on making differentiated products.
Continue to prune costs
Change the cotton mix to optimise material costs.
Improve in-plant efficiencies.
Prudently utilise the job-work route.
Stabilise the fresh fabric proportion at 90% plus.
Focus on prudent inventory management
Complete liquidation of yarn and fabric inventory.
Made to order only.
Growing sales volumes
Focus on the brand segment to balance production capacity.
Rebuild relations with big names in the domestic denim space.
Source quality yarn for in-house value addition.
Build presence in the global market in select high growth nations.
ANNUAL REPORT20 1819
2928
Risk management
“Risk management should be an enterprise wide exercise and engrained in the business culture of the organisation.”
Julie Dickson
Risk management at RSWM is an integral part of the business model and focuses on making the organisation emerge stronger resulting in profitable business growth. The risk management framework encompasses strategy and operations and seeks to proactively identify, address and mitigate existing and emerging risks. This framework goes beyond traditional boundaries and seeks to involve all key managers of the Company.
Corporate Overview Management Reports Financial Statements1 45 103
2928
Ecosystem risk
The domestic textile industry is facing significant headwinds that impede its growth momentum. These include challenges in the textile industry and considerable volatility in the raw material ecosystem.
Risk mitigation: RSWM is part of the same ecosystem as other players across the textile value chain. Hence, it has to face these challenges like every other player. But RSWM stands out in its response to these challenges. One, the Company has successfully created new growth opportunities (domestic and international) despite a subdued ecosystem. Two, it has adopted the lean strategy to identify and eliminate all wastages that have crept into the system. The Company is reducing the excesses in the organisation as part of its cost management exercise. These initiatives should help in minimising the downside during unfavourable conditions and would increase agility in making a faster rebound on a sectoral revival.
Capacity risk
Clothes are a basic necessity for life. Hence, the demand for fabrics over the medium-term will continue to increase. If the Company does not invest in capacity now, it may not have the capability to meet increasing demand when the sectoral trend reverses.
Risk mitigation: RSWM has made investments cumulating to C303.87 crore during the last four years (2016-17 to 2018-19) for capacity creation and modernisation. These investments have not yielded the desired returns owing to depressed market conditions. However, the Company is infrastructure ready for the uptick. Further, the Company has adopted the asset-light operational model for its fabric and denim verticals which allows it to meet any demand spike with ease.
Funding risk
Liquidity is the most important lifeline for any business. As operations expand, the need to keep the organisation liquid will become increasingly necessary. This would require maintaining a prudent balance between internal resources and external funds.
Risk mitigation: RSWM is aware of this reality. It is utilising this downturn well - one it has repaid debt of C668.04 crore in the last three years strengthening its leverage capability when required; two, it has institutionalised disciplined day-to-day management of inventories and receivables for optimising its working capital requirement; and, three it is focusing on growing the proportion of revenue from value-added products which should help in strengthening cash flow. Further, the asset-light approach adopted by the Company should reduce the need for funds for capital projects.
ANNUAL REPORT20 1819
3130
Management Discussion and Analysis
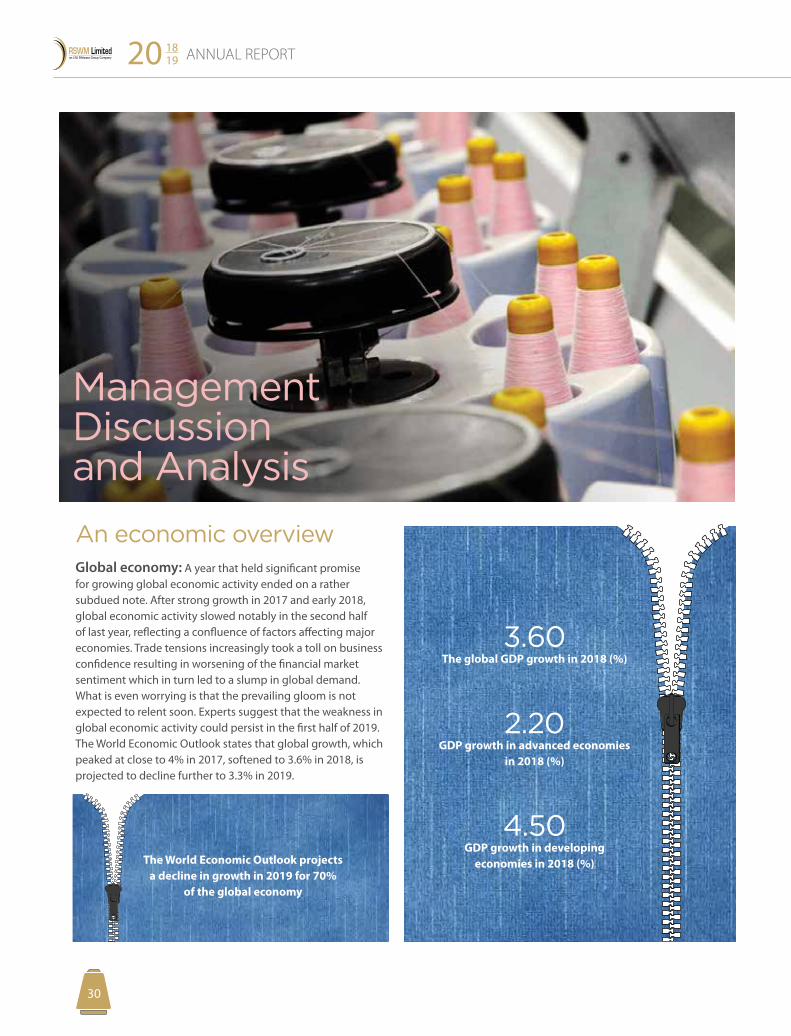
An economic overviewGlobal economy: A year that held significant promise for growing global economic activity ended on a rather subdued note. After strong growth in 2017 and early 2018, global economic activity slowed notably in the second half of last year, reflecting a confluence of factors affecting major economies. Trade tensions increasingly took a toll on business confidence resulting in worsening of the financial market sentiment which in turn led to a slump in global demand. What is even worrying is that the prevailing gloom is not expected to relent soon. Experts suggest that the weakness in global economic activity could persist in the first half of 2019. The World Economic Outlook states that global growth, which peaked at close to 4% in 2017, softened to 3.6% in 2018, is projected to decline further to 3.3% in 2019.
The World Economic Outlook projects a decline in growth in 2019 for 70%
of the global economy
3.60The global GDP growth in 2018 (%)
2.20GDP growth in advanced economies
in 2018 (%)
4.50GDP growth in developing
economies in 2018 (%)
Corporate Overview Management Reports Financial Statements1 45 103
3130
Indian economy: India’s GDP declined for a second year in succession, from 8% in 2016-17 to 7.2% in 2017-18 and to 7% in 2018-19. Moreover, experts suggest that the Indian economy is on the brink of a slowdown.
This is because fiscal 2018-19 which was looked upon as a year of considerable promise did not live up to expectations. The economy slid with every successive quarter, from 8% in Q1 to 6.5% in Q4.
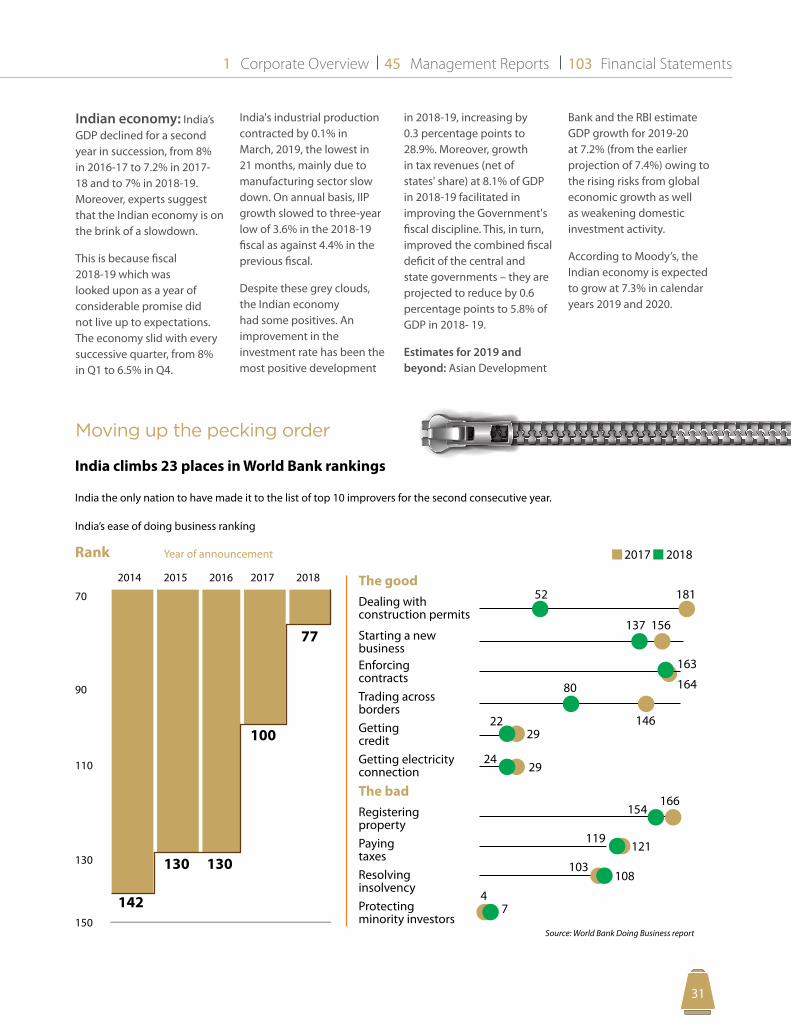
Moving up the pecking order
India climbs 23 places in World Bank rankings
India the only nation to have made it to the list of top 10 improvers for the second consecutive year.
Source: World Bank Doing Business report
India’s ease of doing business ranking
Rank
142
130 130
100
77
Year of announcement
2014
70
90
110
130
150
2015 2016 2017 2018 The good
The bad
2017 2018
163
164Enforcing contracts
Dealing with construction permits
52 181
137 156
Trading across borders
80
1462229Getting
credit24
29Getting electricity connection
154166
Registering property
119121Paying
taxes103
108Resolving insolvency
47Protecting
minority investors
Starting a new business
India's industrial production contracted by 0.1% in March, 2019, the lowest in 21 months, mainly due to manufacturing sector slow down. On annual basis, IIP growth slowed to three-year low of 3.6% in the 2018-19 fiscal as against 4.4% in the previous fiscal.
Despite these grey clouds, the Indian economy had some positives. An improvement in the investment rate has been the most positive development
in 2018-19, increasing by 0.3 percentage points to 28.9%. Moreover, growth in tax revenues (net of states' share) at 8.1% of GDP in 2018-19 facilitated in improving the Government's fiscal discipline. This, in turn, improved the combined fiscal deficit of the central and state governments – they are projected to reduce by 0.6 percentage points to 5.8% of GDP in 2018- 19.
Estimates for 2019 and beyond: Asian Development
Bank and the RBI estimate GDP growth for 2019-20 at 7.2% (from the earlier projection of 7.4%) owing to the rising risks from global economic growth as well as weakening domestic investment activity.
According to Moody’s, the Indian economy is expected to grow at 7.3% in calendar years 2019 and 2020.
ANNUAL REPORT20 1819
3332
The textile industryThe Indian textile industry is among the most important industries for the Indian economy considering its contribution to employment generation, industrial output, and foreign exchange earnings.
In India, the sector enjoys the presence of the entire value chain— fibre, yarn, fabric and apparel—apart from the availability of cheap and abundant labour. However, in spite of these benefits, India's share in the global textile exports is only minuscule.
Performance in 2018The textile and clothing industry ended 2018 (calendar year) on a mixed note in both exports and the domestic markets, while expecting a revival in 2019.
International demand was largely muted because of the threat of the U.S.-China trade war and related uncertainties. The domestic market remained largely
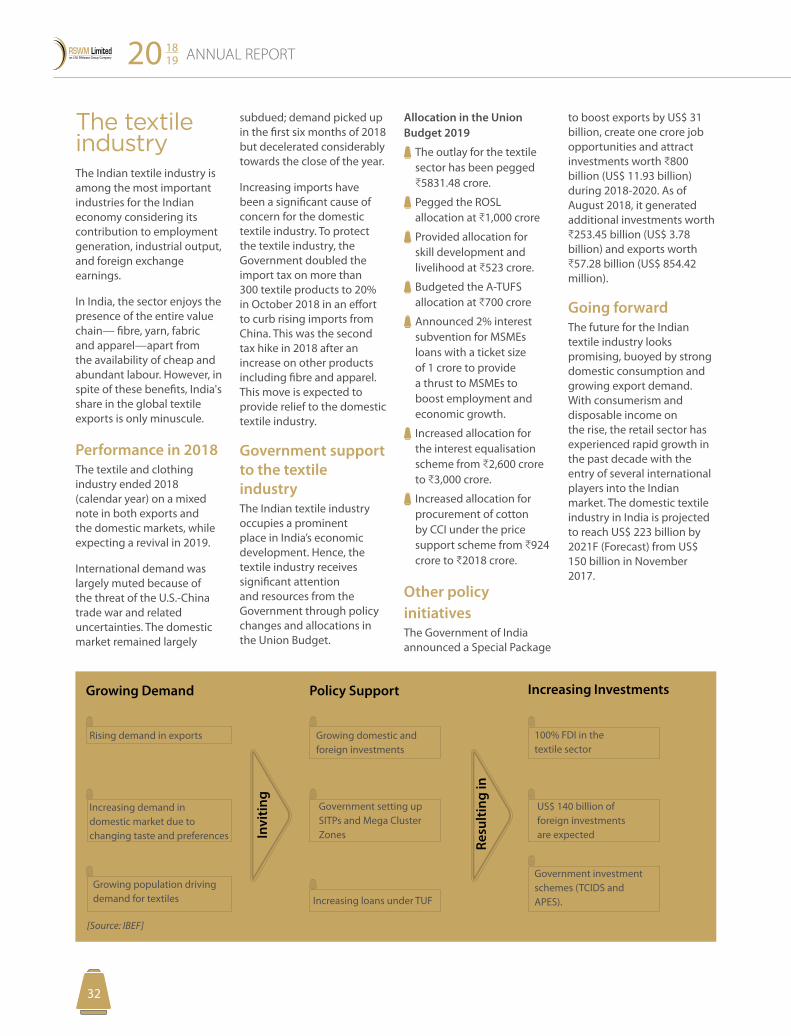
Growing Demand Policy Support Increasing Investments
Invi
ting
Resu
lting
in
Rising demand in exports Growing domestic and foreign investments
100% FDI in the textile sector
US$ 140 billion of foreign investments are expected
Government investment schemes (TCIDS and APES).
Government setting up SITPs and Mega Cluster Zones
Increasing loans under TUF
Increasing demand in domestic market due to changing taste and preferences
Growing population driving demand for textiles
subdued; demand picked up in the first six months of 2018 but decelerated considerably towards the close of the year.
Increasing imports have been a significant cause of concern for the domestic textile industry. To protect the textile industry, the Government doubled the import tax on more than 300 textile products to 20% in October 2018 in an effort to curb rising imports from China. This was the second tax hike in 2018 after an increase on other products including fibre and apparel. This move is expected to provide relief to the domestic textile industry.
Government support to the textile industryThe Indian textile industry occupies a prominent place in India’s economic development. Hence, the textile industry receives significant attention and resources from the Government through policy changes and allocations in the Union Budget.
Allocation in the Union Budget 2019
The outlay for the textile sector has been pegged C5831.48 crore.
Pegged the ROSL allocation at C1,000 crore
Provided allocation for skill development and livelihood at C523 crore.
Budgeted the A-TUFS allocation at C700 crore
Announced 2% interest subvention for MSMEs loans with a ticket size of 1 crore to provide a thrust to MSMEs to boost employment and economic growth.
Increased allocation for the interest equalisation scheme from C2,600 crore to C3,000 crore.
Increased allocation for procurement of cotton by CCI under the price support scheme from C924 crore to C2018 crore.
Other policy initiativesThe Government of India announced a Special Package
to boost exports by US$ 31 billion, create one crore job opportunities and attract investments worth C800 billion (US$ 11.93 billion) during 2018-2020. As of August 2018, it generated additional investments worth C253.45 billion (US$ 3.78 billion) and exports worth C57.28 billion (US$ 854.42 million).
Going forwardThe future for the Indian textile industry looks promising, buoyed by strong domestic consumption and growing export demand. With consumerism and disposable income on the rise, the retail sector has experienced rapid growth in the past decade with the entry of several international players into the Indian market. The domestic textile industry in India is projected to reach US$ 223 billion by 2021F (Forecast) from US$ 150 billion in November 2017.
[Source: IBEF]
Corporate Overview Management Reports Financial Statements1 45 103
3332
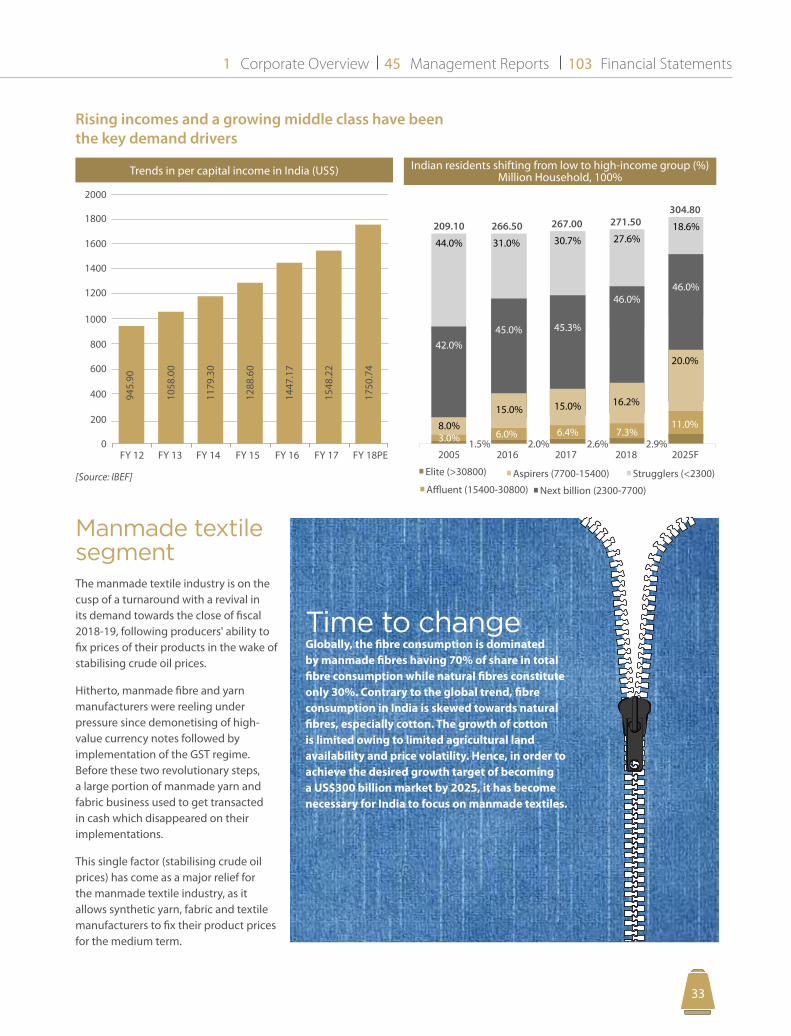
Rising incomes and a growing middle class have been the key demand drivers
[Source: IBEF]
Manmade textile segment The manmade textile industry is on the cusp of a turnaround with a revival in its demand towards the close of fiscal 2018-19, following producers' ability to fix prices of their products in the wake of stabilising crude oil prices.
Hitherto, manmade fibre and yarn manufacturers were reeling under pressure since demonetising of high-value currency notes followed by implementation of the GST regime. Before these two revolutionary steps, a large portion of manmade yarn and fabric business used to get transacted in cash which disappeared on their implementations.
This single factor (stabilising crude oil prices) has come as a major relief for the manmade textile industry, as it allows synthetic yarn, fabric and textile manufacturers to fix their product prices for the medium term.
Time to changeGlobally, the fibre consumption is dominated by manmade fibres having 70% of share in total fibre consumption while natural fibres constitute only 30%. Contrary to the global trend, fibre consumption in India is skewed towards natural fibres, especially cotton. The growth of cotton is limited owing to limited agricultural land availability and price volatility. Hence, in order to achieve the desired growth target of becoming a US$300 billion market by 2025, it has become necessary for India to focus on manmade textiles.
Trends in per-capita income in India (USS)Trends in per capital income in India (US$)
FY 12
2000
1800
1600
1400
1200
1000
800
600
400
200
0FY 13 FY 14 FY 15 FY 16 FY 17 FY 18PE
945.
90
1058
.00
1179
.30
1288
.60
1447
.17
1548
.22
1750
.74
Indian residents shifting from low to high-income group (%)Million Household, 100%
Affluent (15400-30800)
Elite (>30800) Aspirers (7700-15400) Strugglers (<2300)
Next billion (2300-7700)
2005 2016 2017 2018 2025F1.5% 2.0% 2.6% 2.9%3.0%
8.0%
209.10 266.50 267.00 271.50304.80
42.0%
44.0% 31.0% 30.7% 27.6%18.6%
45.0% 45.3%
46.0%46.0%
15.0% 15.0% 16.2%
20.0%
6.0% 6.4% 7.3%11.0%
ANNUAL REPORT20 1819
3534
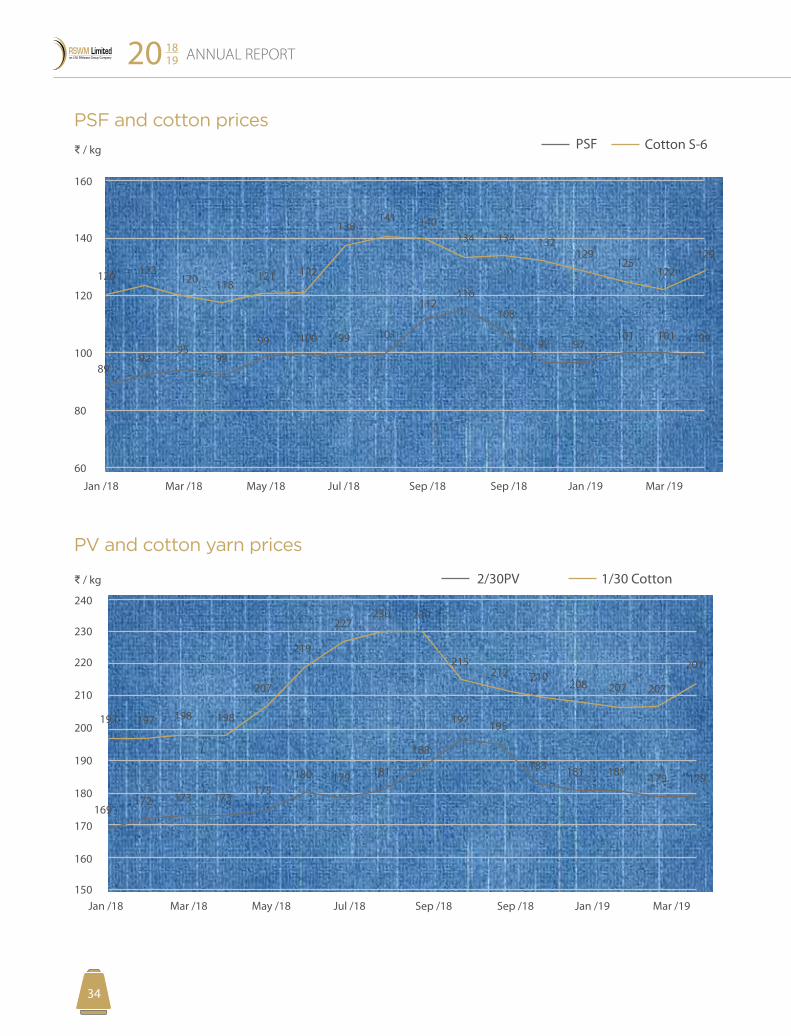
PSF and cotton prices
PV and cotton yarn prices
D / kg
160
120
8992
9593
99 100 99 101
112116
108
97 97101 101 99
123120 118
121 122
138141 140
134 134 132129
125122
129
PSF Cotton S-6
140
120
100
80
60
Jan /18 Mar /18 May /18 Jul /18 Sep /18 Sep /18 Jan /19 Mar /19
D / kg
240
230
220
210
200
190
180
170169
197 197 198 198
207
219
227230 230
215212 210
208 207 207
207
172 173 173175
180 179 181
188
197 195
183 181 181 179 179
160
150
2/30PV 1/30 Cotton
Jan /18 Mar /18 May /18 Jul /18 Sep /18 Sep /18 Jan /19 Mar /19

Corporate Overview Management Reports Financial Statements1 45 103
3534
The yarn segmentCotton yarnBeing the largest cotton producer globally and the second most populous nation in the world, has enabled India to emerge as one of the largest cotton yarn manufacturers and exporters globally.
The prospects of the spinning industry are closely dovetailed to the prospects of the global textile industry as India exports close to a third of its yarn output to global destinations – China being a key importer of Indian yarn.
Performance: Fiscal 2019 started on a healthy note with a considerable surge in exports of cotton yarn to China which more than made up for subdued cotton yarn offtake in the domestic market. An uptick in Chinese exports was primarily owing to US-China trade disruption.
Looking ahead: Credible reports suggest that the cotton crop yields will hit a three-year low in the October 2018-September 2019 season.
Estimates from the Cotton Advisory Board point
to the production of 36 million bales (one bale = 170kg) during the 2018-19 cotton season compared to 37 million bales in the previous year. Drought and uneven rainfall in Gujarat and Maharashtra are likely to pull down the average yield. A low yield implies lower output and higher cost of production. This could raise cotton prices and put spinning mills in distress.
However, spinning mills do not appear distraught as yet. This is primarily owing to the higher than normal cotton stock position at the end of
the previous season which would act as a buffer for the current season.
Manmade fibresIndia is the second largest producer of Manmade Fibre (MMF) and Filaments globally after China.
The MMF industry has been going through a lean phase for the last five fiscal years. In 2016-17 and 2017-18, factors such as sluggish demand, a sharp rise in imports, competition from cotton yarn, fall in realisation and temporary loss of
ANNUAL REPORT20 1819
3736
production on account of demonetisation weighed on the industry.
Domestic MMF demand witnessed an uptick in 2017-18 on account of the release in pent-up demand post the demonetisation and GST implementation with consumption increasing by about 3.6% y-o-y in 2017-18 vis-à-vis a decline of about 7.5% witnessed during the corresponding period in the previous year.
However, increased availability of cotton (substitute) at competitive prices in the domestic market during the year restricted the growth. Production of MMF was pegged at around 2,506 million kgs in 2017-18.
MMF is primarily used to produce 100% non-cotton fabrics and blended fabrics, which are in turn used in readymade garments, home and other industrial textiles.
The domestic MMF industry mainly comprises of two components i.e., polyester and viscose, which together accounts for about 94%
(in volume terms) of the total. Under this, polyester accounts for about 77.5% while viscose accounts for the remaining share.
Polyester: Under polyester, polyester staple fibre (PSF) and polyester filament yarn (PFY) account for 43.6% and 55.7% shares respectively as in 2017-18, while Polypropylene Staple Fibre (PPSF) and Polypropylene Fibre Yarn (PPFY) make for the remaining of 0.2% and 0.6% respectively.
Due to higher availability of cotton in cotton season (CS) 2016-17, production of polyester registered a marginal decline of about 0.3% on a y-o-y basis. In 2017-18, polyester production further declined by about 1% y-o-y to reach 1,957 million kgs owing to muted demand. However,post-Q3/2017-188, demand marginally picked up and registered a y-o-y growth of about 1.5% in polyester consumption for 2017-18.
In 2018-19 (April – August), consumption registered a
sharp decline of over 18% y-o-y on the back of higher prices. Crude oil prices during the period witnessed a sharp increase of over 47% thereby leading to a sharp increase in the input cost for polyester. Also, the higher availability of substitute cotton in the market at comparatively lower prices led to subdued demand for polyester during the period.
PSF and PFY prices witnessed an increase of about 11.4% and 6.8% respectively on a y-o-y basis in 2017-18 while cotton prices remained largely stable. Prices further registered a growth of over 19% and 17% during 2018-19 (April – October) period on the back of high input costs while cotton prices witnessed only a marginal increase of about 11% during the same period.
Viscose: Under Viscose, about 88% share is held by Viscose staple fibre (VSF) while viscose filament yarn (VFY) accounts for the remaining 12%. Viscose production in India was largely stable between
2013-14 and 2017-18 at around 400 million kgs registering a marginal CAGR of about 0.7% during the period.
In 2018-19 (April – August), VSF production grew sharply about 36.5% to 245 million kgs as compared to 180 million kgs in 2017-18 (April - October). VSF consumption remained largely stable over the period 2013-14 to 2017-18 at 300 million kgs. However, in fiscal 2018-19 (April - October), consumption registered a sharp increase of over 85% y-o-y to 218 million kgs as compared to 117 million kgs during the same period last year.
Corporate Overview Management Reports Financial Statements1 45 103
3736
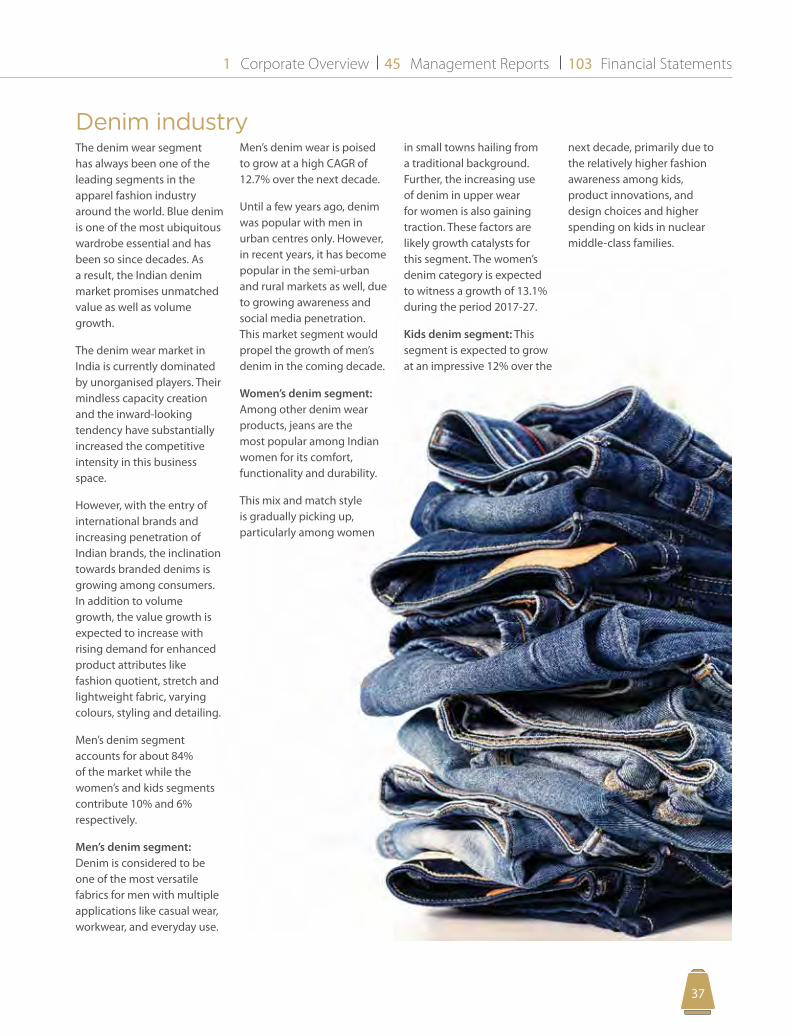
Denim industryThe denim wear segment has always been one of the leading segments in the apparel fashion industry around the world. Blue denim is one of the most ubiquitous wardrobe essential and has been so since decades. As a result, the Indian denim market promises unmatched value as well as volume growth.
The denim wear market in India is currently dominated by unorganised players. Their mindless capacity creation and the inward-looking tendency have substantially increased the competitive intensity in this business space.
However, with the entry of international brands and increasing penetration of Indian brands, the inclination towards branded denims is growing among consumers. In addition to volume growth, the value growth is expected to increase with rising demand for enhanced product attributes like fashion quotient, stretch and lightweight fabric, varying colours, styling and detailing.
Men’s denim segment accounts for about 84% of the market while the women’s and kids segments contribute 10% and 6% respectively.
Men’s denim segment: Denim is considered to be one of the most versatile fabrics for men with multiple applications like casual wear, workwear, and everyday use.
Men’s denim wear is poised to grow at a high CAGR of 12.7% over the next decade.
Until a few years ago, denim was popular with men in urban centres only. However, in recent years, it has become popular in the semi-urban and rural markets as well, due to growing awareness and social media penetration. This market segment would propel the growth of men’s denim in the coming decade.
Women’s denim segment: Among other denim wear products, jeans are the most popular among Indian women for its comfort, functionality and durability.
This mix and match style is gradually picking up, particularly among women
in small towns hailing from a traditional background. Further, the increasing use of denim in upper wear for women is also gaining traction. These factors are likely growth catalysts for this segment. The women’s denim category is expected to witness a growth of 13.1% during the period 2017-27.
Kids denim segment: This segment is expected to grow at an impressive 12% over the
next decade, primarily due to the relatively higher fashion awareness among kids, product innovations, and design choices and higher spending on kids in nuclear middle-class families.
ANNUAL REPORT20 1819
3938
Growth driversIn India, denim apparel consumption is expected to rise across all segments - men’s, women’s and kids. The incremental growth is especially expected in the mid-premium and premium/luxury segments.
Targeting rural and sub-urban consumers had until recently been a great challenge for the denim industry in India. However, recent trends have indicated increased penetration of the category across semi-urban and rural centres which should drive volume growth across mass market and unbranded segments.
Key factors that will drive the growth of denim wear are:
Low per capita jeans consumption: Per capita jeans consumption in India is much lower than that of developed markets, which provides an insight into the potential of the domestic market.
Young population: The youth (15 to 29 year olds) who comprise 26% of the consuming population, are a key growth driver of denim wear in the country. Increasing disposable income, comfort, quality and brand consciousness are major reasons behind the increasing acceptance of denims among the young population.
Growth of the organised retail sector: The denim wear market is dominated by unbranded denim products which constitute about 70% of the market. However, with many international and domestic brands offering denim wear at affordable prices, the inclination towards branded retail denim wear is expected to increase.
Shifts in consumer’s wardrobe: The shift in consumers' wardrobe have propelled the growth for casual wear and denim wear in India. Changing socio-
cultural values, increasing exposure to international fashion trends and growing disposable income, will play a significant role in driving the growth of the denim wear segment.
Increased rural spending: Rural India is developing at a relatively rapid pace and a similar trend has been witnessed in rural spending. Percolation of mass media has increased their inclination towards western wear. This will lead to an increase in demand from the rural masses.
Online penetration of denim wear: Increased penetration of the internet coupled with the burgeoning smartphone market has resulted in the growth of e-tailing in India. Further, ease of ordering, the paucity of time and flexible return policies are among other factors that are catalysing online purchasing. Denim has been among the highest growth categories
in fashion e-commerce. This trend is expected to continue over the coming years.
New denim fabric washes: Jeans manufacturers are focused on achieving different hues of blue by washing the fabric in certain dyes, bleaches or other agents that affect the denim colour. Dark indigo, faded blue/vintage/aged, stone wash and distressed jeans are new denim fabric washes in trend these days.
Growing popularity of tattered denim: The emergence of tattered denim has provided a perfect option for the fashion conscious youth. Distressed/ ripped/tattered denims are not restricted to only jeans but can be seen in jackets, shorts, skirts, etc. These innovations are among the most stylish must-haves for both men and women. This trend has been re-emerging in more styles every season.
Corporate Overview Management Reports Financial Statements1 45 103
3938
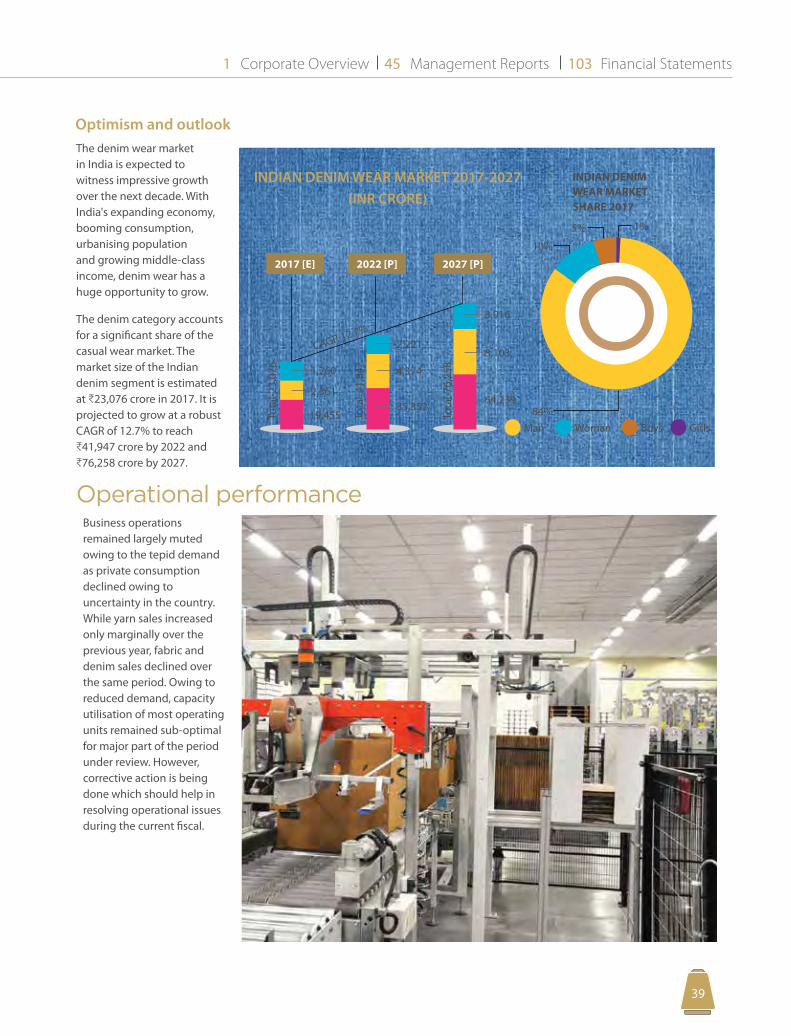
Optimism and outlookThe denim wear market in India is expected to witness impressive growth over the next decade. With India's expanding economy, booming consumption, urbanising population and growing middle-class income, denim wear has a huge opportunity to grow.
The denim category accounts for a significant share of the casual wear market. The market size of the Indian denim segment is estimated at C23,076 crore in 2017. It is projected to grow at a robust CAGR of 12.7% to reach C41,947 crore by 2022 and C76,258 crore by 2027.
Business operations remained largely muted owing to the tepid demand as private consumption declined owing to uncertainty in the country. While yarn sales increased only marginally over the previous year, fabric and denim sales declined over the same period. Owing to reduced demand, capacity utilisation of most operating units remained sub-optimal for major part of the period under review. However, corrective action is being done which should help in resolving operational issues during the current fiscal.
INDIAN DENIM WEAR MARKET 2017-2027(INR CRORE)
INDIAN DENIM WEAR MARKET SHARE 2017
2017 [E] 2022 [P] 2027 [P]To
tal-2
3,07
6
19,45535,352
64,239
CAGR 12.7%
2,361
4,374
8,103
1,260
2,221
3,916
Man Woman Boys Girls
1%5%
10%
84%Tota
l-41,
947
Tota
l-76,
258
Operational performance
ANNUAL REPORT20 1819
4140
Financial performance
Key ratios
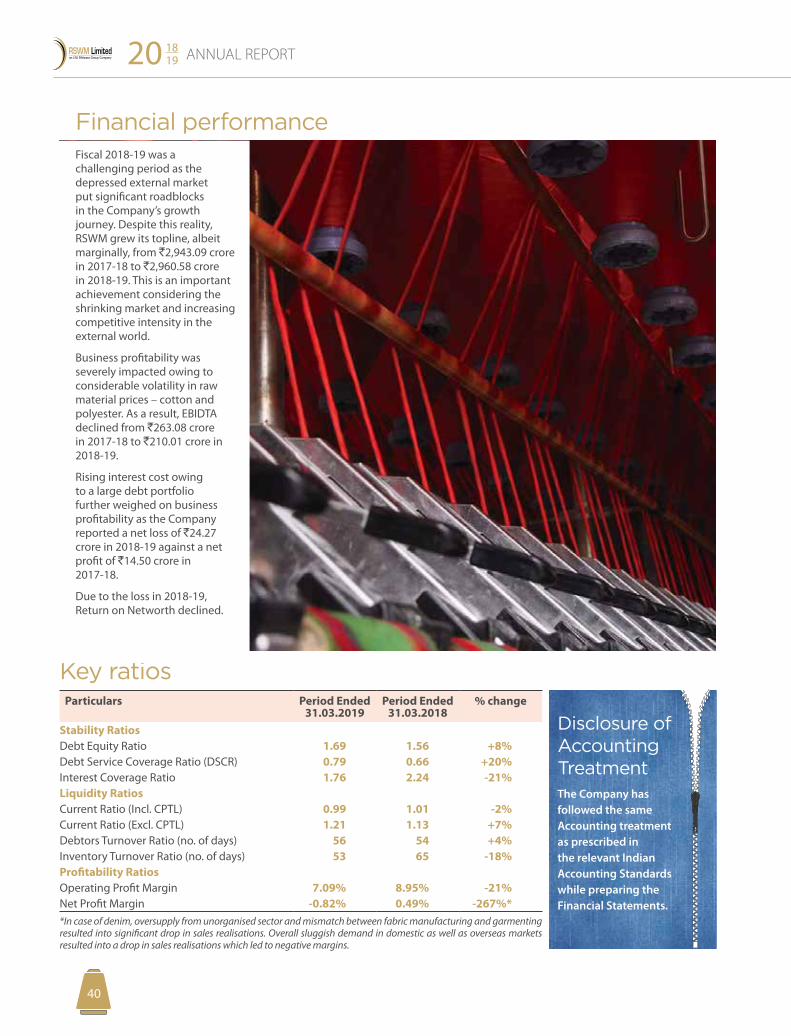
Fiscal 2018-19 was a challenging period as the depressed external market put significant roadblocks in the Company’s growth journey. Despite this reality, RSWM grew its topline, albeit marginally, from `2,943.09 crore in 2017-18 to `2,960.58 crore in 2018-19. This is an important achievement considering the shrinking market and increasing competitive intensity in the external world.
Business profitability was severely impacted owing to considerable volatility in raw material prices – cotton and polyester. As a result, EBIDTA declined from `263.08 crore in 2017-18 to `210.01 crore in 2018-19.
Rising interest cost owing to a large debt portfolio further weighed on business profitability as the Company reported a net loss of `24.27 crore in 2018-19 against a net profit of `14.50 crore in 2017-18.
Due to the loss in 2018-19, Return on Networth declined.
Particulars Period Ended 31.03.2019
Period Ended 31.03.2018
% change
Stability Ratios Debt Equity Ratio 1.69 1.56 +8%Debt Service Coverage Ratio (DSCR) 0.79 0.66 +20%Interest Coverage Ratio 1.76 2.24 -21%Liquidity RatiosCurrent Ratio (Incl. CPTL) 0.99 1.01 -2%Current Ratio (Excl. CPTL) 1.21 1.13 +7%Debtors Turnover Ratio (no. of days) 56 54 +4%Inventory Turnover Ratio (no. of days) 53 65 -18%Profitability RatiosOperating Profit Margin 7.09% 8.95% -21%Net Profit Margin -0.82% 0.49% -267%**In case of denim, oversupply from unorganised sector and mismatch between fabric manufacturing and garmenting resulted into significant drop in sales realisations. Overall sluggish demand in domestic as well as overseas markets resulted into a drop in sales realisations which led to negative margins.
Disclosure of Accounting TreatmentThe Company has followed the same Accounting treatment as prescribed in the relevant Indian Accounting Standards while preparing the Financial Statements.
Corporate Overview Management Reports Financial Statements1 45 103
4140
Human resourceIntellectual capital has been the corner stone of RSWM's success and sustenance over the years. This critical competitive edge has enabled the Company to stand out of the textile sector clutter.
The Company’s people-centric policies have created a unique bond between the Company and its 15,000+ team. This is reflected in an
important statistic – about 35% of the team is with the Company for more than 10 years.
The Company launched Project UDAAN, a structured learning and development programme for building skill and competence of individuals for taking on leadership roles, thereby building the management bandwidth.
In addition, the Company organised 51 individual development programmes and 170+ technical competence enhancement programmes for building people skills.
To break the monotony of mundane work, the Company organised numerous programmes to celebrate festivals (Ganesh Chaturthi, Navratri, Diwali,
Holi, Christmas, among other) which nurtured healthy team and family bonding. In addition, the Company organised various tournaments which witnessed healthy participation from team members.
Information technologyAt RSWM, information technology is not simply a business function but a critical business driver for ensuring greater productivity, internal financial controls and better decision-making.
The organisation systems are based on the M3 ERP platform that provides end-to-end integration of all business processes. Its features include an automated approval process and business checks for risk reduction. The implementation covers all business processes including
manufacturing, supply chain management, marketing, planning and finance. Operations and management information is available now on a real-time basis with data on demand.
During 2018-19, the IT team strengthened its IT solutions for enhancing their reliability and efficiency. It adopted new technologies namely Nutanix Hyper Converge Technology for non-ERP systems & applications and IBM Power 9 for ERP systems. Round the clock monitoring of the Data Centre facilitated
a 99.8% uptime. Further, the team strengthened the MPLS links with redundancy and better bandwidth. It also refurbished the Data Centre Network hardware & connectivity to improve the application's response time between plants and the Head Office.
The team is working to achieve the ISO 27001 security compliance. Towards this end, it is implementing world-class solutions like:
Palo Alto second generation firewall security at all plants &
offices to secure our parameter for external threats/Trojans/Virus/Ransomware attacks.
Integrated Mcafee servers across plants to have a single dashboard & centralised reporting.
Implemented Windows 2012 R2 Active Directory solution along with DNS & DHCP services.
Implemented Commvault Backup solution to the latest version considering backup availability of all servers’ OS & its applications & databases.

ANNUAL REPORT20 1819
4342
Internal Control Systems and their adequacy RSWM maintains a system of well-established policies and procedures for internal control of operations and activities. It continuously strives to integrate the entire organisation – from strategic support functions like finance, human resource, and regulatory affairs to core
operations like research, manufacturing and supply chain management.
The internal audit function is further strengthened in consultation with statutory auditors for monitoring statutory and operational issues.
The Company has appointed independent agencies as internal auditors. The prime objective of this audit is to test the adequacy and effectiveness of all internal control systems and suggest improvements. Significant issues are brought to the attention of the audit
committee for periodical review.
Moreover, the Company has obtained ISO 9001 and ISO 14001 certifications and adheres to standard operating practices in its manufacturing and operating activities
Risk managementThe Company has adopted a comprehensive and integrated risk appraisal, mitigation and management process. The risk mitigation measures of the Company are placed before the Board periodically for review and improvement.
Corporate Overview Management Reports Financial Statements1 45 103
4342
Environment managementRSWM is committed to make continuous efforts in reducing the adverse impact of its products and facilities on the Earth and environment.
The Company’s dedication goes beyond compliance with the law and encompasses the integration of sound environmental practices into its business decisions. It is guided by its environmental principles and consider the environment in all aspects of its business.
Water managementRSWM manufactures fabrics dyed with advanced
techniques that use less water and chemicals.
The Company treats all its post-process water in its effluent treatment plant and further purifies it via reverse osmosis before returning it to the environment as clean as when used initially. The Company has also set up Sewage Water Treatment Plants. The treated water is used in plantation.
Recycle & waste managementRSWM proudly uses recycled yarns in its fabrics. Its state-of-the-art Garnett machine efficiently breaks down
post-consumer waste fabrics and converts them into new usable fibres; the Company is weaving new fabric while eliminating excess waste from landfills. The Company is recycling 30 tonnes of used fabric every month.
Plastic to fabricRSWM has established a green fibre unit with a capacity of 120 MTs per day where it processes waste plastic bottles to produce green fibre. Disposed PET bottles are converted into flakes, which is turned into fibre for use in spinning yarn. This 100% recycled polyester fibre is just like virgin polyester fibre when it comes
to performance during end use. This plant is recycling 150 MTs waste plastic bottles which would have otherwise been dumped into landfills or water bodies.
Clean energyIn keeping with its environment commitment, the Company has installed 22.7 MW solar power at its various plant locations and has entered into an arrangement to procure 20 MW wind power which is used at its manufacturing operations.
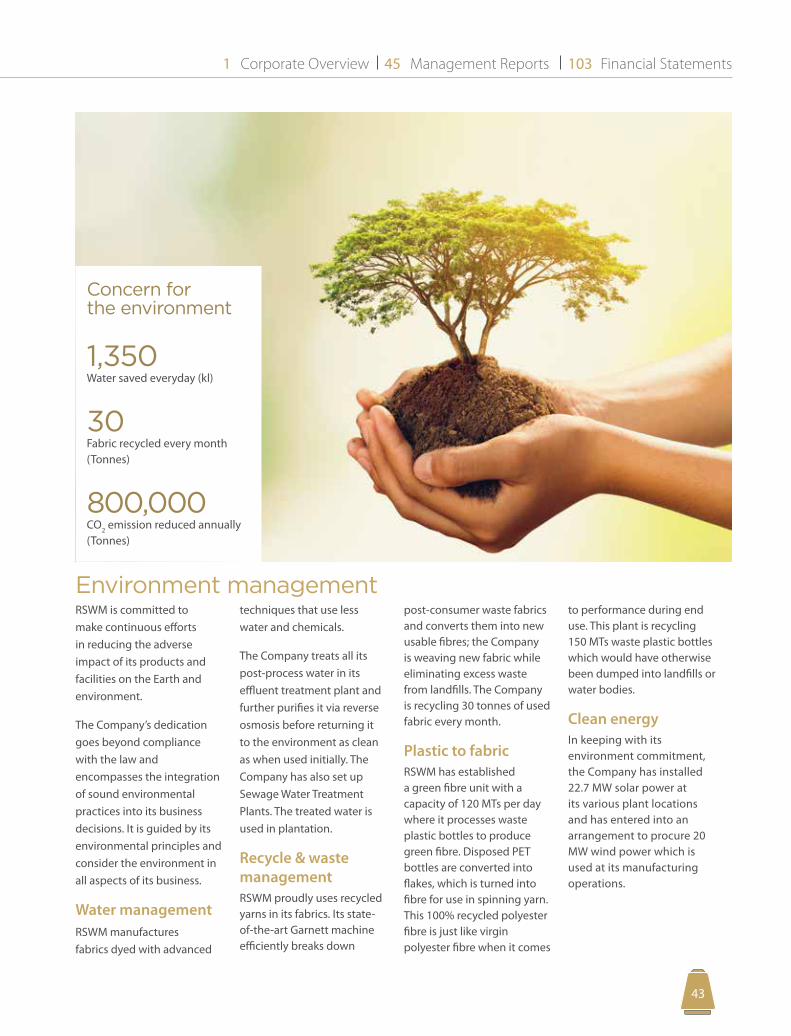
Concern for the environment
1,350Water saved everyday (kl)
30Fabric recycled every month (Tonnes)
800,000CO2 emission reduced annually (Tonnes)
ANNUAL REPORT20 1819
PB44
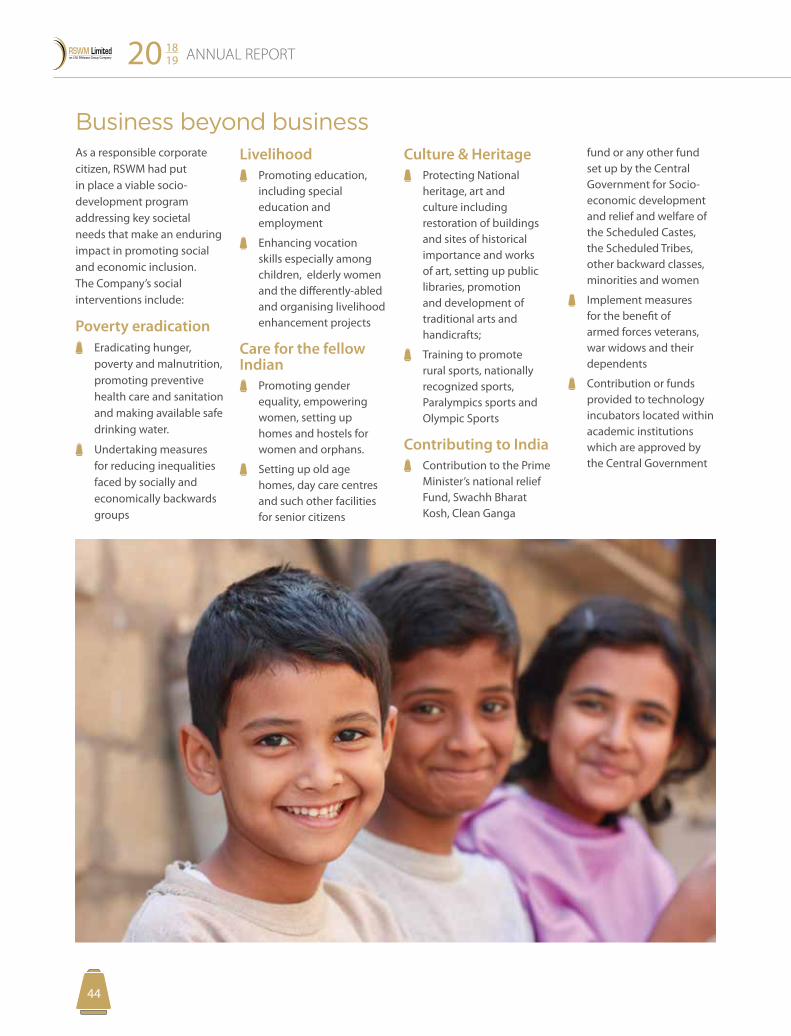
As a responsible corporate citizen, RSWM had put in place a viable socio-development program addressing key societal needs that make an enduring impact in promoting social and economic inclusion. The Company’s social interventions include:
Poverty eradication Eradicating hunger,
poverty and malnutrition, promoting preventive health care and sanitation and making available safe drinking water.
Undertaking measures for reducing inequalities faced by socially and economically backwards groups
Livelihood Promoting education,
including special education and employment
Enhancing vocation skills especially among children, elderly women and the differently-abled and organising livelihood enhancement projects
Care for the fellow Indian
Promoting gender equality, empowering women, setting up homes and hostels for women and orphans.
Setting up old age homes, day care centres and such other facilities for senior citizens
Culture & Heritage
Protecting National heritage, art and culture including restoration of buildings and sites of historical importance and works of art, setting up public libraries, promotion and development of traditional arts and handicrafts;
Training to promote rural sports, nationally recognized sports, Paralympics sports and Olympic Sports
Contributing to India Contribution to the Prime
Minister’s national relief Fund, Swachh Bharat Kosh, Clean Ganga
fund or any other fund set up by the Central Government for Socio-economic development and relief and welfare of the Scheduled Castes, the Scheduled Tribes, other backward classes, minorities and women
Implement measures for the benefit of armed forces veterans, war widows and their dependents
Contribution or funds provided to technology incubators located within academic institutions which are approved by the Central Government
Business beyond business
Corporate Overview Management Reports Financial Statements1 45 103
45PB
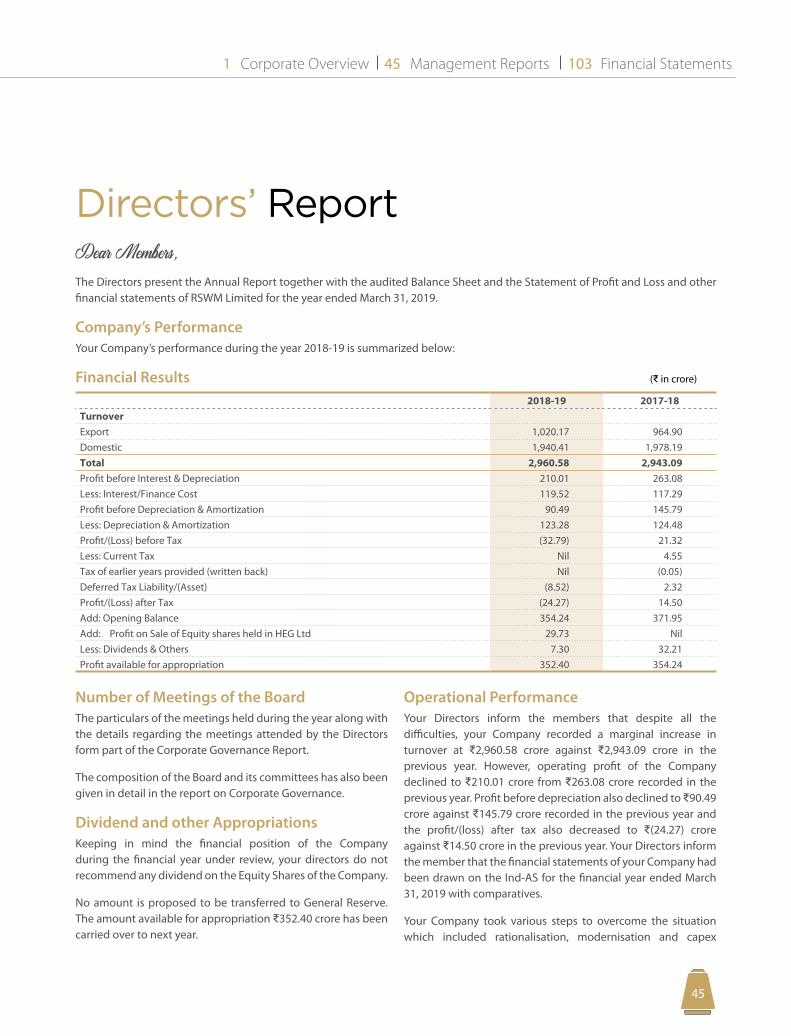
Directors’ ReportDear Members,The Directors present the Annual Report together with the audited Balance Sheet and the Statement of Profit and Loss and other financial statements of RSWM Limited for the year ended March 31, 2019.
Company’s PerformanceYour Company’s performance during the year 2018-19 is summarized below:
Financial Results (D in crore)
2018-19 2017-18TurnoverExport 1,020.17 964.90Domestic 1,940.41 1,978.19Total 2,960.58 2,943.09Profit before Interest & Depreciation 210.01 263.08Less: Interest/Finance Cost 119.52 117.29Profit before Depreciation & Amortization 90.49 145.79Less: Depreciation & Amortization 123.28 124.48Profit/(Loss) before Tax (32.79) 21.32Less: Current Tax Nil 4.55Tax of earlier years provided (written back) Nil (0.05)Deferred Tax Liability/(Asset) (8.52) 2.32Profit/(Loss) after Tax (24.27) 14.50Add: Opening Balance 354.24 371.95Add: Profit on Sale of Equity shares held in HEG Ltd 29.73 NilLess: Dividends & Others 7.30 32.21Profit available for appropriation 352.40 354.24
Number of Meetings of the BoardThe particulars of the meetings held during the year along with the details regarding the meetings attended by the Directors form part of the Corporate Governance Report.
The composition of the Board and its committees has also been given in detail in the report on Corporate Governance.
Dividend and other AppropriationsKeeping in mind the financial position of the Company during the financial year under review, your directors do not recommend any dividend on the Equity Shares of the Company.
No amount is proposed to be transferred to General Reserve. The amount available for appropriation D352.40 crore has been carried over to next year.
Operational PerformanceYour Directors inform the members that despite all the difficulties, your Company recorded a marginal increase in turnover at D2,960.58 crore against D2,943.09 crore in the previous year. However, operating profit of the Company declined to D210.01 crore from D263.08 crore recorded in the previous year. Profit before depreciation also declined to D90.49 crore against D145.79 crore recorded in the previous year and the profit/(loss) after tax also decreased to D(24.27) crore against D14.50 crore in the previous year. Your Directors inform the member that the financial statements of your Company had been drawn on the Ind-AS for the financial year ended March 31, 2019 with comparatives.
Your Company took various steps to overcome the situation which included rationalisation, modernisation and capex
ANNUAL REPORT20 1819
4746
programme on need priority basis. Apart from this, the Company enhanced its focus on marketing and value addition to achieve the optimum benefits. Your Company also focused on cost reduction to improve the profitability along with better product mix and improving efficiency. The above measures are expected to result positively in the current financial year.
The analytical review of the Company’s performance and its businesses, including initiatives in the areas of human resources and information technology, has been presented in the section on Management Discussion and Analysis of the Annual Report.
Working results of last three financial years 2016-17 to 2018-19 are given in Annexure – I and form part of this report.
Expansion and ModernizationYour Directors in their previous report had informed the members about the modernization of its spinning facility at Ringas Unit. Your Directors feel pleasure in informing the members that the same had been completed during the year at a capital outlay of D55.02 crore. Similarly your Directors had also reported about the expansion of capacity of Recycled Polyester Fibre unit from 50 Mt per day to 120 Mt per day at a capital outlay of D94.05 crore. Yours Directors gladly inform the members that the said expansion programme had also been completed during the year under review. Your Directors inform the members that both the above programmes were completed within the capital budgets for the said programmes.
Yours Directors inform the members that though the prevailing market conditions were depressed during the year under review, your Company is well positioned to take the advantage of above stated capex, once the market cycle reverses and market conditions improve favorably.
Subsidiary Companies, Joint Ventures & AssociatesYour Directors in their previous report had informed the members about the investment by the Company in M/s. LNJ Skills & Rozgar Private Limited which is involved in skill development related activities. Your Directors feel pleasure in informing the members that during the year under review your Company acquired 54.26% shareholding in M/s. LNJ Skills & Rozgar Private Limited at an investment of D11.80 crore and acquired 11,80,000 Equity shares in the Company. M/s. LNJ Skills & Rozgar Private Limited became subsidiary of your Company w.e.f. November, 2018. Your Directors further inform the members that M/s. LNJ Skills & Rozgar Private Limited subsequently ceased to be the subsidiary of the Company in April, 2019 with the allotment of equity shares by them to other entities to further their business. However, your Company continues to hold 47.30% shareholding in M/s. LNJ Skills &
Rozgar Private Limited and therefore it has acquired the status of Associate of the Company. Your Directors are hopeful that with this investment, your Company would contribute its bit in enhancing the skill levels of our countrymen.
Yours Directors in their previous report informed the members that Hero Wind Energy Private Limited, who acquired the stake of M/s. LNJ Power Ventures Limited, had become Joint Venture partner with the Company. Your Directors are of the view that there is no significant influence of your Company on the operations of M/s. LNJ Power Ventures Limited throughout the year and therefore it no longer remains Associate of your Company from April, 2018 onwards.
Further as reported in the previous report, your Company is holding significant investment in Bhilwara Energy Limited and is represented by Shri Riju Jhunjhunwala, Managing Director of your Company on their Board, where also he is holding the position of Managing Director. Your Directors inform the members that your Company sold its investment in M/s. Bhilwara Energy Limited comprising of 1,69,38,599 equity shares of D10 each constituting 10.21% to M/s. HEG Limited as approved by your Board on 10th April, 2019 for a consideration of D84.85 crore. However, your Company continues to hold 1,25,24,960 Equity Shares constituting 7.57% of paid up capital in M/s. Bhilwara Energy Limited. Your Directors are of the view that your Company continues to exercise its significant influence on BEL by the representation of Shri Riju Jhunjhunwala, Managing Director on the Board of BEL and accordingly continue to treat M/s. Bhilwara Energy Limited as its Associate. Accordingly, M/s Bhilwara Energy Limited continues to be Associate of your Company.
A statement containing the salient features of the financial statements of M/s. LNJ Skills & Rozgar Private Limited and M/s. Bhilwara Energy Limited in the prescribed format AOC 1 is annexed as Annexure - II.
Contribution to the ExchequerYour Company has contributed an amount of D274.55 crore in terms of taxes and duties to the Exchequer.
Corporate Social ResponsibilityYour Directors feel pleasure to inform the members that your Company has been on the forefront to fulfil its obligation towards the society at large and accordingly made its contribution in whole gamut of activities such as sanitation and safe drinking water, eradicating hunger, poverty and malnutrition, ensuring environmental sustainability, ecological balance, protection of national heritage, promotion of rural sports etc. During the financial year 2018-19 your Company has incurred D1.75
Corporate Overview Management Reports Financial Statements1 45 103
4746
crore on account of CSR activities which includes Protection of National Heritage, Art & Culture D0.59 crore; expenses on Preventive Health Care & Safe Drinking Water D0.51 crore; towards Contribution to Rural Area Development D0.24 crore; towards Contribution to Prime Minister National Relief Fund D0.14 crore; and D0.13 crore on Promotion of Education.
Your Directors inform the members that the Corporate Social Responsibility Committee comprising of Shri Arun Churiwal, Shri Riju Jhunjhunwala and Shri Amar Nath Choudhary, Directors monitors the expenditure incurred on the CSR activities and formulate an annual budget for these activities. Your Directors also review the progress periodically.
The details of the CSR spend by the Company are annexed as Annexure III forming part of this report.
Energy Conservation, Technology Absorption and Foreign Exchange Earnings and OutgoYour Directors inform the members that your Company continuously looks out for energy conservation measures in all areas of operation across its various Units. Similarly your Company endeavors to lookout for up-gradation and absorption of technology. Your Company also spends continuously on research and development. Your Directors are glad to inform the members that your Company is a net foreign exchange earner. The relevant detail as required to be disclosed with respect to Energy Conservation, Technology Absorption and Foreign Exchange Earnings and Outgo pursuant to Section 134(3)(m) of the Companies Act, 2013 read with the Rule 8(3) of the Companies (Accounts) Rules, 2014 are given in Annexure – IV forming part of this report.
Extract of Annual ReturnPursuant to Section 92 of the Companies Act, 2013 read with Rule 12 of The Companies (Management and Administration) Rules, 2014, the extract of Annual Return in prescribed format MGT-9 is annexed as Annexure – V.
Directors & Key Managerial PersonnelShri Riju Jhunjhunwala and Shri Jagdish Chandra Laddha, Directors retire by rotation and being eligible offer themselves for re-appointment.
Your Directors inform the members that Shri Brij Mohan Sharma was co-opted on the Board as an Additional Director and was also designated as Joint Managing Director with effect from 7th August, 2018 and approved by the members at the previous Annual General Meeting held on 13th September, 2018. Shri Brij Mohan Sharma brings with him vast experience in the field of Finance. Your Directors in their previous report mentioned about the re-appointment of Shri Priya Shankar Dasgupta, Independent Director for the second term of 5
years w.e.f. 16th September, 2018. Your Directors inform the members that the members of the Company at the previous Annual General Meeting of the Company held on September 13, 2018 approved the re-appointment of Shri Priya Shankar Dasgupta as Independent Director for the second term of five years commencing from September 16, 2018 by Special Resolution. Your Directors further inform the members that the term of Dr. Kamal Gupta, Shri Dharmendar Nath Davar and Shri Amar Nath Choudhary as Independent Directors is due for completion on September 15, 2019. Your Directors upon commendation of Nomination and Remuneration Committee proposed to re-appoint Dr. Kamal Gupta and Shri Amar Nath Choudhary for the second term of 5 years w.e.f September 16, 2019. Your Directors upon commendation of Nomination and Remuneration Committee proposed to re-appoint Shri Dharmendar Nath Davar for the second term of 2 years w.e.f. September 16, 2019. The re-appointment of Dr. Kamal Gupta, Shri Dharmendar Nath Davar and Shri Amar Nath Choudhary as Independent Directors shall be put up before the ensuing Annual General Meeting.
Your Directors further inform the members that declarations have been taken from the Independent Directors at the beginning of the financial year stating that they meet the criteria of independence as specified under sub-section (6) of Section 149 of the Companies Act, 2013 and Regulation 16(1)(b) of the SEBI (Listing Obligations and Disclosure Requirements) Regulations, 2015.
During the year, Shri Riju Jhunjhunwala, Managing Director & Chief Executive Officer, Shri Brij Mohan Sharma, Joint Managing Director & Chief Financial Officer and Shri Surender Gupta, Company Secretary acted as Key Managerial Personnel.
Directors’ Appointment and Remuneration PolicyAs your Directors informed the members in their previous report, a Nomination and Remuneration Policy had been framed by your Company for the appointment of Directors and Senior Management and fixation of their remuneration. The Nomination and Remuneration Policy as framed is annexed as Annexure VI and forms part of this report.
Your Directors inform the members that the Nomination and Remuneration Committee as well as your Directors endeavor to follow the policy and all appointments at Board and Senior Management are considered at the meetings of the Committee and the Board.
Annual Evaluation by the BoardYour Board of Directors, during the financial year under review, carried out annual evaluation of its own performance as well as its Committees and also of the individual Directors in the manner as enumerated in the Nomination and Remuneration Policy in accordance with the provisions of Companies Act, 2013
ANNUAL REPORT20 1819
4948
and SEBI (Listing Obligations and Disclosure Requirements) Regulations, 2015. Your Directors feel pleasure in informing the members that the performance of the Board as a whole and its members individually was adjudged satisfactory.
Particulars of Loans, Guarantees or InvestmentsDetails of loans, Guarantees and Investments are given in the Notes to the Financial Statements at appropriate places.
Public DepositDuring the period under review, your Company has not accepted any public deposit within the meaning of provisions of section 73 of the Companies Act, 2013 read with the Companies (Acceptance of Deposits) Rules, 2014 and there is no outstanding deposit due for re-payment.
Particulars of Contracts or Arrangements with Related PartiesAll contracts/ arrangements/ transactions entered into by the Company during the financial year with the related parties are on arm’s length basis and in the ordinary course of business. During the financial year, there was no material contracts or arrangements entered into by the Company with any of the related party. Your Directors draw attention of the members to Note No.39 to the financial statement, which contain particulars with respect to related parties. The policy on dealing with the related party transactions as approved by the Board of Directors is disclosed on the website of the Company under the following link
https://www.rswm.in/wp-content/uploads/2019/05/Related-Party-Transaction-Policy.pdf
Significant and Material Orders Passed by the Regulators or CourtsDuring the year under review, there were no significant and material orders passed by the Regulators or Courts.
Risk Management PolicyThe Company has adopted the risk management policy which aimed at creating and protecting shareholders value by minimizing threats and losses and identifying and maximizing opportunities. Your Directors periodically review the risks associated with the business or which threaten the prospects of the Company.
Internal Control SystemsYour Directors inform the members that your Company has put in place strong internal control systems commensurate with the size of the Company. Further, your Directors take utmost care
to ensure that all assets are properly safeguarded and reliable information is provided to the management. Your Directors endeavor to inform the members that all the obligations of the Company are properly adhered to.
Your Directors place utmost importance on continuous strengthening of internal control systems. As reported in the previous report, your Company has put in place a system whereby all areas of the operations of the Company are reviewed by the internal as well as external professionals and independent audit firms. Your Company takes adequate measures with respect to gaps, if any, are reported. The Audit Committee of your Company regularly monitors the annual operating plans, risk assessment and minimization procedures as well as mitigation plans.
Your Directors endeavor to continuously improve and monitor the internal control systems.
Particulars of EmployeesThe information pursuant to Section 197 read with Rule 5 of the Companies (Appointment and Remuneration of Managerial Personnel) Rules, 2014, of the employees is annexed as Annexure–VII.
Further, pursuant to Rule 5(2) of the Companies (Appointment and Remuneration of Managerial Personnel) Rules, 2014, the relevant statement is annexed as Annexure - VIII.
Your Directors state that no disclosure or reporting is required in respect of ESOS in the financial year under review as the Company had not issued stock options.
AuditorsStatutory AuditorsYour Directors inform the members that M/s. S. S. Kothari Mehta & Co., Chartered Accountants (Firm Registration No.000756N), Joint Statutory Auditors of the Company, who were appointed at the 53rd Annual General Meeting of the Company held on 16th September, 2014 for a term of 5 years would be completing their first term at the ensuing Annual General Meeting of the Company. M/s. S. S. Kothari Mehta & Co., Chartered Accountants (Firm Registration No.000756N) have expressed willingness for their re-appointment for second term of five years from the conclusion of 58th Annual General Meeting of the Company till the conclusion of 63rd Annual General Meeting of the Company in accordance with the provisions of Section 139 of the Companies Act, 2013. Your Directors, upon commendation of Audit Committee, recommend the re-appointment of M/s. S. S. Kothari Mehta & Co., Chartered Accountants (Firm Registration No.000756N) as the Joint Statutory Auditors in the ensuing Annual General Meeting of the Company.
Corporate Overview Management Reports Financial Statements1 45 103
4948
M/s. Lodha & Co, Chartered Accountants (Firm Registration No.301051E), were appointed as Joint Statutory Auditors of the Company at the 56th Annual General Meeting of the Company held on 27th September, 2017 for a term of 5 years till the conclusion of 61st Annual General Meeting and accordingly continue with their term till 61st Annual General Meeting of the Company.
Further, both the Statutory Auditors have confirmed their eligibility under Section 141 of the Companies Act, 2013 and the Rules framed there under.
The observations of the Auditors, if any, are explained wherever necessary, in the appropriate notes to the accounts. The Auditors’ Report does not contain qualification, reservation or adverse remark.
Internal AuditorsYour Directors, during the year under review, appointed M/s. P. K. Deora & Co., Chartered Accountants (Firm Registration No.004167N), M/s. BGJC & Associates LLP, Chartered Accountants (Firm Registration No.003304N) and M/s. ASM Bhargava & Co., Chartered Accountants (Firm Registration No.019378C) to act as the Internal Auditors of the Company for the financial year 2018-19 pursuant to section 138 of the Companies Act, 2013 read with The Companies (Accounts) Rules, 2014.
Secretarial AuditorYour Directors, during the year under review, also appointed Shri Mahesh Gupta, Practicing Company Secretary (Membership No. FCS 2870 and CP No.1999) Proprietor of M/s Mahesh Gupta & Company, Company Secretaries, Delhi as the Secretarial Auditor of the Company for the financial year 2018-19 pursuant to Section 204 of the Companies Act, 2013 read with The Companies (Appointment and Remuneration of Managerial Personnel) Rules, 2014.The Report of Secretarial Audit is annexed as Annexure IX.
Cost AuditorYour Directors inform the members that pursuant to Section 148 of the Companies Act, 2013 read with The Companies (Cost Records and Audit) Rules, 2014, Textile Companies are required to get their cost records audited. In this connection, the Board of Directors of the Company on the commendation of Audit Committee had approved the appointment of M/s. N. D. Birla & Company, Cost Accountants, (Firm Registration No. 000028), Ahmedabad as the Cost Auditor of the Company for the year ending March 31, 2019.
Corporate Governance Report on Corporate Governance along with the Certificate of Auditors M/s. S. S. Kothari Mehta & Co., Chartered Accountants
(Firm Registration No 000756N), Plot No-68, Okhla Industrial Area, Phase III, New Delhi -110020 and M/s. Lodha & Co., Chartered Accountants (Firm Registration No.301051E), 12, Bhagat Singh Marg, New Delhi – 110 001confirming compliance to conditions of Corporate Governance as stipulated under SEBI (Listing Obligations and Disclosure Requirements) Regulations, 2015, form part of the Annual Report.
Whistle Blower PolicyYour Directors inform the members that with the objective of pursuing the business in a fair and transparent manner by adopting the highest standards of professionalism, honesty, integrity and ethical behavior and to encourage and protect the employees who wish to raise and report their genuine concerns about any unethical behavior, actual or suspected fraud or violation of Company’s Code of Conduct, the Company has adopted a Whistle Blower Policy. Policy adopted by the Company contains a framework whereby the identity of the complainant is not disclosed. The policy has been disclosed on the website of the Company, the link of which is given hereunder:http://www.rswm.in/wp-content/themes/rswm/template-investors/pdf/various-policies/RSWM-Whistle-Blower-Policy-2018.pdf
Compliance with the Provisions of Sexual Harassment of Women at Workplace (Prevention, Prohibition and Redressal) Act, 2013Your Company endeavors to provide a harmonious working environment for female employees and has adopted a policy which provides for protection against sexual harassment of women at work place and for prevention and redressal of such complaints. During the year, no such complaints were received. The company has complied with the provisions relating to the constitution of Internal Compliance Committee under the Sexual Harassment of Women At Workplace (Prevention, Prohibition And Redressal) Act, 2013.
Management Discussion and Analysis ReportManagement Discussion and Analysis Report as required by SEBI (Listing Obligations and Disclosure Requirements) Regulations, 2015, forms part of the Annual Report.
Directors’ Responsibility StatementPursuant to Section 134(3)(c) of the Companies Act, 2013, the Directors state that:
(a) In the preparation of the annual accounts, the applicable accounting standards had been followed along with proper explanation relating to material departures;
ANNUAL REPORT20 1819
5150
(b) They had selected such accounting policies and applied them consistently and made judgments and estimates that are reasonable and prudent so as to give a true and fair view of the state of affairs of the Company at the end of the financial year and of the profit and loss of the Company for that period;
(c) They had taken proper and sufficient care for the maintenance of adequate accounting records in accordance with the provisions of this Act for safeguarding the assets of the Company and for preventing and detecting fraud and other irregularities;
(d) They had prepared the annual accounts on a going concern basis; and
(e) They had laid down internal financial controls to be followed by the Company and that such internal financial controls are adequate and were operating effectively; and
(f ) They had devised proper systems to ensure compliance with the provisions of all applicable laws and that such systems were adequate and operating effectively.
AcknowledgementsYour Directors take this opportunity to thank Customers, Members, Suppliers, Bankers, Business Partners/Associates, Central and State Governments for their consistent support and co-operation extended to the Company. We also acknowledge the significant contribution made by the employees by their dedication and hard work and trust reposed on us. We look forward to have the same support in our endeavor to help the Company to grow faster.
For and on behalf of the Board
Ravi JhunjhunwalaPlace: Noida (U.P) ChairmanDate: May 21, 2019 DIN - 00060972
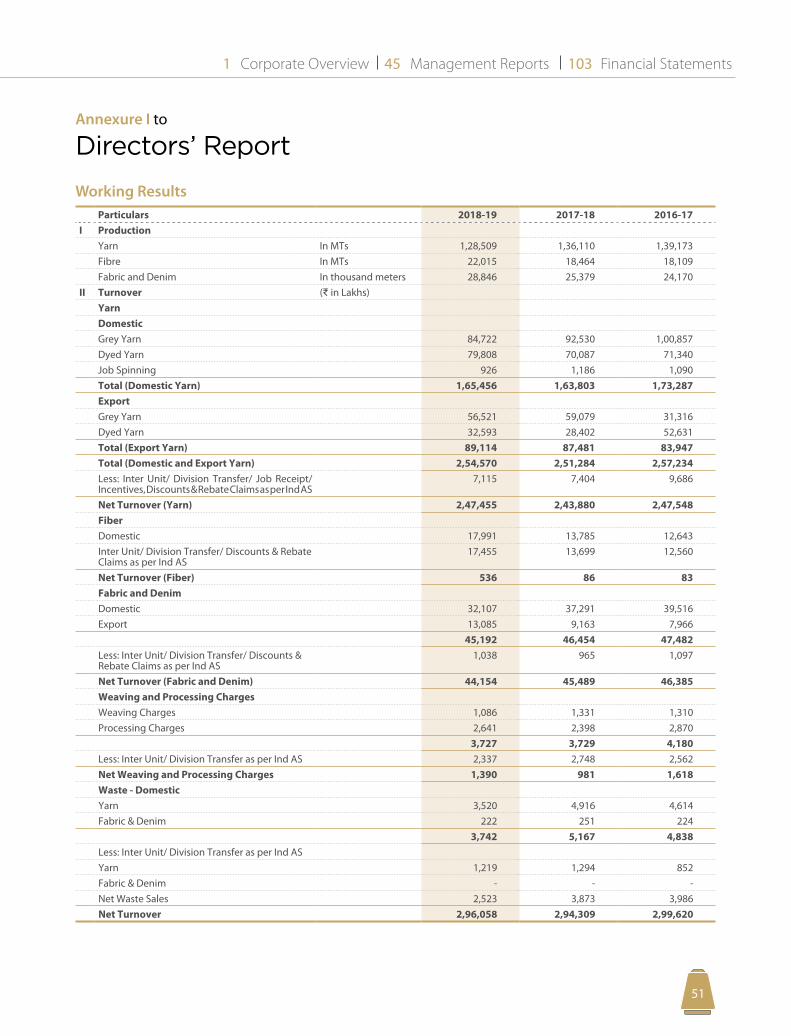
Corporate Overview Management Reports Financial Statements1 45 103
5150
Annexure I to
Directors’ Report
Working ResultsParticulars 2018-19 2017-18 2016-17
I ProductionYarn In MTs 1,28,509 1,36,110 1,39,173 Fibre In MTs 22,015 18,464 18,109 Fabric and Denim In thousand meters 28,846 25,379 24,170
II Turnover (D in Lakhs)YarnDomesticGrey Yarn 84,722 92,530 1,00,857 Dyed Yarn 79,808 70,087 71,340 Job Spinning 926 1,186 1,090 Total (Domestic Yarn) 1,65,456 1,63,803 1,73,287 ExportGrey Yarn 56,521 59,079 31,316 Dyed Yarn 32,593 28,402 52,631 Total (Export Yarn) 89,114 87,481 83,947 Total (Domestic and Export Yarn) 2,54,570 2,51,284 2,57,234 Less: Inter Unit/ Division Transfer/ Job Receipt/ Incentives, Discounts & Rebate Claims as per Ind AS
7,115 7,404 9,686
Net Turnover (Yarn) 2,47,455 2,43,880 2,47,548 FiberDomestic 17,991 13,785 12,643 Inter Unit/ Division Transfer/ Discounts & Rebate Claims as per Ind AS
17,455 13,699 12,560
Net Turnover (Fiber) 536 86 83 Fabric and DenimDomestic 32,107 37,291 39,516 Export 13,085 9,163 7,966
45,192 46,454 47,482 Less: Inter Unit/ Division Transfer/ Discounts & Rebate Claims as per Ind AS
1,038 965 1,097
Net Turnover (Fabric and Denim) 44,154 45,489 46,385 Weaving and Processing ChargesWeaving Charges 1,086 1,331 1,310 Processing Charges 2,641 2,398 2,870
3,727 3,729 4,180 Less: Inter Unit/ Division Transfer as per Ind AS 2,337 2,748 2,562 Net Weaving and Processing Charges 1,390 981 1,618 Waste - DomesticYarn 3,520 4,916 4,614 Fabric & Denim 222 251 224
3,742 5,167 4,838 Less: Inter Unit/ Division Transfer as per Ind ASYarn 1,219 1,294 852 Fabric & Denim - - - Net Waste Sales 2,523 3,873 3,986 Net Turnover 2,96,058 2,94,309 2,99,620
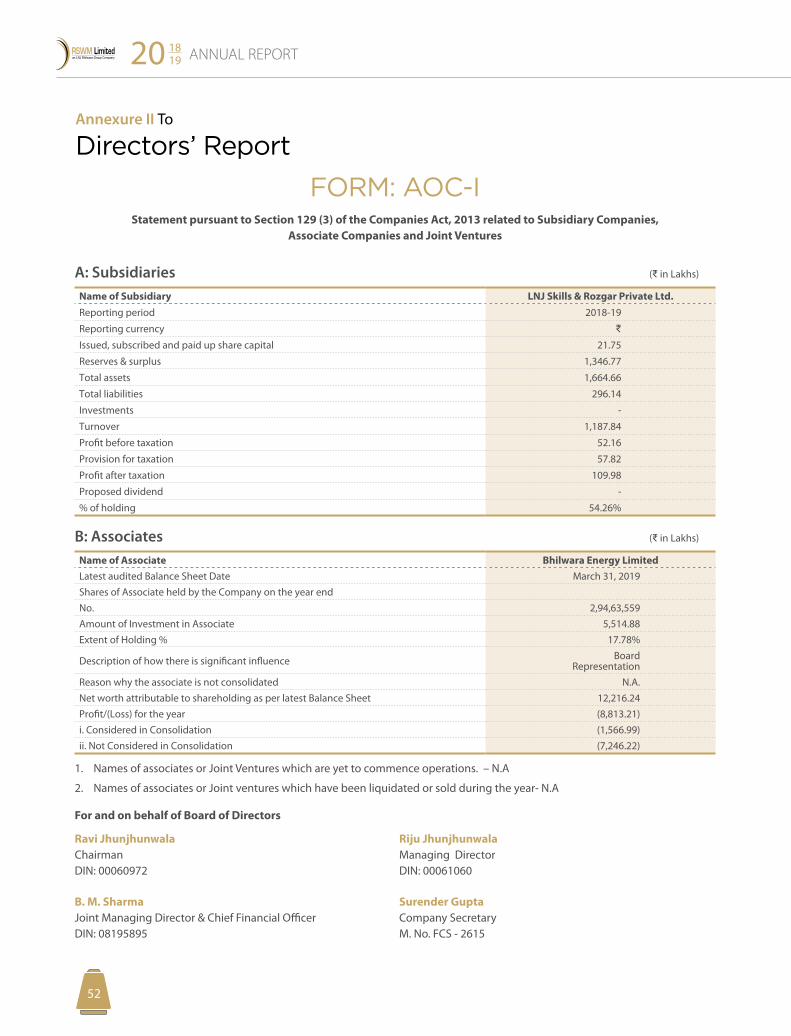
ANNUAL REPORT20 1819
5352
Annexure II To
Directors’ Report
FORM: AOC-IStatement pursuant to Section 129 (3) of the Companies Act, 2013 related to Subsidiary Companies,
Associate Companies and Joint Ventures
A: Subsidiaries (D in Lakhs)
Name of Subsidiary LNJ Skills & Rozgar Private Ltd.Reporting period 2018-19
Reporting currency D
Issued, subscribed and paid up share capital 21.75
Reserves & surplus 1,346.77
Total assets 1,664.66
Total liabilities 296.14
Investments -
Turnover 1,187.84
Profit before taxation 52.16
Provision for taxation 57.82
Profit after taxation 109.98
Proposed dividend -
% of holding 54.26%
B: Associates (D in Lakhs)
Name of Associate Bhilwara Energy LimitedLatest audited Balance Sheet Date March 31, 2019Shares of Associate held by the Company on the year end No. 2,94,63,559 Amount of Investment in Associate 5,514.88 Extent of Holding % 17.78%
Description of how there is significant influence Board Representation
Reason why the associate is not consolidated N.A.Net worth attributable to shareholding as per latest Balance Sheet 12,216.24Profit/(Loss) for the year (8,813.21)i. Considered in Consolidation (1,566.99)ii. Not Considered in Consolidation (7,246.22)
1. Names of associates or Joint Ventures which are yet to commence operations. – N.A
2. Names of associates or Joint ventures which have been liquidated or sold during the year- N.A
For and on behalf of Board of Directors
Ravi Jhunjhunwala Riju JhunjhunwalaChairman Managing DirectorDIN: 00060972 DIN: 00061060
B. M. Sharma Surender GuptaJoint Managing Director & Chief Financial Officer Company SecretaryDIN: 08195895 M. No. FCS - 2615
Corporate Overview Management Reports Financial Statements1 45 103
5352
Annual Report on Corporate Social Responsibility (CSR) activities for the financial year 2018-19
1. A brief outline of the Company’s CSR policy, including overview of projects or programmes proposed to be undertaken and a reference to web-link to the CSR policy and projects or programs.
A brief outline of the Company’s CSR policy is given hereunder:
• To develop a foundation, which shall take up all the CSR initiatives being carried out by the Company. This foundation will also take up specific CSR projects with defined objectives, budget and timelines for delivery.
• To develop and institutionalize mechanisms and systems for identification, implementation and monitoring of CSR initiatives/projects.
• To implement CSR initiatives/projects in the geographical vicinity of the manufacturing units.
• To implement CSR initiatives/projects preferably in the economic vicinity of its business operations.
• To create and develop sustainable models of socio-economic development with active inputs and participation of the target audience. These models should become self-sustainable in terms of implementation and financial support over a period of time.
• To collaborate with Government bodies/agencies and other NGOs for selected developmental initiatives/projects in the region.
• To collaborate with local communities and concerned institutions for implementation of developmental initiatives/projects.
• To seek voluntary contributions from its manpower assets for participation in the implementation of these initiatives/projects.
• To ensure that these initiatives and developmental projects are in line with the statutory guidelines provided by Government and statutory agencies on environmental, health and safety.
Overview of projects or programmes undertaken is given in the Para 5 C of this statement.
The web link of CSR Policy of the company is stated herein; https://www.rswm.in/wp-content/themes/rswm/template-investors/pdf/various-policies/RSWM_CSR_POLICY.pdf
2. The Composition of CSR Committee.
Shri Arun Churiwal (Chairman)
Shri Riju Jhunjhunwala
Shri Amar Nath Choudhary
3. Average net profit of the Company for last three financial years.
Average net profit: D9,483.90 Lakhs.
4. Prescribed CSR Expenditure (two per cent of the amount as in item 3 above)
The Company is required to spend D189.68 Lakhs.
5. Details of CSR spent during the financial year;
(a) Total amount to be spent for the financial year;
D236.88 Lakhs (including an amount of D47.20 Lakhs which remained unspent for the financial year 2017-18)
(b) Total amount spent for the financial year
Out of total obligation of D236.88 Lakhs, the Company has spent D174.80 Lakhs.
(c) Amount unspent, if any; D62.08 Lakhs.
Annexure III to
Directors’ Report
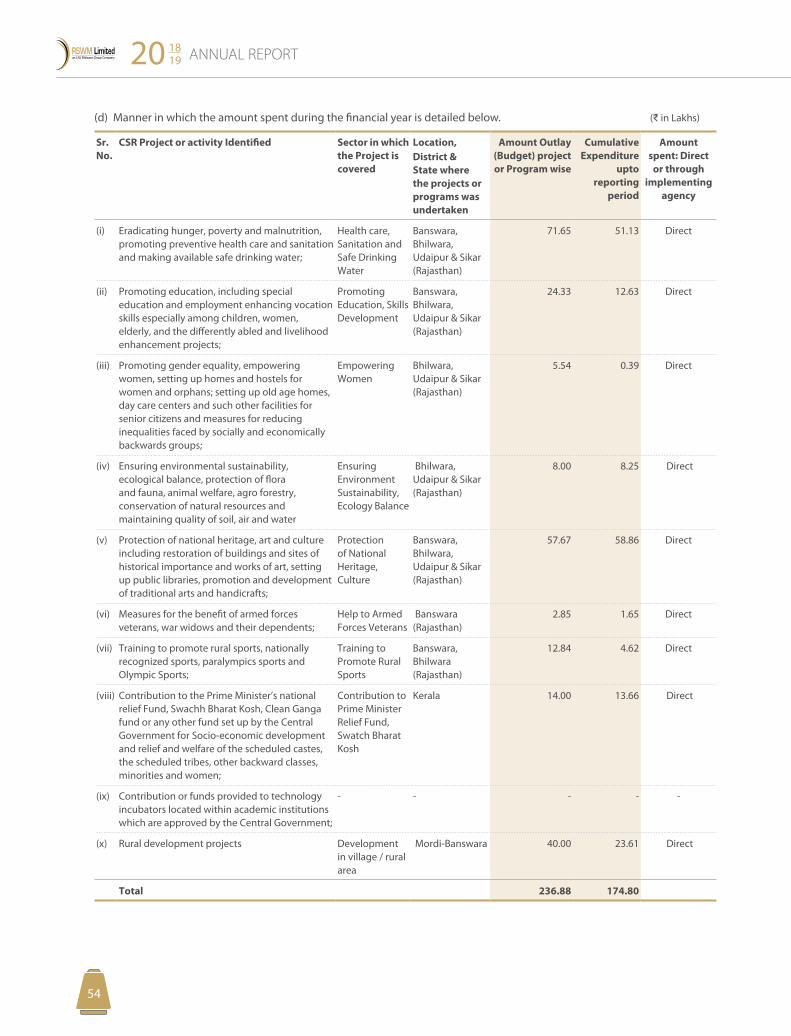
ANNUAL REPORT20 1819
5554
(d) Manner in which the amount spent during the financial year is detailed below. (D in Lakhs)
Sr. No.
CSR Project or activity Identified Sector in which the Project is covered
Location, Amount Outlay (Budget) project or Program wise
Cumulative Expenditure
upto reporting
period
Amount spent: Direct
or through implementing
agency
District & State where the projects or programs was undertaken
(i) Eradicating hunger, poverty and malnutrition, promoting preventive health care and sanitation and making available safe drinking water;
Health care, Sanitation and Safe Drinking Water
Banswara, Bhilwara, Udaipur & Sikar (Rajasthan)
71.65 51.13 Direct
(ii) Promoting education, including special education and employment enhancing vocation skills especially among children, women, elderly, and the differently abled and livelihood enhancement projects;
Promoting Education, Skills Development
Banswara, Bhilwara, Udaipur & Sikar (Rajasthan)
24.33 12.63 Direct
(iii) Promoting gender equality, empowering women, setting up homes and hostels for women and orphans; setting up old age homes, day care centers and such other facilities for senior citizens and measures for reducing inequalities faced by socially and economically backwards groups;
Empowering Women
Bhilwara, Udaipur & Sikar (Rajasthan)
5.54 0.39 Direct
(iv) Ensuring environmental sustainability, ecological balance, protection of flora and fauna, animal welfare, agro forestry, conservation of natural resources and maintaining quality of soil, air and water
Ensuring Environment Sustainability, Ecology Balance
Bhilwara, Udaipur & Sikar (Rajasthan)
8.00 8.25 Direct
(v) Protection of national heritage, art and culture including restoration of buildings and sites of historical importance and works of art, setting up public libraries, promotion and development of traditional arts and handicrafts;
Protection of National Heritage, Culture
Banswara, Bhilwara, Udaipur & Sikar (Rajasthan)
57.67 58.86 Direct
(vi) Measures for the benefit of armed forces veterans, war widows and their dependents;
Help to Armed Forces Veterans
Banswara (Rajasthan)
2.85 1.65 Direct
(vii) Training to promote rural sports, nationally recognized sports, paralympics sports and Olympic Sports;
Training to Promote Rural Sports
Banswara, Bhilwara (Rajasthan)
12.84 4.62 Direct
(viii) Contribution to the Prime Minister’s national relief Fund, Swachh Bharat Kosh, Clean Ganga fund or any other fund set up by the Central Government for Socio-economic development and relief and welfare of the scheduled castes, the scheduled tribes, other backward classes, minorities and women;
Contribution to Prime Minister Relief Fund, Swatch Bharat Kosh
Kerala 14.00 13.66 Direct
(ix) Contribution or funds provided to technology incubators located within academic institutions which are approved by the Central Government;
- - - - -
(x) Rural development projects Development in village / rural area
Mordi-Banswara 40.00 23.61 Direct
Total 236.88 174.80
Corporate Overview Management Reports Financial Statements1 45 103
5554
6. In case the Company has failed to spend the two percent of the average net profit of the last three financial years or any part thereof, the reasons for not spending the amount in its Board report.
As some of the activities could not be completed before March 31, 2019, the budgeted funds remained partially unutilized. These activities will be completed in financial year 2019-20 and the balance funds would be utilized accordingly. The CSR amount to be spent during financial year 2019-20 will be in addition to unutilized amount for the financial year 2018-19.
7. A responsibility statement of the CSR Committee that the implementation and monitoring of CSR Policy, is in compliance with CSR objectives and of the Company.
The object of the CSR is met keeping into consideration the agreed schedules, with definitive and clear objectives and dialogue with the stakeholders and sharing of knowledge and building of trust.
Arun Churiwal Riju JhunjhunwalaDirector and Chairman CSR Committee Managing Director & CEODIN: 00001718 DIN: 00061060
ANNUAL REPORT20 1819
5756
A. Energy conservation measures taken during FY 2018-19
Energy conservation dictates that how much concerned a company is in conducting its business operations with minimization of power units and decreasing the side effects of global warming. The Company has undertaken following major steps:
I. Yarn Business
I. I. PV Yarn Business
1. Variable Frequency Drive (VFD)
Exercise was continued in various potential areas for added advantage in power as has been done in past.
2. Energy Efficient Motors
Replaced motors of Ring frames, TFO and Humidification Plants to save power. Old water pumps and motors also replaced with new energy efficient pumps with IE3 motors.
3. Compressors
• Continuous monitoring of air leakages in air compressor lines in various machines i.e. Blow room, Carding , Draw-frame, Speed frame, Ring-frame and Auto-corners is being done, resulting saving of compressed air power consumption.
• Maintained the power factor at 0.996 to 0.999 and reduced the cable and transmission losses.
4. Utilities and Others
• Replaced overhead travelling cleaners, impellers of Ring frame and TFO machines by energy efficient impellers.
• Installed RH sensors to control the water pump through VFD to maintain constant humidity in department.
• Replaced conventional street lights, flood lights, garden halogen bulbs and lamp fittings with LED lights of required power capacity.
• Installed humidity controller in TFO H-plant at Kharigram SJ-11 unit for S/Air and R/Air to control the speed of fans to save humidity. Approximate 396 units saved per day.
• Saved energy from leakages / losses of compressed air network by in-house team and saved approximate 875 units per day.
• Cable and termination losses reduced and improved power factor.
Annexure IV to
Directors’ ReportParticulars of Energy Conservation, Technology Absorption and Foreign Exchange Earnings and Outgo required under the Companies (Accounts) Rules, 2014.
• Installed automated timer based controller to control the speed of supply air and return air fans of humidification plant.
• Replaced spindle with bolsters in doubling machines. (wharvedia 22.2 to 20.2 )
• Installed vapour absorption chiller machine (VAM) at Recycled Polyester Fiber unit and saved approximate 1990 units per day.
Following carried out at Thermal Power Plant-unit
• Operation of Jockey Pumps on pressure control and saved 42,000 units.
• Optimization of CHP running hours and saved 54,000 units.
5. Steps taken to utilize alternative sources of energy
Installed Ground Solar Power Plant of 6.75 MW and 11.00 MW capacity respectively at Kharigram and Mordi with generation of 90,000 Units per day.
6. Conservation of Water
• Used STP water for plantation, through drip irrigation.
• Rejected water of R.O. also used for plantation.
I. II. Melange Yarn Business
1. Utilities and Others
• Compressed air leakages and losses at machine level got audited through external agency.
• Street lights with CFL were replaced by LED street lights.
• Old mono block pumps replaced with new energy efficient pumps at ETP and R.O Plant.
2. Steps taken to utilise alternate sources of energy
• Ring frame machines pneumafil fan impellers replaced with less diameter fans at 50 machines.
• At bale press machine, condensers replaced with energy efficient cyclomex.
II. Denim and Fabric Business
II.I. Fabric Business
1. Energy Efficient Motors
• Replaced conventional pumps and motors by new energy efficient pumps and motors in biological tank and effluent treatment and recovery plant (ETRP).
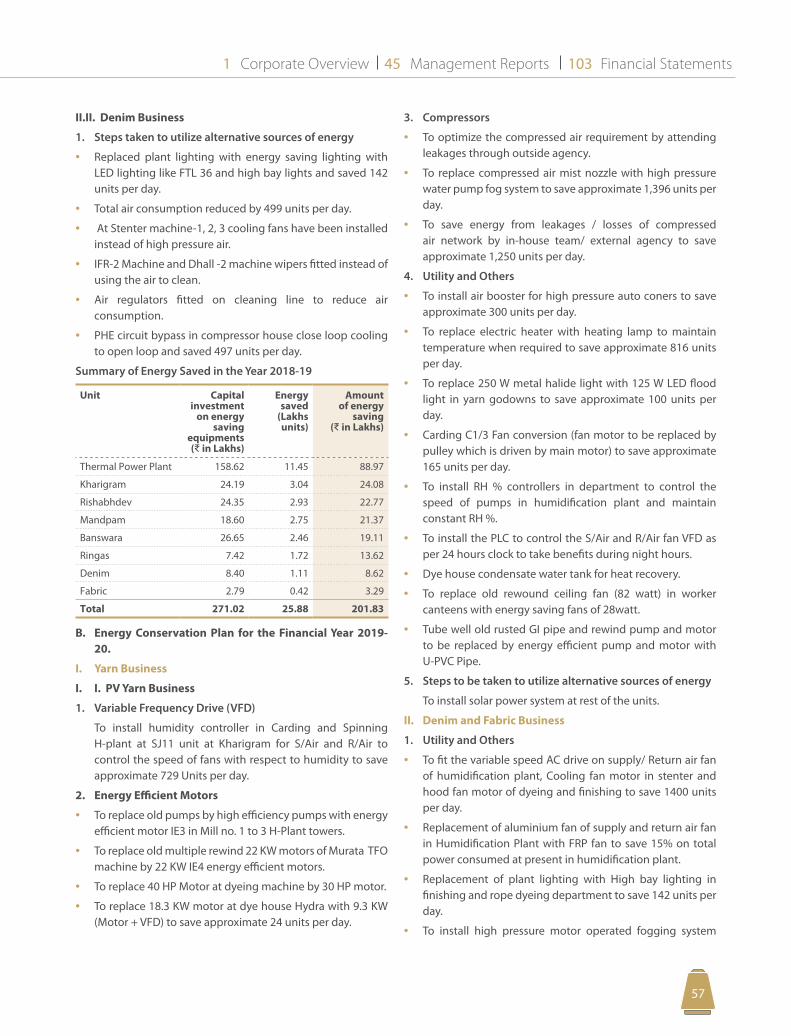
Corporate Overview Management Reports Financial Statements1 45 103
5756
II.II. Denim Business
1. Steps taken to utilize alternative sources of energy
• Replaced plant lighting with energy saving lighting with LED lighting like FTL 36 and high bay lights and saved 142 units per day.
• Total air consumption reduced by 499 units per day.
• At Stenter machine-1, 2, 3 cooling fans have been installed instead of high pressure air.
• IFR-2 Machine and Dhall -2 machine wipers fitted instead of using the air to clean.
• Air regulators fitted on cleaning line to reduce air consumption.
• PHE circuit bypass in compressor house close loop cooling to open loop and saved 497 units per day.
Summary of Energy Saved in the Year 2018-19
Unit Capital investment
on energy saving
equipments (D in Lakhs)
Energy saved
(Lakhs units)
Amount of energy
saving (D in Lakhs)
Thermal Power Plant 158.62 11.45 88.97
Kharigram 24.19 3.04 24.08
Rishabhdev 24.35 2.93 22.77
Mandpam 18.60 2.75 21.37
Banswara 26.65 2.46 19.11
Ringas 7.42 1.72 13.62
Denim 8.40 1.11 8.62
Fabric 2.79 0.42 3.29
Total 271.02 25.88 201.83
B. Energy Conservation Plan for the Financial Year 2019-20.
I. Yarn Business
I. I. PV Yarn Business
1. Variable Frequency Drive (VFD)
To install humidity controller in Carding and Spinning H-plant at SJ11 unit at Kharigram for S/Air and R/Air to control the speed of fans with respect to humidity to save approximate 729 Units per day.
2. Energy Efficient Motors
• To replace old pumps by high efficiency pumps with energy efficient motor IE3 in Mill no. 1 to 3 H-Plant towers.
• To replace old multiple rewind 22 KW motors of Murata TFO machine by 22 KW IE4 energy efficient motors.
• To replace 40 HP Motor at dyeing machine by 30 HP motor.
• To replace 18.3 KW motor at dye house Hydra with 9.3 KW (Motor + VFD) to save approximate 24 units per day.
3. Compressors
• To optimize the compressed air requirement by attending leakages through outside agency.
• To replace compressed air mist nozzle with high pressure water pump fog system to save approximate 1,396 units per day.
• To save energy from leakages / losses of compressed air network by in-house team/ external agency to save approximate 1,250 units per day.
4. Utility and Others
• To install air booster for high pressure auto coners to save approximate 300 units per day.
• To replace electric heater with heating lamp to maintain temperature when required to save approximate 816 units per day.
• To replace 250 W metal halide light with 125 W LED flood light in yarn godowns to save approximate 100 units per day.
• Carding C1/3 Fan conversion (fan motor to be replaced by pulley which is driven by main motor) to save approximate 165 units per day.
• To install RH % controllers in department to control the speed of pumps in humidification plant and maintain constant RH %.
• To install the PLC to control the S/Air and R/Air fan VFD as per 24 hours clock to take benefits during night hours.
• Dye house condensate water tank for heat recovery.
• To replace old rewound ceiling fan (82 watt) in worker canteens with energy saving fans of 28watt.
• Tube well old rusted GI pipe and rewind pump and motor to be replaced by energy efficient pump and motor with U-PVC Pipe.
5. Steps to be taken to utilize alternative sources of energy
To install solar power system at rest of the units.
II. Denim and Fabric Business
1. Utility and Others
• To fit the variable speed AC drive on supply/ Return air fan of humidification plant, Cooling fan motor in stenter and hood fan motor of dyeing and finishing to save 1400 units per day.
• Replacement of aluminium fan of supply and return air fan in Humidification Plant with FRP fan to save 15% on total power consumed at present in humidification plant.
• Replacement of plant lighting with High bay lighting in finishing and rope dyeing department to save 142 units per day.
• To install high pressure motor operated fogging system
ANNUAL REPORT20 1819
5958
against air operated fogging system in blow room phase 1 and 2. This will save power units and give fast paybacks.
• Ceramic insulation on dry can cylinders which save steam and pay back is less than one year.
C. Technological up gradation and absorption during Financial Year 2018-19
I. New Products
1. Yarn Business
1.1. PV Yarn Business
• Initiated developments with new generation Perma PSF intertwine permanently with Nano Zinc particles responsible for anti-bacterial, odor reduction and UV protection. The functional properties associated with the fiber are permanent and suitable for protective clothing for children wear, sportswear and medical textile materials.
• Development of Nylon 100% yarn for sarees and dress materials for Surat market to replace expensive Silk yarns. Nylon spun yarns have similar properties that of Silk like same dyeing process, lustrous, rich and elegant look.
• In present scenario sustainability is a concept towards environmental protection prevailing worldwide, it provides opportunity to create difference socially and economically through idea of reduce, reuse and recycle. Famous brands like Levis, C&A, M&S are working towards sustainability throughout their manufacturing including use of sustainable fibers. In order to cater the requirement of sustainable products in market we recently have strategically tied up with Eastman USA for Acetate staple fiber with full traceability from tree to fiber, Naia™ is made with the highest safety, social, and environmental standards. Eastman’s closed-loop production process for Naia™ allows recycling and reuse of safe solvents and water, resulting in a yarn with a low environmental impact.
• In order to add more sustainable products in our basket such as Banana, Aleovera, recycled cotton etc. alliance made with Anandi Enterprises, Tirupur.
• Anionic Viscose which having the dyeing properties as per acrylic so suitable for mixing with acrylic to get the same shade in single dye bath. Development has been carried out at Banswara unit.
• PBT Fiber having new polymer which have soft touch and stretch properties. It is dyed at low temperatures in disperse dyes. Developments have been carried out at Banswara unit and Fiber shared with Kharigram unit for development in dyed.
• Introduced Lurex Metallic fibre, coffee charcoal in towel segment.
• Silverbac PSF containing pure silver particles for hygienic textile application introduced in Bathmat segment.
• Developed the quality negative/positive slub in PC 48/52 and commercialized.
• Launched the new season based booklets “FREEQUENCY” for winter and “RENEU” for summer.
• Developed the Tri-folders for Knitting, Home Linen and Woven for easy carrying by export team.
• Working with new fibers like Perma Zn (Anti-bacterial) and NAIA (Acetate base with Biodegradable).
• Upgraded the LNJ slub attachments at NPD Pilot Plant as well as spinning production to improve the quality of the LNJ slub qualities.
• Successfully running the TWINKLE STAR quality with different colours of metallic fibers.
• Showcase the home furnishing qualities in Heim textile Germany with collaboration with BSL Team.
• Introduced the linen look quality in 100% polyester for home linen and getting good orders from exports as well as from domestic market.
• Developed the quality DOSE with 100% dope dyed fibers which results in consistency in the shades and quick deliveries.
• Developed different type slubs grindle product (spunand filaments) such as spiral slub with Poly /Flex, Vis/Flex, nepy slub with the saleable waste.
• Developed hairy yarns to use course den up to 14D for export and domestic market with recycled polyester fiber.
• Developed micro modal samples for sewing threads, which is approved by customer and got bulk orders.
• 51 mm Viscose fiber is successfully and continuously working in 4/12s, 4/16s and 2/16s.
• Developed samples with micro-denier Polyester fiber for 40s PV.
• Developed new product of Elite compact yarns 3/14, 3/13, 3/12s tencel.
1.2. Melange Yarn Business
• Manufacturing of functional yarn such as Bamboo charcoal, Seacell, Smartcell etc and being supplied to leading International Brands.
• Introduced fancy TFO Grindle product with fancy effect.
• Developed a vast range of sustainable products with recycled cotton, recycled polyester, organic cotton , BCI cotton and fair trade cotton, Eri Silk (Ahimsa silk) with cotton blend, organic wool, European Hemp, European Flex, Lenzing Ecovero and Birla Livaeco which are ultimately going to be in demand by all leading brands in the world in the future.
• Introducing yarn on yarn product for creating fancy effect in yarn.
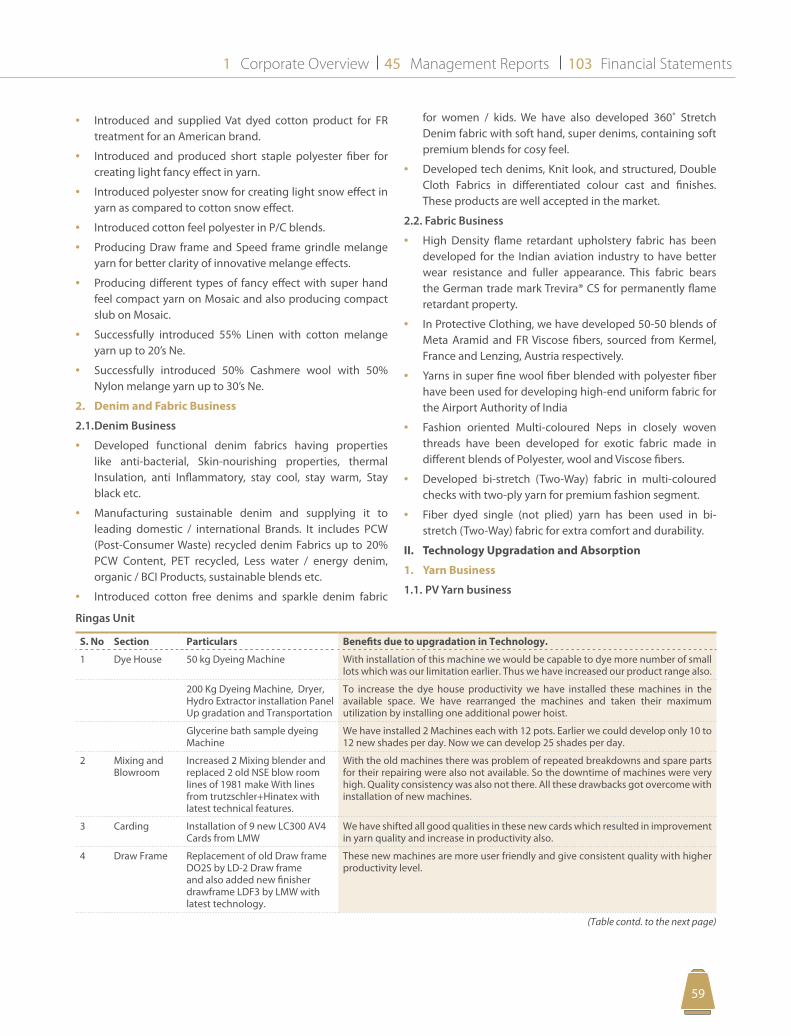
Corporate Overview Management Reports Financial Statements1 45 103
5958
• Introduced and supplied Vat dyed cotton product for FR treatment for an American brand.
• Introduced and produced short staple polyester fiber for creating light fancy effect in yarn.
• Introduced polyester snow for creating light snow effect in yarn as compared to cotton snow effect.
• Introduced cotton feel polyester in P/C blends.
• Producing Draw frame and Speed frame grindle melange yarn for better clarity of innovative melange effects.
• Producing different types of fancy effect with super hand feel compact yarn on Mosaic and also producing compact slub on Mosaic.
• Successfully introduced 55% Linen with cotton melange yarn up to 20’s Ne.
• Successfully introduced 50% Cashmere wool with 50% Nylon melange yarn up to 30’s Ne.
2. Denim and Fabric Business
2.1. Denim Business
• Developed functional denim fabrics having properties like anti-bacterial, Skin-nourishing properties, thermal Insulation, anti Inflammatory, stay cool, stay warm, Stay black etc.
• Manufacturing sustainable denim and supplying it to leading domestic / international Brands. It includes PCW (Post-Consumer Waste) recycled denim Fabrics up to 20% PCW Content, PET recycled, Less water / energy denim, organic / BCI Products, sustainable blends etc.
• Introduced cotton free denims and sparkle denim fabric
for women / kids. We have also developed 360˚ Stretch Denim fabric with soft hand, super denims, containing soft premium blends for cosy feel.
• Developed tech denims, Knit look, and structured, Double Cloth Fabrics in differentiated colour cast and finishes. These products are well accepted in the market.
2.2. Fabric Business
• High Density flame retardant upholstery fabric has been developed for the Indian aviation industry to have better wear resistance and fuller appearance. This fabric bears the German trade mark Trevira® CS for permanently flame retardant property.
• In Protective Clothing, we have developed 50-50 blends of Meta Aramid and FR Viscose fibers, sourced from Kermel, France and Lenzing, Austria respectively.
• Yarns in super fine wool fiber blended with polyester fiber have been used for developing high-end uniform fabric for the Airport Authority of India
• Fashion oriented Multi-coloured Neps in closely woven threads have been developed for exotic fabric made in different blends of Polyester, wool and Viscose fibers.
• Developed bi-stretch (Two-Way) fabric in multi-coloured checks with two-ply yarn for premium fashion segment.
• Fiber dyed single (not plied) yarn has been used in bi-stretch (Two-Way) fabric for extra comfort and durability.
II. Technology Upgradation and Absorption
1. Yarn Business
1.1. PV Yarn business
Ringas Unit
S. No Section Particulars Benefits due to upgradation in Technology.
1 Dye House 50 kg Dyeing Machine With installation of this machine we would be capable to dye more number of small lots which was our limitation earlier. Thus we have increased our product range also.
200 Kg Dyeing Machine, Dryer, Hydro Extractor installation Panel Up gradation and Transportation
To increase the dye house productivity we have installed these machines in the available space. We have rearranged the machines and taken their maximum utilization by installing one additional power hoist.
Glycerine bath sample dyeing Machine
We have installed 2 Machines each with 12 pots. Earlier we could develop only 10 to 12 new shades per day. Now we can develop 25 shades per day.
2 Mixing and Blowroom
Increased 2 Mixing blender and replaced 2 old NSE blow room lines of 1981 make With lines from trutzschler+Hinatex with latest technical features.
With the old machines there was problem of repeated breakdowns and spare parts for their repairing were also not available. So the downtime of machines were very high. Quality consistency was also not there. All these drawbacks got overcome with installation of new machines.
3 Carding Installation of 9 new LC300 AV4 Cards from LMW
We have shifted all good qualities in these new cards which resulted in improvement in yarn quality and increase in productivity also.
4 Draw Frame Replacement of old Draw frame DO2S by LD-2 Draw frame and also added new finisher drawframe LDF3 by LMW with latest technology.
These new machines are more user friendly and give consistent quality with higher productivity level.
(Table contd. to the next page)
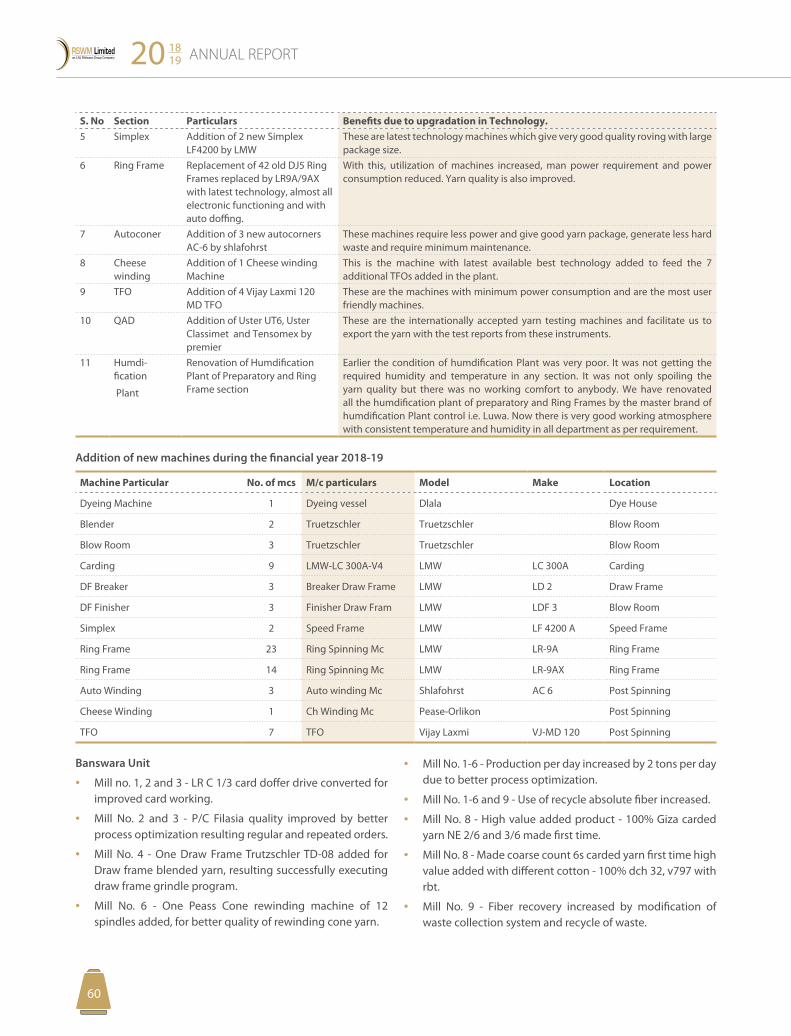
ANNUAL REPORT20 1819
6160
Addition of new machines during the financial year 2018-19
Machine Particular No. of mcs M/c particulars Model Make Location
Dyeing Machine 1 Dyeing vessel Dlala Dye House
Blender 2 Truetzschler Truetzschler Blow Room
Blow Room 3 Truetzschler Truetzschler Blow Room
Carding 9 LMW-LC 300A-V4 LMW LC 300A Carding
DF Breaker 3 Breaker Draw Frame LMW LD 2 Draw Frame
DF Finisher 3 Finisher Draw Fram LMW LDF 3 Blow Room
Simplex 2 Speed Frame LMW LF 4200 A Speed Frame
Ring Frame 23 Ring Spinning Mc LMW LR-9A Ring Frame
Ring Frame 14 Ring Spinning Mc LMW LR-9AX Ring Frame
Auto Winding 3 Auto winding Mc Shlafohrst AC 6 Post Spinning
Cheese Winding 1 Ch Winding Mc Pease-Orlikon Post Spinning
TFO 7 TFO Vijay Laxmi VJ-MD 120 Post Spinning
Banswara Unit
• Mill no. 1, 2 and 3 - LR C 1/3 card doffer drive converted for improved card working.
• Mill No. 2 and 3 - P/C Filasia quality improved by better process optimization resulting regular and repeated orders.
• Mill No. 4 - One Draw Frame Trutzschler TD-08 added for Draw frame blended yarn, resulting successfully executing draw frame grindle program.
• Mill No. 6 - One Peass Cone rewinding machine of 12 spindles added, for better quality of rewinding cone yarn.
• Mill No. 1-6 - Production per day increased by 2 tons per day due to better process optimization.
• Mill No. 1-6 and 9 - Use of recycle absolute fiber increased.
• Mill No. 8 - High value added product - 100% Giza carded yarn NE 2/6 and 3/6 made first time.
• Mill No. 8 - Made coarse count 6s carded yarn first time high value added with different cotton - 100% dch 32, v797 with rbt.
• Mill No. 9 - Fiber recovery increased by modification of waste collection system and recycle of waste.
S. No Section Particulars Benefits due to upgradation in Technology.5 Simplex Addition of 2 new Simplex
LF4200 by LMWThese are latest technology machines which give very good quality roving with large package size.
6 Ring Frame Replacement of 42 old DJ5 Ring Frames replaced by LR9A/9AX with latest technology, almost all electronic functioning and with auto doffing.
With this, utilization of machines increased, man power requirement and power consumption reduced. Yarn quality is also improved.
7 Autoconer Addition of 3 new autocorners AC-6 by shlafohrst
These machines require less power and give good yarn package, generate less hard waste and require minimum maintenance.
8 Cheese winding
Addition of 1 Cheese winding Machine
This is the machine with latest available best technology added to feed the 7 additional TFOs added in the plant.
9 TFO Addition of 4 Vijay Laxmi 120 MD TFO
These are the machines with minimum power consumption and are the most user friendly machines.
10 QAD Addition of Uster UT6, Uster Classimet and Tensomex by premier
These are the internationally accepted yarn testing machines and facilitate us to export the yarn with the test reports from these instruments.
11 Humdi-fication
Plant
Renovation of Humdification Plant of Preparatory and Ring Frame section
Earlier the condition of humdification Plant was very poor. It was not getting the required humidity and temperature in any section. It was not only spoiling the yarn quality but there was no working comfort to anybody. We have renovated all the humdification plant of preparatory and Ring Frames by the master brand of humdification Plant control i.e. Luwa. Now there is very good working atmosphere with consistent temperature and humidity in all department as per requirement.
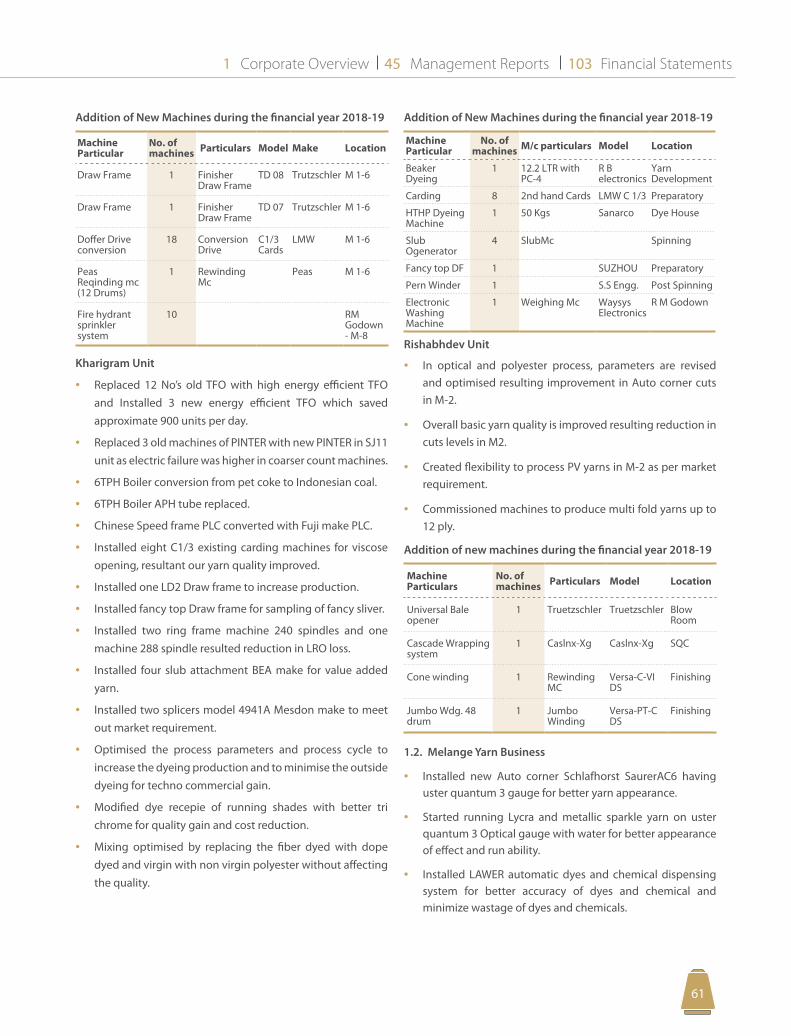
Corporate Overview Management Reports Financial Statements1 45 103
6160
Addition of New Machines during the financial year 2018-19
Machine Particular
No. of machines Particulars Model Make Location
Draw Frame 1 Finisher Draw Frame
TD 08 Trutzschler M 1-6
Draw Frame 1 Finisher Draw Frame
TD 07 Trutzschler M 1-6
Doffer Drive conversion
18 Conversion Drive
C1/3 Cards
LMW M 1-6
Peas Reqinding mc (12 Drums)
1 Rewinding Mc
Peas M 1-6
Fire hydrant sprinkler system
10 RM Godown - M-8
Kharigram Unit
• Replaced 12 No’s old TFO with high energy efficient TFO and Installed 3 new energy efficient TFO which saved approximate 900 units per day.
• Replaced 3 old machines of PINTER with new PINTER in SJ11 unit as electric failure was higher in coarser count machines.
• 6TPH Boiler conversion from pet coke to Indonesian coal.
• 6TPH Boiler APH tube replaced.
• Chinese Speed frame PLC converted with Fuji make PLC.
• Installed eight C1/3 existing carding machines for viscose opening, resultant our yarn quality improved.
• Installed one LD2 Draw frame to increase production.
• Installed fancy top Draw frame for sampling of fancy sliver.
• Installed two ring frame machine 240 spindles and one machine 288 spindle resulted reduction in LRO loss.
• Installed four slub attachment BEA make for value added yarn.
• Installed two splicers model 4941A Mesdon make to meet out market requirement.
• Optimised the process parameters and process cycle to increase the dyeing production and to minimise the outside dyeing for techno commercial gain.
• Modified dye recepie of running shades with better tri chrome for quality gain and cost reduction.
• Mixing optimised by replacing the fiber dyed with dope dyed and virgin with non virgin polyester without affecting the quality.
Addition of New Machines during the financial year 2018-19
Machine Particular
No. of machines M/c particulars Model Location
Beaker Dyeing
1 12.2 LTR with PC-4
R B electronics
Yarn Development
Carding 8 2nd hand Cards LMW C 1/3 Preparatory
HTHP Dyeing Machine
1 50 Kgs Sanarco Dye House
Slub Ogenerator
4 SlubMc Spinning
Fancy top DF 1 SUZHOU Preparatory
Pern Winder 1 S.S Engg. Post Spinning
Electronic Washing Machine
1 Weighing Mc Waysys Electronics
R M Godown
Rishabhdev Unit
• In optical and polyester process, parameters are revised and optimised resulting improvement in Auto corner cuts in M-2.
• Overall basic yarn quality is improved resulting reduction in cuts levels in M2.
• Created flexibility to process PV yarns in M-2 as per market requirement.
• Commissioned machines to produce multi fold yarns up to 12 ply.
Addition of new machines during the financial year 2018-19
Machine Particulars
No. of machines Particulars Model Location
Universal Bale opener
1 Truetzschler Truetzschler Blow Room
Cascade Wrapping system
1 Caslnx-Xg Caslnx-Xg SQC
Cone winding 1 Rewinding MC
Versa-C-VI DS
Finishing
Jumbo Wdg. 48 drum
1 Jumbo Winding
Versa-PT-C DS
Finishing
1.2. Melange Yarn Business
• Installed new Auto corner Schlafhorst SaurerAC6 having uster quantum 3 gauge for better yarn appearance.
• Started running Lycra and metallic sparkle yarn on uster quantum 3 Optical gauge with water for better appearance of effect and run ability.
• Installed LAWER automatic dyes and chemical dispensing system for better accuracy of dyes and chemical and minimize wastage of dyes and chemicals.
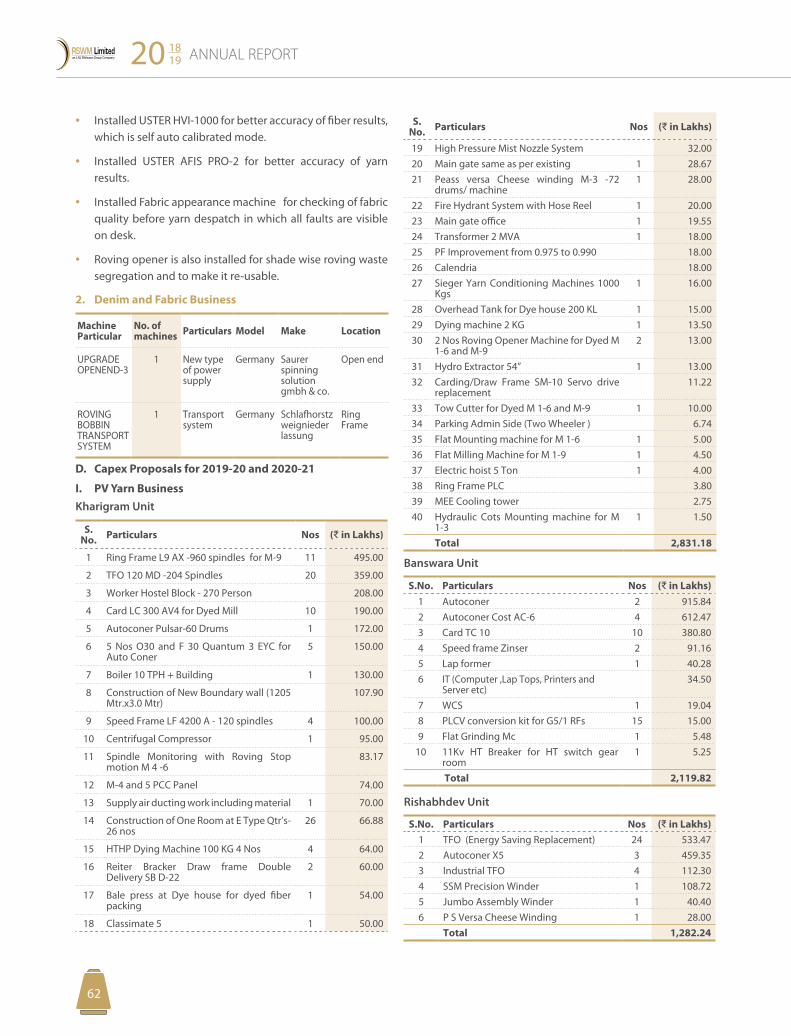
ANNUAL REPORT20 1819
6362
• Installed USTER HVI-1000 for better accuracy of fiber results, which is self auto calibrated mode.
• Installed USTER AFIS PRO-2 for better accuracy of yarn results.
• Installed Fabric appearance machine for checking of fabric quality before yarn despatch in which all faults are visible on desk.
• Roving opener is also installed for shade wise roving waste segregation and to make it re-usable.
2. Denim and Fabric Business
Machine Particular
No. of machines Particulars Model Make Location
UPGRADE OPENEND-3
1 New type of power supply
Germany Saurer spinning solution gmbh & co.
Open end
ROVING BOBBIN TRANSPORT SYSTEM
1 Transport system
Germany Schlafhorstz weignieder lassung
Ring Frame
D. Capex Proposals for 2019-20 and 2020-21
I. PV Yarn BusinessKharigram Unit
S. No. Particulars Nos (D in Lakhs)
1 Ring Frame L9 AX -960 spindles for M-9 11 495.00
2 TFO 120 MD -204 Spindles 20 359.00
3 Worker Hostel Block - 270 Person 208.00
4 Card LC 300 AV4 for Dyed Mill 10 190.00
5 Autoconer Pulsar-60 Drums 1 172.00
6 5 Nos O30 and F 30 Quantum 3 EYC for Auto Coner
5 150.00
7 Boiler 10 TPH + Building 1 130.00
8 Construction of New Boundary wall (1205 Mtr.x3.0 Mtr)
107.90
9 Speed Frame LF 4200 A - 120 spindles 4 100.00
10 Centrifugal Compressor 1 95.00
11 Spindle Monitoring with Roving Stop motion M 4 -6
83.17
12 M-4 and 5 PCC Panel 74.00
13 Supply air ducting work including material 1 70.00
14 Construction of One Room at E Type Qtr’s- 26 nos
26 66.88
15 HTHP Dying Machine 100 KG 4 Nos 4 64.00
16 Reiter Bracker Draw frame Double Delivery SB D-22
2 60.00
17 Bale press at Dye house for dyed fiber packing
1 54.00
18 Classimate 5 1 50.00
S. No. Particulars Nos (D in Lakhs)
19 High Pressure Mist Nozzle System 32.0020 Main gate same as per existing 1 28.6721 Peass versa Cheese winding M-3 -72
drums/ machine1 28.00
22 Fire Hydrant System with Hose Reel 1 20.0023 Main gate office 1 19.5524 Transformer 2 MVA 1 18.0025 PF Improvement from 0.975 to 0.990 18.0026 Calendria 18.0027 Sieger Yarn Conditioning Machines 1000
Kgs1 16.00
28 Overhead Tank for Dye house 200 KL 1 15.0029 Dying machine 2 KG 1 13.5030 2 Nos Roving Opener Machine for Dyed M
1-6 and M-92 13.00
31 Hydro Extractor 54” 1 13.0032 Carding/Draw Frame SM-10 Servo drive
replacement 11.22
33 Tow Cutter for Dyed M 1-6 and M-9 1 10.0034 Parking Admin Side (Two Wheeler ) 6.7435 Flat Mounting machine for M 1-6 1 5.0036 Flat Milling Machine for M 1-9 1 4.5037 Electric hoist 5 Ton 1 4.0038 Ring Frame PLC 3.8039 MEE Cooling tower 2.7540 Hydraulic Cots Mounting machine for M
1-31 1.50
Total 2,831.18
Banswara Unit
S.No. Particulars Nos (D in Lakhs)1 Autoconer 2 915.842 Autoconer Cost AC-6 4 612.473 Card TC 10 10 380.804 Speed frame Zinser 2 91.165 Lap former 1 40.286 IT (Computer ,Lap Tops, Printers and
Server etc)34.50
7 WCS 1 19.048 PLCV conversion kit for G5/1 RFs 15 15.009 Flat Grinding Mc 1 5.48
10 11Kv HT Breaker for HT switch gear room
1 5.25
Total 2,119.82
Rishabhdev Unit
S.No. Particulars Nos (D in Lakhs)1 TFO (Energy Saving Replacement) 24 533.472 Autoconer X5 3 459.353 Industrial TFO 4 112.304 SSM Precision Winder 1 108.725 Jumbo Assembly Winder 1 40.406 P S Versa Cheese Winding 1 28.00 Total 1,282.24
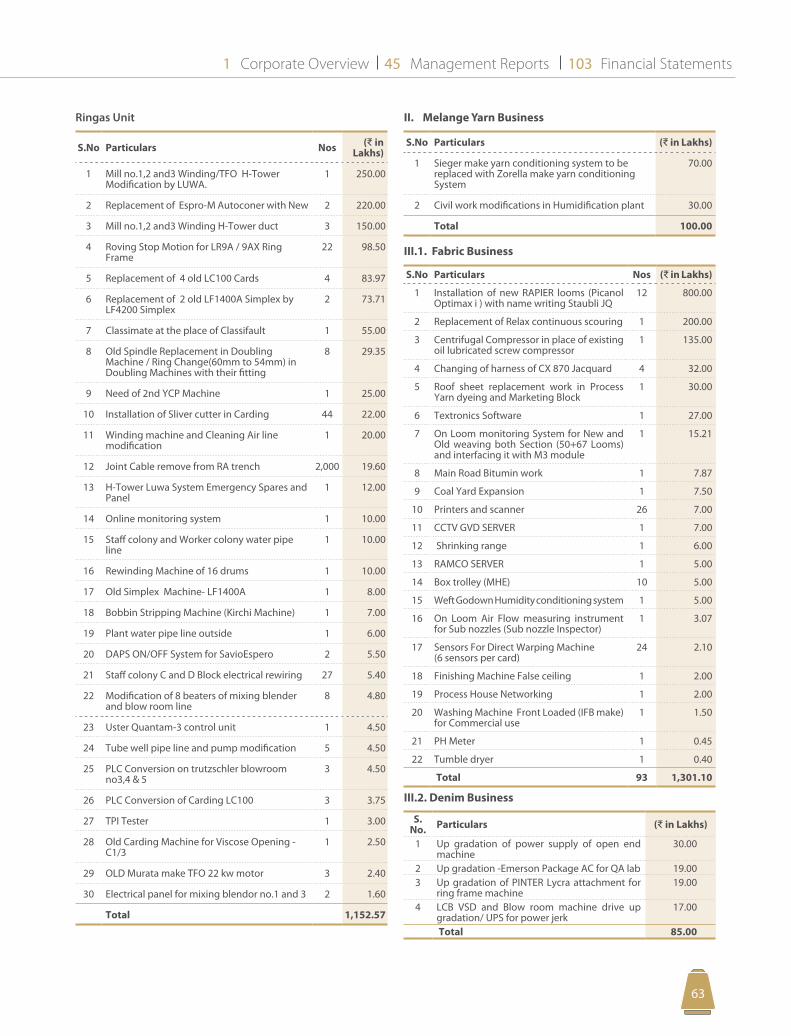
Corporate Overview Management Reports Financial Statements1 45 103
6362
Ringas Unit
S.No Particulars Nos (D in Lakhs)
1 Mill no.1,2 and3 Winding/TFO H-Tower Modification by LUWA.
1 250.00
2 Replacement of Espro-M Autoconer with New 2 220.00
3 Mill no.1,2 and3 Winding H-Tower duct 3 150.00
4 Roving Stop Motion for LR9A / 9AX Ring Frame
22 98.50
5 Replacement of 4 old LC100 Cards 4 83.97
6 Replacement of 2 old LF1400A Simplex by LF4200 Simplex
2 73.71
7 Classimate at the place of Classifault 1 55.00
8 Old Spindle Replacement in Doubling Machine / Ring Change(60mm to 54mm) in Doubling Machines with their fitting
8 29.35
9 Need of 2nd YCP Machine 1 25.00
10 Installation of Sliver cutter in Carding 44 22.00
11 Winding machine and Cleaning Air line modification
1 20.00
12 Joint Cable remove from RA trench 2,000 19.60
13 H-Tower Luwa System Emergency Spares and Panel
1 12.00
14 Online monitoring system 1 10.00
15 Staff colony and Worker colony water pipe line
1 10.00
16 Rewinding Machine of 16 drums 1 10.00
17 Old Simplex Machine- LF1400A 1 8.00
18 Bobbin Stripping Machine (Kirchi Machine) 1 7.00
19 Plant water pipe line outside 1 6.00
20 DAPS ON/OFF System for SavioEspero 2 5.50
21 Staff colony C and D Block electrical rewiring 27 5.40
22 Modification of 8 beaters of mixing blender and blow room line
8 4.80
23 Uster Quantam-3 control unit 1 4.50
24 Tube well pipe line and pump modification 5 4.50
25 PLC Conversion on trutzschler blowroom no3,4 & 5
3 4.50
26 PLC Conversion of Carding LC100 3 3.75
27 TPI Tester 1 3.00
28 Old Carding Machine for Viscose Opening - C1/3
1 2.50
29 OLD Murata make TFO 22 kw motor 3 2.40
30 Electrical panel for mixing blendor no.1 and 3 2 1.60
Total 1,152.57
II. Melange Yarn Business
S.No Particulars (D in Lakhs)
1 Sieger make yarn conditioning system to be replaced with Zorella make yarn conditioning System
70.00
2 Civil work modifications in Humidification plant 30.00
Total 100.00
III.1. Fabric Business
S.No Particulars Nos (D in Lakhs)
1 Installation of new RAPIER looms (Picanol Optimax i ) with name writing Staubli JQ
12 800.00
2 Replacement of Relax continuous scouring 1 200.00
3 Centrifugal Compressor in place of existing oil lubricated screw compressor
1 135.00
4 Changing of harness of CX 870 Jacquard 4 32.00
5 Roof sheet replacement work in Process Yarn dyeing and Marketing Block
1 30.00
6 Textronics Software 1 27.00
7 On Loom monitoring System for New and Old weaving both Section (50+67 Looms) and interfacing it with M3 module
1 15.21
8 Main Road Bitumin work 1 7.87
9 Coal Yard Expansion 1 7.50
10 Printers and scanner 26 7.00
11 CCTV GVD SERVER 1 7.00
12 Shrinking range 1 6.00
13 RAMCO SERVER 1 5.00
14 Box trolley (MHE) 10 5.00
15 Weft Godown Humidity conditioning system 1 5.00
16 On Loom Air Flow measuring instrument for Sub nozzles (Sub nozzle Inspector)
1 3.07
17 Sensors For Direct Warping Machine (6 sensors per card)
24 2.10
18 Finishing Machine False ceiling 1 2.00
19 Process House Networking 1 2.00
20 Washing Machine Front Loaded (IFB make) for Commercial use
1 1.50
21 PH Meter 1 0.45
22 Tumble dryer 1 0.40
Total 93 1,301.10
III.2. Denim Business
S. No. Particulars (D in Lakhs)
1 Up gradation of power supply of open end machine
30.00
2 Up gradation -Emerson Package AC for QA lab 19.003 Up gradation of PINTER Lycra attachment for
ring frame machine19.00
4 LCB VSD and Blow room machine drive up gradation/ UPS for power jerk
17.00
Total 85.00
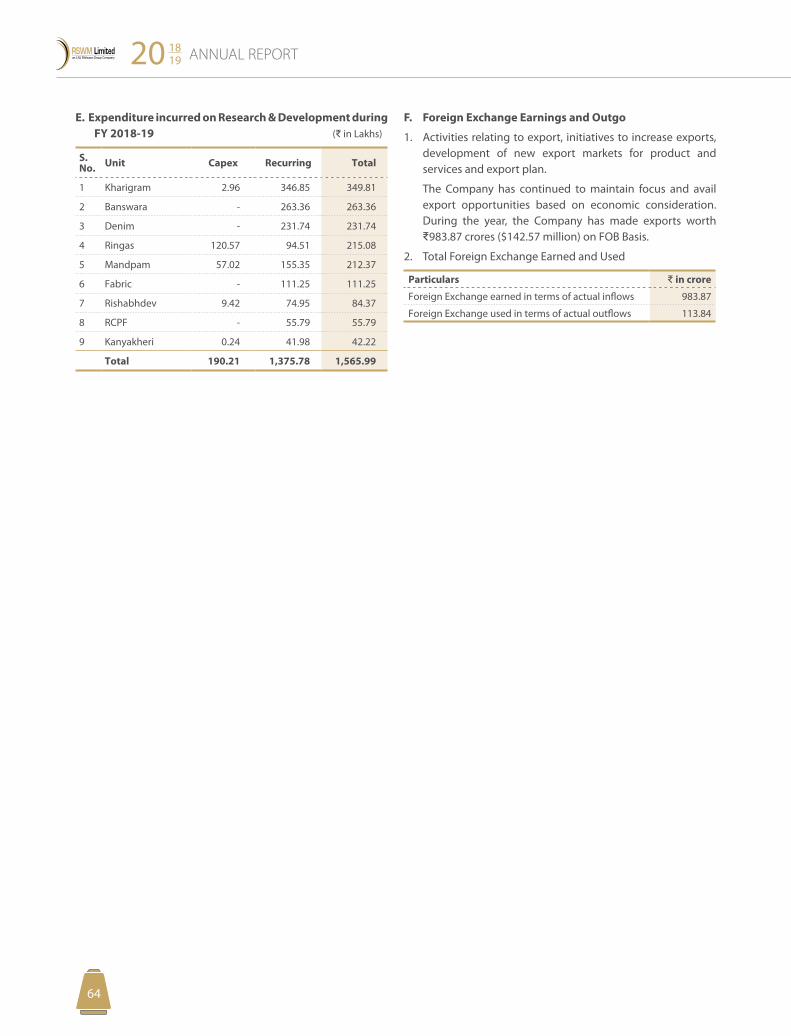
ANNUAL REPORT20 1819
6564
E. Expenditure incurred on Research & Development during FY 2018-19 (D in Lakhs)
S. No. Unit Capex Recurring Total
1 Kharigram 2.96 346.85 349.81
2 Banswara - 263.36 263.36
3 Denim - 231.74 231.74
4 Ringas 120.57 94.51 215.08
5 Mandpam 57.02 155.35 212.37
6 Fabric - 111.25 111.25
7 Rishabhdev 9.42 74.95 84.37
8 RCPF - 55.79 55.79
9 Kanyakheri 0.24 41.98 42.22
Total 190.21 1,375.78 1,565.99
F. Foreign Exchange Earnings and Outgo
1. Activities relating to export, initiatives to increase exports, development of new export markets for product and services and export plan.
The Company has continued to maintain focus and avail export opportunities based on economic consideration. During the year, the Company has made exports worth D983.87 crores ($142.57 million) on FOB Basis.
2. Total Foreign Exchange Earned and Used
Particulars D in crore
Foreign Exchange earned in terms of actual inflows 983.87
Foreign Exchange used in terms of actual outflows 113.84
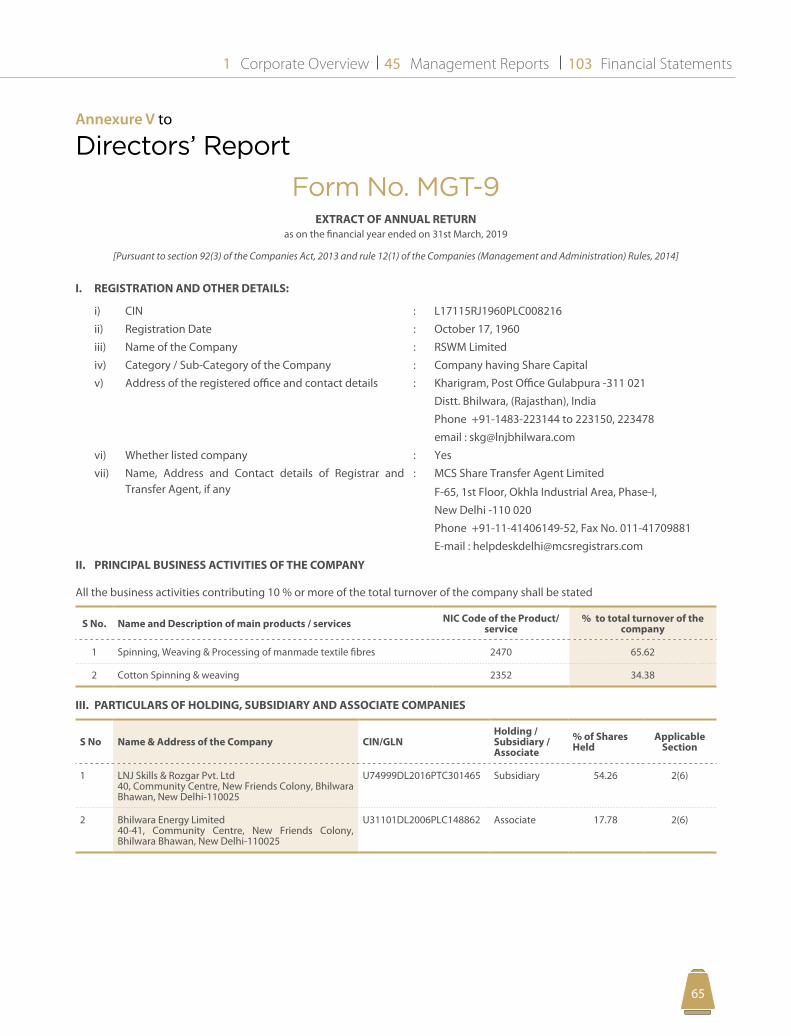
Corporate Overview Management Reports Financial Statements1 45 103
6564
Annexure V to
Directors’ Report
Form No. MGT-9EXTRACT OF ANNUAL RETURN
as on the financial year ended on 31st March, 2019
[Pursuant to section 92(3) of the Companies Act, 2013 and rule 12(1) of the Companies (Management and Administration) Rules, 2014]
I. REGISTRATION AND OTHER DETAILS:
i) CIN : L17115RJ1960PLC008216
ii) Registration Date : October 17, 1960
iii) Name of the Company : RSWM Limited
iv) Category / Sub-Category of the Company : Company having Share Capital
v) Address of the registered office and contact details : Kharigram, Post Office Gulabpura -311 021
Distt. Bhilwara, (Rajasthan), India
Phone +91-1483-223144 to 223150, 223478
email : [email protected]
vi) Whether listed company : Yes
vii) Name, Address and Contact details of Registrar and Transfer Agent, if any
: MCS Share Transfer Agent Limited
F-65, 1st Floor, Okhla Industrial Area, Phase-I,
New Delhi -110 020
Phone +91-11-41406149-52, Fax No. 011-41709881
E-mail : [email protected]
II. PRINCIPAL BUSINESS ACTIVITIES OF THE COMPANY
All the business activities contributing 10 % or more of the total turnover of the company shall be stated
S No. Name and Description of main products / services NIC Code of the Product/service
% to total turnover of the company
1 Spinning, Weaving & Processing of manmade textile fibres 2470 65.62
2 Cotton Spinning & weaving 2352 34.38
III. PARTICULARS OF HOLDING, SUBSIDIARY AND ASSOCIATE COMPANIES
S No Name & Address of the Company CIN/GLNHolding / Subsidiary / Associate
% of Shares Held
Applicable Section
1 LNJ Skills & Rozgar Pvt. Ltd40, Community Centre, New Friends Colony, Bhilwara Bhawan, New Delhi-110025
U74999DL2016PTC301465 Subsidiary 54.26 2(6)
2 Bhilwara Energy Limited40-41, Community Centre, New Friends Colony, Bhilwara Bhawan, New Delhi-110025
U31101DL2006PLC148862 Associate 17.78 2(6)
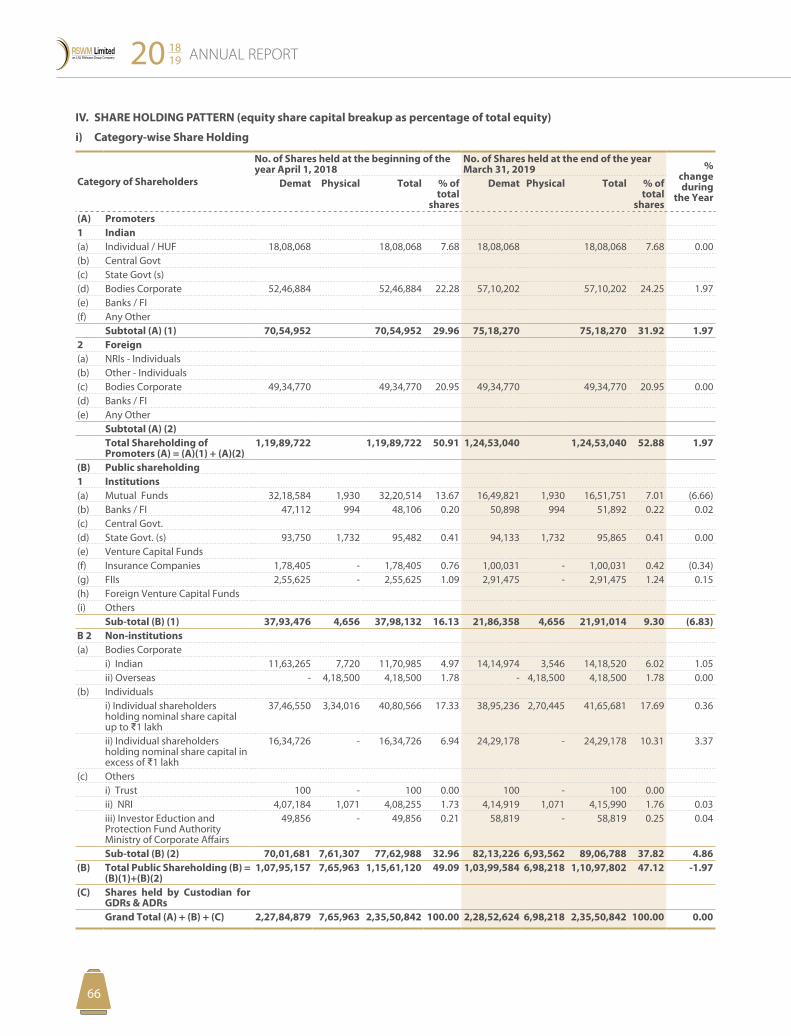
ANNUAL REPORT20 1819
6766
IV. SHARE HOLDING PATTERN (equity share capital breakup as percentage of total equity)
i) Category-wise Share Holding
Category of Shareholders
No. of Shares held at the beginning of the year April 1, 2018
No. of Shares held at the end of the year March 31, 2019 %
change during
the YearDemat Physical Total % of
total shares
Demat Physical Total % of total
shares(A) Promoters 1 Indian (a) Individual / HUF 18,08,068 18,08,068 7.68 18,08,068 18,08,068 7.68 0.00(b) Central Govt(c) State Govt (s)(d) Bodies Corporate 52,46,884 52,46,884 22.28 57,10,202 57,10,202 24.25 1.97(e) Banks / FI(f) Any Other Subtotal (A) (1) 70,54,952 70,54,952 29.96 75,18,270 75,18,270 31.92 1.972 Foreign(a) NRIs - Individuals(b) Other - Individuals(c) Bodies Corporate 49,34,770 49,34,770 20.95 49,34,770 49,34,770 20.95 0.00(d) Banks / FI(e) Any Other Subtotal (A) (2) Total Shareholding of
Promoters (A) = (A)(1) + (A)(2)1,19,89,722 1,19,89,722 50.91 1,24,53,040 1,24,53,040 52.88 1.97
(B) Public shareholding1 Institutions(a) Mutual Funds 32,18,584 1,930 32,20,514 13.67 16,49,821 1,930 16,51,751 7.01 (6.66)(b) Banks / FI 47,112 994 48,106 0.20 50,898 994 51,892 0.22 0.02(c) Central Govt.(d) State Govt. (s) 93,750 1,732 95,482 0.41 94,133 1,732 95,865 0.41 0.00(e) Venture Capital Funds (f) Insurance Companies 1,78,405 - 1,78,405 0.76 1,00,031 - 1,00,031 0.42 (0.34)(g) FIIs 2,55,625 - 2,55,625 1.09 2,91,475 - 2,91,475 1.24 0.15(h) Foreign Venture Capital Funds(i) Others
Sub-total (B) (1) 37,93,476 4,656 37,98,132 16.13 21,86,358 4,656 21,91,014 9.30 (6.83)B 2 Non-institutions(a) Bodies Corporate
i) Indian 11,63,265 7,720 11,70,985 4.97 14,14,974 3,546 14,18,520 6.02 1.05ii) Overseas - 4,18,500 4,18,500 1.78 - 4,18,500 4,18,500 1.78 0.00
(b) Individualsi) Individual shareholders holding nominal share capital up to D1 lakh
37,46,550 3,34,016 40,80,566 17.33 38,95,236 2,70,445 41,65,681 17.69 0.36
ii) Individual shareholders holding nominal share capital in excess of D1 lakh
16,34,726 - 16,34,726 6.94 24,29,178 - 24,29,178 10.31 3.37
(c) Othersi) Trust 100 - 100 0.00 100 - 100 0.00ii) NRI 4,07,184 1,071 4,08,255 1.73 4,14,919 1,071 4,15,990 1.76 0.03iii) Investor Eduction and Protection Fund Authority Ministry of Corporate Affairs
49,856 - 49,856 0.21 58,819 - 58,819 0.25 0.04
Sub-total (B) (2) 70,01,681 7,61,307 77,62,988 32.96 82,13,226 6,93,562 89,06,788 37.82 4.86(B) Total Public Shareholding (B) =
(B)(1)+(B)(2)1,07,95,157 7,65,963 1,15,61,120 49.09 1,03,99,584 6,98,218 1,10,97,802 47.12 -1.97
(C) Shares held by Custodian for GDRs & ADRsGrand Total (A) + (B) + (C) 2,27,84,879 7,65,963 2,35,50,842 100.00 2,28,52,624 6,98,218 2,35,50,842 100.00 0.00
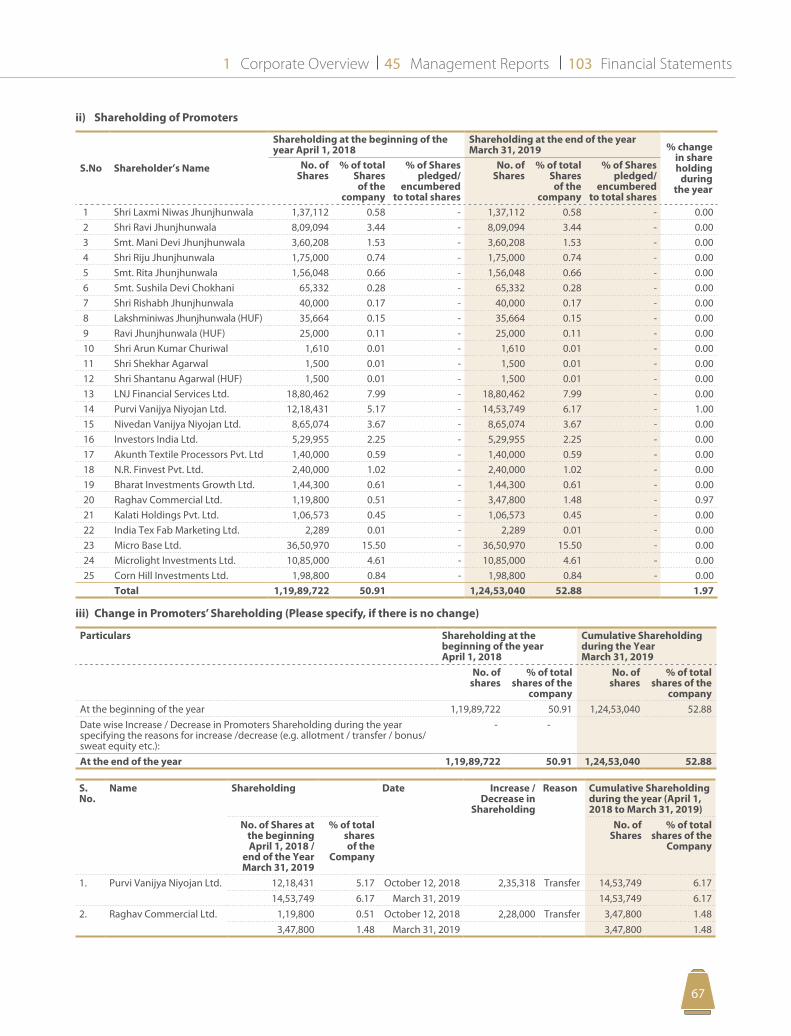
Corporate Overview Management Reports Financial Statements1 45 103
6766
ii) Shareholding of Promoters
S.No Shareholder’s Name
Shareholding at the beginning of the year April 1, 2018
Shareholding at the end of the year March 31, 2019 % change
in share holding
during the year
No. of Shares
% of total Shares of the
company
% of Shares pledged/
encumbered to total shares
No. of Shares
% of total Shares of the
company
% of Shares pledged/
encumbered to total shares
1 Shri Laxmi Niwas Jhunjhunwala 1,37,112 0.58 - 1,37,112 0.58 - 0.002 Shri Ravi Jhunjhunwala 8,09,094 3.44 - 8,09,094 3.44 - 0.003 Smt. Mani Devi Jhunjhunwala 3,60,208 1.53 - 3,60,208 1.53 - 0.004 Shri Riju Jhunjhunwala 1,75,000 0.74 - 1,75,000 0.74 - 0.005 Smt. Rita Jhunjhunwala 1,56,048 0.66 - 1,56,048 0.66 - 0.006 Smt. Sushila Devi Chokhani 65,332 0.28 - 65,332 0.28 - 0.007 Shri Rishabh Jhunjhunwala 40,000 0.17 - 40,000 0.17 - 0.008 Lakshminiwas Jhunjhunwala (HUF) 35,664 0.15 - 35,664 0.15 - 0.009 Ravi Jhunjhunwala (HUF) 25,000 0.11 - 25,000 0.11 - 0.0010 Shri Arun Kumar Churiwal 1,610 0.01 - 1,610 0.01 - 0.0011 Shri Shekhar Agarwal 1,500 0.01 - 1,500 0.01 - 0.0012 Shri Shantanu Agarwal (HUF) 1,500 0.01 - 1,500 0.01 - 0.0013 LNJ Financial Services Ltd. 18,80,462 7.99 - 18,80,462 7.99 - 0.0014 Purvi Vanijya Niyojan Ltd. 12,18,431 5.17 - 14,53,749 6.17 - 1.0015 Nivedan Vanijya Niyojan Ltd. 8,65,074 3.67 - 8,65,074 3.67 - 0.0016 Investors India Ltd. 5,29,955 2.25 - 5,29,955 2.25 - 0.0017 Akunth Textile Processors Pvt. Ltd 1,40,000 0.59 - 1,40,000 0.59 - 0.0018 N.R. Finvest Pvt. Ltd. 2,40,000 1.02 - 2,40,000 1.02 - 0.0019 Bharat Investments Growth Ltd. 1,44,300 0.61 - 1,44,300 0.61 - 0.0020 Raghav Commercial Ltd. 1,19,800 0.51 - 3,47,800 1.48 - 0.9721 Kalati Holdings Pvt. Ltd. 1,06,573 0.45 - 1,06,573 0.45 - 0.0022 India Tex Fab Marketing Ltd. 2,289 0.01 - 2,289 0.01 - 0.0023 Micro Base Ltd. 36,50,970 15.50 - 36,50,970 15.50 - 0.0024 Microlight Investments Ltd. 10,85,000 4.61 - 10,85,000 4.61 - 0.0025 Corn Hill Investments Ltd. 1,98,800 0.84 - 1,98,800 0.84 - 0.00
Total 1,19,89,722 50.91 1,24,53,040 52.88 1.97
iii) Change in Promoters’ Shareholding (Please specify, if there is no change)
Particulars Shareholding at the beginning of the year April 1, 2018
Cumulative Shareholding during the Year March 31, 2019
No. of shares
% of total shares of the
company
No. of shares
% of total shares of the
companyAt the beginning of the year 1,19,89,722 50.91 1,24,53,040 52.88Date wise Increase / Decrease in Promoters Shareholding during the year specifying the reasons for increase /decrease (e.g. allotment / transfer / bonus/ sweat equity etc.):
- -
At the end of the year 1,19,89,722 50.91 1,24,53,040 52.88
S. No.
Name Shareholding Date Increase / Decrease in
Shareholding
Reason Cumulative Shareholding during the year (April 1, 2018 to March 31, 2019)
No. of Shares at the beginning April 1, 2018 /
end of the Year March 31, 2019
% of total shares of the
Company
No. of Shares
% of total shares of the
Company
1. Purvi Vanijya Niyojan Ltd. 12,18,431 5.17 October 12, 2018 2,35,318 Transfer 14,53,749 6.17 14,53,749 6.17 March 31, 2019 14,53,749 6.17
2. Raghav Commercial Ltd. 1,19,800 0.51 October 12, 2018 2,28,000 Transfer 3,47,800 1.483,47,800 1.48 March 31, 2019 3,47,800 1.48
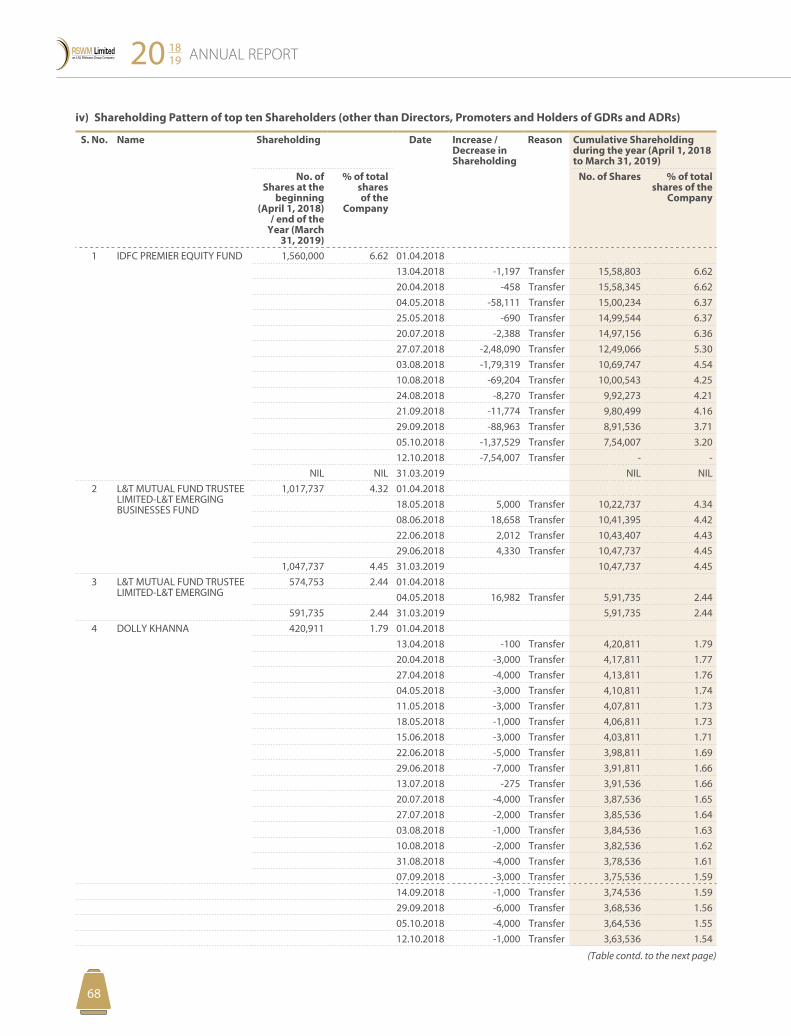
ANNUAL REPORT20 1819
6968
iv) Shareholding Pattern of top ten Shareholders (other than Directors, Promoters and Holders of GDRs and ADRs)
S. No. Name Shareholding Date Increase / Decrease in Shareholding
Reason Cumulative Shareholding during the year (April 1, 2018 to March 31, 2019)
No. of Shares at the
beginning (April 1, 2018)
/ end of the Year (March
31, 2019)
% of total shares of the
Company
No. of Shares % of total shares of the
Company
1 IDFC PREMIER EQUITY FUND 1,560,000 6.62 01.04.2018 13.04.2018 -1,197 Transfer 15,58,803 6.62
20.04.2018 -458 Transfer 15,58,345 6.6204.05.2018 -58,111 Transfer 15,00,234 6.3725.05.2018 -690 Transfer 14,99,544 6.3720.07.2018 -2,388 Transfer 14,97,156 6.3627.07.2018 -2,48,090 Transfer 12,49,066 5.3003.08.2018 -1,79,319 Transfer 10,69,747 4.5410.08.2018 -69,204 Transfer 10,00,543 4.2524.08.2018 -8,270 Transfer 9,92,273 4.2121.09.2018 -11,774 Transfer 9,80,499 4.1629.09.2018 -88,963 Transfer 8,91,536 3.7105.10.2018 -1,37,529 Transfer 7,54,007 3.2012.10.2018 -7,54,007 Transfer - -
NIL NIL 31.03.2019 NIL NIL2 L&T MUTUAL FUND TRUSTEE
LIMITED-L&T EMERGING BUSINESSES FUND
1,017,737 4.32 01.04.201818.05.2018 5,000 Transfer 10,22,737 4.3408.06.2018 18,658 Transfer 10,41,395 4.4222.06.2018 2,012 Transfer 10,43,407 4.4329.06.2018 4,330 Transfer 10,47,737 4.45
1,047,737 4.45 31.03.2019 10,47,737 4.453 L&T MUTUAL FUND TRUSTEE
LIMITED-L&T EMERGING574,753 2.44 01.04.2018
04.05.2018 16,982 Transfer 5,91,735 2.44591,735 2.44 31.03.2019 5,91,735 2.44
4 DOLLY KHANNA 420,911 1.79 01.04.201813.04.2018 -100 Transfer 4,20,811 1.79 20.04.2018 -3,000 Transfer 4,17,811 1.7727.04.2018 -4,000 Transfer 4,13,811 1.7604.05.2018 -3,000 Transfer 4,10,811 1.7411.05.2018 -3,000 Transfer 4,07,811 1.7318.05.2018 -1,000 Transfer 4,06,811 1.7315.06.2018 -3,000 Transfer 4,03,811 1.7122.06.2018 -5,000 Transfer 3,98,811 1.6929.06.2018 -7,000 Transfer 3,91,811 1.6613.07.2018 -275 Transfer 3,91,536 1.6620.07.2018 -4,000 Transfer 3,87,536 1.6527.07.2018 -2,000 Transfer 3,85,536 1.6403.08.2018 -1,000 Transfer 3,84,536 1.6310.08.2018 -2,000 Transfer 3,82,536 1.6231.08.2018 -4,000 Transfer 3,78,536 1.61 07.09.2018 -3,000 Transfer 3,75,536 1.59 14.09.2018 -1,000 Transfer 3,74,536 1.5929.09.2018 -6,000 Transfer 3,68,536 1.5605.10.2018 -4,000 Transfer 3,64,536 1.5512.10.2018 -1,000 Transfer 3,63,536 1.54
(Table contd. to the next page)
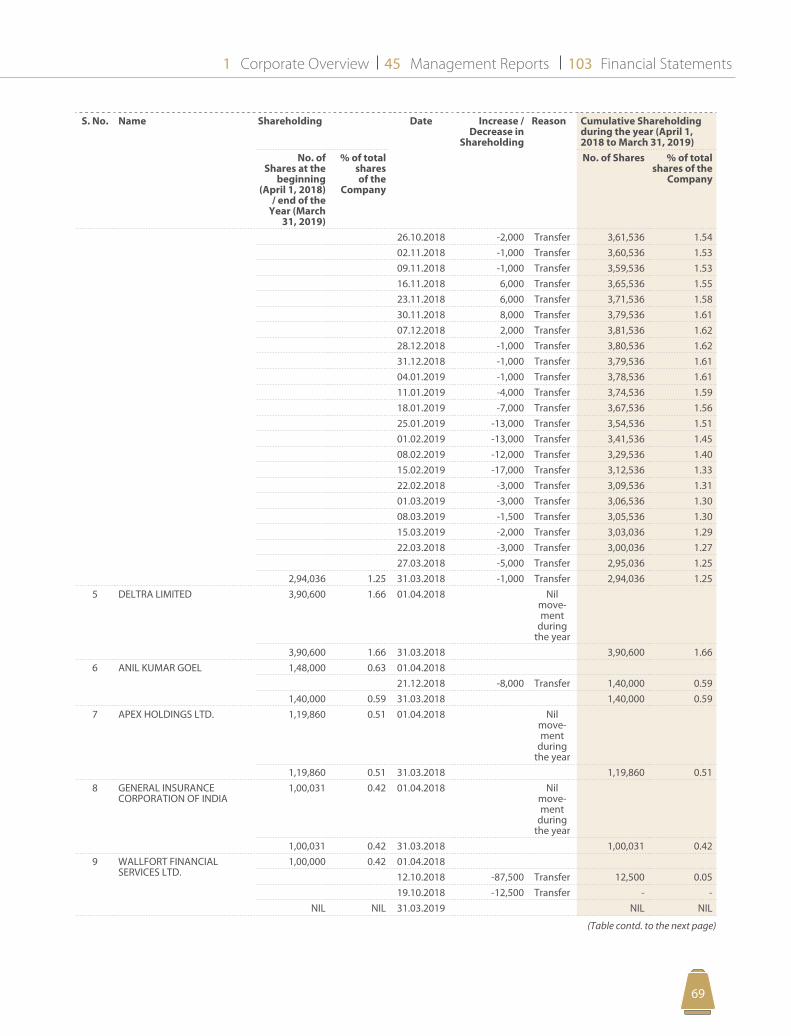
Corporate Overview Management Reports Financial Statements1 45 103
6968
S. No. Name Shareholding Date Increase / Decrease in
Shareholding
Reason Cumulative Shareholding during the year (April 1, 2018 to March 31, 2019)
No. of Shares at the
beginning (April 1, 2018)
/ end of the Year (March
31, 2019)
% of total shares of the
Company
No. of Shares % of total shares of the
Company
26.10.2018 -2,000 Transfer 3,61,536 1.5402.11.2018 -1,000 Transfer 3,60,536 1.5309.11.2018 -1,000 Transfer 3,59,536 1.5316.11.2018 6,000 Transfer 3,65,536 1.5523.11.2018 6,000 Transfer 3,71,536 1.5830.11.2018 8,000 Transfer 3,79,536 1.6107.12.2018 2,000 Transfer 3,81,536 1.6228.12.2018 -1,000 Transfer 3,80,536 1.6231.12.2018 -1,000 Transfer 3,79,536 1.6104.01.2019 -1,000 Transfer 3,78,536 1.6111.01.2019 -4,000 Transfer 3,74,536 1.59 18.01.2019 -7,000 Transfer 3,67,536 1.5625.01.2019 -13,000 Transfer 3,54,536 1.5101.02.2019 -13,000 Transfer 3,41,536 1.4508.02.2019 -12,000 Transfer 3,29,536 1.4015.02.2019 -17,000 Transfer 3,12,536 1.3322.02.2018 -3,000 Transfer 3,09,536 1.3101.03.2019 -3,000 Transfer 3,06,536 1.3008.03.2019 -1,500 Transfer 3,05,536 1.3015.03.2019 -2,000 Transfer 3,03,036 1.2922.03.2018 -3,000 Transfer 3,00,036 1.2727.03.2018 -5,000 Transfer 2,95,036 1.25
2,94,036 1.25 31.03.2018 -1,000 Transfer 2,94,036 1.25 5 DELTRA LIMITED 3,90,600 1.66 01.04.2018 Nil
move-ment
during the year
3,90,600 1.66 31.03.2018 3,90,600 1.66 6 ANIL KUMAR GOEL 1,48,000 0.63 01.04.2018
21.12.2018 -8,000 Transfer 1,40,000 0.59 1,40,000 0.59 31.03.2018 1,40,000 0.59
7 APEX HOLDINGS LTD. 1,19,860 0.51 01.04.2018 Nil move-ment
during the year
1,19,860 0.51 31.03.2018 1,19,860 0.518 GENERAL INSURANCE
CORPORATION OF INDIA 1,00,031 0.42 01.04.2018 Nil
move-ment
during the year
1,00,031 0.42 31.03.2018 1,00,031 0.429 WALLFORT FINANCIAL
SERVICES LTD. 1,00,000 0.42 01.04.2018
12.10.2018 -87,500 Transfer 12,500 0.05 19.10.2018 -12,500 Transfer - -
NIL NIL 31.03.2019 NIL NIL
(Table contd. to the next page)
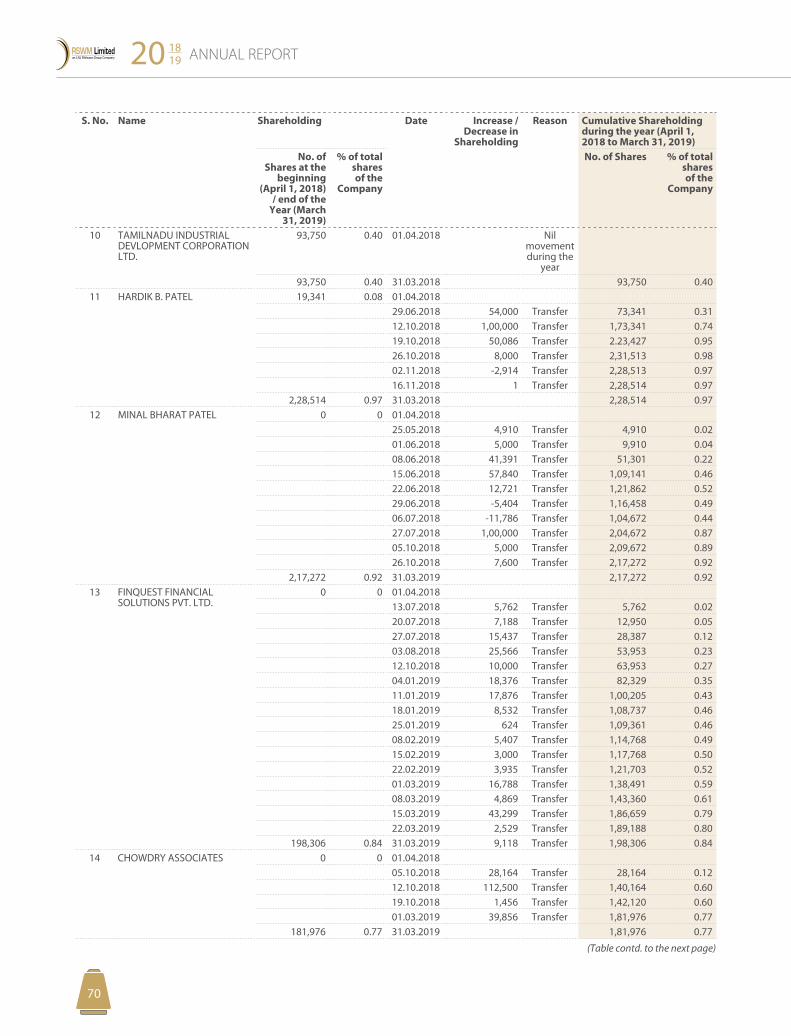
ANNUAL REPORT20 1819
7170
S. No. Name Shareholding Date Increase / Decrease in
Shareholding
Reason Cumulative Shareholding during the year (April 1, 2018 to March 31, 2019)
No. of Shares at the
beginning (April 1, 2018)
/ end of the Year (March
31, 2019)
% of total shares of the
Company
No. of Shares % of total shares of the
Company
10 TAMILNADU INDUSTRIAL DEVLOPMENT CORPORATION LTD.
93,750 0.40 01.04.2018 Nil movement during the
year
93,750 0.40 31.03.2018 93,750 0.40 11 HARDIK B. PATEL 19,341 0.08 01.04.2018
29.06.2018 54,000 Transfer 73,341 0.3112.10.2018 1,00,000 Transfer 1,73,341 0.7419.10.2018 50,086 Transfer 2.23,427 0.9526.10.2018 8,000 Transfer 2,31,513 0.9802.11.2018 -2,914 Transfer 2,28,513 0.9716.11.2018 1 Transfer 2,28,514 0.97
2,28,514 0.97 31.03.2018 2,28,514 0.9712 MINAL BHARAT PATEL 0 0 01.04.2018
25.05.2018 4,910 Transfer 4,910 0.0201.06.2018 5,000 Transfer 9,910 0.0408.06.2018 41,391 Transfer 51,301 0.2215.06.2018 57,840 Transfer 1,09,141 0.4622.06.2018 12,721 Transfer 1,21,862 0.5229.06.2018 -5,404 Transfer 1,16,458 0.4906.07.2018 -11,786 Transfer 1,04,672 0.4427.07.2018 1,00,000 Transfer 2,04,672 0.8705.10.2018 5,000 Transfer 2,09,672 0.8926.10.2018 7,600 Transfer 2,17,272 0.92
2,17,272 0.92 31.03.2019 2,17,272 0.9213 FINQUEST FINANCIAL
SOLUTIONS PVT. LTD.0 0 01.04.2018
13.07.2018 5,762 Transfer 5,762 0.0220.07.2018 7,188 Transfer 12,950 0.0527.07.2018 15,437 Transfer 28,387 0.1203.08.2018 25,566 Transfer 53,953 0.2312.10.2018 10,000 Transfer 63,953 0.2704.01.2019 18,376 Transfer 82,329 0.3511.01.2019 17,876 Transfer 1,00,205 0.4318.01.2019 8,532 Transfer 1,08,737 0.4625.01.2019 624 Transfer 1,09,361 0.4608.02.2019 5,407 Transfer 1,14,768 0.4915.02.2019 3,000 Transfer 1,17,768 0.5022.02.2019 3,935 Transfer 1,21,703 0.5201.03.2019 16,788 Transfer 1,38,491 0.5908.03.2019 4,869 Transfer 1,43,360 0.6115.03.2019 43,299 Transfer 1,86,659 0.7922.03.2019 2,529 Transfer 1,89,188 0.80
198,306 0.84 31.03.2019 9,118 Transfer 1,98,306 0.8414 CHOWDRY ASSOCIATES 0 0 01.04.2018
05.10.2018 28,164 Transfer 28,164 0.1212.10.2018 112,500 Transfer 1,40,164 0.6019.10.2018 1,456 Transfer 1,42,120 0.6001.03.2019 39,856 Transfer 1,81,976 0.77
181,976 0.77 31.03.2019 1,81,976 0.77
(Table contd. to the next page)
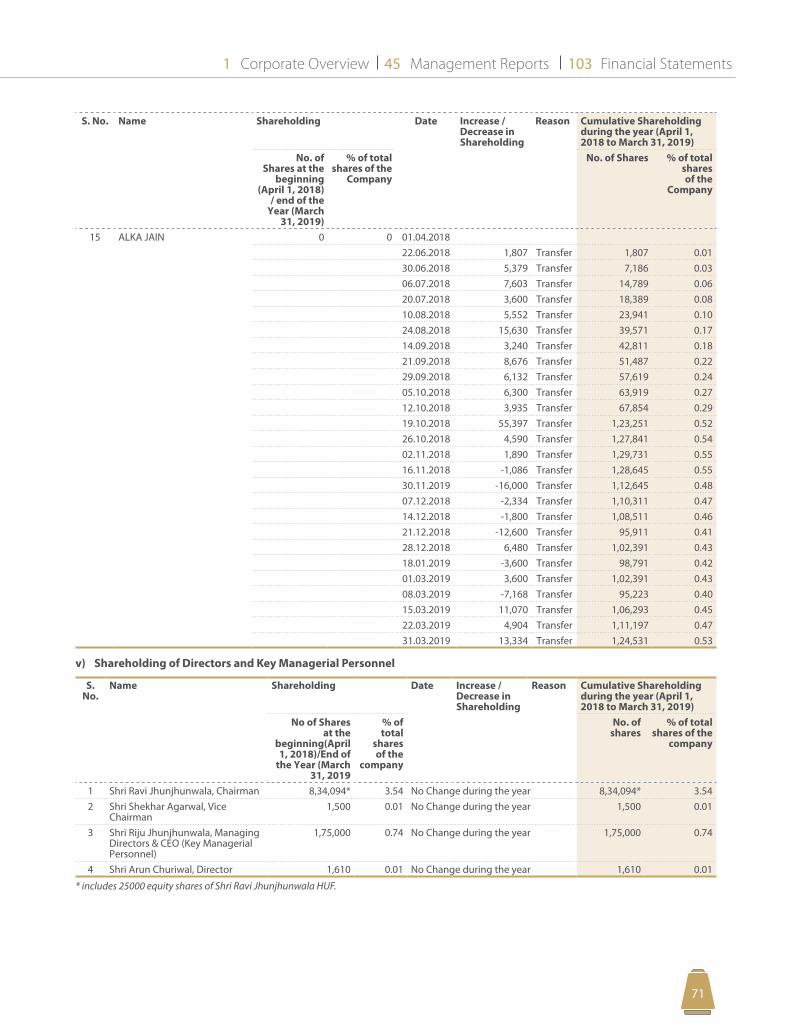
Corporate Overview Management Reports Financial Statements1 45 103
7170
S. No. Name Shareholding Date Increase / Decrease in Shareholding
Reason Cumulative Shareholding during the year (April 1, 2018 to March 31, 2019)
No. of Shares at the
beginning (April 1, 2018)
/ end of the Year (March
31, 2019)
% of total shares of the
Company
No. of Shares % of total shares of the
Company
15 ALKA JAIN 0 0 01.04.201822.06.2018 1,807 Transfer 1,807 0.0130.06.2018 5,379 Transfer 7,186 0.0306.07.2018 7,603 Transfer 14,789 0.0620.07.2018 3,600 Transfer 18,389 0.0810.08.2018 5,552 Transfer 23,941 0.1024.08.2018 15,630 Transfer 39,571 0.1714.09.2018 3,240 Transfer 42,811 0.1821.09.2018 8,676 Transfer 51,487 0.2229.09.2018 6,132 Transfer 57,619 0.2405.10.2018 6,300 Transfer 63,919 0.2712.10.2018 3,935 Transfer 67,854 0.2919.10.2018 55,397 Transfer 1,23,251 0.5226.10.2018 4,590 Transfer 1,27,841 0.5402.11.2018 1,890 Transfer 1,29,731 0.5516.11.2018 -1,086 Transfer 1,28,645 0.5530.11.2019 -16,000 Transfer 1,12,645 0.4807.12.2018 -2,334 Transfer 1,10,311 0.4714.12.2018 -1,800 Transfer 1,08,511 0.4621.12.2018 -12,600 Transfer 95,911 0.4128.12.2018 6,480 Transfer 1,02,391 0.4318.01.2019 -3,600 Transfer 98,791 0.4201.03.2019 3,600 Transfer 1,02,391 0.4308.03.2019 -7,168 Transfer 95,223 0.4015.03.2019 11,070 Transfer 1,06,293 0.4522.03.2019 4,904 Transfer 1,11,197 0.4731.03.2019 13,334 Transfer 1,24,531 0.53
v) Shareholding of Directors and Key Managerial Personnel
S. No.
Name Shareholding Date Increase / Decrease in Shareholding
Reason Cumulative Shareholding during the year (April 1, 2018 to March 31, 2019)
No of Shares at the
beginning(April 1, 2018)/End of
the Year (March 31, 2019
% of total
shares of the
company
No. of shares
% of total shares of the
company
1 Shri Ravi Jhunjhunwala, Chairman 8,34,094* 3.54 No Change during the year 8,34,094* 3.542 Shri Shekhar Agarwal, Vice
Chairman1,500 0.01 No Change during the year 1,500 0.01
3 Shri Riju Jhunjhunwala, Managing Directors & CEO (Key Managerial Personnel)
1,75,000 0.74 No Change during the year 1,75,000 0.74
4 Shri Arun Churiwal, Director 1,610 0.01 No Change during the year 1,610 0.01
* includes 25000 equity shares of Shri Ravi Jhunjhunwala HUF.
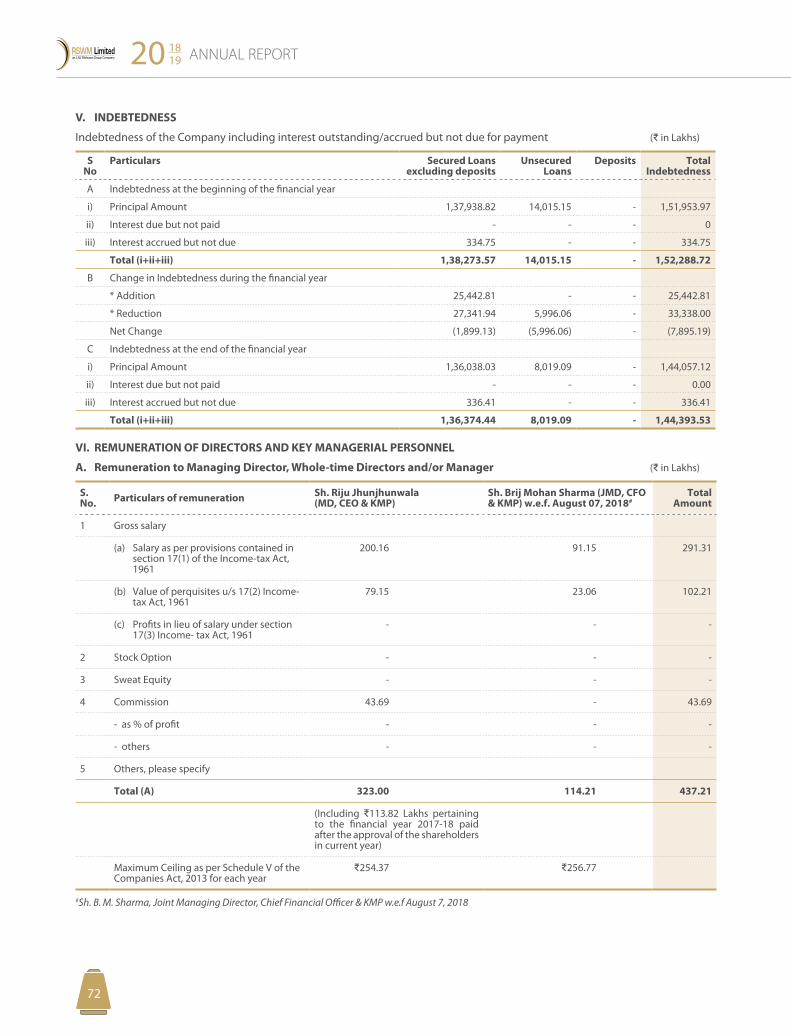
ANNUAL REPORT20 1819
7372
V. INDEBTEDNESS
Indebtedness of the Company including interest outstanding/accrued but not due for payment (D in Lakhs)
S No
Particulars Secured Loans excluding deposits
Unsecured Loans
Deposits Total Indebtedness
A Indebtedness at the beginning of the financial year
i) Principal Amount 1,37,938.82 14,015.15 - 1,51,953.97
ii) Interest due but not paid - - - 0
iii) Interest accrued but not due 334.75 - - 334.75
Total (i+ii+iii) 1,38,273.57 14,015.15 - 1,52,288.72
B Change in Indebtedness during the financial year
* Addition 25,442.81 - - 25,442.81
* Reduction 27,341.94 5,996.06 - 33,338.00
Net Change (1,899.13) (5,996.06) - (7,895.19)
C Indebtedness at the end of the financial year
i) Principal Amount 1,36,038.03 8,019.09 - 1,44,057.12
ii) Interest due but not paid - - - 0.00
iii) Interest accrued but not due 336.41 - - 336.41
Total (i+ii+iii) 1,36,374.44 8,019.09 - 1,44,393.53
VI. REMUNERATION OF DIRECTORS AND KEY MANAGERIAL PERSONNEL
A. Remuneration to Managing Director, Whole-time Directors and/or Manager (D in Lakhs)
S. No. Particulars of remuneration Sh. Riju Jhunjhunwala
(MD, CEO & KMP)Sh. Brij Mohan Sharma (JMD, CFO & KMP) w.e.f. August 07, 2018#
Total Amount
1 Gross salary
(a) Salary as per provisions contained in section 17(1) of the Income-tax Act, 1961
200.16 91.15 291.31
(b) Value of perquisites u/s 17(2) Income-tax Act, 1961
79.15 23.06 102.21
(c) Profits in lieu of salary under section 17(3) Income- tax Act, 1961
- - -
2 Stock Option - - -
3 Sweat Equity - - -
4 Commission 43.69 - 43.69
- as % of profit - - -
- others - - -
5 Others, please specify
Total (A) 323.00 114.21 437.21
(Including D113.82 Lakhs pertaining to the financial year 2017-18 paid after the approval of the shareholders in current year)
Maximum Ceiling as per Schedule V of the Companies Act, 2013 for each year
D254.37 D256.77
#Sh. B. M. Sharma, Joint Managing Director, Chief Financial Officer & KMP w.e.f August 7, 2018
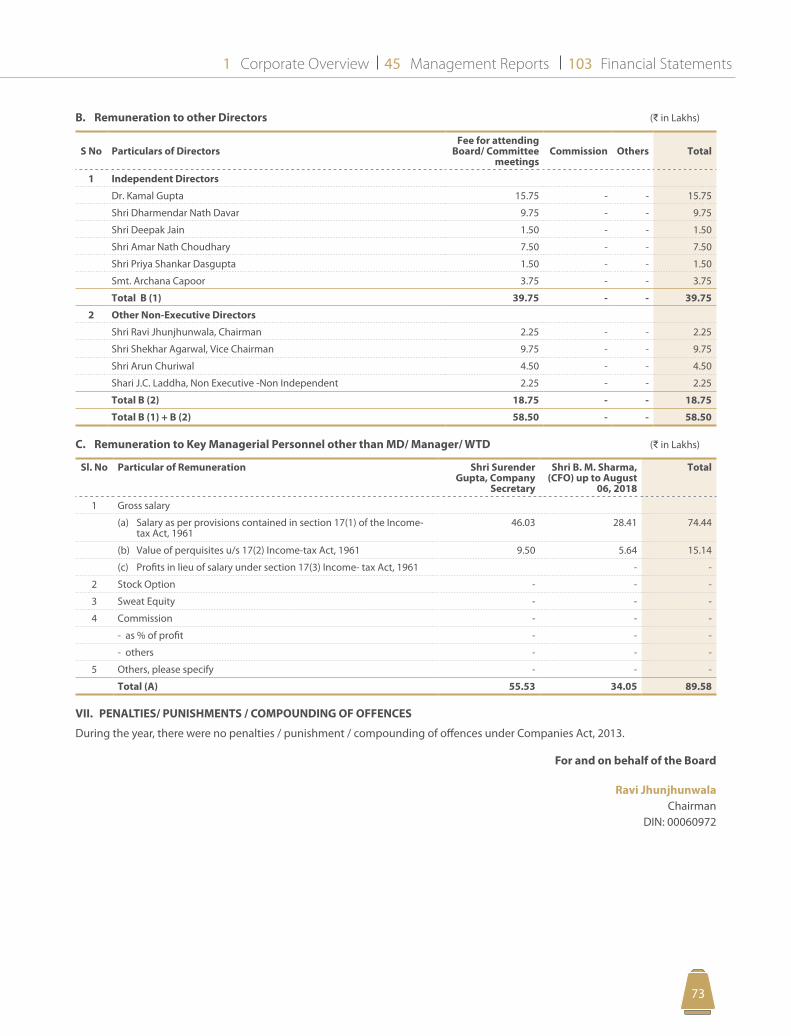
Corporate Overview Management Reports Financial Statements1 45 103
7372
B. Remuneration to other Directors (D in Lakhs)
S No Particulars of DirectorsFee for attending
Board/ Committee meetings
Commission Others Total
1 Independent Directors
Dr. Kamal Gupta 15.75 - - 15.75
Shri Dharmendar Nath Davar 9.75 - - 9.75
Shri Deepak Jain 1.50 - - 1.50
Shri Amar Nath Choudhary 7.50 - - 7.50
Shri Priya Shankar Dasgupta 1.50 - - 1.50
Smt. Archana Capoor 3.75 - - 3.75
Total B (1) 39.75 - - 39.75
2 Other Non-Executive Directors
Shri Ravi Jhunjhunwala, Chairman 2.25 - - 2.25
Shri Shekhar Agarwal, Vice Chairman 9.75 - - 9.75
Shri Arun Churiwal 4.50 - - 4.50
Shari J.C. Laddha, Non Executive -Non Independent 2.25 - - 2.25
Total B (2) 18.75 - - 18.75
Total B (1) + B (2) 58.50 - - 58.50
C. Remuneration to Key Managerial Personnel other than MD/ Manager/ WTD (D in Lakhs)
Sl. No Particular of Remuneration Shri Surender Gupta, Company
Secretary
Shri B. M. Sharma, (CFO) up to August
06, 2018
Total
1 Gross salary
(a) Salary as per provisions contained in section 17(1) of the Income-tax Act, 1961
46.03 28.41 74.44
(b) Value of perquisites u/s 17(2) Income-tax Act, 1961 9.50 5.64 15.14
(c) Profits in lieu of salary under section 17(3) Income- tax Act, 1961 - -
2 Stock Option - - -
3 Sweat Equity - - -
4 Commission - - -
- as % of profit - - -
- others - - -
5 Others, please specify - - -
Total (A) 55.53 34.05 89.58
VII. PENALTIES/ PUNISHMENTS / COMPOUNDING OF OFFENCES
During the year, there were no penalties / punishment / compounding of offences under Companies Act, 2013.
For and on behalf of the Board
Ravi JhunjhunwalaChairman
DIN: 00060972
ANNUAL REPORT20 1819
7574
NOMINATION & REMUNERATION POLICYPursuant to Section 178 of the Companies Act, 2013 and Regulation 19 of SEBI (Listing Obligations and Disclosure Requirements) Regulations, 2015, every Listed Company is required to constitute a Nomination and Remuneration Committee with at least three or more non-executive Directors, out of which not less than one half shall be independent directors. The Company already has a Nomination and Remuneration Committee with three Non-Executive Directors with a majority of Independent Directors.
The Nomination and Remuneration Committee and Nomination and Remuneration Policy are in compliance with the provisions of Section 178 of the Companies Act, 2013 and rules framed thereunder and Regulation 19 SEBI (Listing Obligations and Disclosure Requirements) Regulations, 2015. The same applies to the Board of Directors, Key Managerial Personnel and the Senior Management Personnel of the Company.
“Key Managerial Personnel (KMP)” means and comprise of-
• Managing Director & Chief Executive Officer;
• Whole-time Director;
• Company Secretary;
• Chief Financial Officer;
• Such other Officer as may be prescribed.
“Senior Management” shall mean officers/personnel of the listed entity who are members of its core management team excluding Board of Directors and normally this shall comprise all members of management one level below the chief executive officer/managing director/whole time director/manager (including chief executive officer/manager, in case they are not part of the Board) and shall specifically include company secretary and chief financial officer and including functional heads.
Role and Objective of Committee:
1. To formulate the criteria for determining qualifications, positive attributes and independence of a Director.
2. Identify persons who are qualified to become Directors and who may be appointed in senior management positions in accordance with the criteria laid down in the policy.
3. Recommend to the Board the appointment and removal of Directors and Senior Management.
4. Carry out evaluation of every Director’s performance.
5. Formulate criteria for evaluation of Independent Directors and the Board.
Annexure VI to
Directors’ Report6. Recommend to the Board a policy, relating to the
remuneration for the Directors, Key Managerial Personnel and senior management.
7. To devise a policy on Board diversity.
8. To ensure that the level and composition of remuneration is reasonable and sufficient to attract, retain and motivate directors of the quality required to run Company successfully.
9. To ensure that relationship of remuneration to performance is clear and meets appropriate performance benchmarks.
10. To develop a Succession Plan for the Board and to review it regularly.
11. To perform such other functions as may be referred by the Board or be necessary in view of the Listing Regulations, 2015 and the provisions of the Companies Act, 2013 and Rules made thereunder.
12. Recommend to the board, all remuneration, in whatever form, payable to senior management.
Membership:
1. The Committee shall comprise of at least three (3) Directors, all of whom shall be non-executive Directors and at least half of them shall be independent.
2. Minimum two (2) members shall constitute a Quorum for a Committee meeting.
3. Membership of the Committee shall be disclosed in the Annual Report.
4. Term of the Committee shall be continued unless terminated by the Board of Directors.
Chairman:
1. Chairman of the Committee shall be an Independent Director.
2. Chairperson of the Company may be appointed as a member of the Committee but shall not Chair the Committee.
3. In the absence of the Chairman, the members of the Committee present at the meeting shall choose one amongst them to act as Chairman.
4. Chairman of the Nomination and Remuneration Committee could be present at the Annual General Meeting or may nominate some other member to answer the shareholders’ queries.
Frequency of Meetings:
The meetings of the Committee shall be held at such regular intervals as may be required. However, the Committee shall meet atleast once in a year.
Corporate Overview Management Reports Financial Statements1 45 103
7574
Committee Members’ Interests:
1. A member of the Committee is not entitled to be present when his or her own remuneration is discussed at a meeting or when his or her performance is being evaluated.
2. The Committee may invite such executives, as it considers appropriate, to be present at the meetings of the Committee.
Voting :
1. Matters arising for determination at Committee meetings shall be decided by a majority of votes of members present and voting and any such decision shall, for all purposes, be deemed to be a decision of the Committee.
2. In the case of equality of votes, the Chairman of the meeting will have a casting vote.
Appointment of Directors/KMP/Senior Management:
While recommending a candidate for appointment, the Committee shall have regard to:
• Assessing the appointee against a range of criteria which includes but not limited to qualifications, skills, experience, background and other qualities required to operate successfully;
• The experience and knowledge that the appointee brings to the role of KMP/Senior Officials, which, in turn, will enhance the skill sets and experience of the Board as a whole;
• The nature of existing positions held by the appointee including directorship and such other relationship and the impact of the same on the Company’s welfare.
Letter of Appointment:
Each Independent Director is required to sign the duplicate copy of the letter of appointment issued by the Company, which contains the terms and conditions of his/her appointment.
Policy on Board Diversity:
The Nomination and Remuneration Committee shall ensure that the Board of Directors have the combination of Directors from different areas/fields or as may be considered appropriate in the best interests of the Company. The Board shall have at least one Board member who has accounting/financial management expertise.
Remuneration of Directors, Key Managerial Personnel and Senior Management:
The salaries of Directors, Key Management Personnel and other senior officials shall be based and determined on the individual person’s responsibilities and performance and in accordance with the limits as prescribed statutorily, if any.
1. Fixed Pay :
The Key Management Personnel (KMP) and Senior
Management shall be eligible for a monthly remuneration as may be approved by the Board on the recommendation of the Committee in accordance with the statutory provisions of the Companies Act, 2013, and the rules made thereunder for the time being in force. The salary paid need to be competitive and reflective of the individual’s role, responsibility and experience in relation to performance of day-to-day activities to be usually reviewed on an annual basis.
2. Minimum Remuneration :
If, in any financial year, the Company has no profits or its profits are inadequate, the Company shall pay remuneration to its Managerial Personnel in accordance with the provisions of Schedule V of the Companies Act, 2013 and if it is not able to comply with such provisions, with the prior approval of the concerned authorities.
3. Provision for excess remuneration :
If any Managerial Personnel draws or receives, directly or indirectly by way of remuneration any such sums in excess of the limits prescribed under the Companies Act, 2013 or without the prior sanction of the concerned authorities, where required, he/she shall refund such sums to the Company and until such sum is refunded, hold it in trust for the Company. The Company shall not waive recovery of such sum refundable to it, unless permitted by the concerned authorities.
4. Increment :
Increments to the existing remuneration/compensation structure may be recommended by the Committee to the Board, which should be within the slabs approved by the shareholders in the case of Managerial Person.
Remuneration to Non-Executive/Independent Director:
1. Remuneration/Commission:
The remuneration/commission shall be in accordance with the statutory provisions of the Companies Act, 2013, and the rules made thereunder for the time being in force.
2. Sitting Fees:
The Non-Executive/Independent Director may receive remuneration by way of fees for attending meetings of Board or Committee(s) thereof. Provided that the amount of such fees shall not exceed the maximum amount as provided in the Companies Act, 2013, per meeting of the Board or Committee or such amount as may be prescribed by the Central Government from time to time.
Other Provisions:
• Section 197(1) of the Companies Act, 2013 provides for the total managerial remuneration payable by the Company to its Directors including Managing Director and Whole
ANNUAL REPORT20 1819
7776
Time Director, and its Manager in respect of any financial year shall not exceed eleven percent of the net profits of the Company computed in the manner laid down in Section 198 in the manner as prescribed under the Act.
• The Company, with the approval of the Shareholders and Central Government, may authorise the payment of remuneration exceeding eleven percent of the net profits of the company, subject to the provisions of Schedule V.
• The Company may, with the approval of the shareholders, authorise the payment of remuneration upto five percent of the net profits of the Company to any one of its Managing Director/Whole Time Director/Manager and ten percent in case of more than one such official in accordance with the provisions of Companies Act, 2013.
• The Company may pay remuneration to its Directors, other than Managing Director and Whole Time Director upto one percent of the net profits of the Company, if there is a Managing Director or Whole Time Director or Manager and three percent of the net profits in any other case.
• The Independent Directors shall not be entitled to any Stock Option.
Evaluation/ Assessment of Directors/ KMPs/Senior Management of the Company
The evaluation/assessment of the Directors, KMPs and the Senior Management of the Company is to be conducted on an annual basis and to satisfy the requirements of the Listing Regulation, 2015.
The following criteria may assist in determining how effective the performance of the Directors/KMPs/Senior Management has been:
• Leadership & stewardship abilities
• Assess policies, structures & procedures
• Regular monitoring of corporate results against projections
• Contributing to clearly defined corporate objectives & plans
• Obtain adequate, relevant & timely information.
• Review achievement of strategic and operational plans, objectives, budgets
• Identify, monitor & mitigate significant corporate risks
• Directly monitor & evaluate KMPs, senior officials
• Review management’s succession plan
• Effective meetings
• Clearly defining role & monitoring activities of Committees
• Review of ethical conduct
Evaluation following the aforesaid parameters, will be conducted by the Independent Directors for each of the Executive/Non-Independent Directors in a separate meeting of the Independent Directors.
The Executive/Non-Independent Directors along with the Independent Directors will evaluate/assess each of the Independent Directors relative to the aforesaid parameters. Only the Independent Director being evaluated will not participate in the said evaluation discussion.
DEVIATIONS FROM THIS POLICY:
Deviations from elements of this policy, when deemed necessary in the interests of the Company, will be made if there are specific reasons to do so in an individual case.
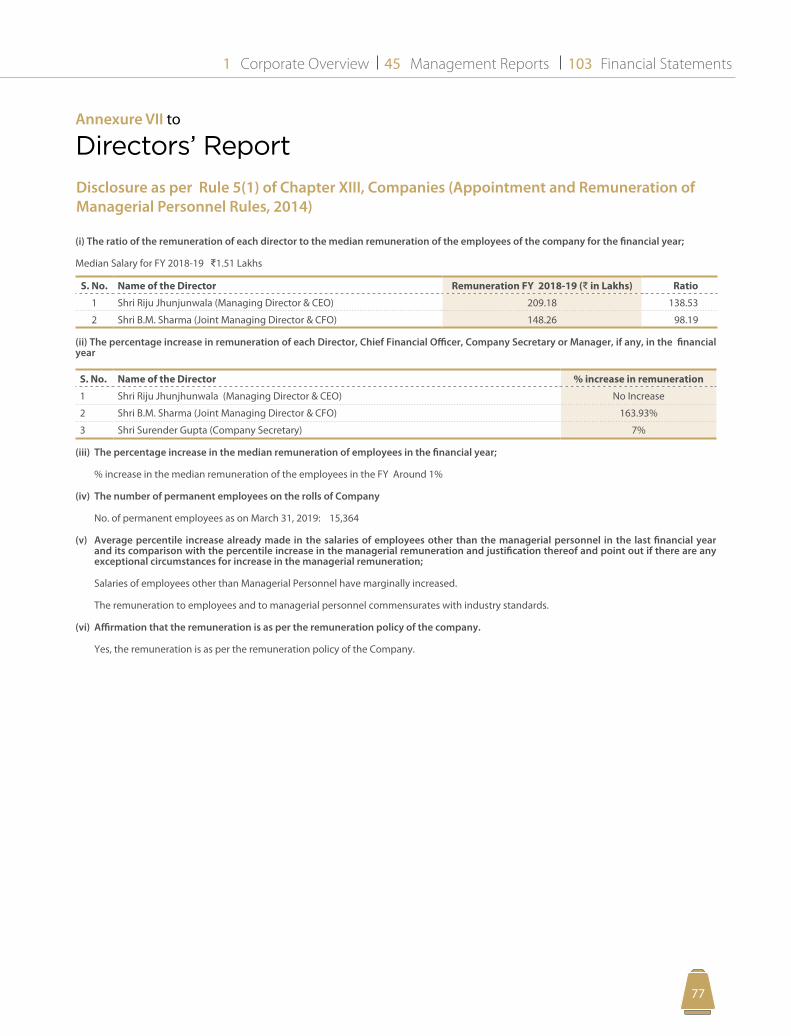
Corporate Overview Management Reports Financial Statements1 45 103
7776
Annexure VII to
Directors’ Report
Disclosure as per Rule 5(1) of Chapter XIII, Companies (Appointment and Remuneration of Managerial Personnel Rules, 2014)
(i) The ratio of the remuneration of each director to the median remuneration of the employees of the company for the financial year;
Median Salary for FY 2018-19 D1.51 Lakhs
S. No. Name of the Director Remuneration FY 2018-19 (D in Lakhs) Ratio
1 Shri Riju Jhunjunwala (Managing Director & CEO) 209.18 138.53
2 Shri B.M. Sharma (Joint Managing Director & CFO) 148.26 98.19
(ii) The percentage increase in remuneration of each Director, Chief Financial Officer, Company Secretary or Manager, if any, in the financial year
S. No. Name of the Director % increase in remuneration
1 Shri Riju Jhunjhunwala (Managing Director & CEO) No Increase
2 Shri B.M. Sharma (Joint Managing Director & CFO) 163.93%
3 Shri Surender Gupta (Company Secretary) 7%
(iii) The percentage increase in the median remuneration of employees in the financial year;
% increase in the median remuneration of the employees in the FY Around 1%
(iv) The number of permanent employees on the rolls of Company
No. of permanent employees as on March 31, 2019: 15,364
(v) Average percentile increase already made in the salaries of employees other than the managerial personnel in the last financial year and its comparison with the percentile increase in the managerial remuneration and justification thereof and point out if there are any exceptional circumstances for increase in the managerial remuneration;
Salaries of employees other than Managerial Personnel have marginally increased.
The remuneration to employees and to managerial personnel commensurates with industry standards.
(vi) Affirmation that the remuneration is as per the remuneration policy of the company.
Yes, the remuneration is as per the remuneration policy of the Company.
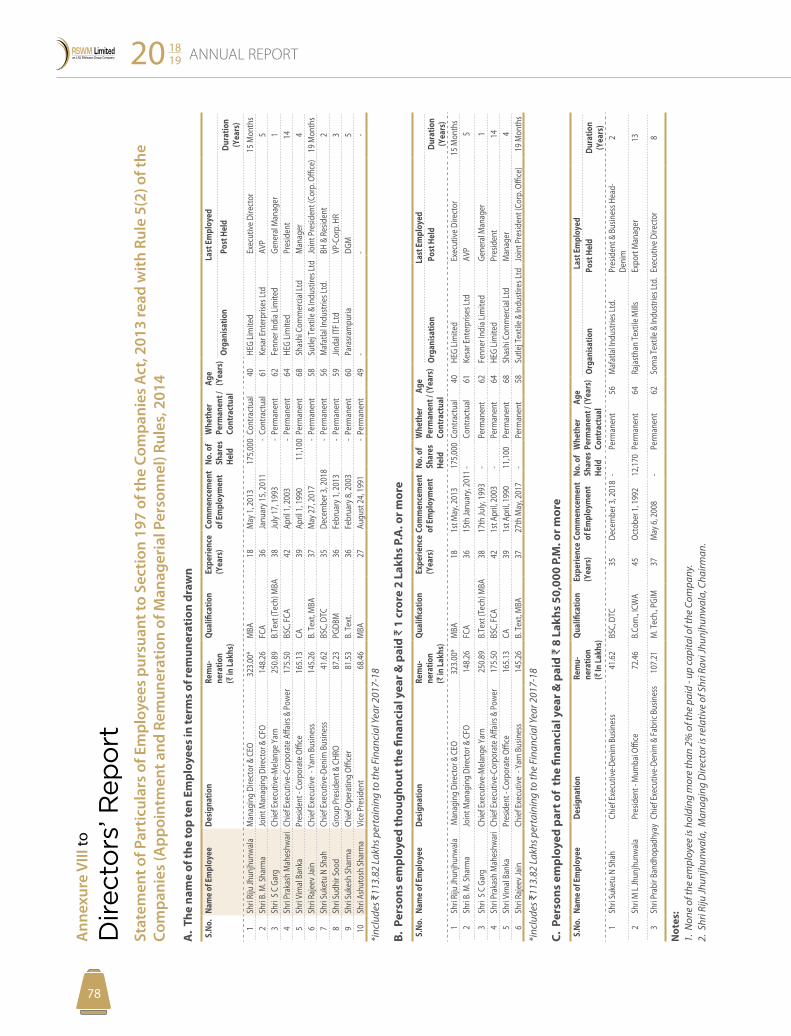
ANNUAL REPORT20 1819
7978
Ann
exur
e VI
II to
Directo
rs’ R
ep
ort
Stat
emen
t of P
artic
ular
s of
Em
ploy
ees
purs
uant
to S
ectio
n 19
7 of
the
Com
pani
es A
ct, 2
013
read
with
Rul
e 5(
2) o
f the
Co
mpa
nies
(App
oint
men
t and
Rem
uner
atio
n of
Man
ager
ial P
erso
nnel
) Rul
es, 2
014
A.
The
nam
e of
the
top
ten
Empl
oyee
s in
term
s of
rem
uner
atio
n dr
awn
S.No
.Na
me
of E
mpl
oyee
Desig
natio
nRe
mu-
nera
tion
(D
in La
khs)
Qual
ifica
tion
Expe
rienc
e (Y
ears
)Co
mm
ence
men
t of
Em
ploy
men
tNo
. of
Shar
es
Held
Whe
ther
Pe
rman
ent /
Co
ntra
ctua
l
Age
(Yea
rs)
Last
Em
ploy
ed
Orga
nisa
tion
Post
Hel
dDu
ratio
n (Y
ears
)1
Shri
Riju
Jhun
jhun
wal
aM
anag
ing
Dire
ctor
& C
EO32
3.00
*M
BA18
May
1, 2
013
175,
000
Cont
ract
ual
40HE
G Lim
ited
Exec
utiv
e Di
rect
or15
Mon
ths
2Sh
ri B.
M. S
harm
aJo
int M
anag
ing
Dire
ctor
& C
FO14
8.26
FCA
36Ja
nuar
y 15,
201
1-
Cont
ract
ual
61Ke
sar E
nter
prise
s Ltd
AVP
53
Shri
S C
Garg
Chie
f Exe
cutiv
e-M
elan
ge Y
arn
250.
89B.
Text
(Tec
h) M
BA38
July
17, 1
993
-Pe
rman
ent
62Fe
nner
Indi
a Lim
ited
Gene
ral M
anag
er1
4Sh
ri Pr
akas
h M
ahes
hwar
iCh
ief E
xecu
tive-
Corp
orat
e Aff
airs
& P
ower
175.
50BS
C, FC
A42
April
1, 2
003
-Pe
rman
ent
64HE
G Lim
ited
Pres
iden
t14
5Sh
ri Vi
mal
Ban
kaPr
esid
ent -
Cor
pora
te O
ffice
165.
13CA
39Ap
ril 1
, 199
011
,100
Perm
anen
t68
Shas
hi C
omm
ercia
l Ltd
Man
ager
46
Shri
Raje
ev Ja
inCh
ief E
xecu
tive
- Ya
rn B
usin
ess
145.
26B.
Tex
t, M
BA37
May
27,
201
7-
Perm
anen
t58
Sutle
j Tex
tile
& In
dust
ires L
tdJo
int P
resid
ent (
Corp
. Offi
ce)
19 M
onth
s7
Shri
Suke
tu N
Shah
Chie
f Exe
cutiv
e-De
nim
Bus
ines
s41
.62
BSC,
DTC
35De
cem
ber 3
, 201
8-
Perm
anen
t56
Maf
atla
l Indu
strie
s Ltd
.BH
& R
esid
ent
28
Shri
Sudh
ir So
odGr
oup
Pres
iden
t & C
HRO
87.2
3PG
DBM
36Fe
brua
ry 1
, 201
3-
Perm
anen
t59
Jinda
l ITF L
tdVP
-Cor
p. H
R3
9Sh
ri Su
kesh
Shar
ma
Chie
f Ope
ratin
g Offi
cer
81.5
3B.
Tex
t.36
Febr
uary
8, 2
003
-Pe
rman
ent
60Pa
rasr
ampu
riaDG
M5
10Sh
ri As
huto
sh Sh
arm
aVi
ce P
resid
ent
68.4
6M
BA27
Augu
st 2
4, 1
991
-Pe
rman
ent
49-
--
*inc
lude
s D11
3.82
Lak
hs p
erta
inin
g to
the
Fina
ncia
l Yea
r 201
7-18
B. P
erso
ns e
mpl
oyed
thou
ghou
t the
fina
ncia
l yea
r & p
aid
D 1
cro
re 2
Lak
hs P
.A. o
r mor
e
S.No
.Na
me
of E
mpl
oyee
Desig
natio
nRe
mu-
nera
tion
(D
in La
khs)
Qual
ifica
tion
Expe
rienc
e (Y
ears
)Co
mm
ence
men
t of
Em
ploy
men
tNo
. of
Shar
es
Held
Whe
ther
Pe
rman
ent /
Co
ntra
ctua
l
Age
(Yea
rs)
Last
Em
ploy
edOr
gani
satio
nPo
st H
eld
Dura
tion
(Yea
rs)
1Sh
ri Ri
ju Jh
unjh
unw
ala
Man
agin
g Di
rect
or &
CEO
323.
00*
MBA
181s
t May
, 201
317
5,00
0Co
ntra
ctua
l40
HEG
Limite
dEx
ecut
ive
Dire
ctor
15 M
onth
s2
Shri
B. M
. Sha
rma
Join
t Man
agin
g Di
rect
or &
CFO
148.
26FC
A36
15th
Janu
ary,
2011
-Co
ntra
ctua
l61
Kesa
r Ent
erpr
ises L
tdAV
P5
3Sh
ri S
C Ga
rgCh
ief E
xecu
tive-
Mel
ange
Yar
n 25
0.89
B.Te
xt (T
ech)
MBA
3817
th Ju
ly, 1
993
-Pe
rman
ent
62Fe
nner
Indi
a Lim
ited
Gene
ral M
anag
er1
4Sh
ri Pr
akas
h M
ahes
hwar
iCh
ief E
xecu
tive-
Corp
orat
e Aff
airs
& P
ower
175.
50BS
C, FC
A42
1st A
pril,
2003
-Pe
rman
ent
64HE
G Lim
ited
Pres
iden
t14
5Sh
ri Vi
mal
Ban
kaPr
esid
ent -
Cor
pora
te O
ffice
165.
13CA
391s
t Apr
il, 19
9011
,100
Perm
anen
t68
Shas
hi C
omm
ercia
l Ltd
Man
ager
46
Shri
Raje
ev Ja
inCh
ief E
xecu
tive
- Ya
rn B
usin
ess
145.
26B.
Tex
t, M
BA37
27th
May
, 201
7-
Perm
anen
t58
Sutle
j Tex
tile
& In
dust
ires L
tdJo
int P
resid
ent (
Corp
. Offi
ce)
19 M
onth
s
*inc
lude
s D11
3.82
Lak
hs p
erta
inin
g to
the
Fina
ncia
l Yea
r 201
7-18
C. P
erso
ns e
mpl
oyed
par
t of
the
finan
cial
yea
r & p
aid
D 8
Lak
hs 5
0,00
0 P.
M. o
r mor
e
S.No
.Na
me
of E
mpl
oyee
Desig
natio
nRe
mu-
nera
tion
(D
In La
khs)
Qual
ifica
tion
Expe
rienc
e (Y
ears
)Co
mm
ence
men
t of
Em
ploy
men
tNo
. of
Shar
es
Held
Whe
ther
Pe
rman
ent /
Co
ntra
ctua
l
Age
(Yea
rs)
Last
Em
ploy
edOr
gani
satio
nPo
st H
eld
Dura
tion
(Yea
rs)
1Sh
ri Su
ketu
N Sh
ahCh
ief E
xecu
tive-
Deni
m B
usin
ess
41.6
2BS
C, D
TC35
Dece
mbe
r 3, 2
018
-Pe
rman
ent
56M
afat
lal In
dust
ries L
td.
Pres
iden
t & B
usin
ess H
ead-
Deni
m2
2Sh
ri M
L Jh
unjh
unw
ala
Pres
iden
t - M
umba
i Offi
ce72
.46
B.Co
m., I
CWA
45Oc
tobe
r 1, 1
992
12,1
70Pe
rman
ent
64Ra
jast
han
Text
ile M
illsEx
port
Man
ager
13
3Sh
ri Pr
abir
Band
hopa
dhya
yCh
ief E
xecu
tive-
Deni
m &
Fabr
ic Bu
sines
s10
7.21
M. T
ech.
, PGI
M37
May
6, 2
008
-Pe
rman
ent
62So
ma T
extil
e &
Indu
strie
s Ltd
.Ex
ecut
ive
Dire
ctor
8
Not
es:
1. N
one
of th
e em
ploy
ee is
hol
ding
mor
e th
an 2
% o
f the
pai
d - u
p ca
pita
l of t
he C
ompa
ny.
2. S
hri R
iju Jh
unjh
unw
ala,
Man
agin
g D
irect
or is
rela
tive
of S
hri R
avi J
hunj
hunw
ala,
Cha
irman
.
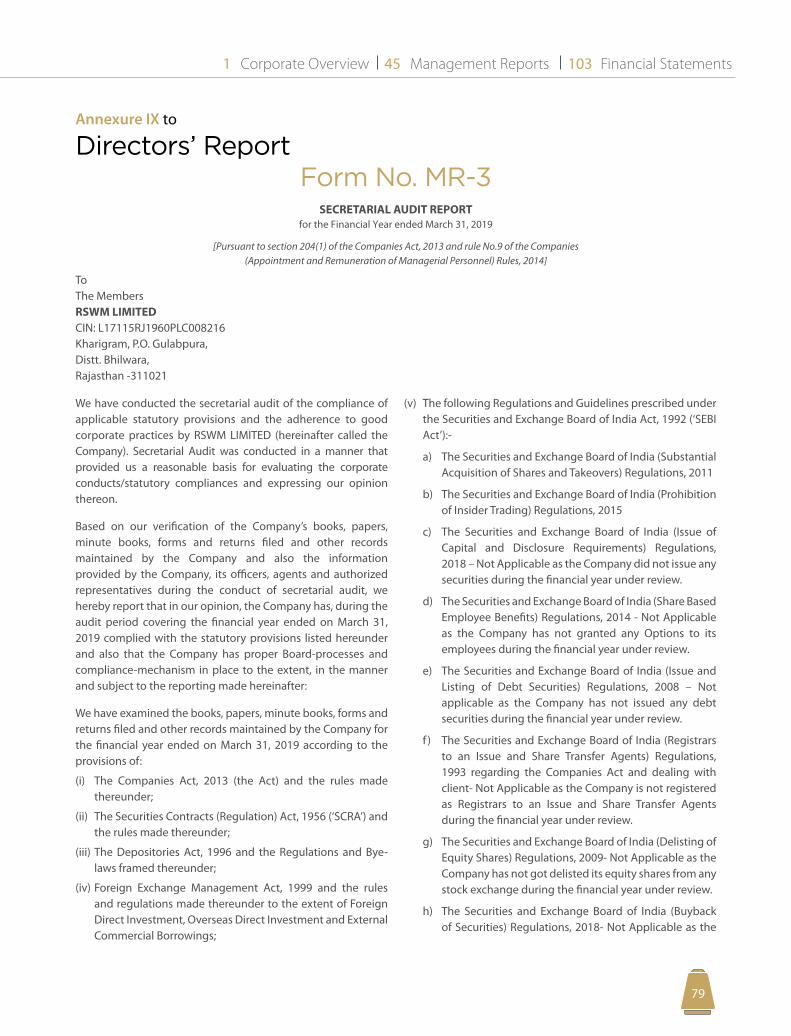
Corporate Overview Management Reports Financial Statements1 45 103
7978
Annexure IX to
Directors’ Report
We have conducted the secretarial audit of the compliance of applicable statutory provisions and the adherence to good corporate practices by RSWM LIMITED (hereinafter called the Company). Secretarial Audit was conducted in a manner that provided us a reasonable basis for evaluating the corporate conducts/statutory compliances and expressing our opinion thereon.
Based on our verification of the Company’s books, papers, minute books, forms and returns filed and other records maintained by the Company and also the information provided by the Company, its officers, agents and authorized representatives during the conduct of secretarial audit, we hereby report that in our opinion, the Company has, during the audit period covering the financial year ended on March 31, 2019 complied with the statutory provisions listed hereunder and also that the Company has proper Board-processes and compliance-mechanism in place to the extent, in the manner and subject to the reporting made hereinafter:
We have examined the books, papers, minute books, forms and returns filed and other records maintained by the Company for the financial year ended on March 31, 2019 according to the provisions of:
(i) The Companies Act, 2013 (the Act) and the rules made thereunder;
(ii) The Securities Contracts (Regulation) Act, 1956 (‘SCRA’) and the rules made thereunder;
(iii) The Depositories Act, 1996 and the Regulations and Bye-laws framed thereunder;
(iv) Foreign Exchange Management Act, 1999 and the rules and regulations made thereunder to the extent of Foreign Direct Investment, Overseas Direct Investment and External Commercial Borrowings;
(v) The following Regulations and Guidelines prescribed under the Securities and Exchange Board of India Act, 1992 (‘SEBI Act’):-
a) The Securities and Exchange Board of India (Substantial Acquisition of Shares and Takeovers) Regulations, 2011
b) The Securities and Exchange Board of India (Prohibition of Insider Trading) Regulations, 2015
c) The Securities and Exchange Board of India (Issue of Capital and Disclosure Requirements) Regulations, 2018 – Not Applicable as the Company did not issue any securities during the financial year under review.
d) The Securities and Exchange Board of India (Share Based Employee Benefits) Regulations, 2014 - Not Applicable as the Company has not granted any Options to its employees during the financial year under review.
e) The Securities and Exchange Board of India (Issue and Listing of Debt Securities) Regulations, 2008 – Not applicable as the Company has not issued any debt securities during the financial year under review.
f ) The Securities and Exchange Board of India (Registrars to an Issue and Share Transfer Agents) Regulations, 1993 regarding the Companies Act and dealing with client- Not Applicable as the Company is not registered as Registrars to an Issue and Share Transfer Agents during the financial year under review.
g) The Securities and Exchange Board of India (Delisting of Equity Shares) Regulations, 2009- Not Applicable as the Company has not got delisted its equity shares from any stock exchange during the financial year under review.
h) The Securities and Exchange Board of India (Buyback of Securities) Regulations, 2018- Not Applicable as the
Form No. MR-3SECRETARIAL AUDIT REPORT
for the Financial Year ended March 31, 2019
[Pursuant to section 204(1) of the Companies Act, 2013 and rule No.9 of the Companies (Appointment and Remuneration of Managerial Personnel) Rules, 2014]
ToThe MembersRSWM LIMITEDCIN: L17115RJ1960PLC008216Kharigram, P.O. Gulabpura,Distt. Bhilwara,Rajasthan -311021
ANNUAL REPORT20 1819
8180
Company has not bought back any of its securities during the financial year under review.
(vi) The management has identified and informed the following laws as being specifically applicable to the Company:
1. Textile Committee Act, 1963
2. Cotton Textile Order,1986
3. Textile ( Development and Regulation) order, 2001 under Bureau of Indian Standard Act, 1986
We have also examined compliance with the applicable clauses of the following:
(i) Secretarial Standards issued by The Institute of Company Secretaries of India
(ii) The Listing Agreement entered into by the Company with National Stock Exchange of India Limited and BSE Limited and SEBI (Listing Obligations and Disclosure Requirements) Regulations, 2015
During the period under review the Company has complied with the provisions of the Act, Rules, Regulations, Guidelines, Standards etc. mentioned above subject to the following observation:
The Company was required to spend on D236.88 Lakhs on identified CSR activities as mentioned in Schedule VII, pursuant to Section 135(5) of the Companies Act, 2013. Out of above stated amount, Company spent D174.80 lakhs during the year.
We further report that
The Board of Directors of the Company is duly constituted with proper balance of Executive Directors, Non-Executive Directors and Independent Directors. The changes in the composition of
the Board of Directors that took place during the period under review were carried out in compliance with the provisions of the Act.
Adequate notice is given to all Directors to schedule the Board Meetings, agenda and detailed notes on agenda were sent at least seven days in advance and a system exists for seeking and obtaining further information and clarifications on the agenda items before the meeting and for meaningful participation at the meeting.
All decision at Board Meeting and Committee meetings are carried out unanimously and the views of dissenting members, if any, are captured and recorded as part of the minutes of Board of Directors or Committees of the Board, as the case may be.
We further report that based on the compliance mechanism established by the Company and on the basis of the Certificates issued by the Managing Director & CEO and CFO and taken on record by the Board of Directors at their meeting(s), we are of the opinion that the management has adequate systems and processes in the Company commensurate with the size and operations of the Company to monitor and ensure compliance with applicable laws, rules, regulations and guidelines.
We further report that during the audit period no major actions having a bearing on the Company’s affairs in pursuance of the above referred laws, rules, regulations, guidelines, standards etc. above taken place.
Place: Delhi For Mahesh Gupta and CompanyDate: May 21, 2019 Company Secretaries
Mahesh Kumar Gupta Proprietor FCS No.: 2870 C P No.: 1999
This report is to be read with our letter of even date which is annexed as ‘Annexure –A” and forms an integral part of this report.
Corporate Overview Management Reports Financial Statements1 45 103
8180
To
The Members
RSWM LIMITED
CIN: L17115RJ1960PLC008216
Kharigram, P.O. Gulabpura,
Distt. Bhilwara,
Rajasthan -311021
Our report of even date is to be read along with this letter.
1) Maintenance of secretarial records is the responsibility of the management of the Company. Our responsibility is to express an opinion on these Secretarial records based on our audit.
2) We have followed the audit practices and processes as were appropriate to obtain reasonable assurance about the correctness of the contents of the Secretarial records. The verifications were done on test basis to ensure that correct facts are reflected in secretarial records. We believe that the processes and practices, we followed provide a reasonable basis for our opinion.
3) We have not verified the correctness and appropriateness of financial records and Books of Accounts of the Company.
ANNEXURE - A
4) The compliance of the provisions of Corporate and other applicable laws, rules, regulations, standards is the responsibility of the management. Our examination was limited to the verification of procedures on test basis.
5) Wherever required, we have obtained the management’s representation about the compliance of laws, rules and regulations and happening of events etc.
6) The secretarial Audit report is neither an assurance as to the future viability of the Company nor of the efficiency or effectiveness with which the management has conducted the affairs of the Company.
Place: Delhi For Mahesh Gupta and CompanyDate: May 21, 2019 Company Secretaries
Mahesh Kumar Gupta Proprietor FCS No.: 2870 C P No.: 1999
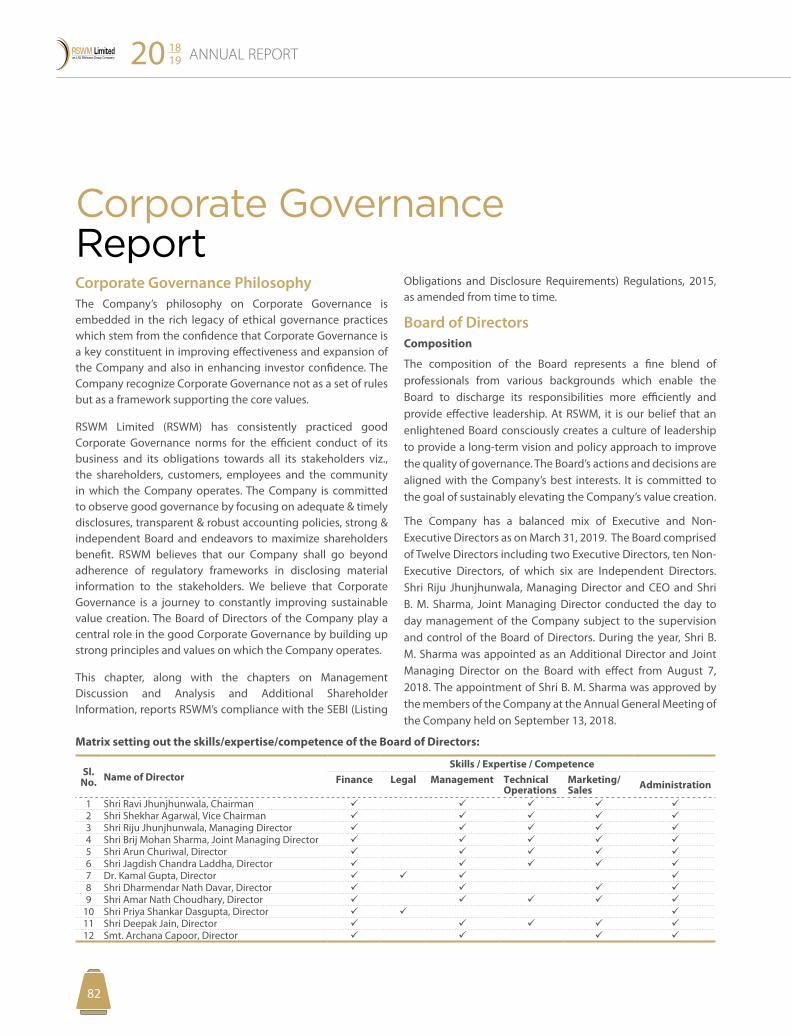
ANNUAL REPORT20 1819
8382
Corporate Governance ReportCorporate Governance PhilosophyThe Company’s philosophy on Corporate Governance is embedded in the rich legacy of ethical governance practices which stem from the confidence that Corporate Governance is a key constituent in improving effectiveness and expansion of the Company and also in enhancing investor confidence. The Company recognize Corporate Governance not as a set of rules but as a framework supporting the core values.
RSWM Limited (RSWM) has consistently practiced good Corporate Governance norms for the efficient conduct of its business and its obligations towards all its stakeholders viz., the shareholders, customers, employees and the community in which the Company operates. The Company is committed to observe good governance by focusing on adequate & timely disclosures, transparent & robust accounting policies, strong & independent Board and endeavors to maximize shareholders benefit. RSWM believes that our Company shall go beyond adherence of regulatory frameworks in disclosing material information to the stakeholders. We believe that Corporate Governance is a journey to constantly improving sustainable value creation. The Board of Directors of the Company play a central role in the good Corporate Governance by building up strong principles and values on which the Company operates.
This chapter, along with the chapters on Management Discussion and Analysis and Additional Shareholder Information, reports RSWM’s compliance with the SEBI (Listing
Obligations and Disclosure Requirements) Regulations, 2015, as amended from time to time.
Board of DirectorsComposition
The composition of the Board represents a fine blend of professionals from various backgrounds which enable the Board to discharge its responsibilities more efficiently and provide effective leadership. At RSWM, it is our belief that an enlightened Board consciously creates a culture of leadership to provide a long-term vision and policy approach to improve the quality of governance. The Board’s actions and decisions are aligned with the Company’s best interests. It is committed to the goal of sustainably elevating the Company’s value creation.
The Company has a balanced mix of Executive and Non-Executive Directors as on March 31, 2019. The Board comprised of Twelve Directors including two Executive Directors, ten Non-Executive Directors, of which six are Independent Directors. Shri Riju Jhunjhunwala, Managing Director and CEO and Shri B. M. Sharma, Joint Managing Director conducted the day to day management of the Company subject to the supervision and control of the Board of Directors. During the year, Shri B. M. Sharma was appointed as an Additional Director and Joint Managing Director on the Board with effect from August 7, 2018. The appointment of Shri B. M. Sharma was approved by the members of the Company at the Annual General Meeting of the Company held on September 13, 2018.
Matrix setting out the skills/expertise/competence of the Board of Directors:
Sl. No. Name of Director
Skills / Expertise / CompetenceFinance Legal Management Technical
OperationsMarketing/ Sales Administration
1 Shri Ravi Jhunjhunwala, Chairman 2 Shri Shekhar Agarwal, Vice Chairman 3 Shri Riju Jhunjhunwala, Managing Director 4 Shri Brij Mohan Sharma, Joint Managing Director 5 Shri Arun Churiwal, Director 6 Shri Jagdish Chandra Laddha, Director 7 Dr. Kamal Gupta, Director 8 Shri Dharmendar Nath Davar, Director 9 Shri Amar Nath Choudhary, Director
10 Shri Priya Shankar Dasgupta, Director 11 Shri Deepak Jain, Director 12 Smt. Archana Capoor, Director
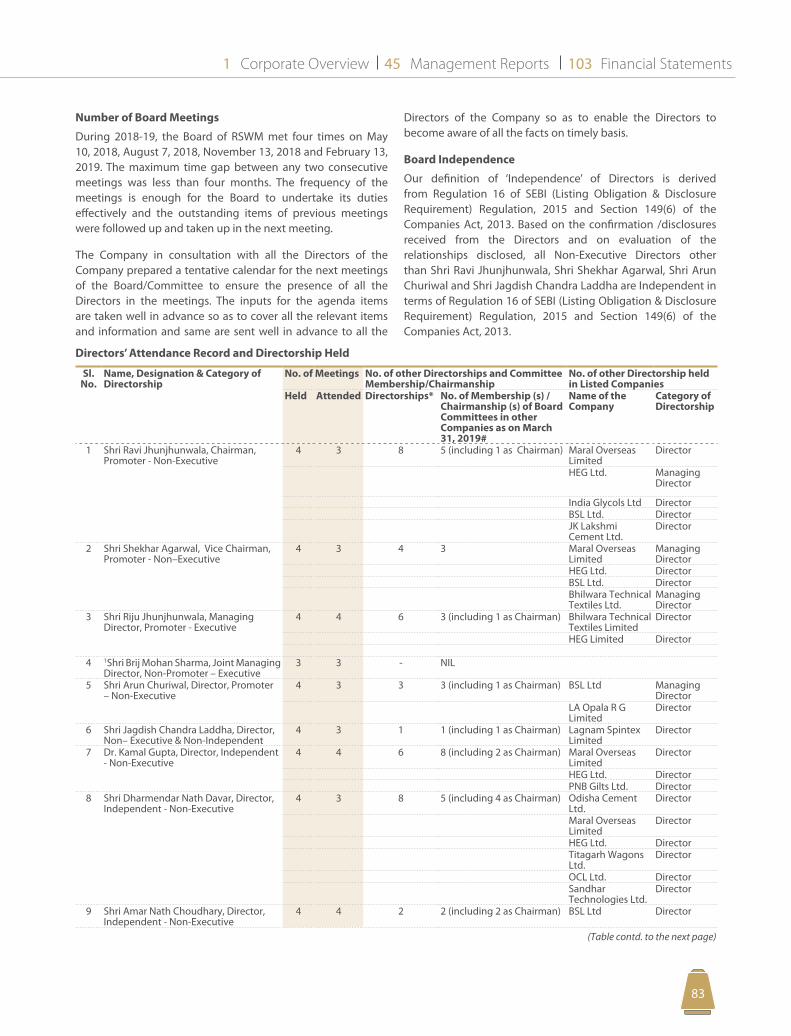
Corporate Overview Management Reports Financial Statements1 45 103
8382
Number of Board Meetings
During 2018-19, the Board of RSWM met four times on May 10, 2018, August 7, 2018, November 13, 2018 and February 13, 2019. The maximum time gap between any two consecutive meetings was less than four months. The frequency of the meetings is enough for the Board to undertake its duties effectively and the outstanding items of previous meetings were followed up and taken up in the next meeting.
The Company in consultation with all the Directors of the Company prepared a tentative calendar for the next meetings of the Board/Committee to ensure the presence of all the Directors in the meetings. The inputs for the agenda items are taken well in advance so as to cover all the relevant items and information and same are sent well in advance to all the
Directors of the Company so as to enable the Directors to become aware of all the facts on timely basis.
Board Independence
Our definition of ‘Independence’ of Directors is derived from Regulation 16 of SEBI (Listing Obligation & Disclosure Requirement) Regulation, 2015 and Section 149(6) of the Companies Act, 2013. Based on the confirmation /disclosures received from the Directors and on evaluation of the relationships disclosed, all Non-Executive Directors other than Shri Ravi Jhunjhunwala, Shri Shekhar Agarwal, Shri Arun Churiwal and Shri Jagdish Chandra Laddha are Independent in terms of Regulation 16 of SEBI (Listing Obligation & Disclosure Requirement) Regulation, 2015 and Section 149(6) of the Companies Act, 2013.
Directors’ Attendance Record and Directorship Held
Sl. No.
Name, Designation & Category of Directorship
No. of Meetings No. of other Directorships and Committee Membership/Chairmanship
No. of other Directorship held in Listed Companies
Held Attended Directorships* No. of Membership (s) / Chairmanship (s) of Board Committees in other Companies as on March 31, 2019#
Name of the Company
Category of Directorship
1 Shri Ravi Jhunjhunwala, Chairman, Promoter - Non-Executive
4 3 8 5 (including 1 as Chairman) Maral Overseas Limited
Director
HEG Ltd. Managing Director
India Glycols Ltd DirectorBSL Ltd. DirectorJK Lakshmi Cement Ltd.
Director
2 Shri Shekhar Agarwal, Vice Chairman, Promoter - Non–Executive
4 3 4 3 Maral Overseas Limited
Managing Director
HEG Ltd. DirectorBSL Ltd. DirectorBhilwara Technical Textiles Ltd.
Managing Director
3 Shri Riju Jhunjhunwala, Managing Director, Promoter - Executive
4 4 6 3 (including 1 as Chairman) Bhilwara Technical Textiles Limited
Director
HEG Limited Director
4 1Shri Brij Mohan Sharma, Joint Managing Director, Non-Promoter – Executive
3 3 - NIL
5 Shri Arun Churiwal, Director, Promoter – Non-Executive
4 3 3 3 (including 1 as Chairman) BSL Ltd Managing Director
LA Opala R G Limited
Director
6 Shri Jagdish Chandra Laddha, Director, Non– Executive & Non-Independent
4 3 1 1 (including 1 as Chairman) Lagnam Spintex Limited
Director
7 Dr. Kamal Gupta, Director, Independent - Non-Executive
4 4 6 8 (including 2 as Chairman) Maral Overseas Limited
Director
HEG Ltd. DirectorPNB Gilts Ltd. Director
8 Shri Dharmendar Nath Davar, Director, Independent - Non-Executive
4 3 8 5 (including 4 as Chairman) Odisha Cement Ltd.
Director
Maral Overseas Limited
Director
HEG Ltd. DirectorTitagarh Wagons Ltd.
Director
OCL Ltd. DirectorSandhar Technologies Ltd.
Director
9 Shri Amar Nath Choudhary, Director, Independent - Non-Executive
4 4 2 2 (including 2 as Chairman) BSL Ltd Director
(Table contd. to the next page)
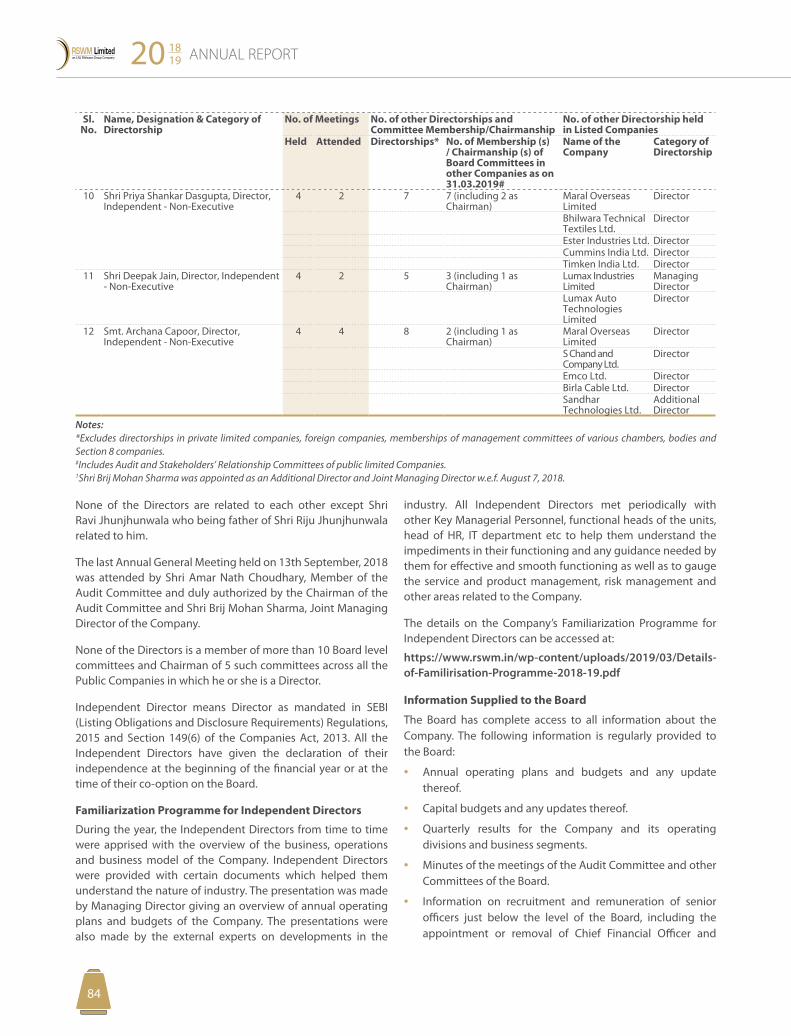
ANNUAL REPORT20 1819
8584
Sl. No.
Name, Designation & Category of Directorship
No. of Meetings No. of other Directorships and Committee Membership/Chairmanship
No. of other Directorship held in Listed Companies
Held Attended Directorships* No. of Membership (s) / Chairmanship (s) of Board Committees in other Companies as on 31.03.2019#
Name of the Company
Category of Directorship
10 Shri Priya Shankar Dasgupta, Director, Independent - Non-Executive
4 2 7 7 (including 2 as Chairman)
Maral Overseas Limited
Director
Bhilwara Technical Textiles Ltd.
Director
Ester Industries Ltd. DirectorCummins India Ltd. DirectorTimken India Ltd. Director
11 Shri Deepak Jain, Director, Independent - Non-Executive
4 2 5 3 (including 1 as Chairman)
Lumax Industries Limited
Managing Director
Lumax Auto Technologies Limited
Director
12 Smt. Archana Capoor, Director, Independent - Non-Executive
4 4 8 2 (including 1 as Chairman)
Maral Overseas Limited
Director
S Chand and Company Ltd.
Director
Emco Ltd. DirectorBirla Cable Ltd. DirectorSandhar Technologies Ltd.
Additional Director
Notes: *Excludes directorships in private limited companies, foreign companies, memberships of management committees of various chambers, bodies and Section 8 companies.#Includes Audit and Stakeholders’ Relationship Committees of public limited Companies.1Shri Brij Mohan Sharma was appointed as an Additional Director and Joint Managing Director w.e.f. August 7, 2018.
None of the Directors are related to each other except Shri Ravi Jhunjhunwala who being father of Shri Riju Jhunjhunwala related to him.
The last Annual General Meeting held on 13th September, 2018 was attended by Shri Amar Nath Choudhary, Member of the Audit Committee and duly authorized by the Chairman of the Audit Committee and Shri Brij Mohan Sharma, Joint Managing Director of the Company.
None of the Directors is a member of more than 10 Board level committees and Chairman of 5 such committees across all the Public Companies in which he or she is a Director.
Independent Director means Director as mandated in SEBI (Listing Obligations and Disclosure Requirements) Regulations, 2015 and Section 149(6) of the Companies Act, 2013. All the Independent Directors have given the declaration of their independence at the beginning of the financial year or at the time of their co-option on the Board.
Familiarization Programme for Independent Directors
During the year, the Independent Directors from time to time were apprised with the overview of the business, operations and business model of the Company. Independent Directors were provided with certain documents which helped them understand the nature of industry. The presentation was made by Managing Director giving an overview of annual operating plans and budgets of the Company. The presentations were also made by the external experts on developments in the
industry. All Independent Directors met periodically with other Key Managerial Personnel, functional heads of the units, head of HR, IT department etc to help them understand the impediments in their functioning and any guidance needed by them for effective and smooth functioning as well as to gauge the service and product management, risk management and other areas related to the Company.
The details on the Company’s Familiarization Programme for Independent Directors can be accessed at:
https://www.rswm.in/wp-content/uploads/2019/03/Details-of-Familirisation-Programme-2018-19.pdf
Information Supplied to the Board
The Board has complete access to all information about the Company. The following information is regularly provided to the Board:
• Annual operating plans and budgets and any update thereof.
• Capital budgets and any updates thereof.
• Quarterly results for the Company and its operating divisions and business segments.
• Minutes of the meetings of the Audit Committee and other Committees of the Board.
• Information on recruitment and remuneration of senior officers just below the level of the Board, including the appointment or removal of Chief Financial Officer and
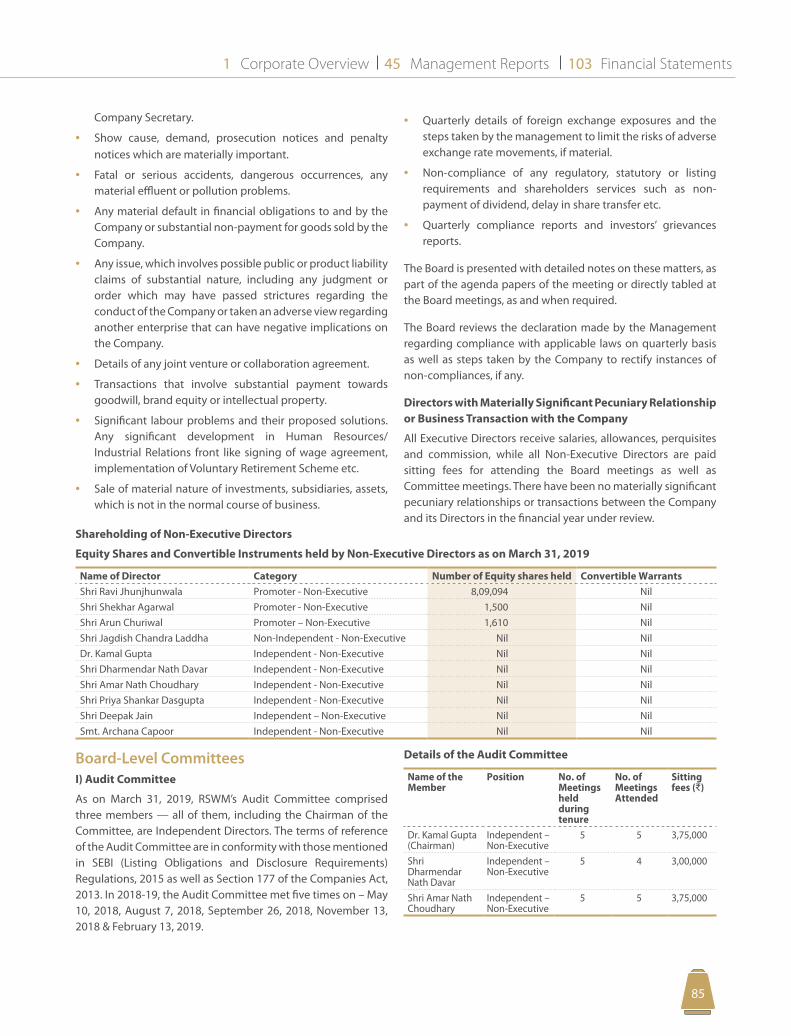
Corporate Overview Management Reports Financial Statements1 45 103
8584
Company Secretary.
• Show cause, demand, prosecution notices and penalty notices which are materially important.
• Fatal or serious accidents, dangerous occurrences, any material effluent or pollution problems.
• Any material default in financial obligations to and by the Company or substantial non-payment for goods sold by the Company.
• Any issue, which involves possible public or product liability claims of substantial nature, including any judgment or order which may have passed strictures regarding the conduct of the Company or taken an adverse view regarding another enterprise that can have negative implications on the Company.
• Details of any joint venture or collaboration agreement.
• Transactions that involve substantial payment towards goodwill, brand equity or intellectual property.
• Significant labour problems and their proposed solutions. Any significant development in Human Resources/Industrial Relations front like signing of wage agreement, implementation of Voluntary Retirement Scheme etc.
• Sale of material nature of investments, subsidiaries, assets, which is not in the normal course of business.
• Quarterly details of foreign exchange exposures and the steps taken by the management to limit the risks of adverse exchange rate movements, if material.
• Non-compliance of any regulatory, statutory or listing requirements and shareholders services such as non-payment of dividend, delay in share transfer etc.
• Quarterly compliance reports and investors’ grievances reports.
The Board is presented with detailed notes on these matters, as part of the agenda papers of the meeting or directly tabled at the Board meetings, as and when required.
The Board reviews the declaration made by the Management regarding compliance with applicable laws on quarterly basis as well as steps taken by the Company to rectify instances of non-compliances, if any.
Directors with Materially Significant Pecuniary Relationship or Business Transaction with the Company
All Executive Directors receive salaries, allowances, perquisites and commission, while all Non-Executive Directors are paid sitting fees for attending the Board meetings as well as Committee meetings. There have been no materially significant pecuniary relationships or transactions between the Company and its Directors in the financial year under review.
Shareholding of Non-Executive Directors
Equity Shares and Convertible Instruments held by Non-Executive Directors as on March 31, 2019
Name of Director Category Number of Equity shares held Convertible WarrantsShri Ravi Jhunjhunwala Promoter - Non-Executive 8,09,094 NilShri Shekhar Agarwal Promoter - Non-Executive 1,500 NilShri Arun Churiwal Promoter – Non-Executive 1,610 NilShri Jagdish Chandra Laddha Non-Independent - Non-Executive Nil NilDr. Kamal Gupta Independent - Non-Executive Nil NilShri Dharmendar Nath Davar Independent - Non-Executive Nil NilShri Amar Nath Choudhary Independent - Non-Executive Nil NilShri Priya Shankar Dasgupta Independent - Non-Executive Nil NilShri Deepak Jain Independent – Non-Executive Nil NilSmt. Archana Capoor Independent - Non-Executive Nil Nil
Board-Level CommitteesI) Audit Committee
As on March 31, 2019, RSWM’s Audit Committee comprised three members — all of them, including the Chairman of the Committee, are Independent Directors. The terms of reference of the Audit Committee are in conformity with those mentioned in SEBI (Listing Obligations and Disclosure Requirements) Regulations, 2015 as well as Section 177 of the Companies Act, 2013. In 2018-19, the Audit Committee met five times on – May 10, 2018, August 7, 2018, September 26, 2018, November 13, 2018 & February 13, 2019.
Details of the Audit Committee
Name of the Member
Position No. of Meetings held during tenure
No. of Meetings Attended
Sitting fees (D)
Dr. Kamal Gupta (Chairman)
Independent – Non-Executive
5 5 3,75,000
Shri Dharmendar Nath Davar
Independent – Non-Executive
5 4 3,00,000
Shri Amar Nath Choudhary
Independent – Non-Executive
5 5 3,75,000
ANNUAL REPORT20 1819
8786
Shri Surender Gupta, the Company Secretary, is also the Secretary to the Committee. Invitees to the Audit Committee include the Chairman, Vice Chairman, Managing Director & Chief Executive Officer, Joint Managing Director, Chief Financial Officer, Chief Operating Officers, Chief Coordinator – Internal Audit and the representatives of the Statutory and the Internal Auditors.
Dr. Kamal Gupta, Chairman of the Audit Committee possesses high degree of accounting and financial management expertise and all other Members of the Committee have rich experience and sound accounting and financial knowledge. Shri Amar Nath Choudhary, Member of the Audit Committee attended the Annual General Meeting held on 13th September, 2018 and was available to answer shareholders’ queries.
Company has performed all functions mentioned in the terms of reference of the Audit Committee as listed in the Companies Act, 2013 and under SEBI (Listing Obligations and Disclosure Requirements) Regulations, 2015.
The roles of the Audit Committee include the following:
• Oversight of the Company’s financial reporting process and the disclosure of its financial information to ensure that the financial statement is correct, sufficient and credible.
• Recommendation for appointment, remuneration and terms of appointment of auditors of the Company.
• Approval of payment to statutory auditors for any other services rendered by the statutory auditors.
• Reviewing, with the management, the annual financial statements and auditor’s report thereon before submission to the board for approval, with particular reference to:
(a) matters required to be included in the director’s responsibility statement to be included in the board’s report in terms of clause (c) of sub-section (3) of Section 134 of the Companies Act, 2013;
(b) changes, if any, in accounting policies and practices and reasons for the same;
(c) major accounting entries involving estimates based on the exercise of judgment by management;
(d) significant adjustments made in the financial statements arising out of audit findings;
(e) compliance with listing and other legal requirements relating to financial statements;
(f ) disclosure of any related party transactions;
(g) modified opinion(s) in the draft audit report
• Reviewing, with the management, the quarterly financial statements before submission to the Board for approval.
• Reviewing, with the management, the statement of uses /
application of funds raised through an issue (public issue, rights issue, preferential issue, etc.), the statement of funds utilized for purposes other than those stated in the offer document/prospectus/notice and the report submitted by the monitoring agency monitoring the utilisation of proceeds of a public or rights issue and making appropriate recommendations to the Board to take up steps in this matter.
• Review and monitor the auditors’ independence and performance, and effectiveness of audit process.
• Approval or any subsequent modification of transactions of the Company with related parties
• Scrutiny of inter-corporate loans and investments.
• Valuation of undertakings or assets of the company, wherever it is necessary.
• Evaluation of internal financial controls and risk management systems.
• Reviewing, with the management, performance of statutory and internal auditors and adequacy of the internal control systems.
• Reviewing the adequacy of internal audit function, if any, including the structure of the internal audit department, staffing and seniority of the official heading the department, reporting structure coverage and frequency of internal audit.
• Discussion with internal auditors any significant findings and follow up there on.
• Reviewing the findings of any internal investigations by the internal auditors into matters where there is suspected fraud or irregularity or a failure of internal control systems of a material nature and reporting the matter to the Board.
• Discussion with statutory auditors before the audit commences, about the nature and scope of audit as well as post-audit discussion to ascertain any area of concern.
• To look into the reasons for substantial defaults in the payment to the depositors, debenture holders, shareholders (in case of nonpayment of declared dividends) and creditors.
• To review the functioning of the Whistle Blower Mechanism.
• Approval of appointment of Chief Financial Officer after assessing the qualifications, experience & background, etc. of the candidate.
• Carrying out any other function as is mentioned in the terms of reference of the Audit Committee.
RSWM has systems and procedures in place to ensure that the Audit Committee mandatorily reviews:
• Management Discussion and Analysis of the financial condition and results of operations of the Company.
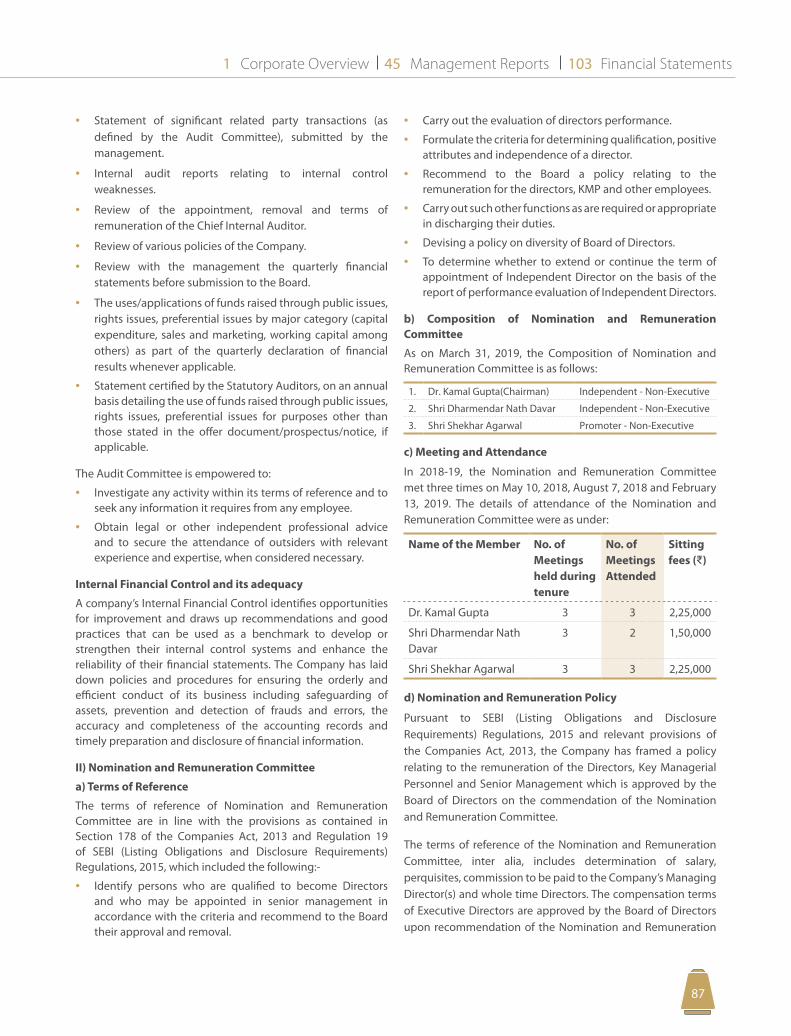
Corporate Overview Management Reports Financial Statements1 45 103
8786
• Statement of significant related party transactions (as defined by the Audit Committee), submitted by the management.
• Internal audit reports relating to internal control weaknesses.
• Review of the appointment, removal and terms of remuneration of the Chief Internal Auditor.
• Review of various policies of the Company.
• Review with the management the quarterly financial statements before submission to the Board.
• The uses/applications of funds raised through public issues, rights issues, preferential issues by major category (capital expenditure, sales and marketing, working capital among others) as part of the quarterly declaration of financial results whenever applicable.
• Statement certified by the Statutory Auditors, on an annual basis detailing the use of funds raised through public issues, rights issues, preferential issues for purposes other than those stated in the offer document/prospectus/notice, if applicable.
The Audit Committee is empowered to:
• Investigate any activity within its terms of reference and to seek any information it requires from any employee.
• Obtain legal or other independent professional advice and to secure the attendance of outsiders with relevant experience and expertise, when considered necessary.
Internal Financial Control and its adequacy
A company’s Internal Financial Control identifies opportunities for improvement and draws up recommendations and good practices that can be used as a benchmark to develop or strengthen their internal control systems and enhance the reliability of their financial statements. The Company has laid down policies and procedures for ensuring the orderly and efficient conduct of its business including safeguarding of assets, prevention and detection of frauds and errors, the accuracy and completeness of the accounting records and timely preparation and disclosure of financial information.
II) Nomination and Remuneration Committee
a) Terms of Reference
The terms of reference of Nomination and Remuneration Committee are in line with the provisions as contained in Section 178 of the Companies Act, 2013 and Regulation 19 of SEBI (Listing Obligations and Disclosure Requirements) Regulations, 2015, which included the following:-
• Identify persons who are qualified to become Directors and who may be appointed in senior management in accordance with the criteria and recommend to the Board their approval and removal.
• Carry out the evaluation of directors performance.
• Formulate the criteria for determining qualification, positive attributes and independence of a director.
• Recommend to the Board a policy relating to the remuneration for the directors, KMP and other employees.
• Carry out such other functions as are required or appropriate in discharging their duties.
• Devising a policy on diversity of Board of Directors.
• To determine whether to extend or continue the term of appointment of Independent Director on the basis of the report of performance evaluation of Independent Directors.
b) Composition of Nomination and Remuneration Committee
As on March 31, 2019, the Composition of Nomination and Remuneration Committee is as follows:
1. Dr. Kamal Gupta(Chairman) Independent - Non-Executive
2. Shri Dharmendar Nath Davar Independent - Non-Executive
3. Shri Shekhar Agarwal Promoter - Non-Executive
c) Meeting and Attendance
In 2018-19, the Nomination and Remuneration Committee met three times on May 10, 2018, August 7, 2018 and February 13, 2019. The details of attendance of the Nomination and Remuneration Committee were as under:
Name of the Member No. of Meetings held during tenure
No. of Meetings Attended
Sitting fees (D)
Dr. Kamal Gupta 3 3 2,25,000
Shri Dharmendar Nath Davar
3 2 1,50,000
Shri Shekhar Agarwal 3 3 2,25,000
d) Nomination and Remuneration Policy
Pursuant to SEBI (Listing Obligations and Disclosure Requirements) Regulations, 2015 and relevant provisions of the Companies Act, 2013, the Company has framed a policy relating to the remuneration of the Directors, Key Managerial Personnel and Senior Management which is approved by the Board of Directors on the commendation of the Nomination and Remuneration Committee.
The terms of reference of the Nomination and Remuneration Committee, inter alia, includes determination of salary, perquisites, commission to be paid to the Company’s Managing Director(s) and whole time Directors. The compensation terms of Executive Directors are approved by the Board of Directors upon recommendation of the Nomination and Remuneration
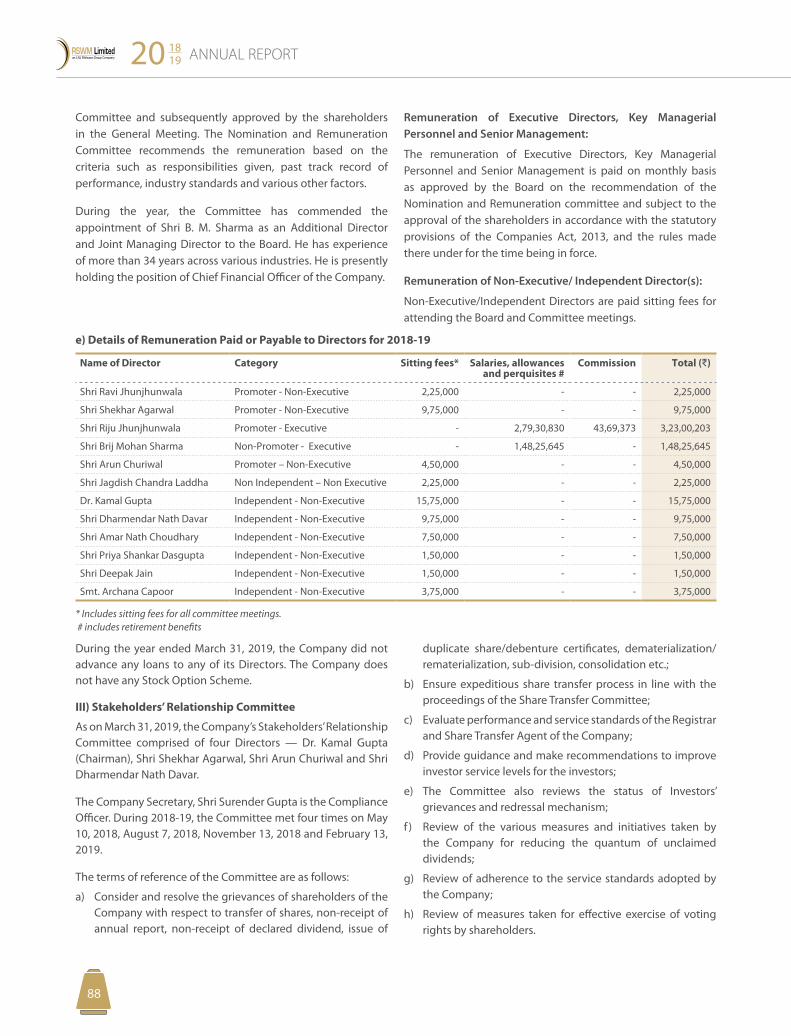
ANNUAL REPORT20 1819
8988
e) Details of Remuneration Paid or Payable to Directors for 2018-19
Name of Director Category Sitting fees* Salaries, allowances and perquisites #
Commission Total (D)
Shri Ravi Jhunjhunwala Promoter - Non-Executive 2,25,000 - - 2,25,000
Shri Shekhar Agarwal Promoter - Non-Executive 9,75,000 - - 9,75,000
Shri Riju Jhunjhunwala Promoter - Executive - 2,79,30,830 43,69,373 3,23,00,203
Shri Brij Mohan Sharma Non-Promoter - Executive - 1,48,25,645 - 1,48,25,645
Shri Arun Churiwal Promoter – Non-Executive 4,50,000 - - 4,50,000
Shri Jagdish Chandra Laddha Non Independent – Non Executive 2,25,000 - - 2,25,000
Dr. Kamal Gupta Independent - Non-Executive 15,75,000 - - 15,75,000
Shri Dharmendar Nath Davar Independent - Non-Executive 9,75,000 - - 9,75,000
Shri Amar Nath Choudhary Independent - Non-Executive 7,50,000 - - 7,50,000
Shri Priya Shankar Dasgupta Independent - Non-Executive 1,50,000 - - 1,50,000
Shri Deepak Jain Independent - Non-Executive 1,50,000 - - 1,50,000
Smt. Archana Capoor Independent - Non-Executive 3,75,000 - - 3,75,000
* Includes sitting fees for all committee meetings. # includes retirement benefits
During the year ended March 31, 2019, the Company did not advance any loans to any of its Directors. The Company does not have any Stock Option Scheme.
III) Stakeholders’ Relationship Committee
As on March 31, 2019, the Company’s Stakeholders’ Relationship Committee comprised of four Directors — Dr. Kamal Gupta (Chairman), Shri Shekhar Agarwal, Shri Arun Churiwal and Shri Dharmendar Nath Davar.
The Company Secretary, Shri Surender Gupta is the Compliance Officer. During 2018-19, the Committee met four times on May 10, 2018, August 7, 2018, November 13, 2018 and February 13, 2019.
The terms of reference of the Committee are as follows:
a) Consider and resolve the grievances of shareholders of the Company with respect to transfer of shares, non-receipt of annual report, non-receipt of declared dividend, issue of
duplicate share/debenture certificates, dematerialization/rematerialization, sub-division, consolidation etc.;
b) Ensure expeditious share transfer process in line with the proceedings of the Share Transfer Committee;
c) Evaluate performance and service standards of the Registrar and Share Transfer Agent of the Company;
d) Provide guidance and make recommendations to improve investor service levels for the investors;
e) The Committee also reviews the status of Investors’ grievances and redressal mechanism;
f ) Review of the various measures and initiatives taken by the Company for reducing the quantum of unclaimed dividends;
g) Review of adherence to the service standards adopted by the Company;
h) Review of measures taken for effective exercise of voting rights by shareholders.
Committee and subsequently approved by the shareholders in the General Meeting. The Nomination and Remuneration Committee recommends the remuneration based on the criteria such as responsibilities given, past track record of performance, industry standards and various other factors.
During the year, the Committee has commended the appointment of Shri B. M. Sharma as an Additional Director and Joint Managing Director to the Board. He has experience of more than 34 years across various industries. He is presently holding the position of Chief Financial Officer of the Company.
Remuneration of Executive Directors, Key Managerial Personnel and Senior Management:
The remuneration of Executive Directors, Key Managerial Personnel and Senior Management is paid on monthly basis as approved by the Board on the recommendation of the Nomination and Remuneration committee and subject to the approval of the shareholders in accordance with the statutory provisions of the Companies Act, 2013, and the rules made there under for the time being in force.
Remuneration of Non-Executive/ Independent Director(s):
Non-Executive/Independent Directors are paid sitting fees for attending the Board and Committee meetings.
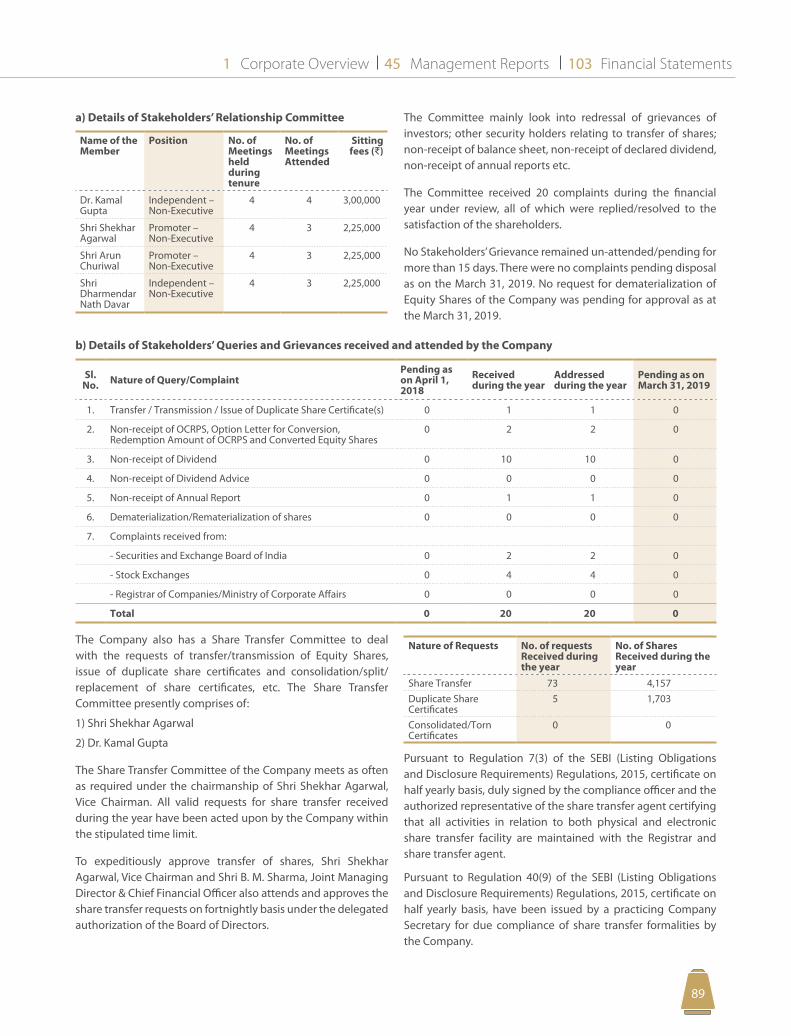
Corporate Overview Management Reports Financial Statements1 45 103
8988
a) Details of Stakeholders’ Relationship Committee
Name of the Member
Position No. of Meetings held during tenure
No. of Meetings Attended
Sitting fees (D)
Dr. Kamal Gupta
Independent – Non-Executive
4 4 3,00,000
Shri Shekhar Agarwal
Promoter – Non-Executive
4 3 2,25,000
Shri Arun Churiwal
Promoter – Non-Executive
4 3 2,25,000
Shri Dharmendar Nath Davar
Independent – Non-Executive
4 3 2,25,000
b) Details of Stakeholders’ Queries and Grievances received and attended by the Company
Sl. No. Nature of Query/Complaint
Pending as on April 1, 2018
Received during the year
Addressed during the year
Pending as on March 31, 2019
1. Transfer / Transmission / Issue of Duplicate Share Certificate(s) 0 1 1 0
2. Non-receipt of OCRPS, Option Letter for Conversion, Redemption Amount of OCRPS and Converted Equity Shares
0 2 2 0
3. Non-receipt of Dividend 0 10 10 0
4. Non-receipt of Dividend Advice 0 0 0 0
5. Non-receipt of Annual Report 0 1 1 0
6. Dematerialization/Rematerialization of shares 0 0 0 0
7. Complaints received from:
- Securities and Exchange Board of India 0 2 2 0
- Stock Exchanges 0 4 4 0
- Registrar of Companies/Ministry of Corporate Affairs 0 0 0 0
Total 0 20 20 0
The Committee mainly look into redressal of grievances of investors; other security holders relating to transfer of shares; non-receipt of balance sheet, non-receipt of declared dividend, non-receipt of annual reports etc.
The Committee received 20 complaints during the financial year under review, all of which were replied/resolved to the satisfaction of the shareholders.
No Stakeholders’ Grievance remained un-attended/pending for more than 15 days. There were no complaints pending disposal as on the March 31, 2019. No request for dematerialization of Equity Shares of the Company was pending for approval as at the March 31, 2019.
The Company also has a Share Transfer Committee to deal with the requests of transfer/transmission of Equity Shares, issue of duplicate share certificates and consolidation/split/replacement of share certificates, etc. The Share Transfer Committee presently comprises of:
1) Shri Shekhar Agarwal
2) Dr. Kamal Gupta
The Share Transfer Committee of the Company meets as often as required under the chairmanship of Shri Shekhar Agarwal, Vice Chairman. All valid requests for share transfer received during the year have been acted upon by the Company within the stipulated time limit.
To expeditiously approve transfer of shares, Shri Shekhar Agarwal, Vice Chairman and Shri B. M. Sharma, Joint Managing Director & Chief Financial Officer also attends and approves the share transfer requests on fortnightly basis under the delegated authorization of the Board of Directors.
Nature of Requests No. of requests Received during the year
No. of Shares Received during the year
Share Transfer 73 4,157Duplicate Share Certificates
5 1,703
Consolidated/Torn Certificates
0 0
Pursuant to Regulation 7(3) of the SEBI (Listing Obligations and Disclosure Requirements) Regulations, 2015, certificate on half yearly basis, duly signed by the compliance officer and the authorized representative of the share transfer agent certifying that all activities in relation to both physical and electronic share transfer facility are maintained with the Registrar and share transfer agent.
Pursuant to Regulation 40(9) of the SEBI (Listing Obligations and Disclosure Requirements) Regulations, 2015, certificate on half yearly basis, have been issued by a practicing Company Secretary for due compliance of share transfer formalities by the Company.
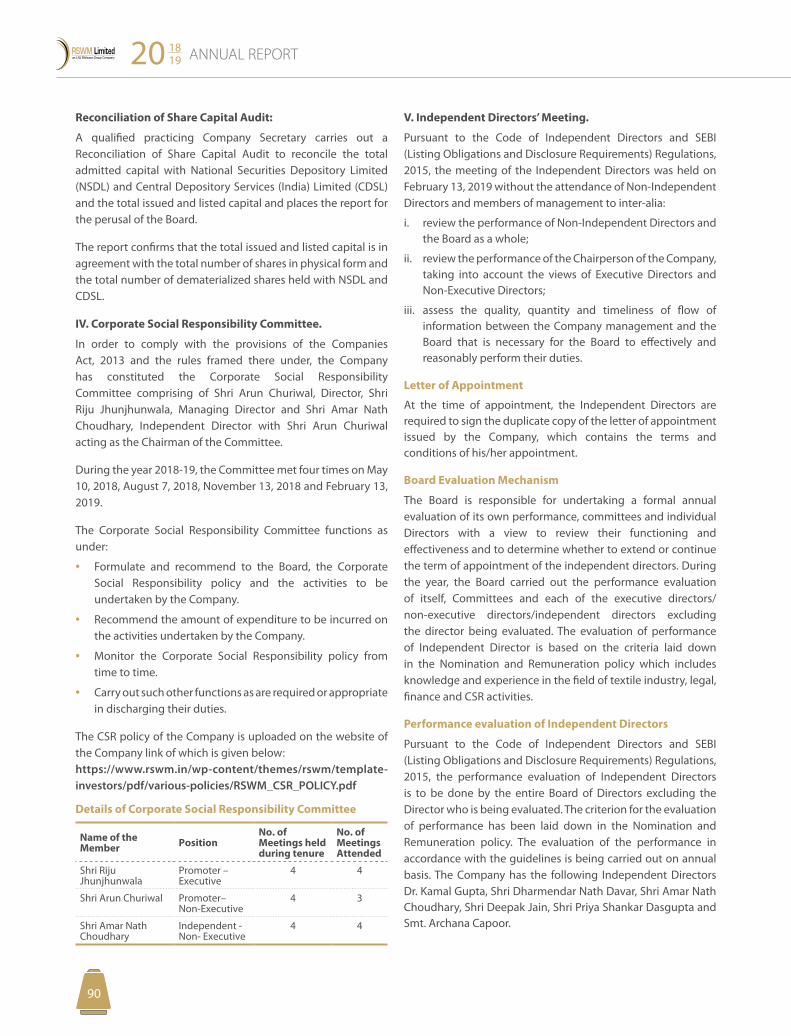
ANNUAL REPORT20 1819
9190
Reconciliation of Share Capital Audit:
A qualified practicing Company Secretary carries out a Reconciliation of Share Capital Audit to reconcile the total admitted capital with National Securities Depository Limited (NSDL) and Central Depository Services (India) Limited (CDSL) and the total issued and listed capital and places the report for the perusal of the Board.
The report confirms that the total issued and listed capital is in agreement with the total number of shares in physical form and the total number of dematerialized shares held with NSDL and CDSL.
IV. Corporate Social Responsibility Committee.
In order to comply with the provisions of the Companies Act, 2013 and the rules framed there under, the Company has constituted the Corporate Social Responsibility Committee comprising of Shri Arun Churiwal, Director, Shri Riju Jhunjhunwala, Managing Director and Shri Amar Nath Choudhary, Independent Director with Shri Arun Churiwal acting as the Chairman of the Committee.
During the year 2018-19, the Committee met four times on May 10, 2018, August 7, 2018, November 13, 2018 and February 13, 2019.
The Corporate Social Responsibility Committee functions as under:
• Formulate and recommend to the Board, the Corporate Social Responsibility policy and the activities to be undertaken by the Company.
• Recommend the amount of expenditure to be incurred on the activities undertaken by the Company.
• Monitor the Corporate Social Responsibility policy from time to time.
• Carry out such other functions as are required or appropriate in discharging their duties.
The CSR policy of the Company is uploaded on the website of the Company link of which is given below: https://www.rswm.in/wp-content/themes/rswm/template-investors/pdf/various-policies/RSWM_CSR_POLICY.pdf
Details of Corporate Social Responsibility Committee
Name of the Member Position
No. of Meetings held during tenure
No. of Meetings Attended
Shri Riju Jhunjhunwala
Promoter – Executive
4 4
Shri Arun Churiwal Promoter– Non-Executive
4 3
Shri Amar Nath Choudhary
Independent - Non- Executive
4 4
V. Independent Directors’ Meeting.
Pursuant to the Code of Independent Directors and SEBI (Listing Obligations and Disclosure Requirements) Regulations, 2015, the meeting of the Independent Directors was held on February 13, 2019 without the attendance of Non-Independent Directors and members of management to inter-alia:
i. review the performance of Non-Independent Directors and the Board as a whole;
ii. review the performance of the Chairperson of the Company, taking into account the views of Executive Directors and Non-Executive Directors;
iii. assess the quality, quantity and timeliness of flow of information between the Company management and the Board that is necessary for the Board to effectively and reasonably perform their duties.
Letter of Appointment
At the time of appointment, the Independent Directors are required to sign the duplicate copy of the letter of appointment issued by the Company, which contains the terms and conditions of his/her appointment.
Board Evaluation Mechanism
The Board is responsible for undertaking a formal annual evaluation of its own performance, committees and individual Directors with a view to review their functioning and effectiveness and to determine whether to extend or continue the term of appointment of the independent directors. During the year, the Board carried out the performance evaluation of itself, Committees and each of the executive directors/non-executive directors/independent directors excluding the director being evaluated. The evaluation of performance of Independent Director is based on the criteria laid down in the Nomination and Remuneration policy which includes knowledge and experience in the field of textile industry, legal, finance and CSR activities.
Performance evaluation of Independent Directors
Pursuant to the Code of Independent Directors and SEBI (Listing Obligations and Disclosure Requirements) Regulations, 2015, the performance evaluation of Independent Directors is to be done by the entire Board of Directors excluding the Director who is being evaluated. The criterion for the evaluation of performance has been laid down in the Nomination and Remuneration policy. The evaluation of the performance in accordance with the guidelines is being carried out on annual basis. The Company has the following Independent Directors Dr. Kamal Gupta, Shri Dharmendar Nath Davar, Shri Amar Nath Choudhary, Shri Deepak Jain, Shri Priya Shankar Dasgupta and Smt. Archana Capoor.
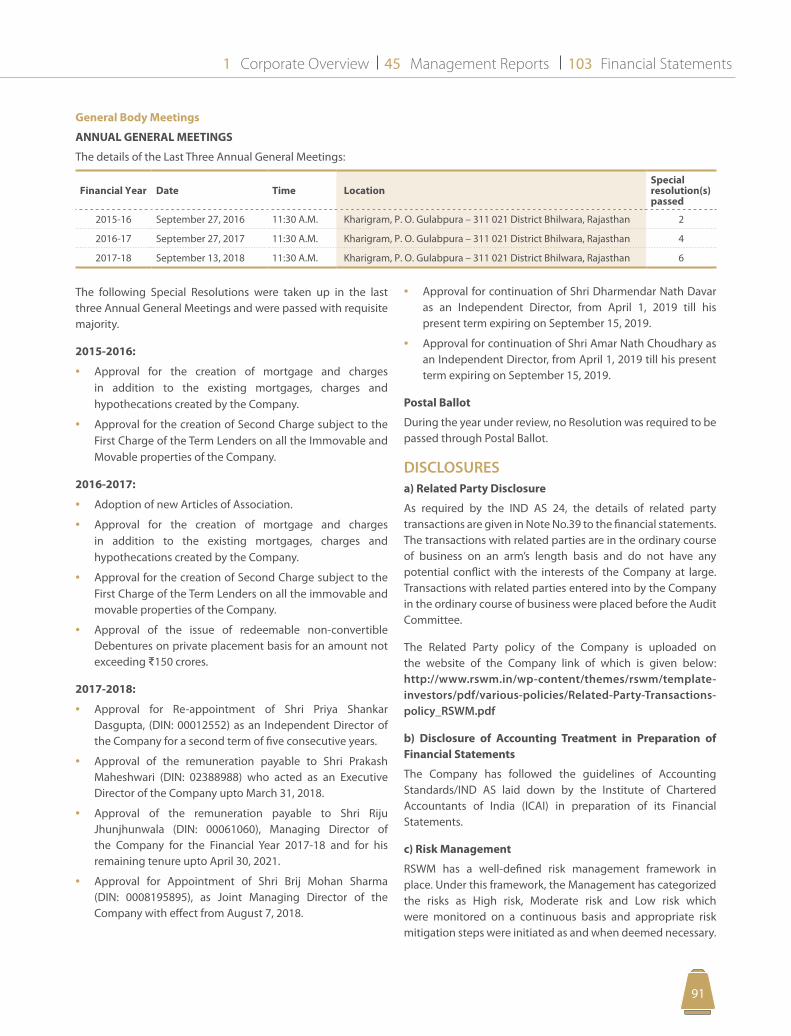
Corporate Overview Management Reports Financial Statements1 45 103
9190
The following Special Resolutions were taken up in the last three Annual General Meetings and were passed with requisite majority.
2015-2016:
• Approval for the creation of mortgage and charges in addition to the existing mortgages, charges and hypothecations created by the Company.
• Approval for the creation of Second Charge subject to the First Charge of the Term Lenders on all the Immovable and Movable properties of the Company.
2016-2017:
• Adoption of new Articles of Association.
• Approval for the creation of mortgage and charges in addition to the existing mortgages, charges and hypothecations created by the Company.
• Approval for the creation of Second Charge subject to the First Charge of the Term Lenders on all the immovable and movable properties of the Company.
• Approval of the issue of redeemable non-convertible Debentures on private placement basis for an amount not exceeding D150 crores.
2017-2018:
• Approval for Re-appointment of Shri Priya Shankar Dasgupta, (DIN: 00012552) as an Independent Director of the Company for a second term of five consecutive years.
• Approval of the remuneration payable to Shri Prakash Maheshwari (DIN: 02388988) who acted as an Executive Director of the Company upto March 31, 2018.
• Approval of the remuneration payable to Shri Riju Jhunjhunwala (DIN: 00061060), Managing Director of the Company for the Financial Year 2017-18 and for his remaining tenure upto April 30, 2021.
• Approval for Appointment of Shri Brij Mohan Sharma (DIN: 0008195895), as Joint Managing Director of the Company with effect from August 7, 2018.
• Approval for continuation of Shri Dharmendar Nath Davar as an Independent Director, from April 1, 2019 till his present term expiring on September 15, 2019.
• Approval for continuation of Shri Amar Nath Choudhary as an Independent Director, from April 1, 2019 till his present term expiring on September 15, 2019.
Postal Ballot
During the year under review, no Resolution was required to be passed through Postal Ballot.
DISCLOSURESa) Related Party Disclosure
As required by the IND AS 24, the details of related party transactions are given in Note No.39 to the financial statements. The transactions with related parties are in the ordinary course of business on an arm’s length basis and do not have any potential conflict with the interests of the Company at large. Transactions with related parties entered into by the Company in the ordinary course of business were placed before the Audit Committee.
The Related Party policy of the Company is uploaded on the website of the Company link of which is given below: http://www.rswm.in/wp-content/themes/rswm/template-investors/pdf/various-policies/Related-Party-Transactions-policy_RSWM.pdf
b) Disclosure of Accounting Treatment in Preparation of Financial Statements
The Company has followed the guidelines of Accounting Standards/IND AS laid down by the Institute of Chartered Accountants of India (ICAI) in preparation of its Financial Statements.
c) Risk Management
RSWM has a well-defined risk management framework in place. Under this framework, the Management has categorized the risks as High risk, Moderate risk and Low risk which were monitored on a continuous basis and appropriate risk mitigation steps were initiated as and when deemed necessary.
General Body Meetings
ANNUAL GENERAL MEETINGS
The details of the Last Three Annual General Meetings:
Financial Year Date Time LocationSpecial resolution(s) passed
2015-16 September 27, 2016 11:30 A.M. Kharigram, P. O. Gulabpura – 311 021 District Bhilwara, Rajasthan 2
2016-17 September 27, 2017 11:30 A.M. Kharigram, P. O. Gulabpura – 311 021 District Bhilwara, Rajasthan 4
2017-18 September 13, 2018 11:30 A.M. Kharigram, P. O. Gulabpura – 311 021 District Bhilwara, Rajasthan 6
ANNUAL REPORT20 1819
9392
The risk mitigation policy also covers the key risks such as availability and prices of cotton/other raw materials, prices of yarn in addition to forex, insurance and other business related risks. RSWM has established procedures to periodically place before the Board the risk assessment and minimization procedures being followed by the Company and steps taken by it to mitigate those risks through a properly defined framework. Risk parameters are periodically reviewed by external experts. Half yearly Risk Library with actions taken is presented to the Board.
d) Details of Non-Compliance by the Company in Previous Years
With regard to the matters related to capital markets, the Company has complied with all requirements of the SEBI (Listing Obligations and Disclosure Requirements) Regulations, 2015, as well as SEBI regulations and guidelines. No penalties/strictures were imposed on the Company by the Stock Exchange or SEBI or any statutory authority during the last three years.
e) Initiatives on Code of Conduct for Regulating, Monitoring & Reporting Trading by Insiders
In compliance with the SEBI regulation on Code of Conduct for Regulating, Monitoring & Reporting Trading by Insiders, the Company has instituted a comprehensive code of conduct for its management staff. The Code lays down guidelines, which advises them on procedures to be followed and disclosures to be made, while dealing with shares of RSWM and cautions them on consequences of violations.
The Company follows closure of trading window prior to the publication of price sensitive information. The Company has been informing the directors, senior management personnel and other persons covered under the code and advise them not to trade in Company’s securities during the closure of trading window period.
f) Compliance with Regulation 34(3) of SEBI (Listing Obligations and Disclosure Requirements) Regulation, 2015.
The Company is fully compliant with the requirements of SEBI (Listing Obligations and Disclosure Requirements) Regulation, 2015. A certificate from Statutory Auditors to this effect is enclosed in the Annual Report.
In accordance with the provisions of Regulation 34(3) read with Schedule V Para C Sub clause (10) (i) of the SEBI (Listing Obligations and Disclosure Requirements) Regulations, 2015, the Company has obtained a certificate from Practising Company Secretary confirming that none of the Directors on the Board of the Company has been debarred or disqualified from being appointed or continuing as directors of companies
by the Securities and Exchange Board of India, Ministry of Corporate Affairs or any such statutory authority. The certificate issued is annexed herewith in this report.
g) Discretionary Requirements
The Company has duly fulfilled the following discretionary requirements as prescribed in Schedule II part E of SEBI (Listing Obligations and Disclosure Requirements) Regulations, 2015.
Shri Ravi Jhunjhunwala is the Chairman of the Company and Shri Riju Jhunjhunwala is the Managing Director & CEO of the Company. The Company complied with the requirement of having separate persons to the post of the Chairman and Managing Director/CEO.
The executive summary along with the internal audit report and action taken report of all units is placed at the end of every quarter before the Audit Committee.
h) Material Subsidiary
The Company doesn’t have any material subsidiary. However, the policy of the same as approved by the Board of Directors is disclosed on the website of the Company under the following link: https://www.rswm.in/wp-content/uploads/2019/05/Material-Subsidiary.pdf
Investment and Planning Committee
The Company has constituted the Investment and Planning Committee. The terms of reference of the Committee is to approve capital expenditure on projects and to recommend to the Board of Directors, capital budgets and other major capital schemes above a stipulated threshold, new business plan and capital outlays. No meeting was held during the year.
Audit Qualifications
The Company’s Financial Statements are free from any qualifications by the Auditors and Company continues to adopt best practices to move towards a regime of unqualified financial statements.
Management Discussion and Analysis
The Management Discussion and Analysis Report forms part of the Annual Report.
Senior Management personnel (Promoters, Directors, Management or relatives etc.) have made disclosure to the Board relating to all material, financial and other transactions stating that they did not have any personal interest that could result in a conflict with the interest of the Company at large. The interested Directors neither participate in the discussion nor vote on such matters.
Corporate Overview Management Reports Financial Statements1 45 103
9392
Whistle Blower Policy
The Company has implemented vigil mechanism, whereby employees, directors and other stakeholders can report matters such as fraud, misconduct, non-compliance, misappropriation of funds, violation of Company’s Code of Conduct etc to the Nodal Officer appointed for the purpose. The Company has adopted a framework whereby the identity of the complainant is not disclosed. During the year, the Company did not receive any Whistle Blower reference. These policies are available on the website of the Company at https://www.rswm.in/wp-content/themes/rswm/template-investors/pdf/various-policies/RSWM-Whistle-Blower-Policy-2018.pdf
CEO/ CFO Certification
The CEO and CFO certification of the Financial Statements for the year form part of this Annual Report.
Code of Conduct
RSWM’s Board has laid down a Code of Conduct for all Board members and Senior Management of the Company. The Company is committed to conduct its business in accordance with the pertinent laws, rules and regulations and with the highest standards of business ethics. The Code of Conduct is displayed on the website of the Company www.rswm.in. Board Members and designated Senior Management Officials have affirmed compliance with the Code of Conduct for the current year. It is further affirmed that access to the Audit Committee of the Company has not been denied to any personnel. A declaration to this effect forms part of this Annual Report.
Means of Communication
The effective communication of information is considered very essential component of Corporate Governance. The Company interact with their shareholders through various means of communication i.e. Print Media, Company’s Website, Annual Report etc.
Quarterly/ Annual results
The quarterly and annual audited results are forthwith sent to the Stock Exchanges where the Company’s shares are listed after they are approved by the Board of Directors. The results of the Company are published in accordance with Regulation 47 of SEBI (Listing Obligations and Disclosure Requirements) Regulation, 2015 in at least one prominent national and one regional newspaper. The financial results are also displayed on the Company’s website www.rswm.in.
Compliance with Corporate Governance Requirements
During the year under review, the Company has complied with the condition of Corporate Governance as stipulated in Chapter IV of SEBI (Listing Obligations and Disclosure Requirements) Regulations, 2015. Compliance Certificate from M/s. S. S.
Kothari Mehta & Co., Chartered Accountants, New Delhi (Firm Registration No. 000756N) and M/s. Lodha & Co., Chartered Accountants, New Delhi (Firm Registration No. 301051E) Statutory Auditors of the Company regarding compliance of the condition of Corporate Governance from part of this Annual Report.
The observations of the Auditors, if any, are explained wherever necessary, in the appropriate notes to the accounts. The Auditors’ Report does not contain qualification, reservation or adverse remark.
Website
The Company’s website www.rswm.in has a separate section “Investors” where the information for the Shareholders is available. Annual Report, Quarterly Results, Shareholding Pattern, Corporate Governance Report etc. are also available on the website in the user friendly manner. The website also displays information in relation to the Company and presentation made to the analysts.
The Company ensures that the relevant provisions of Regulation 46 of SEBI (Listing Obligations and Disclosure Requirements) Regulation, 2015 are complied with. The Company has dedicated investor email-id [email protected]
Shareholders
Appointment or Re-appointment of Non Independent Directors
Six Non Independent Directors of your Company are liable to retire by rotation. Of these Directors, at least one-third retires every year and if eligible, propose themselves for the re-appointment. This year, Shri Riju Jhunjhunwala and Shri Jagdish Chandra Laddha are retiring by rotation and being eligible, offer themselves for re-appointment in the Annual General Meeting.
Shri B. M. Sharma, who was co-opted as an Additional Director on the Board with effect from August 7, 2018 was also designated as Joint Managing Director with effect from same date. The appointment of Shri Brij Mohan Sharma as Director liable to retire by rotation as well as his appointment as Joint Managing Director was approved by the Members of the Company at the Annual General Meeting held on September 13, 2018.
Their brief resumes are given below:
Shri Riju Jhunjhunwala (40)
Shri Riju Jhunjhunwala has been designated as Managing Director of RSWM Ltd. He is also the MD of Bhilwara Energy Ltd. Shri Riju Jhunjhunwala is a graduate in Business Management Studies. Shri Jhunjhunwala is an industrialist with diversified business experience.
ANNUAL REPORT20 1819
9594
Shri J. C. Laddha (69)
Shri J. C. Laddha is FCA with rich experience in Textiles and was Executive Director of RSWM Limited. Shri J. C. Laddha possesses over four decades of experience in Textiles and was instrumental in setting up of various projects of the Company.
Details of Directorship Held in Other Companies
Directors name Name of the company in which Directorship held* Committee Chairmanship Committee
Membership
Shri Riju Jhunjhunwala Bhilwara Energy Limited
Bhilwara Infotechnology Limited
Bhilwara Technical Textiles Ltd. Audit Committee, Stakeholders’ Relationship Committee
Chango Yangthang Hydro Power Ltd.
HEG Limited Stakeholders’ Relationship Committee
NJC Hydro Power Limited
Shri Jagdish Chandra Laddha Lagnam Spintex Ltd. Audit Committee
Shri B. M. Sharma None None None
*Excludes directorships held in private limited companies, foreign companies, memberships of management committee of various chambers/ bodies/Section 8 companies.
SEBI Complaints Redressal System (SCORES)The investor complaints are processed in a centralised web-based complaints redressal system.
Uploading on BSE and NSE
The quarterly and annual results, quarterly and annual compliances and all other corporate communications to the Stock Exchanges are filed electronically on BSE (BSE Limited) and NSE (National Stock Exchange Limited.)
Disclosure on Website
The Company’s website www.rswm.in has separate section “Investor” where the information for the shareholders is available. Annual Report, financial result, shareholding pattern, Corporate Governance Report etc. are also available on the website of the company in user friendly manner. The Company ensures that the relevant provision of Regulation 46 of the Listing Regulation, 2015 are complied with.
Presentation made to Institutional Investor or to the analysts
Any presentations and disclosures which are required to be disseminated on the Company’s website under the Listing Regulations have been uploaded on the website of the Company.
Compliance Confirmation
It is confirmed that the Company has complied with the requirements prescribed under Regulations 17 to 27 of the Listing Regulations 2015.
Additional Shareholder InformationAnnual General Meeting
Date : September 11, 2019
Day : Wednesday
Time : 11:30 A.M.
Venue : Kharigram, P. O. Gulabpura, Bhilwara District,
Rajasthan– 311021
Financial Results
Financial year: April 1, 2018 to March 31, 2019
For the year ended March 31, 2019, results were announced on:
• August 7, 2018 : First quarter
• November 13, 2018 : Second quarter and Half year
• February 13, 2019 : Third quarter and Nine months
• May 21, 2019 : Fourth quarter and Annual
For the year ending March 31, 2020, quarterly results will be announced within 45 days from the end of each quarter except the fourth quarter when the audited annual results will be published within 60 days.
Book Closure/Record Date
The dates of book closure are from September 5, 2019, Thursday to September 11, 2019, Wednesday (both days inclusive).
Dividend Dates
Not Applicable
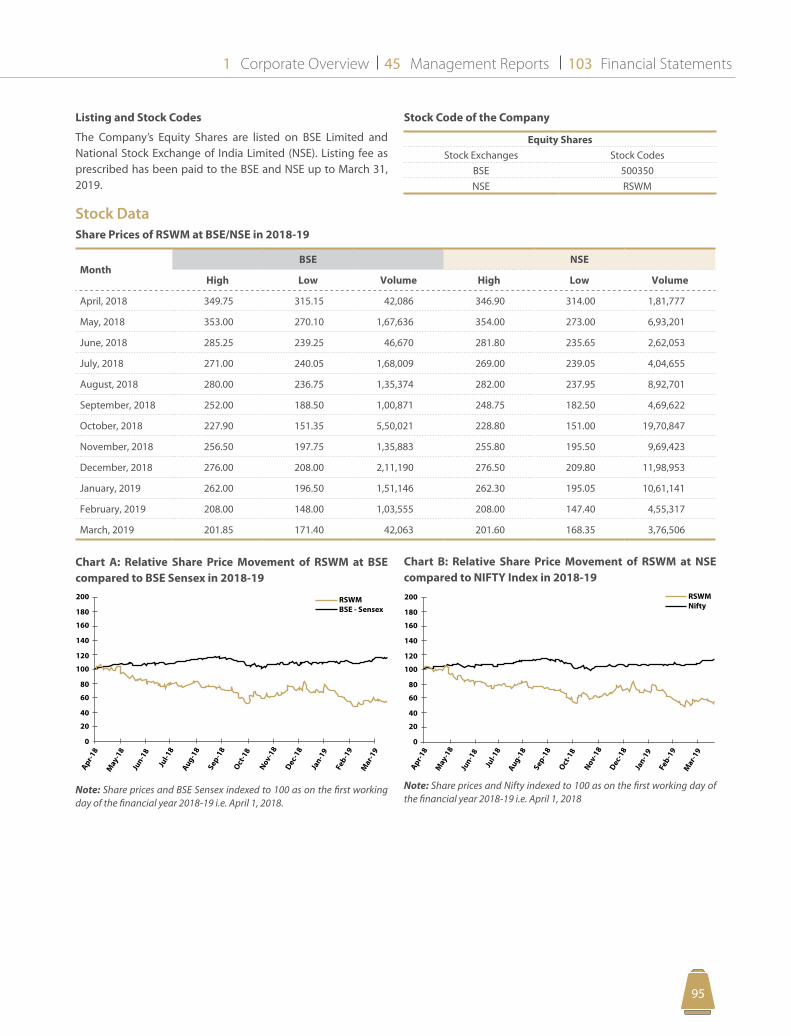
Corporate Overview Management Reports Financial Statements1 45 103
9594
Listing and Stock Codes
The Company’s Equity Shares are listed on BSE Limited and National Stock Exchange of India Limited (NSE). Listing fee as prescribed has been paid to the BSE and NSE up to March 31, 2019.
Stock Code of the Company
Equity SharesStock Exchanges Stock Codes
BSE 500350NSE RSWM
Stock Data Share Prices of RSWM at BSE/NSE in 2018-19
MonthBSE NSE
High Low Volume High Low Volume
April, 2018 349.75 315.15 42,086 346.90 314.00 1,81,777
May, 2018 353.00 270.10 1,67,636 354.00 273.00 6,93,201
June, 2018 285.25 239.25 46,670 281.80 235.65 2,62,053
July, 2018 271.00 240.05 1,68,009 269.00 239.05 4,04,655
August, 2018 280.00 236.75 1,35,374 282.00 237.95 8,92,701
September, 2018 252.00 188.50 1,00,871 248.75 182.50 4,69,622
October, 2018 227.90 151.35 5,50,021 228.80 151.00 19,70,847
November, 2018 256.50 197.75 1,35,883 255.80 195.50 9,69,423
December, 2018 276.00 208.00 2,11,190 276.50 209.80 11,98,953
January, 2019 262.00 196.50 1,51,146 262.30 195.05 10,61,141
February, 2019 208.00 148.00 1,03,555 208.00 147.40 4,55,317
March, 2019 201.85 171.40 42,063 201.60 168.35 3,76,506
Chart A: Relative Share Price Movement of RSWM at BSE compared to BSE Sensex in 2018-19200
180
160
140
120
100
80
60
40
20
0
Apr-18
May
-18
Jun-1
8
Jul-1
8
Aug-18
Sep-1
8
Oct-1
8
Nov-1
8
Dec-1
8
Jan-1
9
Feb-1
9
Mar
-19
RSWM BSE - Sensex
Note: Share prices and BSE Sensex indexed to 100 as on the first working day of the financial year 2018-19 i.e. April 1, 2018.
Chart B: Relative Share Price Movement of RSWM at NSE compared to NIFTY Index in 2018-19200
180
160
140
120
100
80
60
40
20
0
Apr-18
May
-18
Jun-1
8
Jul-1
8
Aug-18
Sep-1
8
Oct-1
8
Nov-1
8
Dec-1
8
Jan-1
9
Feb-1
9
Mar
-19
RSWM Nifty
Note: Share prices and Nifty indexed to 100 as on the first working day of the financial year 2018-19 i.e. April 1, 2018
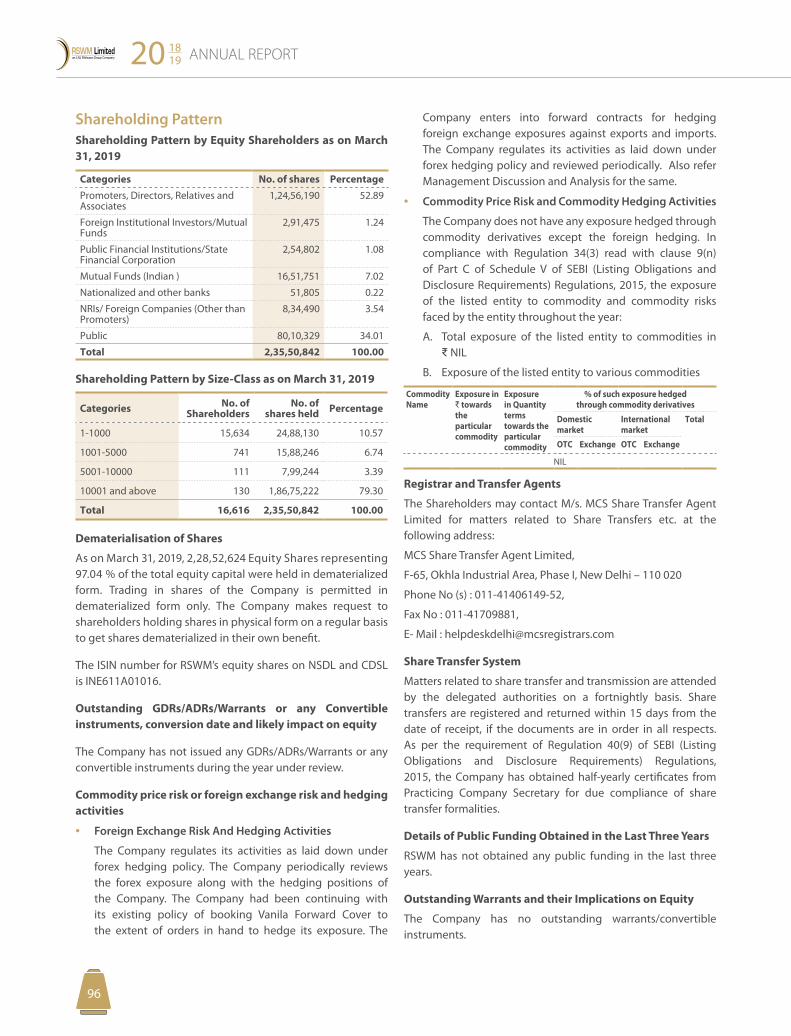
ANNUAL REPORT20 1819
9796
Shareholding Pattern
Shareholding Pattern by Equity Shareholders as on March 31, 2019
Categories No. of shares PercentagePromoters, Directors, Relatives and Associates
1,24,56,190 52.89
Foreign Institutional Investors/Mutual Funds
2,91,475 1.24
Public Financial Institutions/State Financial Corporation
2,54,802 1.08
Mutual Funds (Indian ) 16,51,751 7.02
Nationalized and other banks 51,805 0.22
NRIs/ Foreign Companies (Other than Promoters)
8,34,490 3.54
Public 80,10,329 34.01
Total 2,35,50,842 100.00
Shareholding Pattern by Size-Class as on March 31, 2019
Categories No. of Shareholders
No. of shares held Percentage
1-1000 15,634 24,88,130 10.57
1001-5000 741 15,88,246 6.74
5001-10000 111 7,99,244 3.39
10001 and above 130 1,86,75,222 79.30
Total 16,616 2,35,50,842 100.00
Dematerialisation of Shares
As on March 31, 2019, 2,28,52,624 Equity Shares representing 97.04 % of the total equity capital were held in dematerialized form. Trading in shares of the Company is permitted in dematerialized form only. The Company makes request to shareholders holding shares in physical form on a regular basis to get shares dematerialized in their own benefit.
The ISIN number for RSWM’s equity shares on NSDL and CDSL is INE611A01016.
Outstanding GDRs/ADRs/Warrants or any Convertible instruments, conversion date and likely impact on equity
The Company has not issued any GDRs/ADRs/Warrants or any convertible instruments during the year under review.
Commodity price risk or foreign exchange risk and hedging activities
• Foreign Exchange Risk And Hedging Activities
The Company regulates its activities as laid down under forex hedging policy. The Company periodically reviews the forex exposure along with the hedging positions of the Company. The Company had been continuing with its existing policy of booking Vanila Forward Cover to the extent of orders in hand to hedge its exposure. The
Company enters into forward contracts for hedging foreign exchange exposures against exports and imports. The Company regulates its activities as laid down under forex hedging policy and reviewed periodically. Also refer Management Discussion and Analysis for the same.
• Commodity Price Risk and Commodity Hedging Activities
The Company does not have any exposure hedged through commodity derivatives except the foreign hedging. In compliance with Regulation 34(3) read with clause 9(n) of Part C of Schedule V of SEBI (Listing Obligations and Disclosure Requirements) Regulations, 2015, the exposure of the listed entity to commodity and commodity risks faced by the entity throughout the year:
A. Total exposure of the listed entity to commodities in D NIL
B. Exposure of the listed entity to various commodities
Commodity Name
Exposure in D towards the particular commodity
Exposure in Quantity terms towards the particular commodity
% of such exposure hedged through commodity derivatives
Domestic market
International market
Total
OTC Exchange OTC Exchange
NIL
Registrar and Transfer Agents
The Shareholders may contact M/s. MCS Share Transfer Agent Limited for matters related to Share Transfers etc. at the following address:
MCS Share Transfer Agent Limited,
F-65, Okhla Industrial Area, Phase I, New Delhi – 110 020
Phone No (s) : 011-41406149-52,
Fax No : 011-41709881,
E- Mail : [email protected]
Share Transfer System
Matters related to share transfer and transmission are attended by the delegated authorities on a fortnightly basis. Share transfers are registered and returned within 15 days from the date of receipt, if the documents are in order in all respects. As per the requirement of Regulation 40(9) of SEBI (Listing Obligations and Disclosure Requirements) Regulations, 2015, the Company has obtained half-yearly certificates from Practicing Company Secretary for due compliance of share transfer formalities.
Details of Public Funding Obtained in the Last Three Years
RSWM has not obtained any public funding in the last three years.
Outstanding Warrants and their Implications on Equity
The Company has no outstanding warrants/convertible instruments.
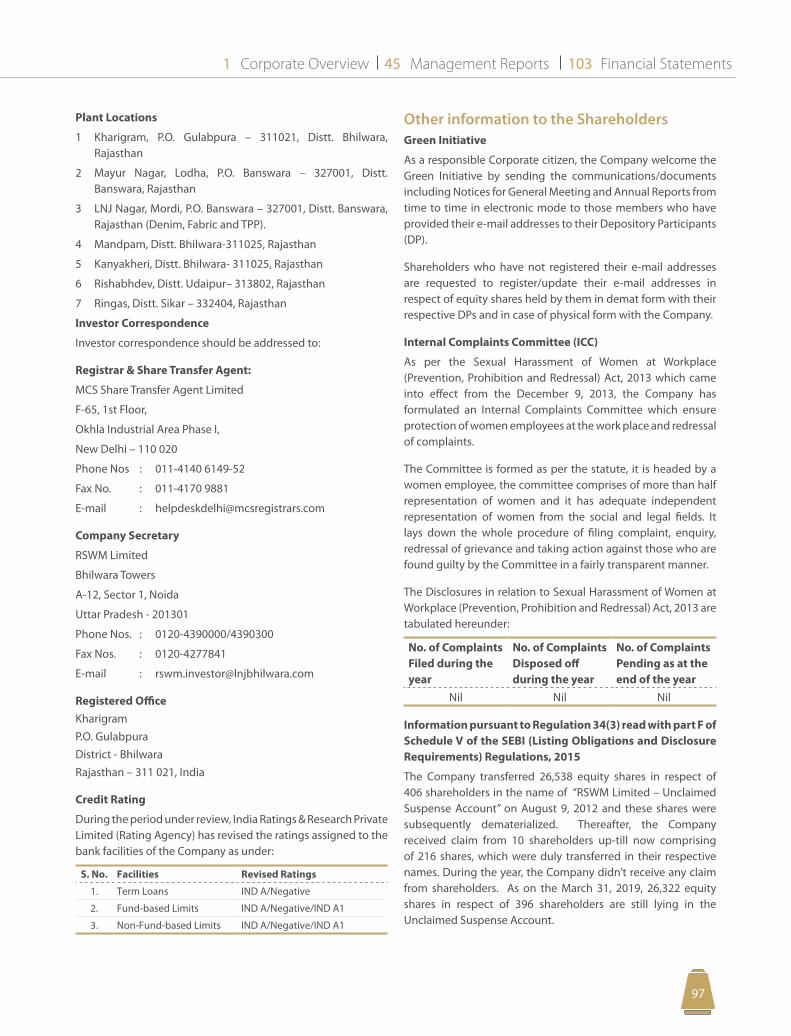
Corporate Overview Management Reports Financial Statements1 45 103
9796
Plant Locations
1 Kharigram, P.O. Gulabpura – 311021, Distt. Bhilwara, Rajasthan
2 Mayur Nagar, Lodha, P.O. Banswara – 327001, Distt. Banswara, Rajasthan
3 LNJ Nagar, Mordi, P.O. Banswara – 327001, Distt. Banswara, Rajasthan (Denim, Fabric and TPP).
4 Mandpam, Distt. Bhilwara-311025, Rajasthan
5 Kanyakheri, Distt. Bhilwara- 311025, Rajasthan
6 Rishabhdev, Distt. Udaipur– 313802, Rajasthan
7 Ringas, Distt. Sikar – 332404, Rajasthan
Investor Correspondence
Investor correspondence should be addressed to:
Registrar & Share Transfer Agent:
MCS Share Transfer Agent Limited
F-65, 1st Floor,
Okhla Industrial Area Phase I,
New Delhi – 110 020
Phone Nos : 011-4140 6149-52
Fax No. : 011-4170 9881
E-mail : [email protected]
Company Secretary
RSWM Limited
Bhilwara Towers
A-12, Sector 1, Noida
Uttar Pradesh - 201301
Phone Nos. : 0120-4390000/4390300
Fax Nos. : 0120-4277841
E-mail : [email protected]
Registered Office KharigramP.O. GulabpuraDistrict - Bhilwara Rajasthan – 311 021, India
Credit Rating
During the period under review, India Ratings & Research Private Limited (Rating Agency) has revised the ratings assigned to the bank facilities of the Company as under:
S. No. Facilities Revised Ratings
1. Term Loans IND A/Negative
2. Fund-based Limits IND A/Negative/IND A1
3. Non-Fund-based Limits IND A/Negative/IND A1
Other information to the ShareholdersGreen Initiative
As a responsible Corporate citizen, the Company welcome the Green Initiative by sending the communications/documents including Notices for General Meeting and Annual Reports from time to time in electronic mode to those members who have provided their e-mail addresses to their Depository Participants (DP).
Shareholders who have not registered their e-mail addresses are requested to register/update their e-mail addresses in respect of equity shares held by them in demat form with their respective DPs and in case of physical form with the Company.
Internal Complaints Committee (ICC)
As per the Sexual Harassment of Women at Workplace (Prevention, Prohibition and Redressal) Act, 2013 which came into effect from the December 9, 2013, the Company has formulated an Internal Complaints Committee which ensure protection of women employees at the work place and redressal of complaints.
The Committee is formed as per the statute, it is headed by a women employee, the committee comprises of more than half representation of women and it has adequate independent representation of women from the social and legal fields. It lays down the whole procedure of filing complaint, enquiry, redressal of grievance and taking action against those who are found guilty by the Committee in a fairly transparent manner.
The Disclosures in relation to Sexual Harassment of Women at Workplace (Prevention, Prohibition and Redressal) Act, 2013 are tabulated hereunder:
No. of Complaints Filed during the year
No. of Complaints Disposed off during the year
No. of Complaints Pending as at the end of the year
Nil Nil Nil
Information pursuant to Regulation 34(3) read with part F of Schedule V of the SEBI (Listing Obligations and Disclosure Requirements) Regulations, 2015
The Company transferred 26,538 equity shares in respect of 406 shareholders in the name of “RSWM Limited – Unclaimed Suspense Account” on August 9, 2012 and these shares were subsequently dematerialized. Thereafter, the Company received claim from 10 shareholders up-till now comprising of 216 shares, which were duly transferred in their respective names. During the year, the Company didn’t receive any claim from shareholders. As on the March 31, 2019, 26,322 equity shares in respect of 396 shareholders are still lying in the Unclaimed Suspense Account.
ANNUAL REPORT20 1819
9998
Investors Education and Protection Fund (IEPF)
Pursuant to Section 124(6) and Section 125 of the Companies Act, 2013, and Investor Education and Protection Fund Authority (Accounting, Audit, Transfer and Refund) Rules, 2016, all shares in respect of which dividend has not been paid or claimed for seven consecutive years or more shall be transferred in the name of Investor Education and Protection Fund. Accordingly, the shareholders are requested to immediately claim their unpaid dividends failing which the said shares will be transferred to the IEPF. All the shareholders whose dividends for past seven years are either unclaimed or unpaid are being intimated individually.
Accordingly, 58,819 equity shares of 665 Shareholders were transferred in the name of Investor Education and Protection Fund in respect of the dividend remaining unpaid for seven consecutive years from the Financial Year 2010-11. List of unpaid dividend in respect of whom the shares were transferred to the Investor Education and Protection Fund Account is available on the website of the Company.
During the Financial Year 2018-19, the Company did not raise any funds through preferential allotment or qualified institutions placement.
The total fees for all services paid by the Company on a consolidated basis to the Statutory Auditor are detailed in the notes to the Financial Statements.
There were no recommendations of any committee requiring mandatory approval of the Board, which were not accepted by the Board.
Riju Jhunjhunwala Managing Director &Place: Noida (U.P) Chief Executive OfficerDate: May 21, 2019 DIN - 00061060
Corporate Overview Management Reports Financial Statements1 45 103
9998
Certification by Chief Executive Officer and Chief Financial Officer of the Company
We, Riju Jhunjhunwala, Managing Director & Chief Executive Officer and Brij Mohan Sharma, Joint Managing Director & Chief Financial Officer of RSWM Limited, hereby certify to the Board that:
a. They have reviewed Financial statements and the Cash Flow statement for the year and that to the best of our knowledge and belief :
i. These statements do not contain any materially untrue statement or omit any material fact or contain statements that might be misleading;
ii. These statements together present a true and fair view of the Company’s affairs and are in compliance with existing Accounting Standards, applicable laws and regulations.
b. There are, to the best of our knowledge and belief, no transactions entered into by RSWM Limited during the year which are fraudulent, illegal or violative of the Company’s Code of Conduct.
c. We are responsible for establishing and maintaining internal controls for financial reporting in RSWM Limited and we have evaluated the effectiveness of Internal Control Systems of the Company pertaining to financial reporting. We have disclosed to the Auditors and the Audit Committee, deficiencies in the design or operation of such internal controls, if any, of which we are aware and the steps we have taken or propose to take to rectify these deficiencies.
d. We have indicated to the Auditors and the Audit Committee:
i. significant changes in internal control over financial reporting during the year;
ii. significant changes in accounting policies during the year and that the same have been disclosed in the notes to the financial statements; and
iii. Instances of significant fraud of which we have become aware and the involvement therein, if any, of the management or an employee having a significant role in the Company’s internal control system over financial reporting.
e. We affirm that we have not denied any personnel, access to the Audit Committee of the Company (in respect of matters involving alleged misconduct).
f. We further declare that all Board Members and designated Senior Management have affirmed compliance with the Code of Conduct for the current year.
Riju Jhunjhunwala B. M. SharmaPlace: Noida Manager Director & Joint Managing Director &Dated: May 21, 2019 Chief Executive Officer Chief Financial Officer DIN: 00061060 DIN: 08195895
ANNUAL REPORT20 1819
101100
Independent Auditors’ Certificate on Corporate Governance
To The Members of RSWM Limited
1. We have examined the compliance of the conditions of Corporate Governance by RSWM Limited (“the Company”) for the year ended on March 31, 2019, as stipulated in Regulations 17 to 27, clauses (b) to (i) of regulation 46(2) and paragraphs C and D of Schedule V of the Securities and Exchange Board of India (Listing Obligations and Disclosure Requirements) Regulations, 2015, (‘SEBI Listing Regulations’) as amended.
Management’s Responsibility
2. The compliance of conditions of Corporate Governance is the responsibility of the management of the Company. This responsibility includes the design, implementation and maintenance of internal control and procedures to ensure the compliance with the conditions of the Corporate Governance as stipulated in the SEBI Listing Regulations.
Auditor’s Responsibility
3. Our responsibility is limited to examining the procedures and implementation thereof, adopted by the Company for ensuring compliance with the conditions of the Corporate Governance. It is neither an audit nor an expression of opinion on the financial statements of the Company.
4. We have examined the books of account and other relevant records and documents maintained by the Company for the purposes of providing reasonable assurance on the compliance with Corporate Governance requirements by the Company.
5. We have carried out an examination of the relevant records of the Company in accordance with the Guidance Note on Certification of Corporate Governance issued by the Institute of the Chartered Accountants of India (the ICAI), the Standards on Auditing specified under section 143(10) of the Companies Act 2013, in so far as applicable for the purpose of this certificate and as per the Guidance Note on Report or Certificates for Special Purposes issued by the ICAI which requires that we comply with the ethical requirements of the Code of Ethics issued by the ICAI.
6. We have complied with the relevant applicable requirements of the Standard on Quality Control (SQC) 1, Quality Control for Firms that Perform Audits and Reviews of Historical Financial Information, and Other Assurance and Related Services Engagements.
Opinion
7. Based on our examination of the relevant records and according to the information and explanations provided to us and the representations provided by the Management, we certify that the Company has complied with the conditions of Corporate Governance as stipulated in regulations 17 to 27 and clauses (b) to (i) of regulation 46(2) and para C and D of Schedule V of the SEBI Listing Regulations during the year ended March 31, 2019.
8. We state that such compliance is neither an assurance as to the future viability of the Company nor the efficiency or effectiveness with which the Management has conducted the affairs of the company.
Restriction on Use
9. This certificate is issued solely for the purpose of complying with the aforesaid regulations. Our Certificate should not to be used for any other purpose or by any person other than the addressees of this Certificate. Accordingly, we do not accept or assume any liability or duty of care for any other purpose or to any other person to whom this Certificate is shown or into whose hands it may come without our prior consent in writing.
For Lodha & Co. For S. S. Kothari Mehta & CoChartered Accountants Chartered AccountantsFirm Registration No.: 301051E Firm Registration No.000756N
N. K. Lodha Yogesh K. GuptaPartner PartnerMembership No.: 085155 Membership No.: 093214
Place : NoidaDate : May 21, 2019
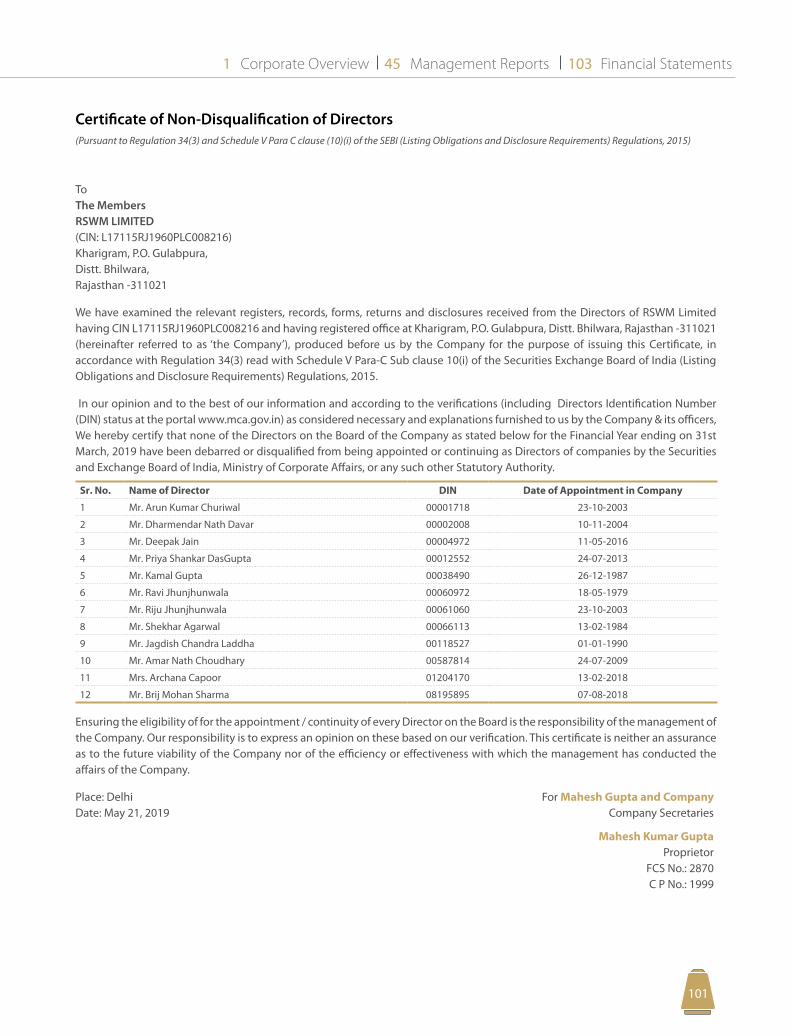
Corporate Overview Management Reports Financial Statements1 45 103
101100
Certificate of Non-Disqualification of Directors(Pursuant to Regulation 34(3) and Schedule V Para C clause (10)(i) of the SEBI (Listing Obligations and Disclosure Requirements) Regulations, 2015)
ToThe MembersRSWM LIMITED(CIN: L17115RJ1960PLC008216)Kharigram, P.O. Gulabpura,Distt. Bhilwara,Rajasthan -311021
We have examined the relevant registers, records, forms, returns and disclosures received from the Directors of RSWM Limited having CIN L17115RJ1960PLC008216 and having registered office at Kharigram, P.O. Gulabpura, Distt. Bhilwara, Rajasthan -311021 (hereinafter referred to as ‘the Company’), produced before us by the Company for the purpose of issuing this Certificate, in accordance with Regulation 34(3) read with Schedule V Para-C Sub clause 10(i) of the Securities Exchange Board of India (Listing Obligations and Disclosure Requirements) Regulations, 2015.
In our opinion and to the best of our information and according to the verifications (including Directors Identification Number (DIN) status at the portal www.mca.gov.in) as considered necessary and explanations furnished to us by the Company & its officers, We hereby certify that none of the Directors on the Board of the Company as stated below for the Financial Year ending on 31st March, 2019 have been debarred or disqualified from being appointed or continuing as Directors of companies by the Securities and Exchange Board of India, Ministry of Corporate Affairs, or any such other Statutory Authority.
Sr. No. Name of Director DIN Date of Appointment in Company
1 Mr. Arun Kumar Churiwal 00001718 23-10-2003
2 Mr. Dharmendar Nath Davar 00002008 10-11-2004
3 Mr. Deepak Jain 00004972 11-05-2016
4 Mr. Priya Shankar DasGupta 00012552 24-07-2013
5 Mr. Kamal Gupta 00038490 26-12-1987
6 Mr. Ravi Jhunjhunwala 00060972 18-05-1979
7 Mr. Riju Jhunjhunwala 00061060 23-10-2003
8 Mr. Shekhar Agarwal 00066113 13-02-1984
9 Mr. Jagdish Chandra Laddha 00118527 01-01-1990
10 Mr. Amar Nath Choudhary 00587814 24-07-2009
11 Mrs. Archana Capoor 01204170 13-02-2018
12 Mr. Brij Mohan Sharma 08195895 07-08-2018
Ensuring the eligibility of for the appointment / continuity of every Director on the Board is the responsibility of the management of the Company. Our responsibility is to express an opinion on these based on our verification. This certificate is neither an assurance as to the future viability of the Company nor of the efficiency or effectiveness with which the management has conducted the affairs of the Company.
Place: Delhi For Mahesh Gupta and CompanyDate: May 21, 2019 Company Secretaries
Mahesh Kumar Gupta Proprietor FCS No.: 2870 C P No.: 1999
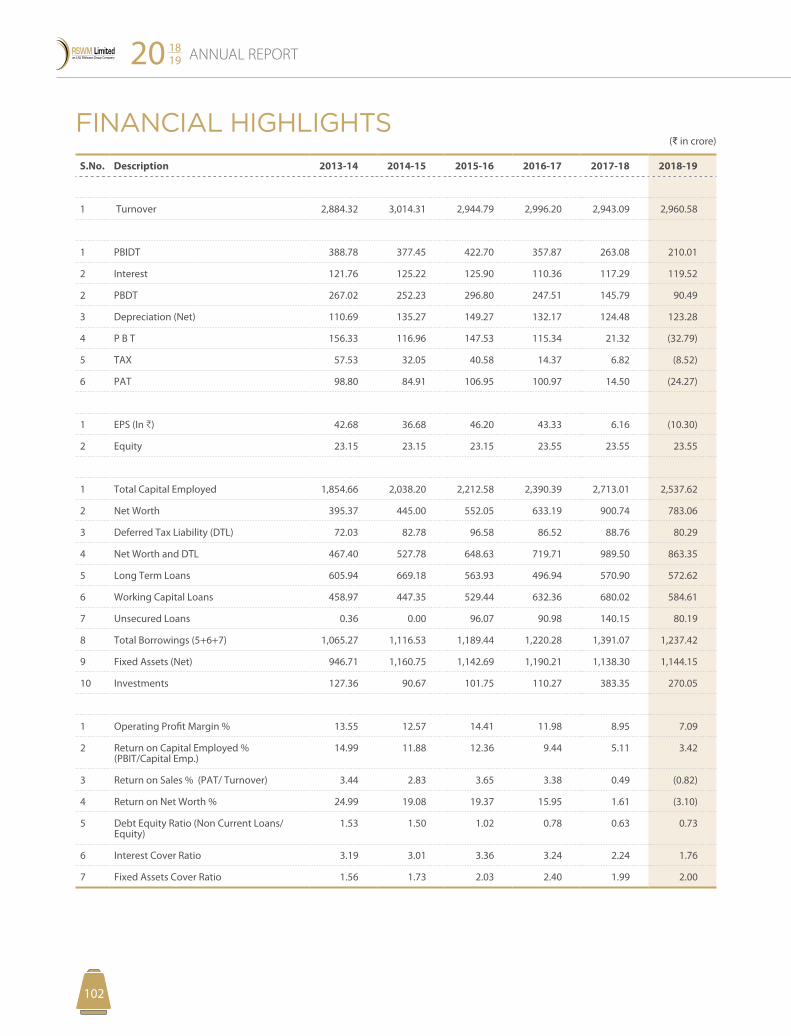
ANNUAL REPORT20 1819
PB102
FINANCIAL HIGHLIGHTS(D in crore)
S.No. Description 2013-14 2014-15 2015-16 2016-17 2017-18 2018-19
1 Turnover 2,884.32 3,014.31 2,944.79 2,996.20 2,943.09 2,960.58
1 PBIDT 388.78 377.45 422.70 357.87 263.08 210.01
2 Interest 121.76 125.22 125.90 110.36 117.29 119.52
2 PBDT 267.02 252.23 296.80 247.51 145.79 90.49
3 Depreciation (Net) 110.69 135.27 149.27 132.17 124.48 123.28
4 P B T 156.33 116.96 147.53 115.34 21.32 (32.79)
5 TAX 57.53 32.05 40.58 14.37 6.82 (8.52)
6 PAT 98.80 84.91 106.95 100.97 14.50 (24.27)
1 EPS (In C) 42.68 36.68 46.20 43.33 6.16 (10.30)
2 Equity 23.15 23.15 23.15 23.55 23.55 23.55
1 Total Capital Employed 1,854.66 2,038.20 2,212.58 2,390.39 2,713.01 2,537.62
2 Net Worth 395.37 445.00 552.05 633.19 900.74 783.06
3 Deferred Tax Liability (DTL) 72.03 82.78 96.58 86.52 88.76 80.29
4 Net Worth and DTL 467.40 527.78 648.63 719.71 989.50 863.35
5 Long Term Loans 605.94 669.18 563.93 496.94 570.90 572.62
6 Working Capital Loans 458.97 447.35 529.44 632.36 680.02 584.61
7 Unsecured Loans 0.36 0.00 96.07 90.98 140.15 80.19
8 Total Borrowings (5+6+7) 1,065.27 1,116.53 1,189.44 1,220.28 1,391.07 1,237.42
9 Fixed Assets (Net) 946.71 1,160.75 1,142.69 1,190.21 1,138.30 1,144.15
10 Investments 127.36 90.67 101.75 110.27 383.35 270.05
1 Operating Profit Margin % 13.55 12.57 14.41 11.98 8.95 7.09
2 Return on Capital Employed % (PBIT/Capital Emp.)
14.99 11.88 12.36 9.44 5.11 3.42
3 Return on Sales % (PAT/ Turnover) 3.44 2.83 3.65 3.38 0.49 (0.82)
4 Return on Net Worth % 24.99 19.08 19.37 15.95 1.61 (3.10)
5 Debt Equity Ratio (Non Current Loans/Equity)
1.53 1.50 1.02 0.78 0.63 0.73
6 Interest Cover Ratio 3.19 3.01 3.36 3.24 2.24 1.76
7 Fixed Assets Cover Ratio 1.56 1.73 2.03 2.40 1.99 2.00
103PB
Corporate Overview Management Reports Financial Statements1 45 103
Opinion We have audited the standalone financial statements of RSWM Limited ("the Company"), which comprise the Balance Sheet as at March 31, 2019, the Statement of Profit and Loss (including Other Comprehensive Income), the Statement of Cash Flows and the Statement of Changes in Equity for the year then ended, and notes to the standalone financial statements, including a summary of the significant accounting policies and other explanatory information (herein after referred to as "standalone financial statements").
In our opinion and to the best of our information and according to the explanations given to us, the aforesaid standalone financial statements give the information required by the Companies Act, 2013( "Act") in the manner so required and give a true and fair view in conformity with the accounting principles generally accepted in India, of the state of affairs of the Company as at March 31, 2019, and the loss( including other comprehensive income), changes in equity and its cash flows for the year ended on that date.
Basis of Opinion We conducted our audit in accordance with the Standards on Auditing (SAs) specified under Section 143(10) of the Act (SAs). Our responsibilities under those Standards are further described in the Auditor's Responsibilities for the Audit of the Standalone Financial Statements section of our report. We are independent of the Company in accordance with the Code of Ethics issued by the Institute of Chartered Accountants of India (ICAI) together with the ethical requirements that are relevant to our audit of the standalone financial statements under the provisions of the Act and the Rules thereunder, and we have fulfilled our other ethical responsibilities in accordance with these requirements and the ICAI's Code of Ethics. We believe that the audit evidence we have obtained is sufficient and appropriate to provide a basis for our opinion.
Independent Auditor's Report
Key Audit Matters Key audit matters are those matters that, in our professional judgment, were of the most significance in our audit of the standalone financial statements of the current period. These matters were addressed in the context of our audit of the standalone financial statements as a whole, and in forming our opinion thereon, and we do not provide a separate opinion on these matters.
We have determined that there are no key audit matters to be communicated in our report.
Information Other than the Financial Statements and Auditor's Report ThereonThe Company's Board of Directors is responsible for the other information. The other information comprises the information included in the Management Discussion and Analysis, Board's Report including Annexure to Board's Report, Business Responsibility Report, Corporate Governance and Shareholder's Information, but does not include the standalone financial statements and our auditor's report thereon.
Our opinion on the standalone financial statements does not cover the other information and we do not express any form of assurance conclusion thereon.
In connection with our audit of the standalone financial statements, our responsibility is to read the other information and, in doing so, consider whether the other information is materially inconsistent with the financial statements or our knowledge obtained in the audit or otherwise appears to be materially misstated. If, based on the work we have performed, we conclude that there is a material misstatement of this other information, we are required to report that fact. We have nothing to report in this regard.
To the Members of RSWM Limited
Report on Audit of the Standalone Financial Statements
ANNUAL REPORT20 1819
105104
Management's Responsibility for the Standalone Financial Statements The Company's Board of Directors is responsible for the matters stated in Section 134(5) of the Act with respect to the preparation of these standalone financial statements that give a true and fair view of the financial position, financial performance, changes in equity and cash flows of the Company in accordance with the accounting principles generally accepted in India, including the Indian Accounting Standards (Ind AS) and other accounting principles generally accepted in India. This responsibility also includes maintenance of adequate accounting records in accordance with the provisions of the Act for safeguarding of the assets of the Company and for preventing and detecting frauds and other irregularities; selection and application of appropriate accounting policies; making judgments and estimates that are reasonable and prudent; and design, implementation and maintenance of adequate internal financial controls, that were operating effectively for ensuring the accuracy and completeness of the accounting records, relevant to the preparation and presentation of the standalone financial statements that give a true and fair view and are free from material misstatement, whether due to fraud or error.
In preparing the standalone financial statements, management is responsible for assessing the Company's ability to continue as a going concern, disclosing, as applicable, matters related to going concern and using the going concern basis of accounting unless management either intends to liquidate the Company or to cease operations, or has no realistic alternative but to do so.
Those Board of Directors are also responsible for overseeing the Company's financial reporting process.
Auditor's Responsibilities for the Audit of the Standalone Financial Statements Our objectives are to obtain reasonable assurance about whether the standalone financial statements as a whole are free from material misstatement, whether due to fraud or error, and to issue an auditor's report that includes our opinion. Reasonable assurance is a high level of assurance, but is not a guarantee that an audit conducted in accordance with SAs will always detect a material misstatement when it exists. Misstatements can arise from fraud or error and are considered material if, individually or in the aggregate, they could reasonably be expected to influence the economic decisions of users taken on the basis of these standalone financial statements.
As part of an audit in accordance with SAs, we exercise professional judgment and maintain professional skepticism throughout the audit. We also:
• Identify and assess the risks of material misstatement of the standalone financial statements, whether due to fraud
or error, design and perform audit procedures responsive to those risks, and obtain audit evidence that is sufficient and appropriate to provide a basis for our opinion. The risk of not detecting a material misstatement resulting from fraud is higher than for one resulting from error, as fraud may involve collusion, forgery, intentional omissions, misrepresentations, or the override of internal control.
• Obtain an understanding of internal control relevant to the audit in order to design audit procedures that are appropriate in the circumstances. Under Section 143(3)(i) of the Act, we are also responsible for expressing our opinion on whether the Company has adequate internal financial controls system in place and the operating effectiveness of such controls.
• Evaluate the appropriateness of accounting policies used and the reasonableness of accounting estimates and related disclosures made by management.
• Conclude on the appropriateness of management's use of the going concern basis of accounting and, based on the audit evidence obtained, whether a material uncertainty exists related to events or conditions that may cast significant doubt on the ability of the Company to continue as a going concern. If we conclude that a material uncertainty exists, we are required to draw attention in our auditor's report to the related disclosures in the standalone financial statements or, if such disclosures are inadequate, to modify our opinion. Our conclusions are based on the audit evidence obtained up to the date of our auditor's report. However, future events or conditions may cause the Company to cease to continue as a going concern.
• Evaluate the overall presentation, structure and content of the standalone financial statements, including the disclosures, and whether the standalone financial statements represent the underlying transactions and events in a manner that achieves fair presentation.
Materiality is the magnitude of misstatements in the standalone financial statements that, individually or in aggregate, makes it probable that the economic decisions of a reasonably knowledgeable user of the financial statements may be influenced. We consider quantitative materiality and qualitative factors in (i) planning the scope of our audit work and in evaluating the results of our work; and (ii) to evaluate the effect of any identified misstatements in the standalone financial statements.
We communicate with those charged with governance regarding, among other matters, the planned scope and timing of the audit and significant audit findings, including any significant deficiencies in internal control that we identify during our audit.
105104
Corporate Overview Management Reports Financial Statements1 45 103
We also provide those charged with governance with a statement that we have complied with relevant ethical requirements regarding independence, and to communicate with them all relationships and other matters that may reasonably be thought to bear on our independence, and where applicable, related safeguards.
From the matters communicated with those charged with governance, we determine those matters that were of the most significance in the audit of the standalone financial statements of the current period and are therefore the key audit matters. We describe these matters in our auditor's report unless law or regulation precludes public disclosure about the matter or when, in extremely rare circumstances, we determine that a matter should not be communicated in our report because the adverse consequences of doing so would reasonably be expected to outweigh the public interest benefits of such communication.
Report on Other Legal and Regulatory Requirements1. As required by the Companies (Auditor's Report) Order,
2016 ("the Order"), issued by the Central Government of India in terms of sub-section (11) of Section 143 of the Act, we give in the "Annexure A" a statement on the matters specified in paragraphs 3 and 4 of the Order, to the extent applicable.
2. As required by Section 143(3) of the Act, we report that:
a) We have sought and obtained all the information and explanations which to the best of our knowledge and belief were necessary for the purposes of our audit.
b) In our opinion, proper books of account as required by law have been kept by the Company so far as it appears from our examination of those books.
c) The Balance Sheet, the Statement of Profit and Loss including other comprehensive income, the Statement of Changes in Equity and the Statement of Cash Flows dealt with by this Report are in agreement with the books of account.
d) In our opinion, the aforesaid standalone financial statements comply with the Indian Accounting Standards specified under Section 133 of the Act.
e) On the basis of the written representations received from the directors as on March 31, 2019 taken on record by the Board of Directors, none of the directors is
disqualified as on March 31, 2019 from being appointed as a director in terms of Section 164- (2) of the Act.
f ) With respect to the adequacy of the internal financial controls over financial reporting of the Company and the operating effectiveness of such controls, refer to our separate Report in "Annexure B". Our report expresses an unmodified opinion on the adequacy and operating effectiveness of the Company's internal financial controls over financial Reporting.
g) With respect to the other matters to be included in the Auditor's Report in accordance with the requirements of section 197(16) of the Act, as amended:
In our opinion and to the best of our information and according to the explanations given to us, the remuneration paid by the Company to its directors during the year is in accordance with the provisions of section 197 of the Act.
h) With respect to the other matters to be included in the Auditor's Report in accordance with Rule 11 of the Companies (Audit and Auditors) Rules, 2014, in our opinion and to the best of our information and according to the explanations given to us:
i. The Company has disclosed the impact of pending litigations on its financial position in its standalone financial statements - Refer Note No. 45 to the standalone financial statements;
ii. The Company has made provision, as required under the applicable law or Indian accounting standards, for material foreseeable losses, if any, on long-term contracts including derivative contracts.
iii. There has been no delay in transferring amounts, required to be transferred, to the Investor Education and Protection Fund by the Company during the year ended March 31, 2019.
For Lodha & Co. For S. S. KOTHARI MEHTA & COChartered Accountants Chartered AccountantsFirm Registration No.:301051E Firm Registration No.000756N
N. K. Lodha Yogesh K. GuptaPartner PartnerMembership No.: 085155 Membership No.: 093214
Place : NoidaDate : May 21, 2019
ANNUAL REPORT20 1819
107106
Annexure A to the Independent Auditors' Report to the members of RSWM Limited Report on the matters specified in paragraph 3 of the Companies (Auditor's Report) Order, 2016 (''the Order') issued by the Central Government of India in terms of section 143(11) of the Companies Act, 2013 ("the Act") as referred to in paragraph 1 of 'Report on Other Legal and Regulatory Requirements' section
(i) (a) The Company is maintaining proper records showing full particulars, including quantitative details and situation of fixed assets;
(b) The Company has physically verified these fixed assets as per its program of physical verification that covers every item of fixed assets over a period of three years. No material discrepancies were noticed on such verification;
(c) According to the information and explanations given to us and on the basis of our examination of the records of the Company, the title deeds of immovable properties are held in the name of the Company.
(ii) The physical verification of inventory has been conducted at reasonable intervals by the management. No material discrepancies were noticed on such physical verification;
(iii) The Company has not granted loans, secured or unsecured, to companies, firms and limited liability partnerships or other parties covered in the register maintained under section 189 of the Act. Therefore sub - clauses (iii) (a), (iii) (b) & (iii) (c) of the Order are not applicable.
(iv) According to the information and explanations given to us, the Company has complied with the provision of section 185 and 186 of Act, with respect to the loans, investments, guarantees, and security made.
(v) As per information and explanations provided to us, the Company has not accepted any public deposits during the year. Further, we have not come across any such deposit(s) nor the management has reported any such deposit(s), therefore the directives issued by the Reserve Bank of India and the provisions of sections 73 to 76 or any other relevant provisions of the Companies Act, 2013 and the rules framed there under are not applicable.
(vi) We have broadly reviewed the books and records required to be maintained as specified by the Central Government under sub-section (1) of section 148 of the Companies Act, 2013 and we are of the opinion that prima facie, the prescribed accounts and records are being maintained.
(vii) (a) The Company is generally regular in depositing undisputed statutory dues including provident fund, employees' state insurance, income-tax, goods & service tax, duty of customs, cess and any other statutory dues applicable to it to the appropriate authorities. There are no arrears of outstanding statutory dues as at the last day of the financial year concerned for a period of more than six months from the date they became payable.
(b) The particulars of dues of income tax or service tax or duty of customs or duty of excise or value added tax have not been deposited on account of any dispute are as under: (D in Lakhs)
Nature of Statute Nature of dues Amount* Period to which the amount relates
Forum where dispute is pending
Income Tax Act, 1961 Income Tax Demands 322.72 2005-2006 Honorable High Court, Jodhpur RajasthanIncome Tax Act, 1961 Income Tax Demands 4.95 1999-2000 Honorable High Court, Jodhpur RajasthanIncome Tax Act, 1961 Income Tax Demands 20.87 2004-2005 Honorable High Court, Jodhpur RajasthanIncome Tax Act, 1961 Income Tax Demands 8.45 2003-2004 Honorable High Court, Jodhpur RajasthanIncome Tax Act, 1961 Income Tax Demands 521.33 2004-2005 Honorable High Court, Jodhpur RajasthanIncome Tax Act, 1961 Income Tax Demands 25.42 2007-2008,
2008-2009Honorable High Court, Jodhpur Rajasthan
Income Tax Act, 1961 Income Tax Demands 86.53 2010-2011 ITAT BengaluruIncome Tax Act, 1961 Income Tax Demands 685.66 2012-2013 Commissioner of Income Tax (Appeals)Central Sales Tax Act and Local Sales Tax Sales Tax Demand 8.48 1998-1999 Honorable High Court, Jodhpur RajasthanCentral Sales Tax Act and Local Sales Tax Sales Tax Demand 0.59 1995-1996 Dy. Commissioner ( A ), TripurCentral Sales Tax Act and Local Sales Tax Sales Tax Demand 0.36 1996-1997 Dy. Commissioner ( A ), TripurCentral Sales Tax Act and Local Sales Tax Sales Tax Demand 0.65 1983-1984 Honorable High Court, Jodhpur RajasthanCentral Sales Tax Act and Local Sales Tax Sales Tax Demand 3.47 1983-1984 Honorable High Court, Jodhpur RajasthanCentral Sales Tax Act and Local Sales Tax Sales Tax Demand 3.44 2006-2007 Honorable High Court, Jodhpur RajasthanCentral Excise Act Excise Duty Demand 23.56 2005-2006 DC Central Excise, BhilwaraCustom Act Custom Duty Demand in Coal 58.55 2013-2014 CESTAT, Ahmedabad
*Excluding interest and penalty net of amount deposited under protest.
107106
Corporate Overview Management Reports Financial Statements1 45 103
(viii) The Company has not defaulted in repayment of loans or borrowing to any financial institution, bank or government. The Company has not issued any debentures.
(ix) The Company did not raise any money by way of initial public offer or further public offer (including debt instruments) during the year. Term loans were applied for the purposes for which those are raised.
(x) During the course of our examination of the books and records of the Company carried out in accordance with the generally accepted auditing practices in India, we have neither come across any instance of fraud on or by the Company, noticed or reported during the year, nor have we been informed of such case by the Management.
(xi) According to the information and explanation given to us and based on our examination of the records of the Company, the Company has paid or provided for the managerial remuneration in accordance with the requisite approvals mandated by the provisions of section 197 read with Schedule V to the Act.
(xii) The Company is not a Nidhi Company, hence clause (xii) of para 3 of the Order is not applicable to the Company.
(xiii) According to the information and explanations given to us and based on our examination of the records of the company, transactions with the related parties are in
compliance with sections 177 and 188 of the Act where applicable and details of such transactions have been disclosed in the financial statements as required by the applicable accounting standards.
(xiv) The company has not made any preferential allotment or private placement of shares or fully or partly convertible debentures during the year under audit.
(xv) According to the information and explanations given to us and based on our examination of the records of the company, the company has not entered into non-cash transactions with directors or persons connected with him. Accordingly, clause (xv) of para 3 of the Order is not applicable.
(xvi) The Company is not required to be registered under section 45-IA of the Reserve Bank of India Act, 1934.
For Lodha & Co. For S. S. KOTHARI MEHTA & COChartered Accountants Chartered AccountantsFirm Registration No.:301051E Firm Registration No.:000756N
N. K. Lodha Yogesh K. GuptaPartner PartnerMembership No.: 085155 Membership No.: 093214
Place : NoidaDate : May 21, 2019
ANNUAL REPORT20 1819
109108
Annexure B to the Independent Auditor’s Report to the members of RSWM LimitedReport on the Internal Financial Controls under Clause (i) of Sub-section 3 of Section 143 of the Companies Act, 2013 (“the Act”) as referred to in paragraph 2(f) of ‘Report on Other Legal and Regulatory Requirements’ section
We have audited the internal financial controls over financial reporting of RSWM LIMITED (“the Company”) as of March 31, 2019 in conjunction with our audit of the standalone financial statements of the Company for the year ended on that date.
Management’s Responsibility for Internal Financial ControlsThe Company’s management is responsible for establishing and maintaining internal financial controls based on “the internal control over financial reporting criteria established by the Company considering the essential components of internal control stated in the Guidance Note on Audit of Internal Financial Controls over Financial Reporting issued by the Institute of Chartered Accountants of India”. These responsibilities include the design, implementation and maintenance of adequate internal financial controls that were operating effectively for ensuring the orderly and efficient conduct of its business, including adherence to company’s policies, the safeguarding of its assets, the prevention and detection of frauds and errors, the accuracy and completeness of the accounting records, and the timely preparation of reliable financial information, as required under the Companies Act, 2013.
Auditors’ ResponsibilityOur responsibility is to express an opinion on the Company's internal financial controls over financial reporting based on our audit.
We conducted our audit in accordance with the Guidance Note on Audit of Internal Financial Controls Over Financial Reporting (the “Guidance Note”) and the Standards on Auditing prescribed under section 143(10) of the Companies Act, 2013, to the extent applicable to an audit of internal financial controls. Those Standards and the Guidance Note require that we comply with ethical requirements and plan and perform the audit to obtain reasonable assurance about whether adequate internal financial controls over financial reporting was established and maintained and if such controls operated effectively in all material respects.
Our audit involves performing procedures to obtain audit evidence about the adequacy of the internal financial controls system over financial reporting and their operating effectiveness.
Our audit of internal financial controls over financial reporting included obtaining an understanding of internal financial
controls over financial reporting, assessing the risk that a material weakness exists, and testing and evaluating the design and operating effectiveness of internal control based on the assessed risk. The procedures selected depend on the auditor’s judgment, including the assessment of the risks of material misstatement of the standalone financial statements, whether due to fraud or error.
We believe that the audit evidence we have obtained is sufficient and appropriate to provide a basis for our audit opinion on the Company’s internal financial controls system over financial reporting.
Meaning of Internal Financial Controls over Financial ReportingA company's internal financial control over financial reporting is a process designed to provide reasonable assurance regarding the reliability of financial reporting and the preparation of financial statements for external purposes in accordance with generally accepted accounting principles. A company's internal financial control over financial reporting includes those policies and procedures that (1) pertain to the maintenance of records that, in reasonable detail, accurately and fairly reflect the transactions and dispositions of the assets of the company; (2) provide reasonable assurance that transactions are recorded as necessary to permit preparation of financial statements in accordance with generally accepted accounting principles, and that receipts and expenditures of the company are being made only in accordance with authorizations of management and directors of the company; and (3) provide reasonable assurance regarding prevention or timely detection of unauthorized acquisition, use, or disposition of the company's assets that could have a material effect on the financial statements.
Inherent Limitations of Internal Financial Controls over Financial ReportingBecause of the inherent limitations of internal financial controls over financial reporting, including the possibility of collusion or improper management override of controls, material misstatements due to error or fraud may occur and not be detected. Also, projections of any evaluation of the internal financial controls over financial reporting to future periods are subject to the risk that the internal financial control over financial reporting may become inadequate because of changes in conditions, or that the degree of compliance with the policies or procedures may deteriorate.
109108
Corporate Overview Management Reports Financial Statements1 45 103
OpinionIn our opinion, the Company has, in all material respects, an adequate internal financial controls system over financial reporting and such internal financial controls over financial reporting were operating effectively as at March 31, 2019, based on “the internal control over financial reporting criteria established by the Company considering the essential components of internal control stated in the Guidance Note on
Audit of Internal Financial Controls Over Financial Reporting issued by the Institute of Chartered Accountants of India”.
For Lodha & Co. For S. S. KOTHARI MEHTA & COChartered Accountants Chartered AccountantsFirm Registration No.:301051E Firm Registration No.:000756N
N. K. Lodha Yogesh K. GuptaPartner PartnerMembership No.: 085155 Membership No.: 093214
Place : NoidaDate : May 21, 2019
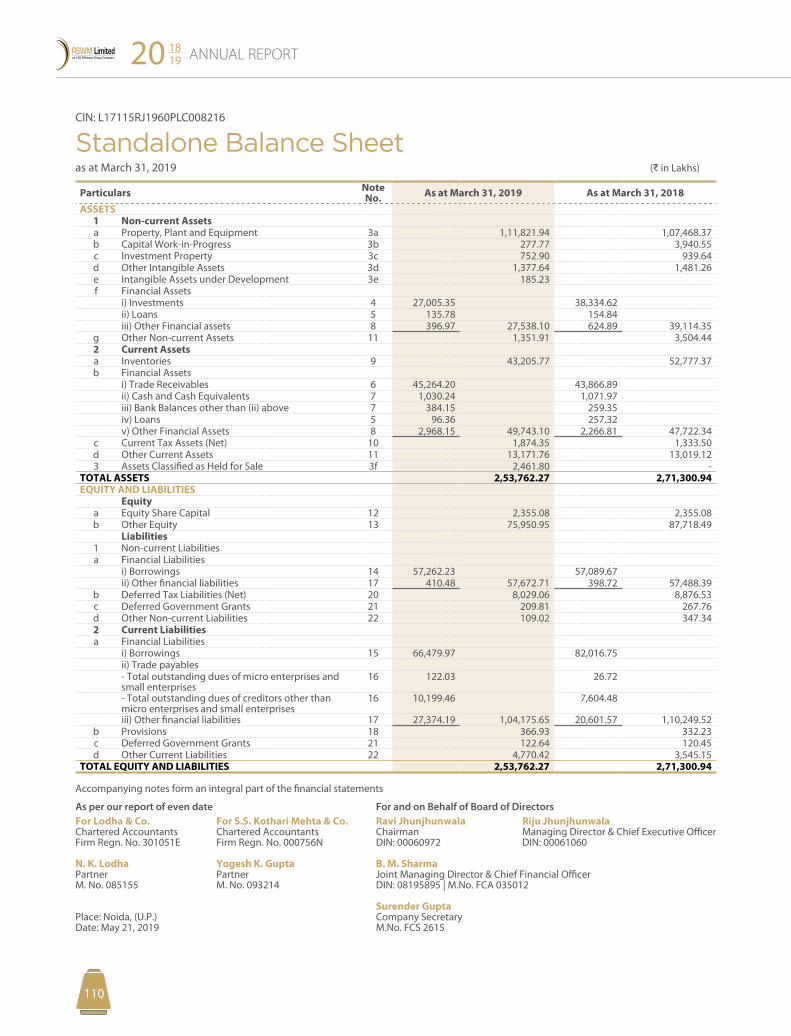
ANNUAL REPORT20 1819
111110
CIN: L17115RJ1960PLC008216
Standalone Balance Sheet as at March 31, 2019 (D in Lakhs)
Particulars Note No. As at March 31, 2019 As at March 31, 2018
ASSETS1 Non-current Assetsa Property, Plant and Equipment 3a 1,11,821.94 1,07,468.37 b Capital Work-in-Progress 3b 277.77 3,940.55 c Investment Property 3c 752.90 939.64 d Other Intangible Assets 3d 1,377.64 1,481.26 e Intangible Assets under Development 3e 185.23 f Financial Assets
i) Investments 4 27,005.35 38,334.62 ii) Loans 5 135.78 154.84 iii) Other Financial assets 8 396.97 27,538.10 624.89 39,114.35
g Other Non-current Assets 11 1,351.91 3,504.44 2 Current Assetsa Inventories 9 43,205.77 52,777.37 b Financial Assets
i) Trade Receivables 6 45,264.20 43,866.89 ii) Cash and Cash Equivalents 7 1,030.24 1,071.97 iii) Bank Balances other than (ii) above 7 384.15 259.35 iv) Loans 5 96.36 257.32 v) Other Financial Assets 8 2,968.15 49,743.10 2,266.81 47,722.34
c Current Tax Assets (Net) 10 1,874.35 1,333.50 d Other Current Assets 11 13,171.76 13,019.12 3 Assets Classified as Held for Sale 3f 2,461.80 -
TOTAL ASSETS 2,53,762.27 2,71,300.94 EQUITY AND LIABILITIES
Equitya Equity Share Capital 12 2,355.08 2,355.08 b Other Equity 13 75,950.95 87,718.49
Liabilities1 Non-current Liabilitiesa Financial Liabilities
i) Borrowings 14 57,262.23 57,089.67 ii) Other financial liabilities 17 410.48 57,672.71 398.72 57,488.39
b Deferred Tax Liabilities (Net) 20 8,029.06 8,876.53 c Deferred Government Grants 21 209.81 267.76 d Other Non-current Liabilities 22 109.02 347.34 2 Current Liabilitiesa Financial Liabilities
i) Borrowings 15 66,479.97 82,016.75 ii) Trade payables- Total outstanding dues of micro enterprises and small enterprises
16 122.03 26.72
- Total outstanding dues of creditors other than micro enterprises and small enterprises
16 10,199.46 7,604.48
iii) Other financial liabilities 17 27,374.19 1,04,175.65 20,601.57 1,10,249.52 b Provisions 18 366.93 332.23 c Deferred Government Grants 21 122.64 120.45 d Other Current Liabilities 22 4,770.42 3,545.15
TOTAL EQUITY AND LIABILITIES 2,53,762.27 2,71,300.94
Accompanying notes form an integral part of the financial statements
As per our report of even date For and on Behalf of Board of DirectorsFor Lodha & Co. For S.S. Kothari Mehta & Co. Ravi Jhunjhunwala Riju JhunjhunwalaChartered Accountants Chartered Accountants Chairman Managing Director & Chief Executive OfficerFirm Regn. No. 301051E Firm Regn. No. 000756N DIN: 00060972 DIN: 00061060
N. K. Lodha Yogesh K. Gupta B. M. SharmaPartner Partner Joint Managing Director & Chief Financial OfficerM. No. 085155 M. No. 093214 DIN: 08195895 | M.No. FCA 035012
Surender GuptaPlace: Noida, (U.P.) Company SecretaryDate: May 21, 2019 M.No. FCS 2615
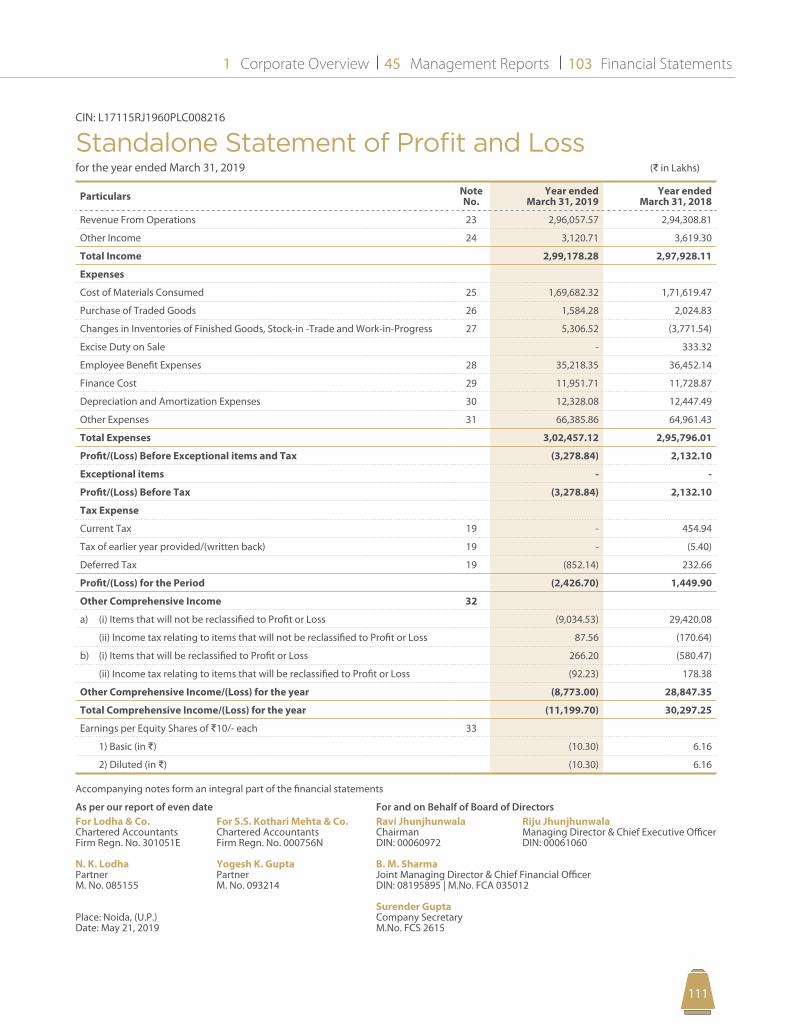
111110
Corporate Overview Management Reports Financial Statements1 45 103
CIN: L17115RJ1960PLC008216
Standalone Statement of Profit and Lossfor the year ended March 31, 2019 (D in Lakhs)
Particulars Note No.
Year ended March 31, 2019
Year endedMarch 31, 2018
Revenue From Operations 23 2,96,057.57 2,94,308.81
Other Income 24 3,120.71 3,619.30
Total Income 2,99,178.28 2,97,928.11
Expenses
Cost of Materials Consumed 25 1,69,682.32 1,71,619.47
Purchase of Traded Goods 26 1,584.28 2,024.83
Changes in Inventories of Finished Goods, Stock-in -Trade and Work-in-Progress 27 5,306.52 (3,771.54)
Excise Duty on Sale - 333.32
Employee Benefit Expenses 28 35,218.35 36,452.14
Finance Cost 29 11,951.71 11,728.87
Depreciation and Amortization Expenses 30 12,328.08 12,447.49
Other Expenses 31 66,385.86 64,961.43
Total Expenses 3,02,457.12 2,95,796.01
Profit/(Loss) Before Exceptional items and Tax (3,278.84) 2,132.10
Exceptional items - -
Profit/(Loss) Before Tax (3,278.84) 2,132.10
Tax Expense
Current Tax 19 - 454.94
Tax of earlier year provided/(written back) 19 - (5.40)
Deferred Tax 19 (852.14) 232.66
Profit/(Loss) for the Period (2,426.70) 1,449.90
Other Comprehensive Income 32
a) (i) Items that will not be reclassified to Profit or Loss (9,034.53) 29,420.08
(ii) Income tax relating to items that will not be reclassified to Profit or Loss 87.56 (170.64)
b) (i) Items that will be reclassified to Profit or Loss 266.20 (580.47)
(ii) Income tax relating to items that will be reclassified to Profit or Loss (92.23) 178.38
Other Comprehensive Income/(Loss) for the year (8,773.00) 28,847.35
Total Comprehensive Income/(Loss) for the year (11,199.70) 30,297.25
Earnings per Equity Shares of D10/- each 33
1) Basic (in D) (10.30) 6.16
2) Diluted (in D) (10.30) 6.16
Accompanying notes form an integral part of the financial statements
As per our report of even date For and on Behalf of Board of DirectorsFor Lodha & Co. For S.S. Kothari Mehta & Co. Ravi Jhunjhunwala Riju JhunjhunwalaChartered Accountants Chartered Accountants Chairman Managing Director & Chief Executive OfficerFirm Regn. No. 301051E Firm Regn. No. 000756N DIN: 00060972 DIN: 00061060
N. K. Lodha Yogesh K. Gupta B. M. SharmaPartner Partner Joint Managing Director & Chief Financial OfficerM. No. 085155 M. No. 093214 DIN: 08195895 | M.No. FCA 035012
Surender GuptaPlace: Noida, (U.P.) Company SecretaryDate: May 21, 2019 M.No. FCS 2615
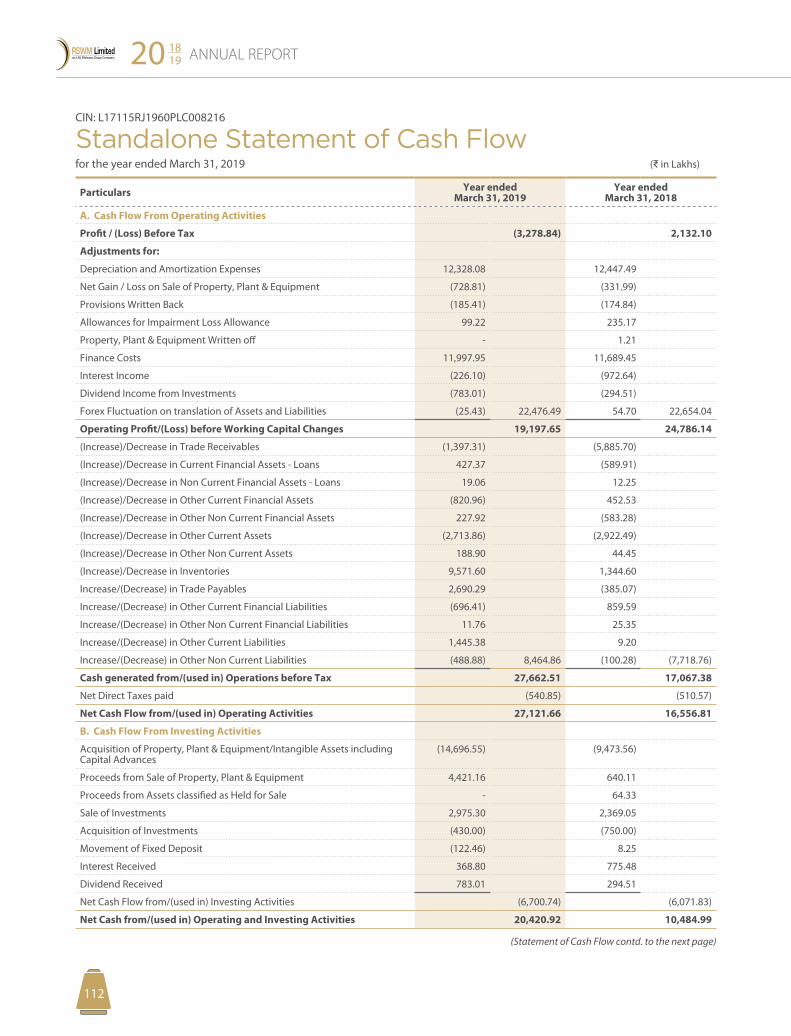
ANNUAL REPORT20 1819
113112
CIN: L17115RJ1960PLC008216
Standalone Statement of Cash Flow for the year ended March 31, 2019 (D in Lakhs)
Particulars Year ended March 31, 2019
Year ended March 31, 2018
A. Cash Flow From Operating Activities
Profit / (Loss) Before Tax (3,278.84) 2,132.10
Adjustments for:
Depreciation and Amortization Expenses 12,328.08 12,447.49
Net Gain / Loss on Sale of Property, Plant & Equipment (728.81) (331.99)
Provisions Written Back (185.41) (174.84)
Allowances for Impairment Loss Allowance 99.22 235.17
Property, Plant & Equipment Written off - 1.21
Finance Costs 11,997.95 11,689.45
Interest Income (226.10) (972.64)
Dividend Income from Investments (783.01) (294.51)
Forex Fluctuation on translation of Assets and Liabilities (25.43) 22,476.49 54.70 22,654.04
Operating Profit/(Loss) before Working Capital Changes 19,197.65 24,786.14
(Increase)/Decrease in Trade Receivables (1,397.31) (5,885.70)
(Increase)/Decrease in Current Financial Assets - Loans 427.37 (589.91)
(Increase)/Decrease in Non Current Financial Assets - Loans 19.06 12.25
(Increase)/Decrease in Other Current Financial Assets (820.96) 452.53
(Increase)/Decrease in Other Non Current Financial Assets 227.92 (583.28)
(Increase)/Decrease in Other Current Assets (2,713.86) (2,922.49)
(Increase)/Decrease in Other Non Current Assets 188.90 44.45
(Increase)/Decrease in Inventories 9,571.60 1,344.60
Increase/(Decrease) in Trade Payables 2,690.29 (385.07)
Increase/(Decrease) in Other Current Financial Liabilities (696.41) 859.59
Increase/(Decrease) in Other Non Current Financial Liabilities 11.76 25.35
Increase/(Decrease) in Other Current Liabilities 1,445.38 9.20
Increase/(Decrease) in Other Non Current Liabilities (488.88) 8,464.86 (100.28) (7,718.76)
Cash generated from/(used in) Operations before Tax 27,662.51 17,067.38
Net Direct Taxes paid (540.85) (510.57)
Net Cash Flow from/(used in) Operating Activities 27,121.66 16,556.81
B. Cash Flow From Investing Activities
Acquisition of Property, Plant & Equipment/Intangible Assets including Capital Advances
(14,696.55) (9,473.56)
Proceeds from Sale of Property, Plant & Equipment 4,421.16 640.11
Proceeds from Assets classified as Held for Sale - 64.33
Sale of Investments 2,975.30 2,369.05
Acquisition of Investments (430.00) (750.00)
Movement of Fixed Deposit (122.46) 8.25
Interest Received 368.80 775.48
Dividend Received 783.01 294.51
Net Cash Flow from/(used in) Investing Activities (6,700.74) (6,071.83)
Net Cash from/(used in) Operating and Investing Activities 20,420.92 10,484.99
(Statement of Cash Flow contd. to the next page)
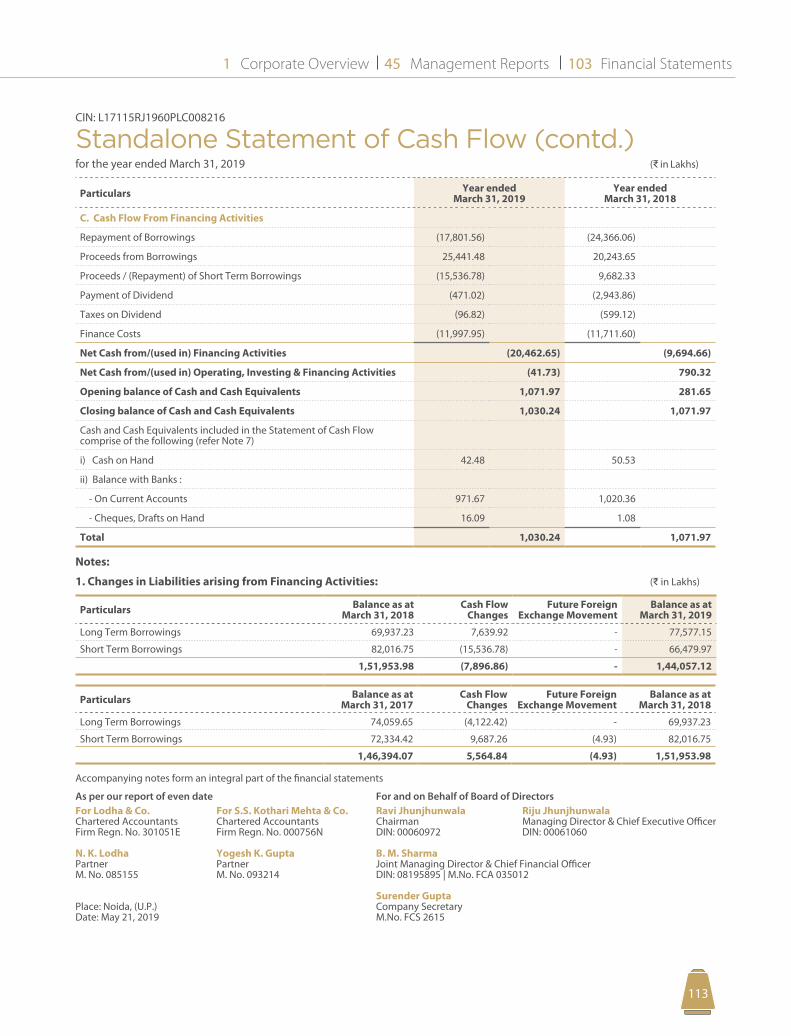
113112
Corporate Overview Management Reports Financial Statements1 45 103
CIN: L17115RJ1960PLC008216
Standalone Statement of Cash Flow (contd.) for the year ended March 31, 2019 (D in Lakhs)
Particulars Year ended March 31, 2019
Year ended March 31, 2018
C. Cash Flow From Financing Activities
Repayment of Borrowings (17,801.56) (24,366.06)
Proceeds from Borrowings 25,441.48 20,243.65
Proceeds / (Repayment) of Short Term Borrowings (15,536.78) 9,682.33
Payment of Dividend (471.02) (2,943.86)
Taxes on Dividend (96.82) (599.12)
Finance Costs (11,997.95) (11,711.60)
Net Cash from/(used in) Financing Activities (20,462.65) (9,694.66)
Net Cash from/(used in) Operating, Investing & Financing Activities (41.73) 790.32
Opening balance of Cash and Cash Equivalents 1,071.97 281.65
Closing balance of Cash and Cash Equivalents 1,030.24 1,071.97
Cash and Cash Equivalents included in the Statement of Cash Flow comprise of the following (refer Note 7)
i) Cash on Hand 42.48 50.53
ii) Balance with Banks :
- On Current Accounts 971.67 1,020.36
- Cheques, Drafts on Hand 16.09 1.08
Total 1,030.24 1,071.97
Notes:
1. Changes in Liabilities arising from Financing Activities: (D in Lakhs)
Particulars Balance as at March 31, 2018
Cash Flow Changes
Future Foreign Exchange Movement
Balance as at March 31, 2019
Long Term Borrowings 69,937.23 7,639.92 - 77,577.15
Short Term Borrowings 82,016.75 (15,536.78) - 66,479.97
1,51,953.98 (7,896.86) - 1,44,057.12
Particulars Balance as at March 31, 2017
Cash Flow Changes
Future Foreign Exchange Movement
Balance as at March 31, 2018
Long Term Borrowings 74,059.65 (4,122.42) - 69,937.23
Short Term Borrowings 72,334.42 9,687.26 (4.93) 82,016.75
1,46,394.07 5,564.84 (4.93) 1,51,953.98
Accompanying notes form an integral part of the financial statements
As per our report of even date For and on Behalf of Board of DirectorsFor Lodha & Co. For S.S. Kothari Mehta & Co. Ravi Jhunjhunwala Riju JhunjhunwalaChartered Accountants Chartered Accountants Chairman Managing Director & Chief Executive OfficerFirm Regn. No. 301051E Firm Regn. No. 000756N DIN: 00060972 DIN: 00061060
N. K. Lodha Yogesh K. Gupta B. M. SharmaPartner Partner Joint Managing Director & Chief Financial OfficerM. No. 085155 M. No. 093214 DIN: 08195895 | M.No. FCA 035012
Surender GuptaPlace: Noida, (U.P.) Company SecretaryDate: May 21, 2019 M.No. FCS 2615
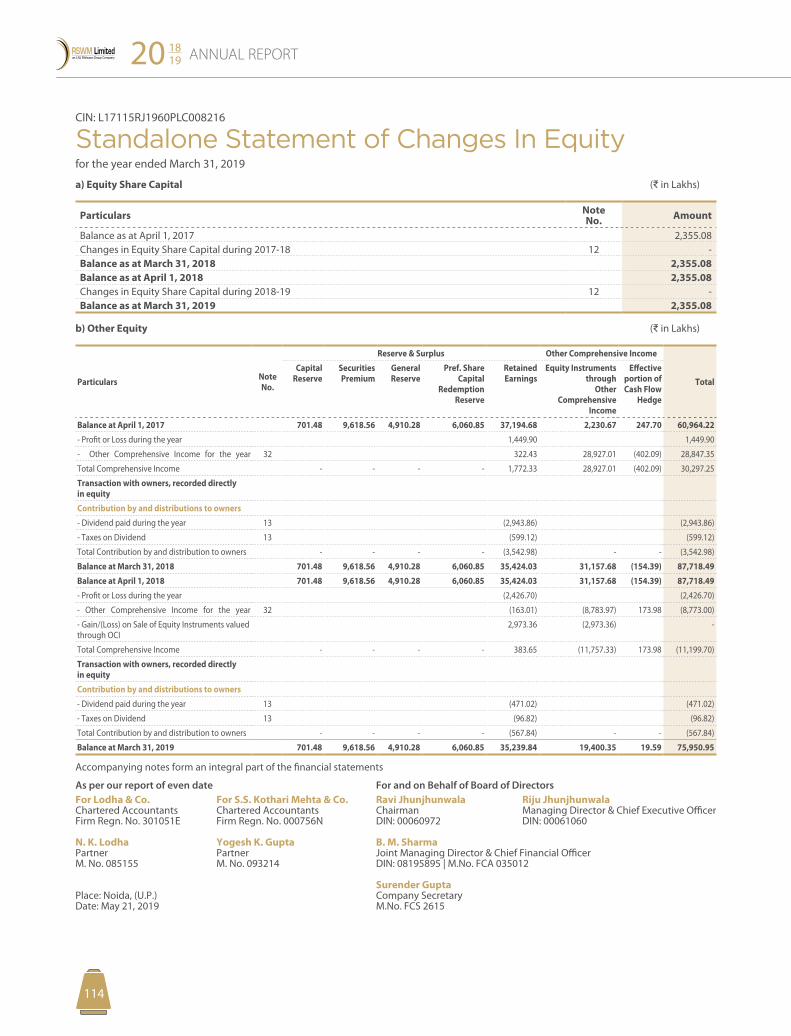
115114
ANNUAL REPORT20 1819
115114
CIN: L17115RJ1960PLC008216
Standalone Statement of Changes In Equity for the year ended March 31, 2019
a) Equity Share Capital (D in Lakhs)
Particulars NoteNo. Amount
Balance as at April 1, 2017 2,355.08 Changes in Equity Share Capital during 2017-18 12 - Balance as at March 31, 2018 2,355.08 Balance as at April 1, 2018 2,355.08 Changes in Equity Share Capital during 2018-19 12 - Balance as at March 31, 2019 2,355.08
b) Other Equity (D in Lakhs)
Particulars Note No.
Reserve & Surplus Other Comprehensive Income
TotalCapital
Reserve Securities Premium
General Reserve
Pref. Share Capital
Redemption Reserve
Retained Earnings
Equity Instruments through
Other Comprehensive
Income
Effective portion of Cash Flow
Hedge
Balance at April 1, 2017 701.48 9,618.56 4,910.28 6,060.85 37,194.68 2,230.67 247.70 60,964.22
- Profit or Loss during the year 1,449.90 1,449.90
- Other Comprehensive Income for the year 32 322.43 28,927.01 (402.09) 28,847.35
Total Comprehensive Income - - - - 1,772.33 28,927.01 (402.09) 30,297.25
Transaction with owners, recorded directly in equity
Contribution by and distributions to owners
- Dividend paid during the year 13 (2,943.86) (2,943.86)
- Taxes on Dividend 13 (599.12) (599.12)
Total Contribution by and distribution to owners - - - - (3,542.98) - - (3,542.98)
Balance at March 31, 2018 701.48 9,618.56 4,910.28 6,060.85 35,424.03 31,157.68 (154.39) 87,718.49
Balance at April 1, 2018 701.48 9,618.56 4,910.28 6,060.85 35,424.03 31,157.68 (154.39) 87,718.49
- Profit or Loss during the year (2,426.70) (2,426.70)
- Other Comprehensive Income for the year 32 (163.01) (8,783.97) 173.98 (8,773.00)
- Gain/(Loss) on Sale of Equity Instruments valued through OCI
2,973.36 (2,973.36) -
Total Comprehensive Income - - - - 383.65 (11,757.33) 173.98 (11,199.70)
Transaction with owners, recorded directly in equity
Contribution by and distributions to owners
- Dividend paid during the year 13 (471.02) (471.02)
- Taxes on Dividend 13 (96.82) (96.82)
Total Contribution by and distribution to owners - - - - (567.84) - - (567.84)
Balance at March 31, 2019 701.48 9,618.56 4,910.28 6,060.85 35,239.84 19,400.35 19.59 75,950.95
Accompanying notes form an integral part of the financial statements
As per our report of even date For and on Behalf of Board of DirectorsFor Lodha & Co. For S.S. Kothari Mehta & Co. Ravi Jhunjhunwala Riju JhunjhunwalaChartered Accountants Chartered Accountants Chairman Managing Director & Chief Executive OfficerFirm Regn. No. 301051E Firm Regn. No. 000756N DIN: 00060972 DIN: 00061060
N. K. Lodha Yogesh K. Gupta B. M. SharmaPartner Partner Joint Managing Director & Chief Financial OfficerM. No. 085155 M. No. 093214 DIN: 08195895 | M.No. FCA 035012
Surender GuptaPlace: Noida, (U.P.) Company SecretaryDate: May 21, 2019 M.No. FCS 2615
Corporate Overview Management Reports Financial Statements1 45 103
115114 115114
Notes to the Standalone Financial Statement for the year ended March 31, 2019
(Amounts in D Lakhs, unless otherwise stated)
1. Company Overview and Accounting Policies1.01 Company Overview
RSWM Limited (the “Company”) is a public limited company incorporated and domiciled in India and has its registered office at Kharigram, Gulabpura, district Bhilwara (Rajasthan, India). The Company has its primary listings on the BSE and NSE.
The Company is one of the largest textile manufacturing companies having multiple facilities to produce green fibre, yarn and fabric. The Company is primarily producing the best quality of yarns like synthetic, blended, mélange, cotton, speciality and value added yarns suitable for suitings, shirtings, hosiery, carpet, denim, technical textiles and industrial applications and denim fabric, synthetic fabric for renowned brands.
The financial statements of the Company for the year ended March 31, 2019 are approved for issue by the Company’s Board of Directors on May 21, 2019.
1.02 Basis of Preparation of Financial Statements
The financial statements are prepared in accordance with Indian Accounting Standards (Ind AS), as prescribed under section 133 of the Companies Act, 2013 (‘Act’) (to the extent notified) read with the Rules 3 of the Companies (Indian Accounting Standard) Rules 2015, as amended from time to time and guidelines issued by the Securities and Exchange Board of India (SEBI). The financial statements are prepared on going concern, accrual and historical cost basis except for the following assets and liabilities which have been measured at fair value:
• Defined benefit plans-plan assets measured at fair value.
• Assets classified as held for sale measured at fair value less cost to sell.
• Certain financial assets and liabilities measured at fair value (including derivative financial instruments) (Refer Accounting policy para 1.10 regarding financial instruments).
Accounting policies have been consistently applied except where a newly issued accounting standard is initially adopted or a revision to an existing accounting standard requires a change in the accounting policy hitherto in use.
The financial statements are presented in D which is also the Company’s functional currency and all values are rounded to the nearest D in Lakhs, except where otherwise indicated.
(a) Use of Estimates
The preparation of the financial statements in conformity with Ind AS requires management to make estimates, judgments and assumptions. These estimates, judgments and assumptions affect the application of accounting policies and the reported amounts of assets and liabilities, the disclosures of contingent assets and liabilities at the date of the financial statements and reported amounts of revenues and expenses during the period. Application of accounting policies that require critical accounting estimates involving complex and subjective judgments and the use of assumptions in these financial statements have been disclosed in Note 2.
Accounting estimates could change from period to period. Actual results could differ from those estimates. Appropriate changes in estimates are made as management becomes aware of changes in circumstances surrounding the estimates. Changes in estimates are reflected in the financial statements in the period in which changes are made and, if material, their effects are disclosed in the notes to the financial statements.
(b) Classification of Assets and Liabilities as Current and Non-Current
All Assets and Liabilities have been classified as current or non-current. Based on the nature of product and activities of the Company and their realization in cash and cash equivalent, the Company has determined its operating cycle as 12 months for the purpose of current and non-current classification of assets and liabilities.
Deferred tax assets and deferred tax liabilities are classified as non-current assets and liabilities.
1.03 Revenue Recognition
The Company has adopted Indian Accounting Standard 115 (Ind AS 115) -’Revenue from contracts with customers’ effective from April 1, 2018. The policy hitherto adopted by the Company was also similar to that of the provisions of Ind AS 115 and hence, the effect on adoption of the same is insignificant.
Revenue is recognised to the extent that it is probable that the economic benefits will flow to the Company and the revenue can be reliably measured regardless of when the payment made.
The specific recognition criteria described below must also be met before revenue is recognized.
ANNUAL REPORT20 1819
117116
Notes to the Standalone Financial Statement for the year ended March 31, 2019
(Amounts in D Lakhs, unless otherwise stated)
Revenue from Sale of goods and services
The Company derives revenue primarily from sale of Yarn, Fabric and other textile products.
Revenue from contracts with customers is recognized when the Company satisfies performance obligation by transferring promised goods or services to the customer or to his designated agent. Performance obligation is satisfied when the Company transfers significant risks and rewards to the customer and ceases its control over the goods.
Revenue is measured based on the transaction price, which is the consideration, adjusted for volume discounts, rebates, scheme allowances, price concessions and incentives, if any, as specified in the contracts with the customers. Revenue excludes taxes collected from customers on behalf of the government. Payments from customers for the goods and services rendered are normally received within the credit terms as per the contracts with the customers.
The Company recognizes sales return only when the goods are actually returned by the customer. Therefore, a refund liability which is included in current financial liabilities or is reduced from current financial assets, is recognized for the goods actually returned.
Revenue from sale of goods is recognized at the point of time when the significant risks and rewards are transferred to the customer and the Company ceases to have its control over the goods.
Revenue from job work charges is recognised at a point of time when the control is transferred usually when the material is fully processed and dispatched to customers.
Incentives on exports and other Government incentives related to operations are recognized in books after due consideration of certainty of utilization/receipt of such incentives. For Government Grant refer Para 1.04.
Interest income
Interest income on debt instruments measured at amortized cost is recorded using the Effective Interest Rate method (EIR).
EIR is the rate that exactly discounts the estimated future cash payments or receipts over the expected life of the financial instrument or a shorter period, where appropriate, to the gross carrying amount of the financial asset or to the amortised cost
of a financial liability. While calculating the effective interest rate, the Company estimates the expected cash flows by considering all the contractual terms of the financial instrument (for example, prepayment, extension, call and similar options) but does not consider the expected credit losses. Interest income is included in other income in the statement of profit and loss.
Dividend Income
Dividend income is recognized in the statement of profit and loss when the right to receive payment is established, which is generally when shareholders approve the dividend or Board of Directors of the investee company approve the interim dividend.
Rental Income
Rental income arising from leases on investment properties is accounted for on a straight-line basis except where the rentals are structured to change in line with expected general inflation over the lease terms.
Contract balances
Contract assets: A contract asset is the right to consideration in exchange for goods or services transferred to the customer. If the Company performs by transferring goods or services to a customer before the customer pays consideration or before payment is due, a contract asset is recognized for the earned consideration.
Trade receivables: A receivable represents the Company’s right to an amount of consideration that is unconditional (i.e., only the passage of time is required before payment of the consideration is due).
Contract liabilities: A contract liability is the obligation to transfer goods or services to a customer for which the Company has received consideration from the customer. If a customer pays consideration before the Company transfers goods or services to the customer, a contract liability is recognized when the payment is made. Contract liabilities are recognized as revenue when the Company performs under the contract.
Cost to obtain a contract: The cost to obtain a contract is normally the sales commission which the Company pays to its selling agents. Since, the amortization period of the goods for which the Company incurs such cost, is one year or less than that, the Company expenses it off immediately and the same is included in selling expenses under the head, ‘Other Expenses’.
Corporate Overview Management Reports Financial Statements1 45 103
117116
Notes to the Standalone Financial Statement for the year ended March 31, 2019
(Amounts in D Lakhs, unless otherwise stated)
1.04 Government Grants and Government Assistance
Government grants/subsidies are recognised where there is reasonable assurance that the grant will be received and all attached conditions will be complied with. If the grants/subsidies relate to an expense item, they are recognised as income on a systematic basis over the periods that the related costs, for which they are intended to compensate, are expensed. The grants, whose primary condition requires the Company to purchase, construct or otherwise acquire long-term assets, are recognised as deferred income and they are recognised as income in equal amounts over the expected useful lives of the related assets. If the grants/subsidies are related to subvention of a particular expense, are deducted from that expense in the year of recognition of government grants/subsidies.
1.05 Inventory Valuation
Inventories including goods-in-transit are measured at lower of cost and net realizable value. However, raw material (Including packing material), and other items held for use in the production of inventories are not written down below cost if the finished products in which they will be incorporated are expected to be sold at or above cost.
Costs incurred in bringing each product to its present location and condition are accounted for as follows:-
Raw materials (including packing material) stores and spares and loose tools: cost includes cost of purchase and other costs incurred in bringing the inventories to their present location and condition. Cost is determined on weighted average basis.
Finished goods and work in progress: cost includes cost of direct materials and labour and a proportion of manufacturing overheads based on the normal operating capacity, but excluding borrowing costs. Cost is determined on weighted average cost basis.
Traded goods: cost includes cost of purchase and other costs incurred in bringing the inventories to their present location and condition. Cost is determined on weighted average basis.
Waste: is valued at net realisable value.
Net realisable value is the estimated selling price in the ordinary course of business, less estimated costs of completion and the estimated costs necessary to make the sale.
1.06 Property, Plant and Equipment
Recognition and measurement
Property, Plant and Equipment acquired are stated at original cost net of tax/duty credit availed, less accumulated depreciation and accumulated impairment losses, if any. Such cost includes the cost of replacing part of the plant and equipment and borrowing costs for long-term construction projects, if the recognition criteria are met. The cost includes its purchase price, including import duties and non-refundable purchase taxes, after deducting trade discounts and rebates. It includes other costs directly attributable to bringing the Property, Plant and Equipment to the location and condition necessary for it to be capable of operating in the manner intended by management.
The present value of the expected cost for the decommissioning of Property, Plant and Equipment after its use is included in the cost of the respective Property, Plant and Equipment if the recognition criteria for a provision are met.
Capital work-in-progress includes cost of Property, Plant and Equipment under installation/under development as at the Balance Sheet date. Advances paid towards the acquisition of Property, Plant and Equipment outstanding at each balance sheet date is classified as capital advances under other non-current assets and the cost of Property, Plant and Equipment not available for use before such date are disclosed under ‘Capital work-in-progress’.
Subsequent expenditure
Subsequent expenditures relating to Property, Plant and Equipment is capitalized only when it is probable that future economic benefits associated with these will flow to the Company and the costs of the item can be measured reliably. The cost and related accumulated depreciation are eliminated from the financial statements upon sale or retirement of the Property, Plant and Equipment and the resultant gain or losses are recognized in the statement of profit and loss.
Depreciation
Depreciation on Property, Plant and Equipment is calculated on a straight-line basis over the estimated useful life of Property, Plant and Equipment which coincide with Schedule II to the Companies Act, 2013. Estimated useful life of the assets is given below:
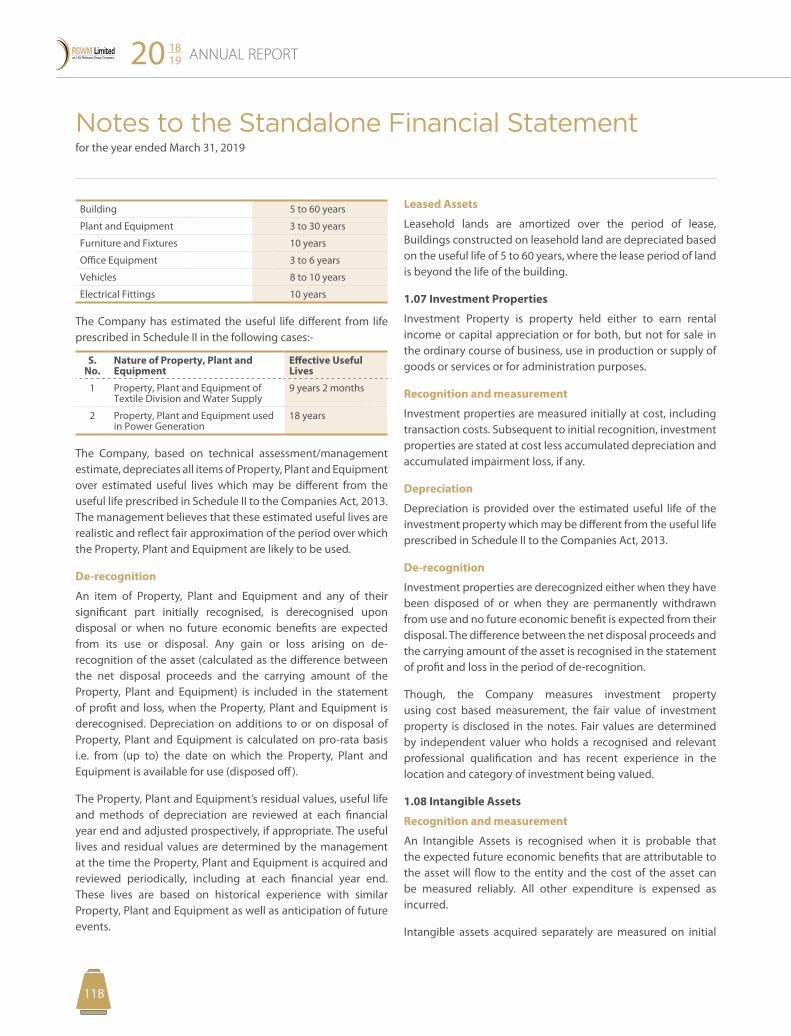
ANNUAL REPORT20 1819
119118
Notes to the Standalone Financial Statement for the year ended March 31, 2019
(Amounts in D Lakhs, unless otherwise stated)
Building 5 to 60 years
Plant and Equipment 3 to 30 years
Furniture and Fixtures 10 years
Office Equipment 3 to 6 years
Vehicles 8 to 10 years
Electrical Fittings 10 years
The Company has estimated the useful life different from life prescribed in Schedule II in the following cases:-
S. No.
Nature of Property, Plant and Equipment
Effective Useful Lives
1 Property, Plant and Equipment of Textile Division and Water Supply
9 years 2 months
2 Property, Plant and Equipment used in Power Generation
18 years
The Company, based on technical assessment/management estimate, depreciates all items of Property, Plant and Equipment over estimated useful lives which may be different from the useful life prescribed in Schedule II to the Companies Act, 2013. The management believes that these estimated useful lives are realistic and reflect fair approximation of the period over which the Property, Plant and Equipment are likely to be used.
De-recognition
An item of Property, Plant and Equipment and any of their significant part initially recognised, is derecognised upon disposal or when no future economic benefits are expected from its use or disposal. Any gain or loss arising on de-recognition of the asset (calculated as the difference between the net disposal proceeds and the carrying amount of the Property, Plant and Equipment) is included in the statement of profit and loss, when the Property, Plant and Equipment is derecognised. Depreciation on additions to or on disposal of Property, Plant and Equipment is calculated on pro-rata basis i.e. from (up to) the date on which the Property, Plant and Equipment is available for use (disposed off).
The Property, Plant and Equipment’s residual values, useful life and methods of depreciation are reviewed at each financial year end and adjusted prospectively, if appropriate. The useful lives and residual values are determined by the management at the time the Property, Plant and Equipment is acquired and reviewed periodically, including at each financial year end. These lives are based on historical experience with similar Property, Plant and Equipment as well as anticipation of future events.
Leased Assets
Leasehold lands are amortized over the period of lease, Buildings constructed on leasehold land are depreciated based on the useful life of 5 to 60 years, where the lease period of land is beyond the life of the building.
1.07 Investment Properties
Investment Property is property held either to earn rental income or capital appreciation or for both, but not for sale in the ordinary course of business, use in production or supply of goods or services or for administration purposes.
Recognition and measurement
Investment properties are measured initially at cost, including transaction costs. Subsequent to initial recognition, investment properties are stated at cost less accumulated depreciation and accumulated impairment loss, if any.
Depreciation
Depreciation is provided over the estimated useful life of the investment property which may be different from the useful life prescribed in Schedule II to the Companies Act, 2013.
De-recognition
Investment properties are derecognized either when they have been disposed of or when they are permanently withdrawn from use and no future economic benefit is expected from their disposal. The difference between the net disposal proceeds and the carrying amount of the asset is recognised in the statement of profit and loss in the period of de-recognition.
Though, the Company measures investment property using cost based measurement, the fair value of investment property is disclosed in the notes. Fair values are determined by independent valuer who holds a recognised and relevant professional qualification and has recent experience in the location and category of investment being valued.
1.08 Intangible Assets
Recognition and measurement
An Intangible Assets is recognised when it is probable that the expected future economic benefits that are attributable to the asset will flow to the entity and the cost of the asset can be measured reliably. All other expenditure is expensed as incurred.
Intangible assets acquired separately are measured on initial
Corporate Overview Management Reports Financial Statements1 45 103
119118
Notes to the Standalone Financial Statement for the year ended March 31, 2019
(Amounts in D Lakhs, unless otherwise stated)
recognition at cost. Subsequent to initial recognition, intangible assets are carried at cost less any accumulated amortization and accumulated impairment losses.
The cost of a separately acquired intangible asset comprises of its purchase price, including import duties and non-refundable purchase taxes, after deducting trade discounts and rebates; and any directly attributable cost of preparing the asset for its intended use.
Internally generated intangibles, excluding capitalised development costs, are not capitalised and the related expenditure is reflected in the statement of profit and loss in the period in which the expenditure is incurred.
Goodwill acquired and/or arising upon business combinations, initially recognized at cost and at subsequent period at cost less accumulated impairment loss, if any.
Amortization
The useful lives of intangible assets are assessed as either finite or indefinite. The amortisation period and the amortisation method for an intangible asset with a finite useful life are reviewed at least at the end of each reporting period. Changes in the expected useful life or the expected pattern of consumption of future economic benefits embodied in the asset are considered to modify the amortisation period or method, as appropriate, and are treated as changes in accounting estimates.
Intangible assets with finite lives are amortised over the useful economic life and assessed for impairment whenever there is an indication that the intangible asset may be impaired. The amortisation expense on intangible assets with finite lives is recognised in the statement of profit and loss unless such expenditure forms part of carrying value of another asset.
Intangible assets with indefinite useful lives are not amortised, but are tested for impairment annually, either individually or at the cash-generating unit level.
The estimated useful life of the finite intangible assets is given below:
Sr. no. Nature of Assets Effective Useful Lives
Amortization method used
1. Intangible Assets acquired
6 years Amortized on a Straight Line Basis over the useful life
2. Intangible Assets being right to use
18 years 4 months
An intangible asset is derecognised on disposal or when no future economic benefit is expected from use or disposal. Gains or losses arising from de-recognition of an intangible asset are measured as the difference between the net disposal proceeds and the carrying amount of the asset and are recognised in the statement of profit and loss when the asset is derecognised.
Research and development costs
Research costs are expensed as incurred. Development expenditures on an individual project are recognised as an intangible asset when the Company can demonstrate:
• The technical feasibility of completing the intangible asset so that the asset will be available for use or sale
• Its intention to complete and its ability and intention to use or sell the asset
• How the asset will generate future economic benefits
• The availability of resources to complete the asset
• The ability to measure reliably the expenditure during development
Following initial recognition of the development expenditure as an asset, the asset is carried at cost less any accumulated amortisation and accumulated impairment losses. Amortisation of the asset begins when development is complete and the asset is available for use. It is amortised over the period of expected future benefit. Amortisation expense is recognised in the statement of profit and loss unless such expenditure forms part of carrying value of another asset.
During the period of development, the asset is tested for impairment annually.
1.09 Leases
The determination of whether an arrangement is (or contains) a lease is based on the substance of the arrangement at the inception of the lease. The arrangement is, or contains, a lease if fulfilment of the arrangement is dependent on the use of a specific asset or assets and the arrangement conveys a right to use the asset or assets, even if that right is not explicitly specified in an arrangement.
Where the Company is the lessee
A lease is classified at the inception date as a finance lease or an operating lease. A lease that transfers substantially all the risks and rewards incidental to ownership to the Company is classified as a finance lease.
ANNUAL REPORT20 1819
121120
Notes to the Standalone Financial Statement for the year ended March 31, 2019
(Amounts in D Lakhs, unless otherwise stated)
Finance leases are capitalised at the commencement of the lease at the inception date fair value of the leased property or, if lower, at the present value of the minimum lease payments. Lease payments are apportioned between finance charges and reduction of the lease liability so as to achieve a constant rate of interest on the remaining balance of the liability. Finance charges are recognised in finance costs in the statement of profit and loss, unless they are directly attributable to qualifying assets, in which case they are capitalized in accordance with the Company’s general policy on the borrowing costs.
A leased asset is depreciated over the useful life of the asset. However, if there is no reasonable certainty that the Company will obtain ownership by the end of the lease term, the asset is depreciated over the shorter of the estimated useful life of the asset and the lease term.
Operating lease payments are recognised as an expense in the statement of profit and loss on a straight-line basis over the lease term unless such payments are structured to increase in line with expected general inflation to compensate for the lessor expected inflationary cost increase. Lease Incentives received are recognised as an integral part of the total lease expense over the lease term.
Where the Company is the lessor
Leases in which the Company does not transfer substantially all the risks and rewards of ownership of an asset are classified as operating leases. Rental income from operating lease is recognised on a straight-line basis over the term of the relevant lease. Initial direct costs incurred in negotiating and arranging an operating lease are added to the carrying amount of the leased asset and recognised over the lease term on the same basis as rental income. Contingent rents are recognised as revenue in the period in which they are earned.
Leases are classified as finance leases when substantially all of the risks and rewards of ownership transfer from the Company to the lessee. Amounts due from lessees under finance leases are recorded as receivables at the Company’s net investment in the leases. Finance lease income is allocated to accounting periods so as to reflect a constant periodic rate of return on the net investment outstanding in respect of the lease.
1.10 Financial Instruments
A financial instrument is any contract that gives rise to a financial asset of one entity and a financial liability or equity instrument of another entity.
Financial assets
Initial recognition and measurement
All financial assets are recognised initially at fair value plus, in the case of financial assets not recorded at fair value through the statement of profit and loss, transaction costs that are attributable to the acquisition of the financial asset. Purchases or sales of financial assets that require delivery of assets within a time frame established by regulation or convention in the market place (regular way trades) are recognised on the trade date, i.e., the date that the Company commits to purchase or sell the assets.
Subsequent measurement
For purposes of subsequent measurement, financial assets are classified in below mentioned categories:
• Financial assets carried at amortised cost-debt
• Financial assets at fair value through other comprehensive income –equity
• Financial assets at fair value through other comprehensive income –debt
• Financial assets at fair value through the statement of profit and loss
(i) Financial assets carried at amortised cost-debt
A financial asset is subsequently measured at amortised cost, if it is held within a business model whose objective is to hold the asset in order to collect contractual cash flows and the contractual terms of the financial asset give rise on specified dates to cash flows that are solely payments of principal and interest on the principal amount outstanding.
(ii) Financial assets at fair value through other comprehensive income –equity
The Company measures all its equity investments except for investment in subsidiaries and associates, at fair value. Where the Company’s management has opted to present fair value gain and losses on equity investments in Other Comprehensive Income, there is no subsequent reclassification of fair value gains and losses to the statement of profit and loss. Dividend income from such investments is recognized in the statement of profit and loss as other income when the Company’s right to receive payments is established.
Corporate Overview Management Reports Financial Statements1 45 103
121120
Notes to the Standalone Financial Statement for the year ended March 31, 2019
(Amounts in D Lakhs, unless otherwise stated)
(iii) Financial assets at fair value through other comprehensive income –debt
A ‘debt instrument’ is classified as at the FVTOCI if both of the following criteria are met:
a) The objective of the business model is achieved both by collecting contractual cash flows and selling the financial assets, and
b) The asset’s contractual cash flows represent SPPI.
Debt instruments included within the FVTOCI category are measured initially as well as at each reporting date at fair value. Fair value movements are recognized in the Other Comprehensive Income (OCI). However, the Company recognizes interest income, impairment losses and reversals and foreign exchange gain or loss in the statement of profit and loss. On de-recognition of the asset, cumulative gain or loss previously recognised in OCI is reclassified from the equity to statement of profit and loss. Interest earned while holding FVTOCI debt instrument is reported as interest income using the EIR method.
(iv) Financial assets at fair value through the statement of profit and loss
A financial asset which is not classified in any of the above categories, are subsequently fair valued through the statement of profit and loss.
Trade Receivable
A Receivable is classified as a ‘trade receivable’, if it is in respect to the amount due from customers on account of goods sold or services rendered in the ordinary course of business. Trade receivables are recognised initially at fair value and subsequently measured at amortised cost using the effective interest method, less provision for impairment. For some trade receivables, the Company may obtain security in the form of guarantee, security deposit or letter of credit which can be called upon if the counterparty is in default under the terms of the agreement. Subsequent recoveries of amounts previously written off are credited to other Income.
De-recognition
The Company derecognizes a financial asset when the contractual rights to receive the cash flows from the financial asset expire or it transfers the financial asset and the transfer qualifies for de-recognition under Ind AS 109.
Impairment of Financial Assets
The Company recognizes loss allowances using the expected credit loss (ECL) model for the financial assets which are not fair valued through the statement of profit and loss. Loss allowance for trade receivables with no significant financing component is measured at an amount equal to lifetime ECL. For all other financial assets, expected credit losses are measured at an amount equal to the 12-month ECL, unless there has been a significant increase in credit risk from initial recognition in which case those are measured at lifetime ECL. The amount of expected credit losses (or reversal) that is required to adjust the loss allowance at the reporting date to the amount that is required to be recognized, is recognized as an impairment gain or loss in the statement of profit and loss.
Financial liabilities
Initial recognition and measurement
All financial liabilities are recognized initially at fair value and, in the case of loans and borrowings and payables, net of directly attributable transaction costs.
The Company’s financial liabilities include trade and other payables, loans and borrowings including bank overdrafts and derivative financial instruments.
Subsequent Measurement
The measurement of financial liabilities depends on their classification, as described below:
(a) Loans and borrowings
After initial recognition, interest-bearing loans and borrowings are subsequently measured at amortized cost using the EIR method. Gains and losses are recognized in the statement of profit and loss when the liabilities are derecognized as well as through the EIR amortization process.
Amortized cost is calculated by taking into account any discount or premium on acquisition and fees or costs that are an integral part of the EIR. The EIR amortization is included as finance costs in the statement of profit and loss.
(b) Trade and other payables.
A payable is classified as ’trade payable’ if it is in respect of the amount due on account of goods purchased or services received in the normal course of business. These amounts represent liabilities for goods and services provided to the Company prior to the end of financial year which are unpaid.
ANNUAL REPORT20 1819
123122
Notes to the Standalone Financial Statement for the year ended March 31, 2019
(Amounts in D Lakhs, unless otherwise stated)
Trade and other payables are presented as current liabilities unless payment is not due within 12 months after the reporting period. They are recognised initially at their fair value and subsequently measured at amortised cost using the effective interest method.
(c) Financial guarantee contracts
Financial guarantee contracts issued by the Company, are those contracts that require a payment to be made to reimburse the holder for a loss if incurs because the specified debtor fails to make a payment when due in accordance with the terms of a debt instrument. If material, financial guarantee contracts are recognised initially as a liability at fair value, adjusted for transaction costs that are directly attributable to the issuance of the guarantee. Subsequently, the liability is measured at the higher of the amount of loss allowance determined as per impairment requirements of Ind-AS 109 and the amount recognised less cumulative amortization.
De-recognition
A Financial Liability is de-recognized when the obligation under the liability is discharged or cancelled or expired. The difference between the carrying amount of a financial liability that has been extinguished or transferred to another party and the consideration paid, including any non-cash assets transferred or liabilities assumed, is recognised in the statement of profit and loss as other income or finance costs.
Embedded derivative
An embedded derivative is a component of a hybrid (combined) instrument that also includes a non-derivative host contract – with the effect that some of the cash flows of the combined instrument vary in a way similar to a stand- alone derivative. An embedded derivative causes some or all of the cash flows that otherwise would be required by the contract to be modified according to a specified interest rate, financial instrument price, commodity price, foreign exchange rate, index of prices or rates, credit rating or credit index, or other variable, provided in the case of a non-financial variable that the variable is not specific to a party to the contract.
If the hybrid contract contains a host that is a financial asset within the scope Ind-AS 109, the Company does not separate embedded derivatives. Rather, it applies the classification requirements contained in Ind-AS 109 to the entire hybrid contract. Derivatives embedded in all other host contracts are accounted for as separate derivatives and recorded at fair
value if their economic characteristics and risks are not closely related to those of the host contracts and the host contracts are not held for trading or designated at fair value though the statement of profit and loss. These embedded derivatives are measured at fair value with changes in fair value recognized in the statement of profit and loss, unless designated as effective hedging instruments.
Reclassification of financial assets and financial liabilities
The Company determines classification of financial assets and liabilities on initial recognition. After initial recognition, no reclassification is made for financial assets which are equity instruments and financial liabilities. For financial assets which are debt instruments, a reclassification is made only if there is a change in the business model for managing those assets. Changes to the business model are expected to be infrequent. The Company’s senior management determines change in the business model as a result of external or internal changes which are significant to the Company’s operations. Such changes are evident to external parties. A change in the business model occurs when the Company either begins or ceases to perform an activity that is significant to its operations. If the Company reclassifies financial assets, it applies the reclassification prospectively from the reclassification date which is the first day of the immediately next reporting period following the change in business model. The Company does not restate any previously recognised gains, losses (including impairment gains or losses) or interest.
Offsetting of financial instruments
Financial assets and financial liabilities are offset and the net amount is reported in the balance sheet if there is a currently enforceable legal right to offset the recognised amounts and there is an intention to settle on a net basis, to realize the assets and settle the liabilities simultaneously.
1.11 Impairment of Non-Financial Assets
Intangible assets, property, plant and equipment and associate measured at cost and other non-financial assets are evaluated for recoverability whenever events or changes in circumstances indicate that their carrying amounts may not be recoverable. For the purpose of impairment testing, the recoverable amount (i.e. the higher of the fair value less cost to sell and the value-in-use) is determined on an individual asset basis unless the asset does not generate cash flows that are largely independent of those from other assets. In such cases, the recoverable amount is determined for the Cash Generating Unit (CGU) to which the
Corporate Overview Management Reports Financial Statements1 45 103
123122
Notes to the Standalone Financial Statement for the year ended March 31, 2019
(Amounts in D Lakhs, unless otherwise stated)
asset belongs. If such assets are considered to be impaired, the impairment to be recognized in the statement of profit and loss is measured by the amount by which the carrying value of the assets exceeds the estimated recoverable amount of the asset. An impairment loss is reversed in the statement of profit and loss if there has been a change in the estimates used to determine the recoverable amount. The carrying amount of the asset is increased to its revised recoverable amount, provided that this amount does not exceed the carrying amount that would have been determined (net of any accumulated amortization or depreciation) had no impairment loss been recognized for the asset in prior years.
1.12 Foreign Exchange Transactions/Translations
The Company’s financial statements are presented in Indian Rupees which is the Company’s functional currency.
Transactions and balances
Foreign currency transactions are recorded, on initial recognition in the functional currency, by applying to the foreign currency amount the spot exchange rate between the functional currency and the foreign currency at the date of the transaction.
Monetary assets and liabilities denominated in foreign currencies (except financial instruments designated as Hedge Instruments) are translated at the functional currency spot rates of exchange at the reporting date.
Exchange differences arising on settlement or translation of monetary items are recognised in the statement of profit and loss with the exception of the following:
Monetary items that are designated as part of the cash flow hedge instrument are recognised in OCI.
Non-monetary items that are measured in terms of historical cost in a foreign currency are translated using the exchange rates at the dates of the initial transactions. The gain or loss arising on translation of non-monetary items measured at fair value is treated in line with the recognition of the gain or loss on the change in fair value of the item (i.e., translation differences on items whose fair value gain or loss is recognised in OCI or the statement of profit and loss are also recognised in OCI or the statement of profit and loss, respectively).
Derivative Financial Instruments and Hedge Accounting
The Company uses derivative instruments i.e. Forward contracts
to hedge its foreign currency risks. The Company designates these forward contracts as cash flow hedges to mitigate the risk of foreign exchange exposure on highly probable forecast cash transactions. The Company has designated forward instruments on spot to spot basis. The Company recognises the forward points in the statement of profit and loss accounts.
When a derivative is designated as a cash flow hedging instrument, the effective portion of changes in the fair value of the derivative is recognized in other comprehensive income and accumulated in the cash flow hedging reserve. Any ineffective portion of changes in the fair value of the derivative is recognized immediately in the statement of profit and loss. If the hedging instrument no longer meets the criteria for hedge accounting, then hedge accounting is discontinued prospectively. If the hedging instrument expires or is sold, terminated or exercised, the cumulative gain or loss on the hedging instrument recognized in cash flow hedging reserve till the period the hedge was effective remains in cash flow hedging reserve until the forecasted transaction occurs. The cumulative gain or loss previously recognized in the cash flow hedging reserve is transferred in the statement of profit and loss upon the occurrence of the related forecasted transaction. If the forecasted transaction is no longer expected to occur, then the amount accumulated in cash flow hedging reserve is reclassified in the statement of profit and loss.
1.13 Employee Benefits
(a) Short Term Employee Benefit
Short-term employee benefit obligations are measured on undiscounted basis and are expensed as the related service is provided. A liability is recognised for the amount expected to be paid if the Company has a present legal or constructive obligation to pay this amount as a result of past service provided by the employee and the obligation can be estimated reliably.
(b) Defined Contribution Plan
The Company makes defined contribution to Employees Provident Fund Organisation (EPFO), Pension Fund, Superannuation Fund and Employees State Insurance (ESI), which are accounted on accrual basis as expenses in the statement of Profit and Loss in the period during which the related services are rendered by employees.
Prepaid contribution are recognised as an assets to the extent that a cash refund or reduction in future payments is available.
ANNUAL REPORT20 1819
125124
Notes to the Standalone Financial Statement for the year ended March 31, 2019
(Amounts in D Lakhs, unless otherwise stated)
(c) Defined Benefit Plan
The Company’s net obligation in respect of defined benefit plans is calculated separately for each plan by estimating the amount of future benefit that employees have earned in the current and prior periods, discounting that amount and deducting the fair value of any plan assets.
The calculation of defined benefit obligations is performed annually by a qualified actuary using the projected unit credit method. When the calculation results in a potential asset for the Company, the recognised asset is limited to the present value of economic benefits available in the form of any future refunds from the plan or reductions in future contributions to the plan. In order to calculate the present value of economic benefits, consideration is given to any applicable minimum funding requirements.
Remeasurement of the net defined benefit liability, which comprise actuarial gains and losses, the return on plan assets (excluding interest) and the effect of the asset ceiling (if any, excluding interest), are recognised immediately in other comprehensive Income. Net interest expense (income) on the net defined liability (assets) is computed by applying the discount rate, used to measure the net defined liability (asset), to the net defined liability (asset) at the start of the financial year after taking into account any changes as a result of contribution and benefit payments during the year. Net interest expense and other expenses related to defined benefit plans are recognised in the statement of profit and loss.
When the benefits of a plan are changed or when a plan is curtailed, the resulting change in benefit that relates to past service or the gain or loss on curtailment is recognised immediately in the statement of profit and loss. The Company recognises gains and losses on the settlement of a defined benefit plan when the settlement occurs.
In the case of one location, the Company has set up a trust for Contributions to provident fund, a defined benefit plan, in which the Company contributes as specified under the law. The Company is liable for future provident fund benefits to the extent of its annual contribution and any shortfall in fund assets based on government specified minimum rates of return relating to current period service and recognises such contributions and shortfall, if any, as an expense in the year of recognition.
(d) Other long-term employee benefits
The Company’s net obligation in respect of long-term employee benefits is the amount of future benefit that employees have earned in return for their service in the current and prior periods. That benefit is discounted to determine its present value and fair value of any related assets is deducted. The liability for other long term employee benefits are provided based on actuarial valuation as at the Balance Sheet date, based on Projected Unit Credit Method, carried out by an independent actuary. Re-measurements are recognised in the statement of profit and loss in the period in which they arise.
(e) Termination benefits
Termination benefits are recognized as an expense in the period in which they are incurred. The Company recognises a liability and expense for termination benefits at the earlier of the following dates:
(a) When the entity can no longer withdraw the offer of those benefits; and
(b) When the entity recognises costs for a restructuring that is within the scope of Ind AS 37 and involves the payment of termination benefits.
If the benefits are not expected to be settled wholly within twelve months of the reporting date, then they are discounted to present value.
1.14 Taxes on Income
Current income tax
Current income-tax is measured at the amount expected to be paid to the tax authorities in accordance with the Income-tax Act, 1961 enacted in India and tax laws prevailing in the respective tax jurisdictions where the Company operates. The tax rates and tax laws used to compute the amount are those that are enacted or substantively enacted, at the reporting date.
Current income tax relating to items recognised outside the statement of profit and loss is recognised outside the statement of profit and loss (either in other comprehensive income or in equity). Current tax items are recognised in correlation to the underlying transaction either in OCI or directly in equity. Management periodically evaluates positions taken in the tax returns with respect to situations in which applicable tax regulations are subject to interpretation and establishes provisions where appropriate.
Corporate Overview Management Reports Financial Statements1 45 103
125124
Notes to the Standalone Financial Statement for the year ended March 31, 2019
(Amounts in D Lakhs, unless otherwise stated)
Deferred tax
Deferred tax is provided using the liability method on temporary differences between the tax bases of assets and liabilities and their carrying amounts for financial reporting purposes at the reporting date.
Deferred tax liabilities are recognised for all taxable temporary differences, except:
• When the deferred tax liability arises from the initial recognition of goodwill or an asset or liability in a transaction that is not a business combination and, at the time of the transaction, affects neither the accounting profit nor taxable profit or loss.
• In respect of taxable temporary differences associated with investments in associates, when the timing of the reversal of the temporary differences can be controlled and it is probable that the temporary differences will not reverse in the foreseeable future.
Deferred tax assets are recognised for all deductible temporary differences, the carry forward of unused tax credits and any unused tax losses. Deferred tax assets are recognised to the extent that it is probable that taxable profit will be available against which the deductible temporary differences, and the carry forward of unused tax credits and unused tax losses can be utilised, except:
• When the deferred tax asset relating to the deductible temporary difference arises from the initial recognition of an asset or liability in a transaction that is not a business combination and, at the time of the transaction, affects neither the accounting profit nor taxable profit or loss.
• In respect of deductible temporary differences associated with investments in associates, deferred tax assets are recognised only to the extent that it is probable that the temporary differences will reverse in the foreseeable future and taxable profit will be available against which the temporary differences can be utilised.
The carrying amount of deferred tax assets is reviewed at each reporting date and reduced to the extent that it is no longer probable that sufficient taxable profit will be available to allow all or part of the deferred tax asset to be utilised. Unrecognised deferred tax assets are re-assessed at each reporting date and are recognised to the extent that it has become probable that future taxable profits will allow the deferred tax asset to be recovered.
Deferred tax assets and liabilities are measured at the tax rates that are expected to apply in the year when the asset is realised or the liability is settled, based on tax rates (and tax laws) that have been enacted or substantively enacted at the reporting date.
Deferred tax relating to items recognised outside the statement of profit and loss is recognised outside the statement of profit and loss (either in other comprehensive income or in equity). Deferred tax items are recognised in correlation to the underlying transaction either in OCI or directly in equity.
Deferred tax assets and deferred tax liabilities are offset if a legally enforceable right exists to set off current tax assets against current tax liabilities and the deferred taxes relate to the same taxable entity and the same taxation authority.
Deferred tax assets include Minimum Alternative Tax (MAT) paid in accordance with the tax laws in India, which is likely to give future economic benefits in the form of availability of set off against future income tax liability. Accordingly, MAT is recognised as deferred tax asset in the statement of financial position when the asset can be measured reliably and it is probable that the future economic benefit associated with the asset will be realised.
1.15 Provisions, Contingent Liabilities and Contingent Assets
Provisions are recognised when the Company has a present obligation (legal or constructive) as a result of a past event, it is probable that an outflow of resources embodying economic benefits will be required to settle the obligation and a reliable estimate can be made of the amount of the obligation. When the Company expects some or all of a provision to be reimbursed, for example, under an insurance contract, the reimbursement is recognised as a separate asset, but only when the reimbursement is virtually certain. The expense relating to a provision is presented in the statement of profit and loss net of any reimbursement.
If the effect of the time value of money is material, provisions are discounted using a current pre-tax rate that reflects, when appropriate, the risks specific to the liability. When discounting is used, the increase in the provision due to the passage of time is recognised as a finance cost.
Contingent Liability is disclosed after careful evaluation of facts, uncertainties and possibility of reimbursement, unless
ANNUAL REPORT20 1819
127126
Notes to the Standalone Financial Statement for the year ended March 31, 2019
(Amounts in D Lakhs, unless otherwise stated)
the possibility of an outflow of resources embodying economic benefits is remote. Contingent liabilities are not recognised but are disclosed in notes.
Contingent assets are not recognised. However, when the realisation of income is virtually certain, then the related asset is no longer a contingent asset, but it is recognised as an asset.
1.16 Segment Reporting
The Chief Operational Decision Maker monitors the operating results of its business Segments separately for the purpose of making decisions about resource allocation and performance assessment. Segment performance is evaluated based on profit or loss and is measured consistently with the profit or loss in the financial statements.
The Operating Segments have been identified on the basis of the nature of products/services.
a) Segment revenue includes sales and other income directly identifiable with/allocable to the segment including inter-segment revenue.
b) Expenses that are directly identifiable with/allocable to segments are considered for determining the segment results. Expenses which relate to the Company as a whole and not allocable to segments are included under un-allocable expenditure.
c) Income which relates to the Company as a whole and not allocable to segments is included in un-allocable income.
d) Segment result includes margin on inter-segment sales which are reduced in arriving at the profit before tax of the Company.
e) Segment assets and liabilities include those directly identifiable with the respective segments. Un-allocable assets and liabilities represent the assets and liabilities that relate to the Company as a whole and not allocable to any segment.
Inter-Segment transfer pricing
Segment revenue resulting from transactions with other business segments is accounted on the basis of transfer price agreed between the segments. Such transfer prices are either determined to yield a desired margin or agreed on a negotiated basis and are on an arm’s length basis in a manner similar to transactions with third parties.
These transfers are eliminated in consolidation.
1.17 Earning Per Share
Basic earnings per equity share is computed by dividing the net profit attributable to the equity holders of the Company by the weighted average number of equity shares outstanding during the period. Diluted earnings per equity share is computed by dividing the net profit attributable to the equity holders of the Company by the weighted average number of equity shares considered for deriving basic earnings per equity share and also the weighted average number of equity shares that could have been issued upon conversion of all dilutive potential equity shares. The dilutive potential equity shares are adjusted for the proceeds receivable had the equity shares been actually issued at fair value (i.e. the average market value of the outstanding equity shares). Dilutive potential equity shares are deemed converted as of the beginning of the period, unless issued at a later date. Dilutive potential equity shares are determined independently for each period presented. The number of equity shares and potentially dilutive equity shares are adjusted retrospectively for all periods presented for any share splits and bonus shares issues including for changes effected prior to the approval of the financial statements by the Board of Directors.
1.18 Statement of Cash Flow
Cash flows are reported using the indirect method, whereby profit for the period is adjusted for the effects of transactions of a non-cash nature, any deferrals or accruals of past or future operating cash receipts or payments and item of income or expenses associated with investing or financing cash flows. The cash flows from operating, investing and financing activities of the Company are segregated.
1.19 Borrowing Costs
Borrowing costs directly attributable to the acquisition, construction or production of an asset that necessarily takes a substantial period of time to get ready for its intended use or sale are capitalised as part of the cost of the asset. All other borrowing costs are expensed in the period in which they occur. Borrowing costs consist of interest and other costs that an entity incurs in connection with the borrowing of funds. Borrowing cost also includes exchange differences to the extent regarded as an adjustment to the borrowing costs.
Corporate Overview Management Reports Financial Statements1 45 103
127126
Notes to the Standalone Financial Statement for the year ended March 31, 2019
(Amounts in D Lakhs, unless otherwise stated)
1.20 Fair Value Measurement
The Company measures financial instruments, such as, derivatives at fair value at each balance sheet date.
Fair value is the price that would be received to sell an asset or paid to transfer a liability in an orderly transaction between market participants at the measurement date. The fair value measurement is based on the presumption that the transaction to sell the asset or transfer the liability takes place either:
• In the principal market for the asset or liability, or
• In the absence of a principal market, in the most advantageous market for the asset or liability and the Company has access to the principal or the most advantageous market.
The fair value of an asset or a liability is measured using the assumptions that market participants would use when pricing the asset or liability, assuming that market participants act in their economic best interest.
A fair value measurement of a non-financial asset takes into account a market participant’s ability to generate economic benefits by using the asset in its highest and best use or by selling it to another market participant that would use the asset in its highest and best use.
The Company uses valuation techniques that are appropriate in the circumstances and for which sufficient data are available to measure fair value, maximising the use of relevant observable inputs and minimising the use of unobservable inputs.
All assets and liabilities for which fair value is measured or disclosed in the financial statements are categorised within the fair value hierarchy, described as follows, based on the lowest level input that is significant to the fair value measurement as a whole:
Level 1 - Quoted (unadjusted) market prices in active markets for identical assets or liabilities
Level 2 - Valuation techniques for which the lowest level input that is significant to the fair value measurement is directly or indirectly observable.
Level 3 - Valuation techniques for which the lowest level input that is significant to the fair value measurement is unobservable.
For assets and liabilities that are recognised in the financial statements on a recurring basis, the Company determines
whether transfers have occurred between levels in the hierarchy by re-assessing categorisation (based on the lowest level input that is significant to the fair value measurement as a whole) at the end of each reporting period.
For the purpose of fair value disclosures, the Company has determined classes of assets and liabilities on the basis of the nature, characteristics and the risks of the asset or liability and the level of the fair value hierarchy as explained above. This note summarises accounting policy for fair value. Other fair value related disclosures are given in the relevant notes.
1.21 Cash and Cash Equivalents
Cash and cash equivalents in the balance sheet comprise cash at banks and on hand, short-term deposits and other short-term highly liquid investments with an original maturity of three months or less that are readily convertible to a known amount of cash and are subject to an insignificant risk of changes in value and are held for the purpose of meeting short-term cash commitments.
For the purposes of the presentation of cash flow statement, cash and cash equivalents include cash on hand, in banks and demand deposits with banks, net of outstanding bank overdrafts that are repayable on demand, book overdraft as they being considered as integral part of the Company’s cash management system.
1.22 Non-Current Assets Held for Sale
The Company classifies non-current assets and disposal groups as held for sale if their carrying amounts will be recovered principally through a sale/distribution rather than through continuing use and the sale is considered highly probable. Management is committed to the sale within one year from the date of classification.
The Company treats sale/distribution of the asset or disposal group to be highly probable when:
• The appropriate level of management is committed to a plan to sell the asset (or disposal group),
• An active programme to locate a buyer and complete the plan has been initiated (if applicable),
• The asset (or disposal group) is being actively marketed for sale at a price that is reasonable in relation to its current fair value.
• The sale is expected to qualify for recognition as a completed sale within one year from the date of classification, and
ANNUAL REPORT20 1819
129128
Notes to the Standalone Financial Statement for the year ended March 31, 2019
(Amounts in D Lakhs, unless otherwise stated)
• Actions required to complete the plan indicated that it is unlikely that significant changes to the plan will be made or that the plan will be withdrawn.
Non-current asset held for sale/for distribution to owners and disposal groups are measured at the lower of their carrying amount and the fair value less costs to sell/distribute. Assets and liabilities classified as held for sale/distribution are presented separately in the balance sheet.
Property, plant and equipment and intangible assets once classified as held for sale/distribution to owners are neither depreciated nor amortized.
1.23 Investments in Subsidiaries and Associates
A subsidiary is an entity in which the Company either at its own or together with one or more of its subsidiary companies, has acquired more than one-half of its total share capital. The investment in subsidiaries are carried at cost less impairments. The cost comprises, price paid to acquire investment and directly attributable cost.
An associate is an entity over which the Company has significant influence. Significant influence is the power to participate in the financial and operating policy decisions of the investee but is not control or joint control over those policies. The investment in associates are carried at cost less impairments. The cost comprises, price paid to acquire investment and directly attributable cost.
2. Use of Critical Judgments, Estimates and Assumptions
The preparation of the Company’s financial statements requires management to make judgments, estimates and assumptions that affect the reported amounts of revenues, expenses, assets and liabilities, the accompanying disclosures, and the disclosure of contingent liabilities.
The key assumptions concerning the future and other key sources of estimation uncertainty at the reporting date, that have a significant risk of causing a material adjustment to carrying amounts of assets and liabilities within the next financial years are described below. The Company based its assumptions and estimates or parameters available when the financial statements were prepared. Existing circumstances and assumptions about future developments, however, may change due to market changes or circumstances arising that
are beyond the control of the Company. Such changes are reflected in the assumptions when they occur.
(a) Property, Plant and Equipment and Intangible assets
Internal technical or user team assesses the remaining useful life of the Property, Plant and Equipment and Intangible assets. Management believes that assigned useful lives are reasonable.
(b) Embedded Lease
In assessing the applicability to arrangement entered into by the Company, the management has exercised the judgment to evaluate the right to use the asset or assets on substance of the transaction including legally enforced arrangement and other significant terms of the contract to conclude whether the arrangement meets the criteria under Appendix C of the Ind AS 17.
(c) Impairment of non-financial assets
In assessing value in use, the estimated future cash flows are discounted to their present value using a pre-tax discount rate that reflects current market assessments of the time value of money and the risks specific to the asset.
In determining fair value less costs of disposal, recent market transactions are taken into account. If no such transactions can be identified, an appropriate valuation model is used. These calculations are corroborated by valuation multiples, quoted share prices for publicly traded companies or other available fair value indicators.
(d) Impairment of financial assets
The impairment provisions for financial assets are based on assumptions about risk of default and expected loss rates. The Company uses judgement in making assumption and selecting the inputs to the impairment calculation, based on Company’s past history, existing market conditions as well as forward estimate at the end of each reporting period.
(e) Investment in subsidiaries and associates
A subsidiary is an entity in which the Company either at its own or together with one or more of its subsidiary companies, has acquired more than one half of its total share capital. As on March 31, 2019, the Company holds 54.26% of equity shares in LNJ Skills and Rozgar Private Limited and therefore the said company has been termed as subsidiary of the Company.
As per Ind AS 28, an entity is considered as an associate when the investing Company has significant influence over the
Corporate Overview Management Reports Financial Statements1 45 103
129128
Notes to the Standalone Financial Statement for the year ended March 31, 2019
(Amounts in D Lakhs, unless otherwise stated)
entity. The existence of significant influence by an investor is determined based on factors such as, representation on the board of directors or equivalent governing body of investee, participation in policy-making processes, including participation in decisions about dividends or other distributions, material transactions between the entity and it’s investee, interchange of managerial personnel or provision of essential technical information. The Company holds 17.78% (which is less than 20 %) of the equity shares of Bhilwara Energy Limited (BEL). As the amount invested in BEL is significant, the board of directors regularly reviews the progress of the BEL and suggestion/comments/concerns of the board of Company are conveyed to the board of directors of BEL by common directors. In order to monitor the progress of BEL, the board of directors has decided to nominate at least one director on the board of BEL. In Light of above, the board of directors have concluded that, the Company has a significant influence on BEL.
(f) Assets Held for Sale
Management’s Judgment is required for identifying the assets which are classified as held for sale if their carrying amount will be recovered principally through a sale transaction rather than through continuing use. This condition is regarded as met only when the asset is available for immediate sale in its present condition subject only to terms that are usual and customary for sales of such asset and its sale is highly probable which could lead to significant judgment. Management is committed to the sale, which should be expected to qualify for recognition as a completed sale within one year from the date of classification.
(g) Income taxes
Management’s judgment is required for the calculation of provision for income taxes and deferred tax assets and liabilities. The Company reviews at each balance sheet date the carrying amount of deferred tax assets. The factors used in estimates may differ from actual outcome which could lead to significant adjustment to the amounts reported in the financial statements.
(h) Contingencies
Management’s judgment is required for estimating the possible outflow of resources, if any, in respect of contingencies/claim/litigations against the Company as it is not possible to predict the outcome of pending matters with accuracy.
(i) Defined Benefit Plans
The cost of the defined benefit plans and other post-employment benefits and the present value of such obligations are determined using actuarial valuations. An actuarial valuation involves making various assumptions that may differ from actual developments in future. These include the determination of the discount rate, future salary increases, mortality rates and attrition rate. Due to the complexities involved in the valuation and its long-term nature, a defined benefit obligation is highly sensitive to changes in these assumptions. All assumptions are reviewed at each reporting date.
(j) Insurance claims
Insurance claims are recognized when the Company has reasonable certainty of recovery. Subsequently any change in recoverability is provided for.
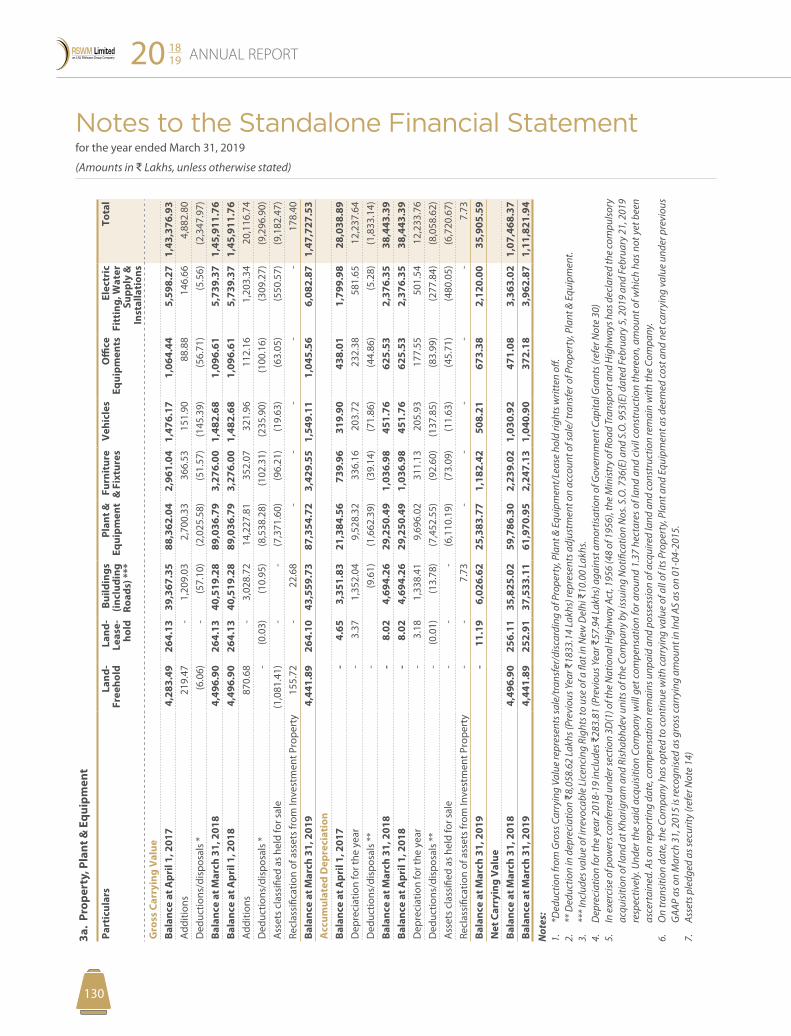
Notes to the Standalone Financial Statement for the year ended March 31, 2019
(Amounts in D Lakhs, unless otherwise stated)
ANNUAL REPORT20 1819
131130
3a.
Prop
erty
, Pla
nt &
Equ
ipm
ent
Part
icul
ars
Land
-Fr
eeho
ldLa
nd-
Leas
e-ho
ld
Build
ings
(in
clud
ing
Road
s) *
**
Plan
t &
Equi
pmen
tFu
rnit
ure
& F
ixtu
res
Veh
icle
sO
ffice
Eq
uipm
ents
Elec
tric
Fi
ttin
g, W
ater
Su
pply
&
Inst
alla
tion
s
Tota
l
Gro
ss C
arry
ing
Val
ue
Bala
nce
at A
pril
1, 2
017
4,2
83.4
9 2
64.1
3 3
9,36
7.35
8
8,36
2.04
2
,961
.04
1,4
76.1
7 1,
064.
44
5,59
8.27
1,
43,3
76.9
3 A
dditi
ons
219
.47
- 1
,209
.03
2,7
00.3
3 3
66.5
3 1
51.9
0 8
8.88
1
46.6
6 4
,882
.80
Ded
uctio
ns/d
ispo
sals
* (6
.06)
- (5
7.10
) (2
,025
.58)
(51.
57)
(145
.39)
(56.
71)
(5.5
6) (2
,347
.97)
Bala
nce
at M
arch
31,
201
8 4
,496
.90
264
.13
40,
519.
28
89,
036.
79
3,2
76.0
0 1
,482
.68
1,0
96.6
1 5
,739
.37
1,4
5,91
1.76
Ba
lanc
e at
Apr
il 1,
201
8 4
,496
.90
264
.13
40,
519.
28
89,
036.
79
3,2
76.0
0 1
,482
.68
1,0
96.6
1 5
,739
.37
1,4
5,91
1.76
A
dditi
ons
870
.68
- 3
,028
.72
14,
227.
81
352
.07
321
.96
112
.16
1,2
03.3
4 2
0,11
6.74
D
educ
tions
/dis
posa
ls *
- (0
.03)
(10.
95)
(8,5
38.2
8) (1
02.3
1) (2
35.9
0) (1
00.1
6) (3
09.2
7) (9
,296
.90)
Ass
ets
clas
sifie
d as
hel
d fo
r sal
e(1
,081
.41)
- -
(7,3
71.6
0) (9
6.21
) (1
9.63
) (6
3.05
) (5
50.5
7) (9
,182
.47)
Recl
assi
ficat
ion
of a
sset
s fr
om In
vest
men
t Pro
pert
y 1
55.7
2 -
22.
68
- -
- -
- 1
78.4
0 Ba
lanc
e at
Mar
ch 3
1, 2
019
4,4
41.8
9 2
64.1
0 4
3,55
9.73
8
7,35
4.72
3
,429
.55
1,5
49.1
1 1
,045
.56
6,0
82.8
7 1,
47,7
27.5
3 A
ccum
ulat
ed D
epre
ciat
ion
Bala
nce
at A
pril
1, 2
017
- 4
.65
3,3
51.8
3 2
1,38
4.56
7
39.9
6 3
19.9
0 4
38.0
1 1
,799
.98
28,
038.
89
Dep
reci
atio
n fo
r the
yea
r -
3.3
7 1
,352
.04
9,5
28.3
2 3
36.1
6 2
03.7
2 2
32.3
8 5
81.6
5 1
2,23
7.64
D
educ
tions
/dis
posa
ls *
* -
(9.6
1) (1
,662
.39)
(39.
14)
(71.
86)
(44.
86)
(5.2
8) (1
,833
.14)
Bala
nce
at M
arch
31,
201
8 -
8.0
2 4
,694
.26
29,
250.
49
1,0
36.9
8 4
51.7
6 6
25.5
3 2
,376
.35
38,
443.
39
Bala
nce
at A
pril
1, 2
018
- 8
.02
4,6
94.2
6 2
9,25
0.49
1
,036
.98
451
.76
625
.53
2,3
76.3
5 3
8,44
3.39
D
epre
ciat
ion
for t
he y
ear
- 3
.18
1,3
38.4
1 9
,696
.02
311
.13
205
.93
177
.55
501
.54
12,
233.
76
Ded
uctio
ns/d
ispo
sals
**
- (0
.01)
(13.
78)
(7,4
52.5
5) (9
2.60
) (1
37.8
5) (8
3.99
) (2
77.8
4) (8
,058
.62)
Ass
ets
clas
sifie
d as
hel
d fo
r sal
e -
- -
(6,1
10.1
9) (7
3.09
) (1
1.63
) (4
5.71
) (4
80.0
5) (6
,720
.67)
Recl
assi
ficat
ion
of a
sset
s fr
om In
vest
men
t Pro
pert
y -
- 7
.73
- -
- -
- 7
.73
Bala
nce
at M
arch
31,
201
9 -
11.
19
6,0
26.6
2 2
5,38
3.77
1
,182
.42
508
.21
673
.38
2,1
20.0
0 3
5,90
5.59
N
et C
arry
ing
Val
ueBa
lanc
e at
Mar
ch 3
1, 2
018
4,4
96.9
0 2
56.1
1 3
5,82
5.02
5
9,78
6.30
2
,239
.02
1,0
30.9
2 4
71.0
8 3
,363
.02
1,07
,468
.37
Bala
nce
at M
arch
31,
201
9 4
,441
.89
252
.91
37,
533.
11
61,
970.
95
2,2
47.1
3 1
,040
.90
372
.18
3,9
62.8
7 1,
11,8
21.9
4
Not
es:
1.
*Ded
uctio
n fro
m G
ross
Car
ryin
g Va
lue
repr
esen
ts sa
le/t
rans
fer/
disc
ardi
ng o
f Pro
pert
y, P
lant
& E
quip
men
t/Le
ase
hold
righ
ts w
ritte
n off
.2.
**
Ded
uctio
n in
dep
reci
atio
n D
8,05
8.62
Lak
hs (P
revi
ous Y
ear D
1833
.14
Lakh
s) re
pres
ents
adj
ustm
ent o
n ac
coun
t of s
ale/
tran
sfer
of P
rope
rty,
Pla
nt &
Equ
ipm
ent.
3.
*** I
nclu
des v
alue
of i
rrev
ocab
le L
icen
cing
Rig
hts t
o us
e of
a fl
at in
New
Del
hi D
10.0
0 La
khs.
4.
Dep
reci
atio
n fo
r the
yea
r 201
8-19
incl
udes
D28
3.81
(Pre
viou
s Yea
r D57
.94
Lakh
s) a
gain
st a
mor
tisat
ion
of G
over
nmen
t Cap
ital G
rant
s (re
fer N
ote
30)
5.
In e
xerc
ise
of p
ower
s con
ferr
ed u
nder
sect
ion
3D(1
) of t
he N
atio
nal H
ighw
ay A
ct, 1
956
(48
of 1
956)
, the
Min
istr
y of
Roa
d Tr
ansp
ort a
nd H
ighw
ays h
as d
ecla
red
the
com
puls
ory
acqu
isiti
on o
f lan
d at
Kha
rigra
m a
nd R
isha
bhde
v un
its o
f the
Com
pany
by
issu
ing
Not
ifica
tion
Nos
. S.O
. 736
(E) a
nd S
.O. 9
53(E
) dat
ed F
ebru
ary
5, 2
019
and
Febr
uary
21,
201
9 re
spec
tivel
y. U
nder
the
said
acq
uisi
tion
Com
pany
will
get
com
pens
atio
n fo
r aro
und
1.37
hec
tare
s of l
and
and
civi
l con
stru
ctio
n th
ereo
n, a
mou
nt o
f whi
ch h
as n
ot y
et b
een
asce
rtai
ned.
As o
n re
port
ing
date
, com
pens
atio
n re
mai
ns u
npai
d an
d po
sses
sion
of a
cqui
red
land
and
cons
truc
tion
rem
ain
with
the
Com
pany
.6.
O
n tr
ansi
tion
date
, the
Com
pany
has
opt
ed to
con
tinue
with
carr
ying
val
ue o
f all
of it
s Pro
pert
y, P
lant
and
Equ
ipm
ent a
s dee
med
cos
t and
net
carr
ying
val
ue u
nder
pre
viou
s G
AAP
as o
n M
arch
31,
201
5 is
reco
gnis
ed a
s gro
ss ca
rryi
ng a
mou
nt in
Ind
AS a
s on
01-0
4-20
15.
7.
Asse
ts p
ledg
ed a
s sec
urity
(ref
er N
ote
14)
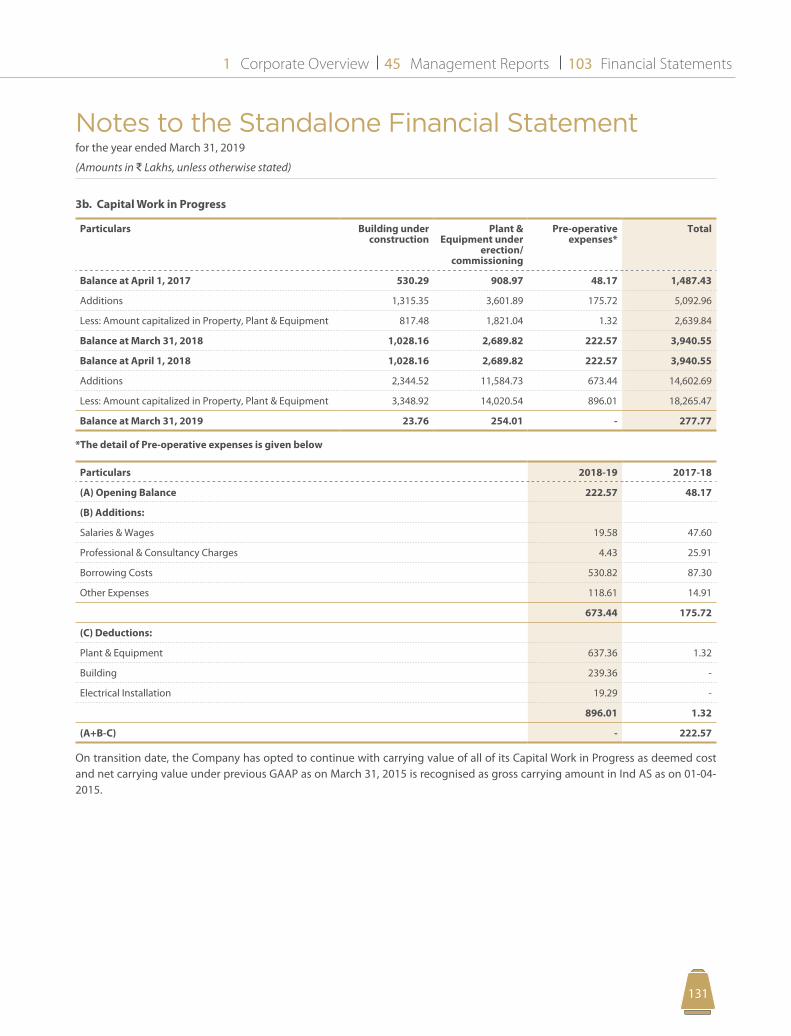
Notes to the Standalone Financial Statement for the year ended March 31, 2019
(Amounts in D Lakhs, unless otherwise stated)
Corporate Overview Management Reports Financial Statements1 45 103
131130
3b. Capital Work in Progress
Particulars Building under construction
Plant & Equipment under
erection/ commissioning
Pre-operative expenses*
Total
Balance at April 1, 2017 530.29 908.97 48.17 1,487.43
Additions 1,315.35 3,601.89 175.72 5,092.96
Less: Amount capitalized in Property, Plant & Equipment 817.48 1,821.04 1.32 2,639.84
Balance at March 31, 2018 1,028.16 2,689.82 222.57 3,940.55
Balance at April 1, 2018 1,028.16 2,689.82 222.57 3,940.55
Additions 2,344.52 11,584.73 673.44 14,602.69
Less: Amount capitalized in Property, Plant & Equipment 3,348.92 14,020.54 896.01 18,265.47
Balance at March 31, 2019 23.76 254.01 - 277.77
*The detail of Pre-operative expenses is given below
Particulars 2018-19 2017-18
(A) Opening Balance 222.57 48.17
(B) Additions:
Salaries & Wages 19.58 47.60
Professional & Consultancy Charges 4.43 25.91
Borrowing Costs 530.82 87.30
Other Expenses 118.61 14.91
673.44 175.72
(C) Deductions:
Plant & Equipment 637.36 1.32
Building 239.36 -
Electrical Installation 19.29 -
896.01 1.32
(A+B-C) - 222.57
On transition date, the Company has opted to continue with carrying value of all of its Capital Work in Progress as deemed cost and net carrying value under previous GAAP as on March 31, 2015 is recognised as gross carrying amount in Ind AS as on 01-04-2015.
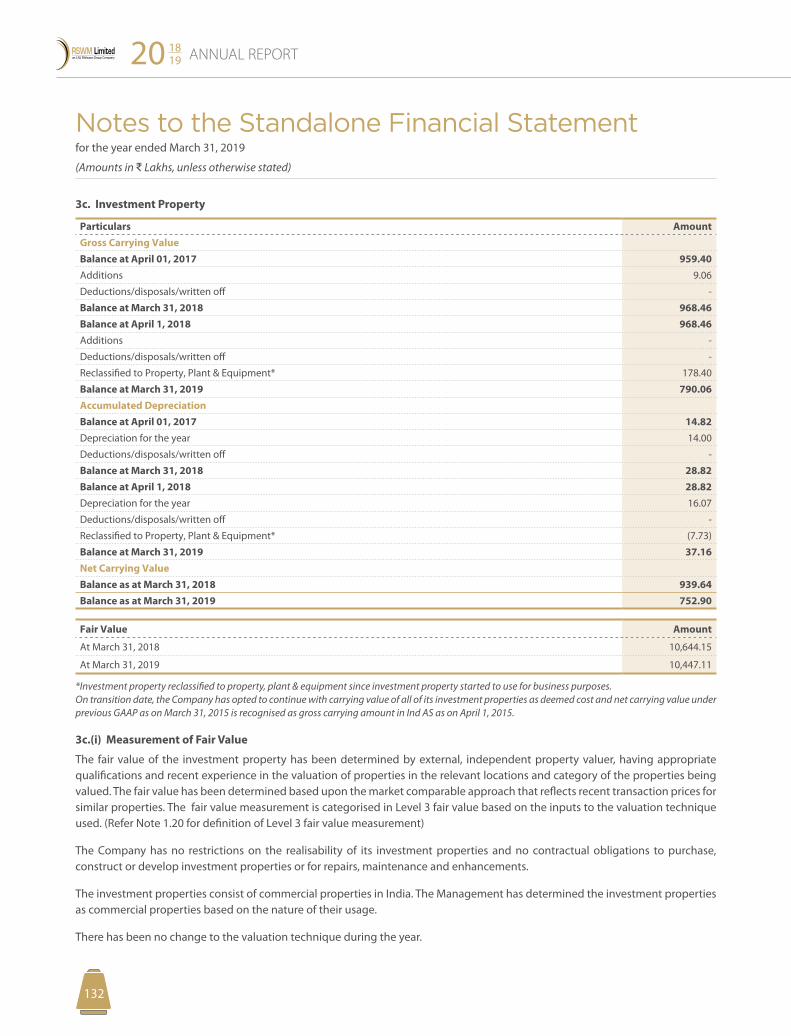
Notes to the Standalone Financial Statement for the year ended March 31, 2019
(Amounts in D Lakhs, unless otherwise stated)
ANNUAL REPORT20 1819
133132
3c. Investment Property
Particulars AmountGross Carrying ValueBalance at April 01, 2017 959.40 Additions 9.06
Deductions/disposals/written off -
Balance at March 31, 2018 968.46 Balance at April 1, 2018 968.46 Additions -
Deductions/disposals/written off -
Reclassified to Property, Plant & Equipment* 178.40
Balance at March 31, 2019 790.06 Accumulated DepreciationBalance at April 01, 2017 14.82 Depreciation for the year 14.00
Deductions/disposals/written off -
Balance at March 31, 2018 28.82 Balance at April 1, 2018 28.82 Depreciation for the year 16.07
Deductions/disposals/written off -
Reclassified to Property, Plant & Equipment* (7.73)
Balance at March 31, 2019 37.16 Net Carrying ValueBalance as at March 31, 2018 939.64 Balance as at March 31, 2019 752.90
Fair Value Amount
At March 31, 2018 10,644.15
At March 31, 2019 10,447.11
*Investment property reclassified to property, plant & equipment since investment property started to use for business purposes.On transition date, the Company has opted to continue with carrying value of all of its investment properties as deemed cost and net carrying value under previous GAAP as on March 31, 2015 is recognised as gross carrying amount in Ind AS as on April 1, 2015.
3c.(i) Measurement of Fair Value
The fair value of the investment property has been determined by external, independent property valuer, having appropriate qualifications and recent experience in the valuation of properties in the relevant locations and category of the properties being valued. The fair value has been determined based upon the market comparable approach that reflects recent transaction prices for similar properties. The fair value measurement is categorised in Level 3 fair value based on the inputs to the valuation technique used. (Refer Note 1.20 for definition of Level 3 fair value measurement)
The Company has no restrictions on the realisability of its investment properties and no contractual obligations to purchase, construct or develop investment properties or for repairs, maintenance and enhancements.
The investment properties consist of commercial properties in India. The Management has determined the investment properties as commercial properties based on the nature of their usage.
There has been no change to the valuation technique during the year.
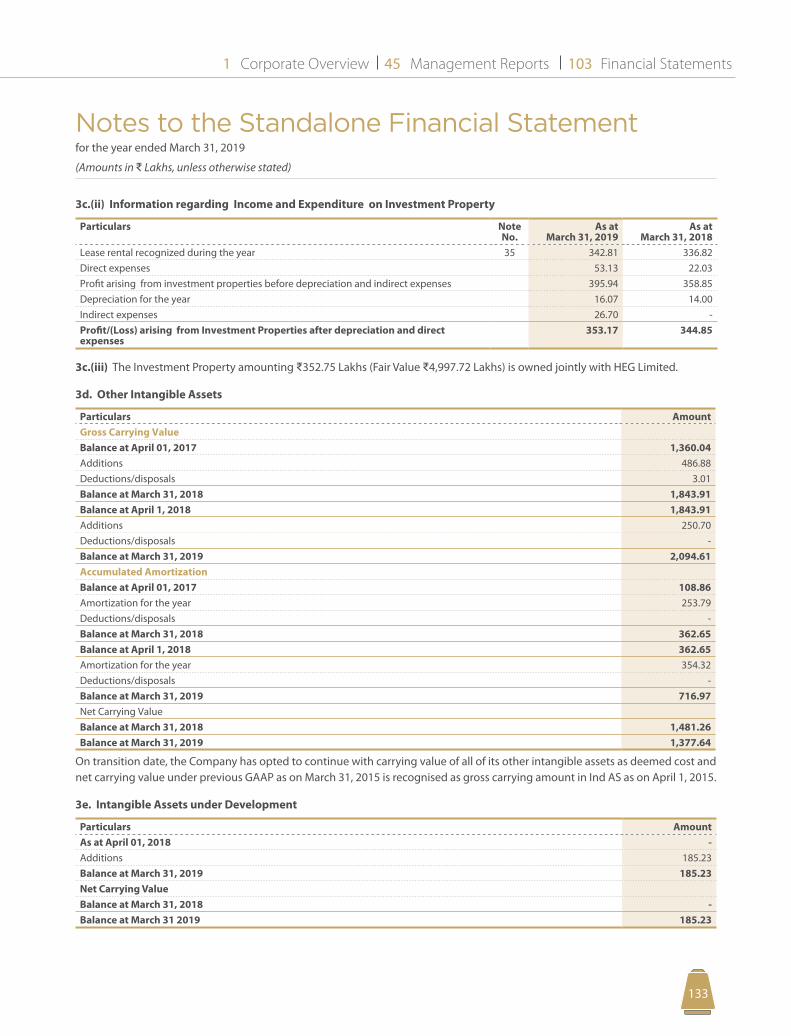
Notes to the Standalone Financial Statement for the year ended March 31, 2019
(Amounts in D Lakhs, unless otherwise stated)
Corporate Overview Management Reports Financial Statements1 45 103
133132
3c.(ii) Information regarding Income and Expenditure on Investment Property
Particulars Note No.
As at March 31, 2019
As at March 31, 2018
Lease rental recognized during the year 35 342.81 336.82Direct expenses 53.13 22.03 Profit arising from investment properties before depreciation and indirect expenses 395.94 358.85Depreciation for the year 16.07 14.00 Indirect expenses 26.70 - Profit/(Loss) arising from Investment Properties after depreciation and direct expenses
353.17 344.85
3c.(iii) The Investment Property amounting D352.75 Lakhs (Fair Value D4,997.72 Lakhs) is owned jointly with HEG Limited.
3d. Other Intangible Assets
Particulars AmountGross Carrying ValueBalance at April 01, 2017 1,360.04 Additions 486.88 Deductions/disposals 3.01 Balance at March 31, 2018 1,843.91 Balance at April 1, 2018 1,843.91 Additions 250.70 Deductions/disposals - Balance at March 31, 2019 2,094.61 Accumulated AmortizationBalance at April 01, 2017 108.86 Amortization for the year 253.79 Deductions/disposals - Balance at March 31, 2018 362.65 Balance at April 1, 2018 362.65 Amortization for the year 354.32 Deductions/disposals - Balance at March 31, 2019 716.97 Net Carrying ValueBalance at March 31, 2018 1,481.26 Balance at March 31, 2019 1,377.64
On transition date, the Company has opted to continue with carrying value of all of its other intangible assets as deemed cost and net carrying value under previous GAAP as on March 31, 2015 is recognised as gross carrying amount in Ind AS as on April 1, 2015.
3e. Intangible Assets under Development
Particulars AmountAs at April 01, 2018 - Additions 185.23Balance at March 31, 2019 185.23Net Carrying ValueBalance at March 31, 2018 - Balance at March 31 2019 185.23
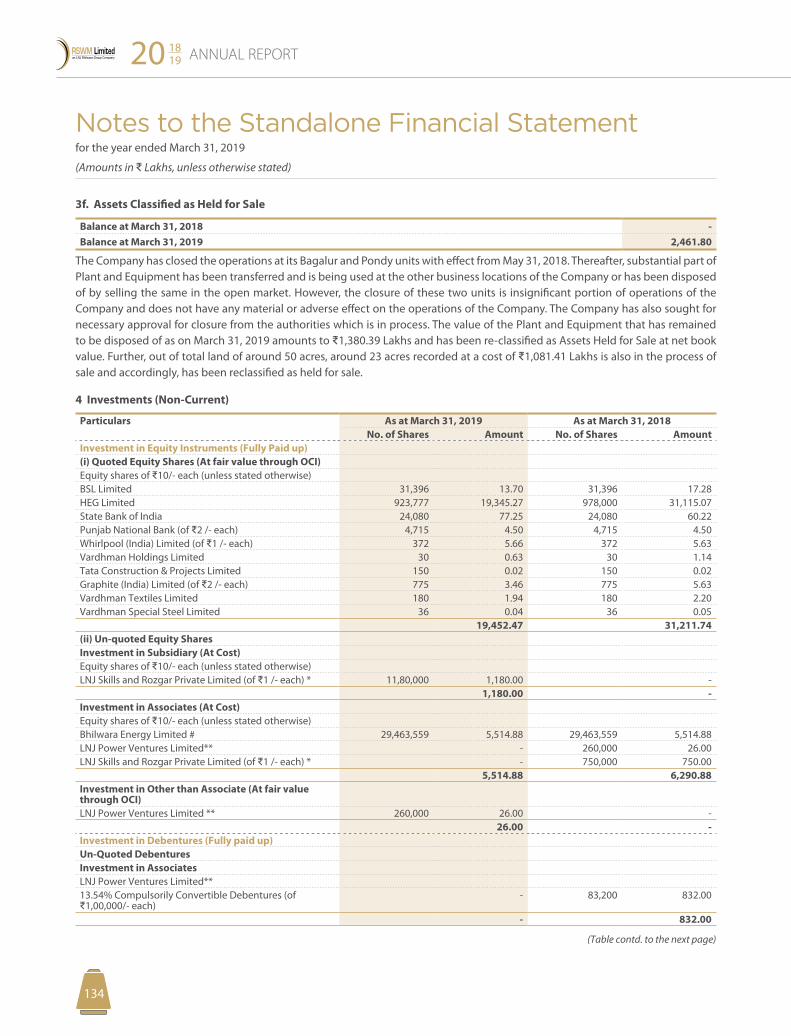
Notes to the Standalone Financial Statement for the year ended March 31, 2019
(Amounts in D Lakhs, unless otherwise stated)
ANNUAL REPORT20 1819
135134
3f. Assets Classified as Held for Sale
Balance at March 31, 2018 - Balance at March 31, 2019 2,461.80
The Company has closed the operations at its Bagalur and Pondy units with effect from May 31, 2018. Thereafter, substantial part of Plant and Equipment has been transferred and is being used at the other business locations of the Company or has been disposed of by selling the same in the open market. However, the closure of these two units is insignificant portion of operations of the Company and does not have any material or adverse effect on the operations of the Company. The Company has also sought for necessary approval for closure from the authorities which is in process. The value of the Plant and Equipment that has remained to be disposed of as on March 31, 2019 amounts to D1,380.39 Lakhs and has been re-classified as Assets Held for Sale at net book value. Further, out of total land of around 50 acres, around 23 acres recorded at a cost of D1,081.41 Lakhs is also in the process of sale and accordingly, has been reclassified as held for sale.
4 Investments (Non-Current)
Particulars As at March 31, 2019 As at March 31, 2018No. of Shares Amount No. of Shares Amount
Investment in Equity Instruments (Fully Paid up)(i) Quoted Equity Shares (At fair value through OCI)Equity shares of D10/- each (unless stated otherwise)BSL Limited 31,396 13.70 31,396 17.28 HEG Limited 923,777 19,345.27 978,000 31,115.07 State Bank of India 24,080 77.25 24,080 60.22 Punjab National Bank (of D2 /- each) 4,715 4.50 4,715 4.50 Whirlpool (India) Limited (of D1 /- each) 372 5.66 372 5.63 Vardhman Holdings Limited 30 0.63 30 1.14 Tata Construction & Projects Limited 150 0.02 150 0.02 Graphite (India) Limited (of D2 /- each) 775 3.46 775 5.63 Vardhman Textiles Limited 180 1.94 180 2.20 Vardhman Special Steel Limited 36 0.04 36 0.05
19,452.47 31,211.74(ii) Un-quoted Equity SharesInvestment in Subsidiary (At Cost)Equity shares of D10/- each (unless stated otherwise)LNJ Skills and Rozgar Private Limited (of D1 /- each) * 11,80,000 1,180.00 -
1,180.00 - Investment in Associates (At Cost)Equity shares of D10/- each (unless stated otherwise)Bhilwara Energy Limited # 29,463,559 5,514.88 29,463,559 5,514.88 LNJ Power Ventures Limited** - 260,000 26.00 LNJ Skills and Rozgar Private Limited (of D1 /- each) * - 750,000 750.00
5,514.88 6,290.88 Investment in Other than Associate (At fair value through OCI)LNJ Power Ventures Limited ** 260,000 26.00 -
26.00 - Investment in Debentures (Fully paid up)Un-Quoted DebenturesInvestment in AssociatesLNJ Power Ventures Limited**13.54% Compulsorily Convertible Debentures (of D1,00,000/- each)
- 83,200 832.00
- 832.00
(Table contd. to the next page)
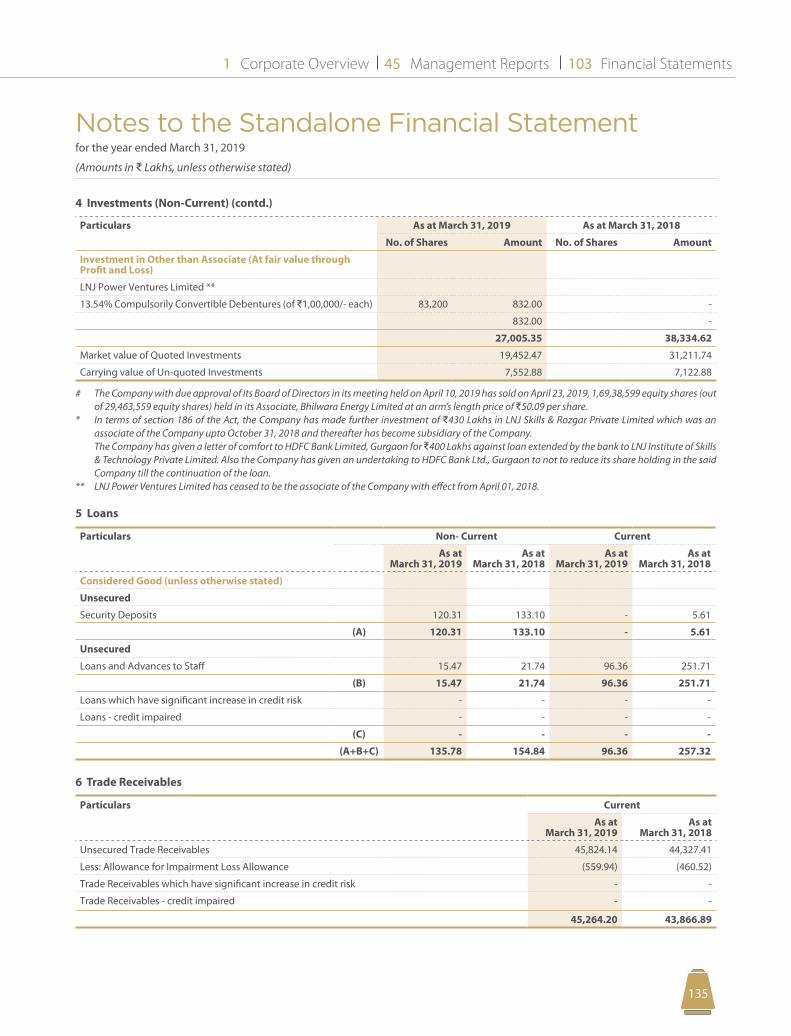
Notes to the Standalone Financial Statement for the year ended March 31, 2019
(Amounts in D Lakhs, unless otherwise stated)
Corporate Overview Management Reports Financial Statements1 45 103
135134
4 Investments (Non-Current) (contd.)
Particulars As at March 31, 2019 As at March 31, 2018
No. of Shares Amount No. of Shares Amount
Investment in Other than Associate (At fair value through Profit and Loss)
LNJ Power Ventures Limited **
13.54% Compulsorily Convertible Debentures (of D1,00,000/- each) 83,200 832.00 -
832.00 -
27,005.35 38,334.62
Market value of Quoted Investments 19,452.47 31,211.74
Carrying value of Un-quoted Investments 7,552.88 7,122.88
# The Company with due approval of its Board of Directors in its meeting held on April 10, 2019 has sold on April 23, 2019, 1,69,38,599 equity shares (out of 29,463,559 equity shares) held in its Associate, Bhilwara Energy Limited at an arm’s length price of D50.09 per share.
* In terms of section 186 of the Act, the Company has made further investment of D430 Lakhs in LNJ Skills & Rozgar Private Limited which was an associate of the Company upto October 31, 2018 and thereafter has become subsidiary of the Company.
The Company has given a letter of comfort to HDFC Bank Limited, Gurgaon for D400 Lakhs against loan extended by the bank to LNJ Institute of Skills & Technology Private Limited. Also the Company has given an undertaking to HDFC Bank Ltd., Gurgaon to not to reduce its share holding in the said Company till the continuation of the loan.
** LNJ Power Ventures Limited has ceased to be the associate of the Company with effect from April 01, 2018.
5 Loans
Particulars Non- Current Current
As at March 31, 2019
As at March 31, 2018
As at March 31, 2019
As at March 31, 2018
Considered Good (unless otherwise stated)
Unsecured
Security Deposits 120.31 133.10 - 5.61
(A) 120.31 133.10 - 5.61
Unsecured
Loans and Advances to Staff 15.47 21.74 96.36 251.71
(B) 15.47 21.74 96.36 251.71
Loans which have significant increase in credit risk - - - -
Loans - credit impaired - - - -
(C) - - - -
(A+B+C) 135.78 154.84 96.36 257.32
6 Trade Receivables
Particulars Current
As at March 31, 2019
As at March 31, 2018
Unsecured Trade Receivables 45,824.14 44,327.41
Less: Allowance for Impairment Loss Allowance (559.94) (460.52)
Trade Receivables which have significant increase in credit risk - -
Trade Receivables - credit impaired - -
45,264.20 43,866.89
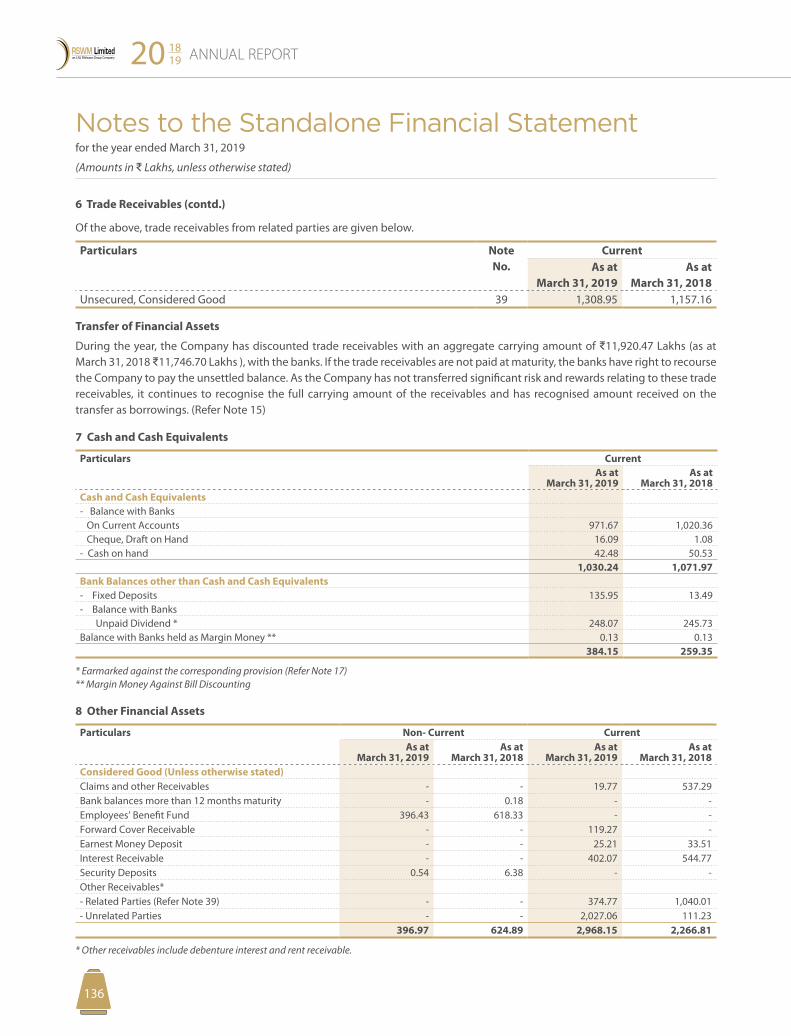
Notes to the Standalone Financial Statement for the year ended March 31, 2019
(Amounts in D Lakhs, unless otherwise stated)
ANNUAL REPORT20 1819
137136
6 Trade Receivables (contd.)
Of the above, trade receivables from related parties are given below.
Particulars Note No.
Current As at
March 31, 2019As at
March 31, 2018Unsecured, Considered Good 39 1,308.95 1,157.16
Transfer of Financial Assets
During the year, the Company has discounted trade receivables with an aggregate carrying amount of D11,920.47 Lakhs (as at March 31, 2018 D11,746.70 Lakhs ), with the banks. If the trade receivables are not paid at maturity, the banks have right to recourse the Company to pay the unsettled balance. As the Company has not transferred significant risk and rewards relating to these trade receivables, it continues to recognise the full carrying amount of the receivables and has recognised amount received on the transfer as borrowings. (Refer Note 15)
7 Cash and Cash Equivalents
Particulars CurrentAs at
March 31, 2019As at
March 31, 2018Cash and Cash Equivalents- Balance with Banks On Current Accounts 971.67 1,020.36 Cheque, Draft on Hand 16.09 1.08 - Cash on hand 42.48 50.53
1,030.24 1,071.97 Bank Balances other than Cash and Cash Equivalents- Fixed Deposits 135.95 13.49 - Balance with Banks Unpaid Dividend * 248.07 245.73 Balance with Banks held as Margin Money ** 0.13 0.13
384.15 259.35
* Earmarked against the corresponding provision (Refer Note 17)** Margin Money Against Bill Discounting
8 Other Financial Assets
Particulars Non- Current CurrentAs at
March 31, 2019As at
March 31, 2018As at
March 31, 2019As at
March 31, 2018Considered Good (Unless otherwise stated)Claims and other Receivables - - 19.77 537.29 Bank balances more than 12 months maturity - 0.18 - - Employees’ Benefit Fund 396.43 618.33 - - Forward Cover Receivable - - 119.27 - Earnest Money Deposit - - 25.21 33.51 Interest Receivable - - 402.07 544.77 Security Deposits 0.54 6.38 - - Other Receivables* - Related Parties (Refer Note 39) - - 374.77 1,040.01 - Unrelated Parties - - 2,027.06 111.23
396.97 624.89 2,968.15 2,266.81
* Other receivables include debenture interest and rent receivable.
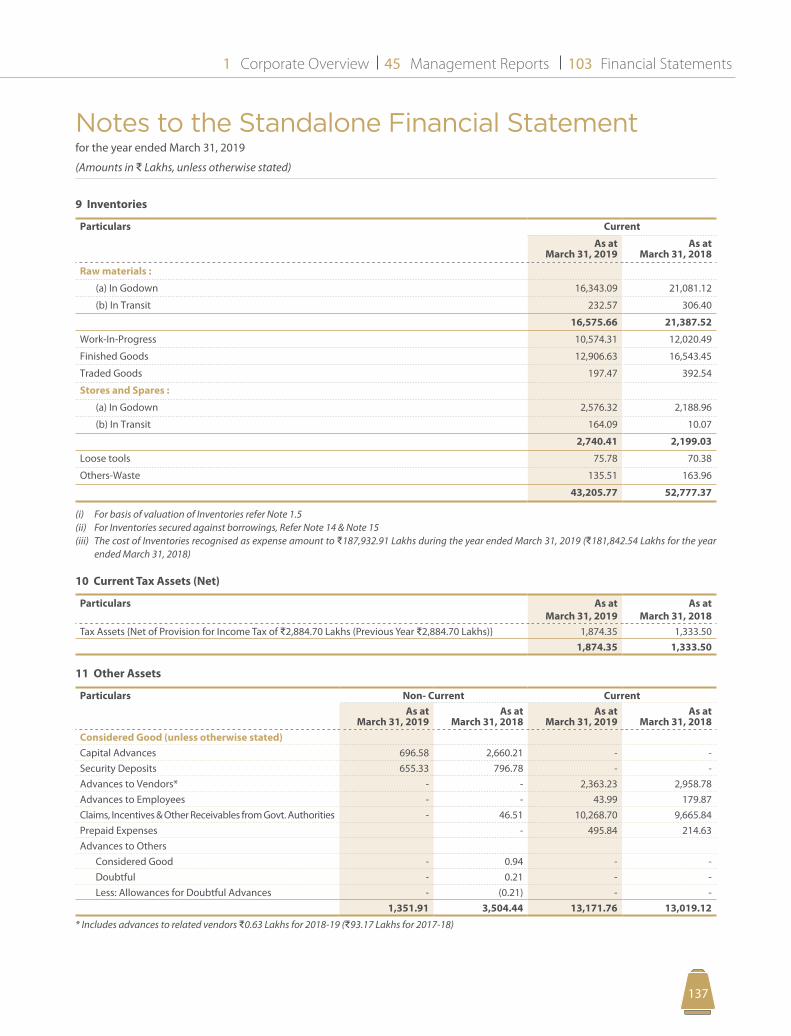
Notes to the Standalone Financial Statement for the year ended March 31, 2019
(Amounts in D Lakhs, unless otherwise stated)
Corporate Overview Management Reports Financial Statements1 45 103
137136
9 Inventories
Particulars Current
As at March 31, 2019
As at March 31, 2018
Raw materials :
(a) In Godown 16,343.09 21,081.12
(b) In Transit 232.57 306.40
16,575.66 21,387.52
Work-In-Progress 10,574.31 12,020.49
Finished Goods 12,906.63 16,543.45
Traded Goods 197.47 392.54
Stores and Spares :
(a) In Godown 2,576.32 2,188.96
(b) In Transit 164.09 10.07
2,740.41 2,199.03
Loose tools 75.78 70.38
Others-Waste 135.51 163.96
43,205.77 52,777.37
(i) For basis of valuation of Inventories refer Note 1.5(ii) For Inventories secured against borrowings, Refer Note 14 & Note 15(iii) The cost of Inventories recognised as expense amount to D187,932.91 Lakhs during the year ended March 31, 2019 (D181,842.54 Lakhs for the year
ended March 31, 2018)
10 Current Tax Assets (Net)
Particulars As at March 31, 2019
As at March 31, 2018
Tax Assets {Net of Provision for Income Tax of D2,884.70 Lakhs (Previous Year D2,884.70 Lakhs)} 1,874.35 1,333.50 1,874.35 1,333.50
11 Other Assets
Particulars Non- Current CurrentAs at
March 31, 2019As at
March 31, 2018As at
March 31, 2019As at
March 31, 2018Considered Good (unless otherwise stated)Capital Advances 696.58 2,660.21 - - Security Deposits 655.33 796.78 - - Advances to Vendors* - - 2,363.23 2,958.78 Advances to Employees - - 43.99 179.87 Claims, Incentives & Other Receivables from Govt. Authorities - 46.51 10,268.70 9,665.84 Prepaid Expenses - 495.84 214.63 Advances to Others Considered Good - 0.94 - - Doubtful - 0.21 - - Less: Allowances for Doubtful Advances - (0.21) - -
1,351.91 3,504.44 13,171.76 13,019.12
* Includes advances to related vendors D0.63 Lakhs for 2018-19 (D93.17 Lakhs for 2017-18)
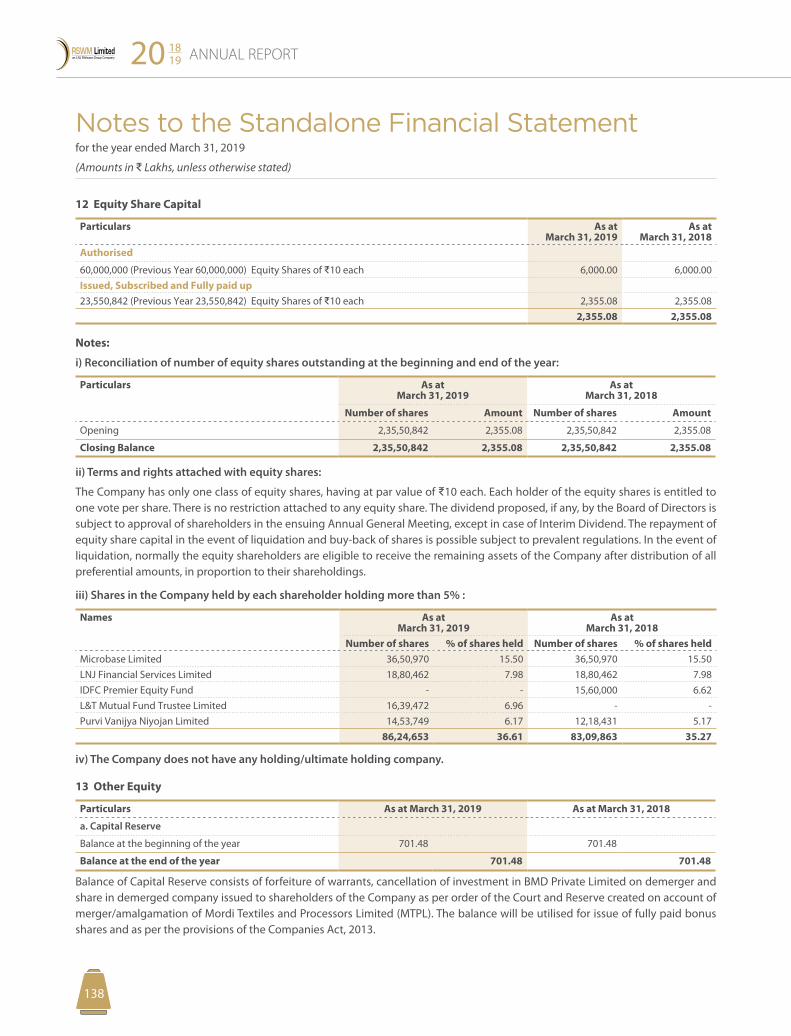
Notes to the Standalone Financial Statement for the year ended March 31, 2019
(Amounts in D Lakhs, unless otherwise stated)
ANNUAL REPORT20 1819
139138
12 Equity Share Capital
Particulars As at March 31, 2019
As at March 31, 2018
Authorised
60,000,000 (Previous Year 60,000,000) Equity Shares of D10 each 6,000.00 6,000.00 Issued, Subscribed and Fully paid up23,550,842 (Previous Year 23,550,842) Equity Shares of D10 each 2,355.08 2,355.08
2,355.08 2,355.08
Notes:
i) Reconciliation of number of equity shares outstanding at the beginning and end of the year:
Particulars As at March 31, 2019
As at March 31, 2018
Number of shares Amount Number of shares Amount
Opening 2,35,50,842 2,355.08 2,35,50,842 2,355.08
Closing Balance 2,35,50,842 2,355.08 2,35,50,842 2,355.08
ii) Terms and rights attached with equity shares:
The Company has only one class of equity shares, having at par value of D10 each. Each holder of the equity shares is entitled to one vote per share. There is no restriction attached to any equity share. The dividend proposed, if any, by the Board of Directors is subject to approval of shareholders in the ensuing Annual General Meeting, except in case of Interim Dividend. The repayment of equity share capital in the event of liquidation and buy-back of shares is possible subject to prevalent regulations. In the event of liquidation, normally the equity shareholders are eligible to receive the remaining assets of the Company after distribution of all preferential amounts, in proportion to their shareholdings.
iii) Shares in the Company held by each shareholder holding more than 5% :
Names As at March 31, 2019
As at March 31, 2018
Number of shares % of shares held Number of shares % of shares heldMicrobase Limited 36,50,970 15.50 36,50,970 15.50 LNJ Financial Services Limited 18,80,462 7.98 18,80,462 7.98 IDFC Premier Equity Fund - - 15,60,000 6.62 L&T Mutual Fund Trustee Limited 16,39,472 6.96 - - Purvi Vanijya Niyojan Limited 14,53,749 6.17 12,18,431 5.17
86,24,653 36.61 83,09,863 35.27
iv) The Company does not have any holding/ultimate holding company.
13 Other Equity
Particulars As at March 31, 2019 As at March 31, 2018
a. Capital Reserve
Balance at the beginning of the year 701.48 701.48
Balance at the end of the year 701.48 701.48
Balance of Capital Reserve consists of forfeiture of warrants, cancellation of investment in BMD Private Limited on demerger and share in demerged company issued to shareholders of the Company as per order of the Court and Reserve created on account of merger/amalgamation of Mordi Textiles and Processors Limited (MTPL). The balance will be utilised for issue of fully paid bonus shares and as per the provisions of the Companies Act, 2013.
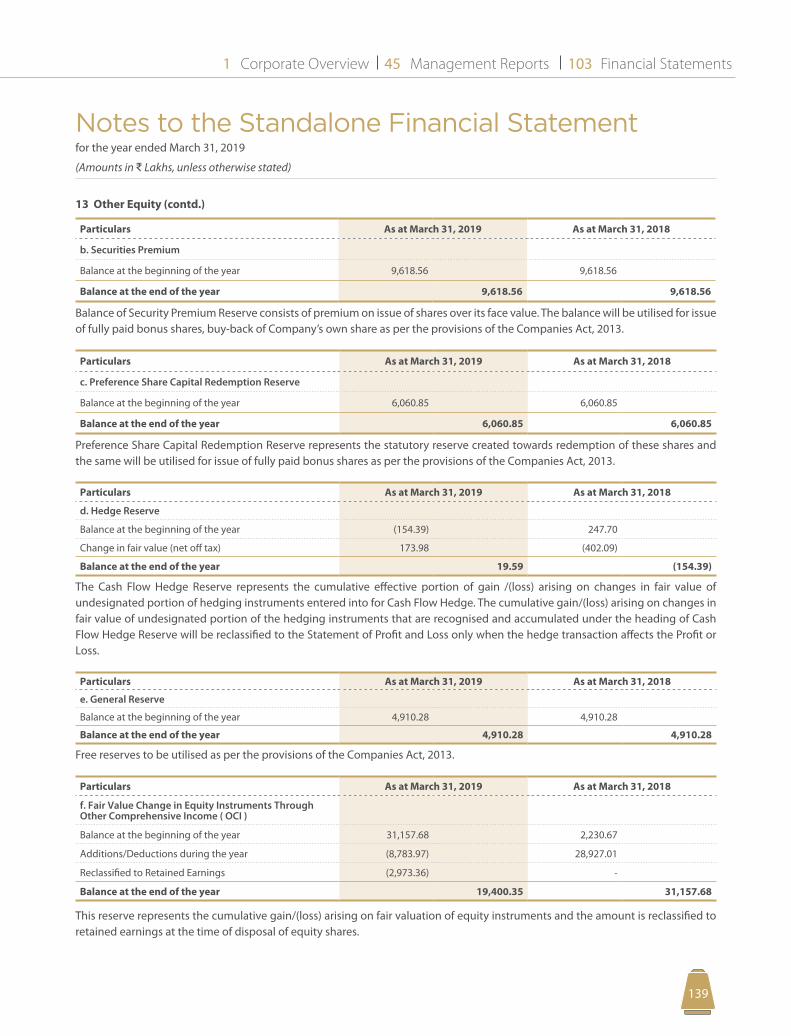
Notes to the Standalone Financial Statement for the year ended March 31, 2019
(Amounts in D Lakhs, unless otherwise stated)
Corporate Overview Management Reports Financial Statements1 45 103
139138
13 Other Equity (contd.)
Particulars As at March 31, 2019 As at March 31, 2018
b. Securities Premium
Balance at the beginning of the year 9,618.56 9,618.56
Balance at the end of the year 9,618.56 9,618.56
Balance of Security Premium Reserve consists of premium on issue of shares over its face value. The balance will be utilised for issue of fully paid bonus shares, buy-back of Company’s own share as per the provisions of the Companies Act, 2013.
Particulars As at March 31, 2019 As at March 31, 2018
c. Preference Share Capital Redemption Reserve
Balance at the beginning of the year 6,060.85 6,060.85
Balance at the end of the year 6,060.85 6,060.85
Preference Share Capital Redemption Reserve represents the statutory reserve created towards redemption of these shares and the same will be utilised for issue of fully paid bonus shares as per the provisions of the Companies Act, 2013.
Particulars As at March 31, 2019 As at March 31, 2018
d. Hedge Reserve
Balance at the beginning of the year (154.39) 247.70
Change in fair value (net off tax) 173.98 (402.09)
Balance at the end of the year 19.59 (154.39)
The Cash Flow Hedge Reserve represents the cumulative effective portion of gain /(loss) arising on changes in fair value of undesignated portion of hedging instruments entered into for Cash Flow Hedge. The cumulative gain/(loss) arising on changes in fair value of undesignated portion of the hedging instruments that are recognised and accumulated under the heading of Cash Flow Hedge Reserve will be reclassified to the Statement of Profit and Loss only when the hedge transaction affects the Profit or Loss.
Particulars As at March 31, 2019 As at March 31, 2018
e. General Reserve
Balance at the beginning of the year 4,910.28 4,910.28
Balance at the end of the year 4,910.28 4,910.28
Free reserves to be utilised as per the provisions of the Companies Act, 2013.
Particulars As at March 31, 2019 As at March 31, 2018
f. Fair Value Change in Equity Instruments Through Other Comprehensive Income ( OCI )
Balance at the beginning of the year 31,157.68 2,230.67
Additions/Deductions during the year (8,783.97) 28,927.01
Reclassified to Retained Earnings (2,973.36) -
Balance at the end of the year 19,400.35 31,157.68
This reserve represents the cumulative gain/(loss) arising on fair valuation of equity instruments and the amount is reclassified to retained earnings at the time of disposal of equity shares.
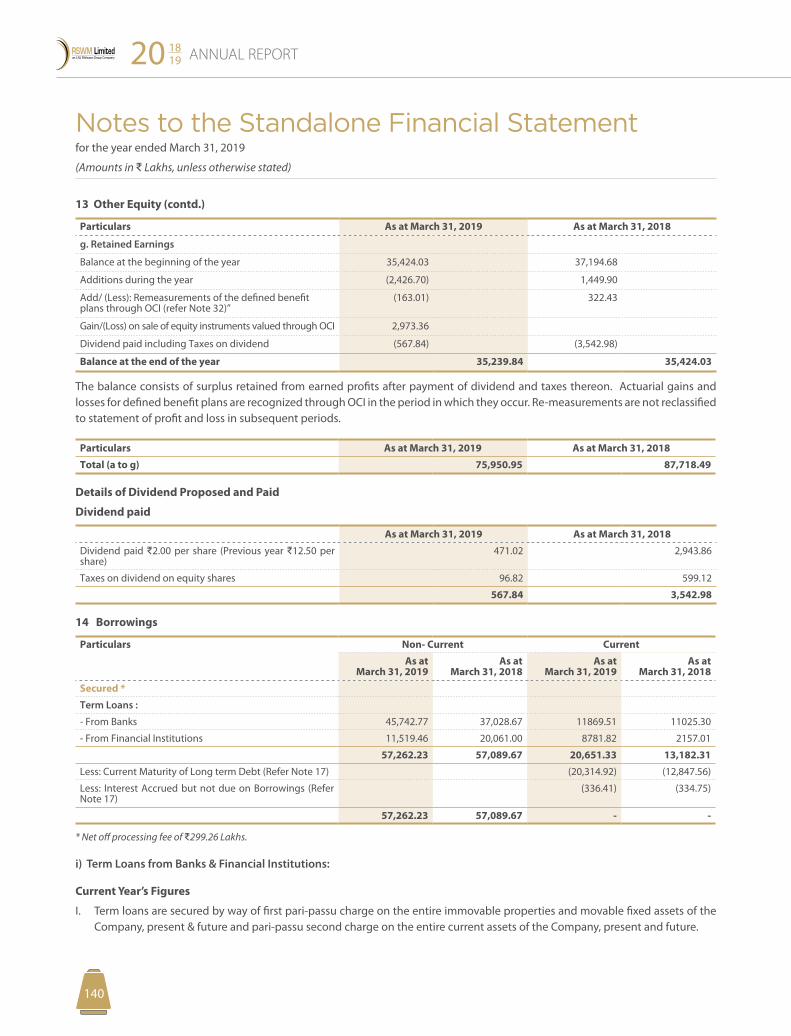
Notes to the Standalone Financial Statement for the year ended March 31, 2019
(Amounts in D Lakhs, unless otherwise stated)
ANNUAL REPORT20 1819
141140
13 Other Equity (contd.)
Particulars As at March 31, 2019 As at March 31, 2018
g. Retained Earnings
Balance at the beginning of the year 35,424.03 37,194.68
Additions during the year (2,426.70) 1,449.90
Add/ (Less): Remeasurements of the defined benefit plans through OCI (refer Note 32)”
(163.01) 322.43
Gain/(Loss) on sale of equity instruments valued through OCI 2,973.36
Dividend paid including Taxes on dividend (567.84) (3,542.98)
Balance at the end of the year 35,239.84 35,424.03
The balance consists of surplus retained from earned profits after payment of dividend and taxes thereon. Actuarial gains and losses for defined benefit plans are recognized through OCI in the period in which they occur. Re-measurements are not reclassified to statement of profit and loss in subsequent periods.
Particulars As at March 31, 2019 As at March 31, 2018
Total (a to g) 75,950.95 87,718.49
Details of Dividend Proposed and Paid
Dividend paid
As at March 31, 2019 As at March 31, 2018
Dividend paid D2.00 per share (Previous year D12.50 per share)
471.02 2,943.86
Taxes on dividend on equity shares 96.82 599.12
567.84 3,542.98
14 Borrowings
Particulars Non- Current Current
As at March 31, 2019
As at March 31, 2018
As at March 31, 2019
As at March 31, 2018
Secured *
Term Loans :
- From Banks 45,742.77 37,028.67 11869.51 11025.30
- From Financial Institutions 11,519.46 20,061.00 8781.82 2157.01
57,262.23 57,089.67 20,651.33 13,182.31
Less: Current Maturity of Long term Debt (Refer Note 17) (20,314.92) (12,847.56)
Less: Interest Accrued but not due on Borrowings (Refer Note 17)
(336.41) (334.75)
57,262.23 57,089.67 - -
* Net off processing fee of D299.26 Lakhs.
i) Term Loans from Banks & Financial Institutions:
Current Year’s Figures
I. Term loans are secured by way of first pari-passu charge on the entire immovable properties and movable fixed assets of the Company, present & future and pari-passu second charge on the entire current assets of the Company, present and future.
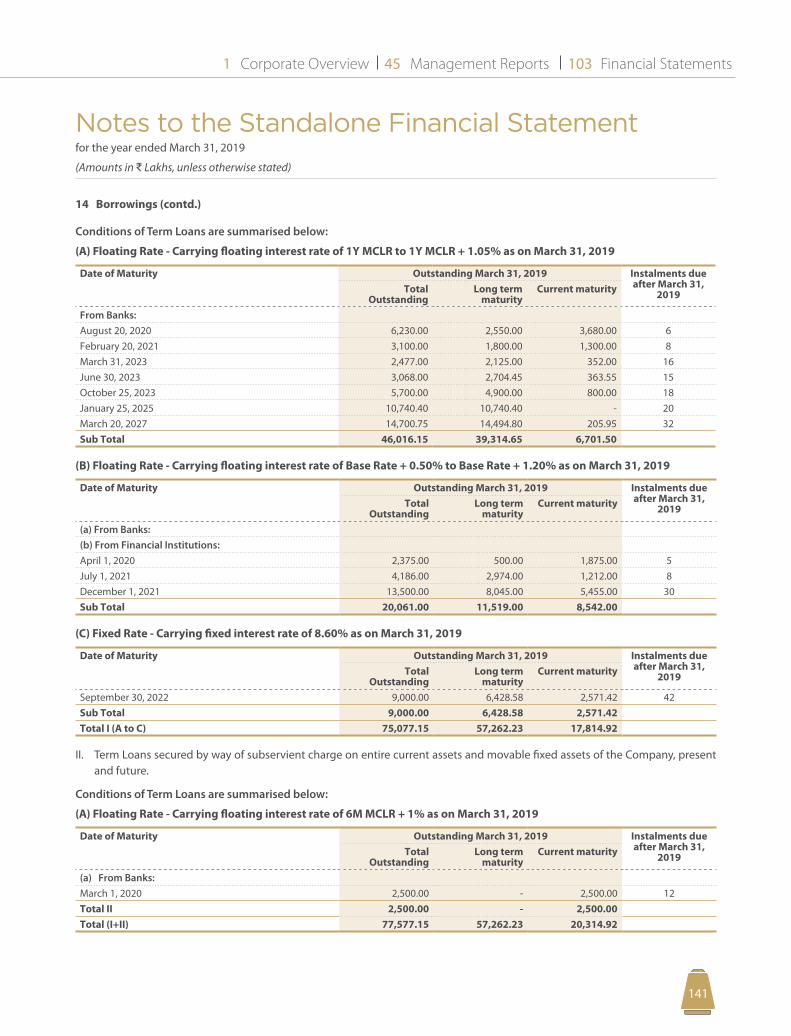
Notes to the Standalone Financial Statement for the year ended March 31, 2019
(Amounts in D Lakhs, unless otherwise stated)
Corporate Overview Management Reports Financial Statements1 45 103
141140
14 Borrowings (contd.)
Conditions of Term Loans are summarised below:
(A) Floating Rate - Carrying floating interest rate of 1Y MCLR to 1Y MCLR + 1.05% as on March 31, 2019
Date of Maturity Outstanding March 31, 2019 Instalments due after March 31,
2019Total Outstanding
Long term maturity
Current maturity
From Banks:August 20, 2020 6,230.00 2,550.00 3,680.00 6February 20, 2021 3,100.00 1,800.00 1,300.00 8March 31, 2023 2,477.00 2,125.00 352.00 16June 30, 2023 3,068.00 2,704.45 363.55 15October 25, 2023 5,700.00 4,900.00 800.00 18January 25, 2025 10,740.40 10,740.40 - 20March 20, 2027 14,700.75 14,494.80 205.95 32Sub Total 46,016.15 39,314.65 6,701.50
(B) Floating Rate - Carrying floating interest rate of Base Rate + 0.50% to Base Rate + 1.20% as on March 31, 2019
Date of Maturity Outstanding March 31, 2019 Instalments due after March 31,
2019Total Outstanding
Long term maturity
Current maturity
(a) From Banks:(b) From Financial Institutions:April 1, 2020 2,375.00 500.00 1,875.00 5July 1, 2021 4,186.00 2,974.00 1,212.00 8December 1, 2021 13,500.00 8,045.00 5,455.00 30Sub Total 20,061.00 11,519.00 8,542.00
(C) Fixed Rate - Carrying fixed interest rate of 8.60% as on March 31, 2019
Date of Maturity Outstanding March 31, 2019 Instalments due after March 31,
2019Total Outstanding
Long term maturity
Current maturity
September 30, 2022 9,000.00 6,428.58 2,571.42 42Sub Total 9,000.00 6,428.58 2,571.42 Total I (A to C) 75,077.15 57,262.23 17,814.92
II. Term Loans secured by way of subservient charge on entire current assets and movable fixed assets of the Company, present and future.
Conditions of Term Loans are summarised below:
(A) Floating Rate - Carrying floating interest rate of 6M MCLR + 1% as on March 31, 2019
Date of Maturity Outstanding March 31, 2019 Instalments due after March 31,
2019Total Outstanding
Long term maturity
Current maturity
(a) From Banks:March 1, 2020 2,500.00 - 2,500.00 12Total II 2,500.00 - 2,500.00 Total (I+II) 77,577.15 57,262.23 20,314.92
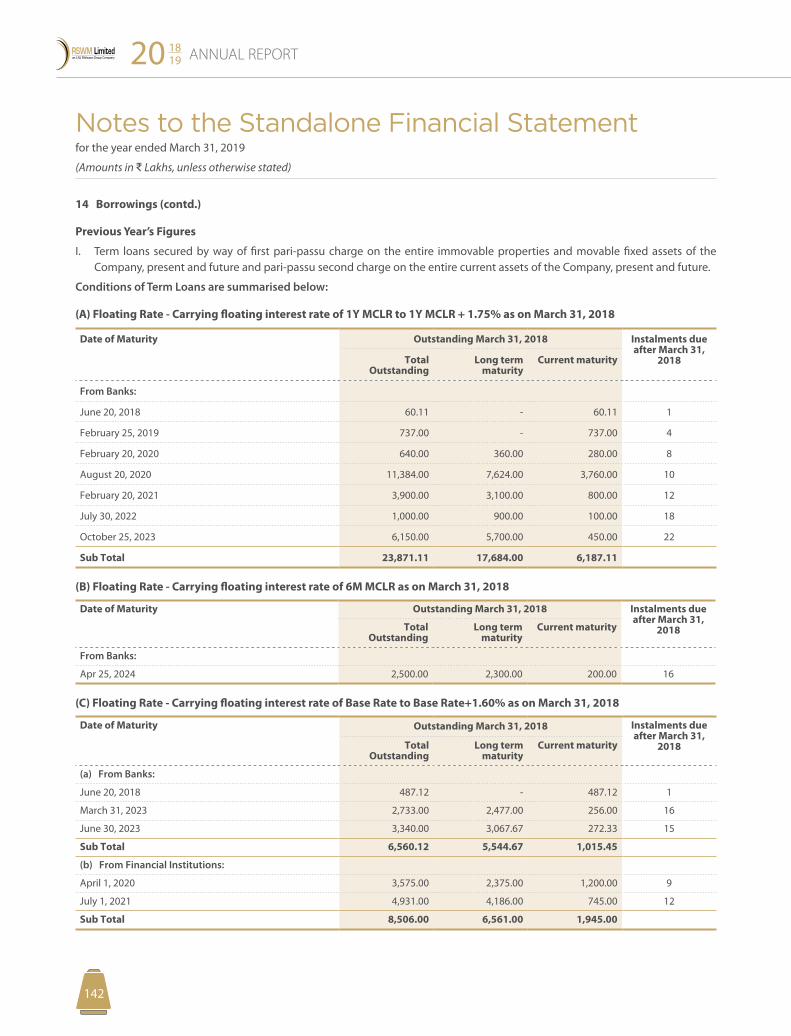
Notes to the Standalone Financial Statement for the year ended March 31, 2019
(Amounts in D Lakhs, unless otherwise stated)
ANNUAL REPORT20 1819
143142
14 Borrowings (contd.)
Previous Year’s Figures
I. Term loans secured by way of first pari-passu charge on the entire immovable properties and movable fixed assets of the Company, present and future and pari-passu second charge on the entire current assets of the Company, present and future.
Conditions of Term Loans are summarised below:
(A) Floating Rate - Carrying floating interest rate of 1Y MCLR to 1Y MCLR + 1.75% as on March 31, 2018
Date of Maturity Outstanding March 31, 2018 Instalments due after March 31,
2018Total Outstanding
Long term maturity
Current maturity
From Banks:
June 20, 2018 60.11 - 60.11 1
February 25, 2019 737.00 - 737.00 4
February 20, 2020 640.00 360.00 280.00 8
August 20, 2020 11,384.00 7,624.00 3,760.00 10
February 20, 2021 3,900.00 3,100.00 800.00 12
July 30, 2022 1,000.00 900.00 100.00 18
October 25, 2023 6,150.00 5,700.00 450.00 22
Sub Total 23,871.11 17,684.00 6,187.11
(B) Floating Rate - Carrying floating interest rate of 6M MCLR as on March 31, 2018
Date of Maturity Outstanding March 31, 2018 Instalments due after March 31,
2018Total Outstanding
Long term maturity
Current maturity
From Banks:
Apr 25, 2024 2,500.00 2,300.00 200.00 16
(C) Floating Rate - Carrying floating interest rate of Base Rate to Base Rate+1.60% as on March 31, 2018
Date of Maturity Outstanding March 31, 2018 Instalments due after March 31,
2018Total Outstanding
Long term maturity
Current maturity
(a) From Banks:
June 20, 2018 487.12 - 487.12 1
March 31, 2023 2,733.00 2,477.00 256.00 16
June 30, 2023 3,340.00 3,067.67 272.33 15
Sub Total 6,560.12 5,544.67 1,015.45
(b) From Financial Institutions:
April 1, 2020 3,575.00 2,375.00 1,200.00 9
July 1, 2021 4,931.00 4,186.00 745.00 12
Sub Total 8,506.00 6,561.00 1,945.00
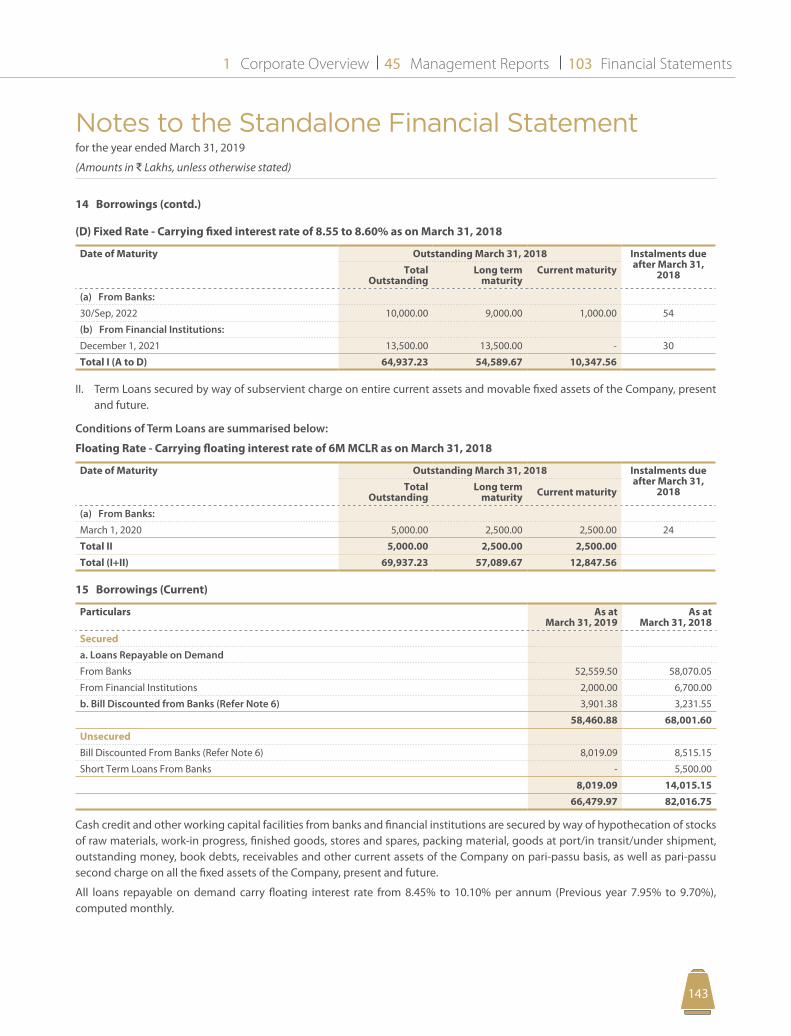
Notes to the Standalone Financial Statement for the year ended March 31, 2019
(Amounts in D Lakhs, unless otherwise stated)
Corporate Overview Management Reports Financial Statements1 45 103
143142
14 Borrowings (contd.)
(D) Fixed Rate - Carrying fixed interest rate of 8.55 to 8.60% as on March 31, 2018
Date of Maturity Outstanding March 31, 2018 Instalments due after March 31,
2018Total Outstanding
Long term maturity
Current maturity
(a) From Banks:
30/Sep, 2022 10,000.00 9,000.00 1,000.00 54
(b) From Financial Institutions:
December 1, 2021 13,500.00 13,500.00 - 30
Total I (A to D) 64,937.23 54,589.67 10,347.56
II. Term Loans secured by way of subservient charge on entire current assets and movable fixed assets of the Company, present and future.
Conditions of Term Loans are summarised below:
Floating Rate - Carrying floating interest rate of 6M MCLR as on March 31, 2018
Date of Maturity Outstanding March 31, 2018 Instalments due after March 31,
2018Total Outstanding
Long term maturity Current maturity
(a) From Banks:
March 1, 2020 5,000.00 2,500.00 2,500.00 24
Total II 5,000.00 2,500.00 2,500.00 Total (I+II) 69,937.23 57,089.67 12,847.56
15 Borrowings (Current)
Particulars As at March 31, 2019
As at March 31, 2018
Secureda. Loans Repayable on Demand
From Banks 52,559.50 58,070.05
From Financial Institutions 2,000.00 6,700.00
b. Bill Discounted from Banks (Refer Note 6) 3,901.38 3,231.55
58,460.88 68,001.60 UnsecuredBill Discounted From Banks (Refer Note 6) 8,019.09 8,515.15
Short Term Loans From Banks - 5,500.00
8,019.09 14,015.15 66,479.97 82,016.75
Cash credit and other working capital facilities from banks and financial institutions are secured by way of hypothecation of stocks of raw materials, work-in progress, finished goods, stores and spares, packing material, goods at port/in transit/under shipment, outstanding money, book debts, receivables and other current assets of the Company on pari-passu basis, as well as pari-passu second charge on all the fixed assets of the Company, present and future.
All loans repayable on demand carry floating interest rate from 8.45% to 10.10% per annum (Previous year 7.95% to 9.70%), computed monthly.
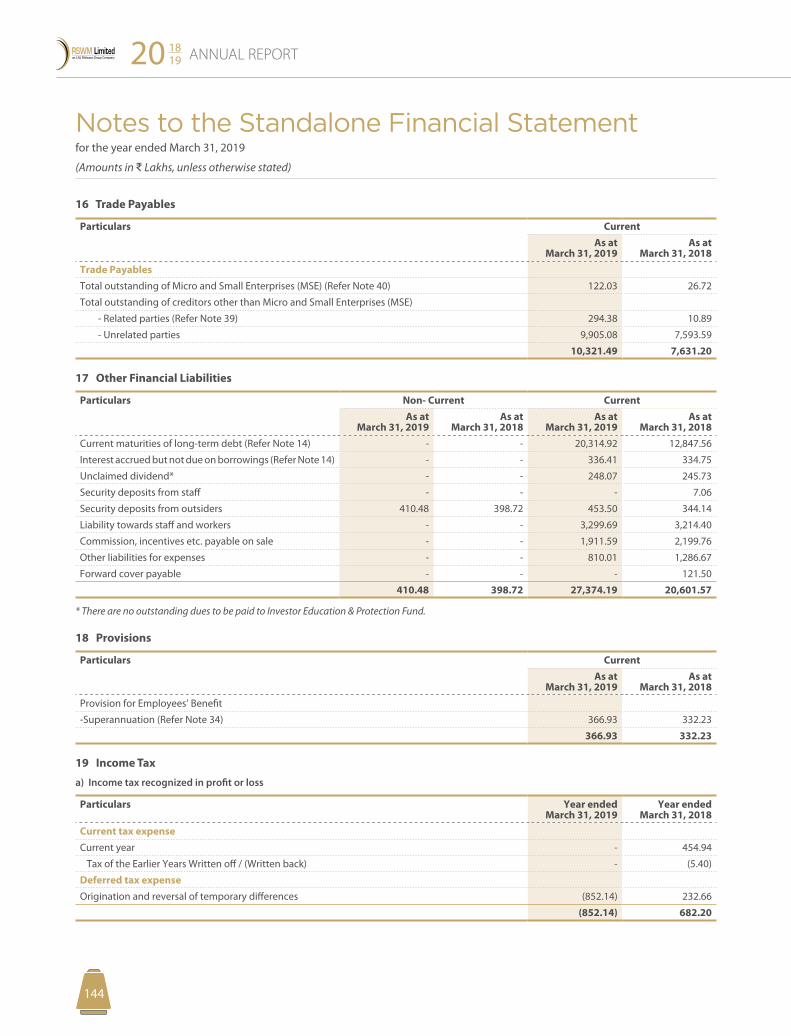
Notes to the Standalone Financial Statement for the year ended March 31, 2019
(Amounts in D Lakhs, unless otherwise stated)
ANNUAL REPORT20 1819
145144
16 Trade Payables
Particulars Current As at
March 31, 2019 As at
March 31, 2018 Trade PayablesTotal outstanding of Micro and Small Enterprises (MSE) (Refer Note 40) 122.03 26.72
Total outstanding of creditors other than Micro and Small Enterprises (MSE)
- Related parties (Refer Note 39) 294.38 10.89
- Unrelated parties 9,905.08 7,593.59
10,321.49 7,631.20
17 Other Financial Liabilities
Particulars Non- Current CurrentAs at
March 31, 2019As at
March 31, 2018As at
March 31, 2019As at
March 31, 2018Current maturities of long-term debt (Refer Note 14) - - 20,314.92 12,847.56
Interest accrued but not due on borrowings (Refer Note 14) - - 336.41 334.75
Unclaimed dividend* - - 248.07 245.73
Security deposits from staff - - - 7.06
Security deposits from outsiders 410.48 398.72 453.50 344.14
Liability towards staff and workers - - 3,299.69 3,214.40
Commission, incentives etc. payable on sale - - 1,911.59 2,199.76
Other liabilities for expenses - - 810.01 1,286.67
Forward cover payable - - - 121.50
410.48 398.72 27,374.19 20,601.57
* There are no outstanding dues to be paid to Investor Education & Protection Fund.
18 Provisions
Particulars CurrentAs at
March 31, 2019As at
March 31, 2018Provision for Employees’ Benefit
-Superannuation (Refer Note 34) 366.93 332.23
366.93 332.23
19 Income Tax
a) Income tax recognized in profit or loss
Particulars Year ended March 31, 2019
Year ended March 31, 2018
Current tax expenseCurrent year - 454.94
Tax of the Earlier Years Written off / (Written back) - (5.40)
Deferred tax expenseOrigination and reversal of temporary differences (852.14) 232.66
(852.14) 682.20
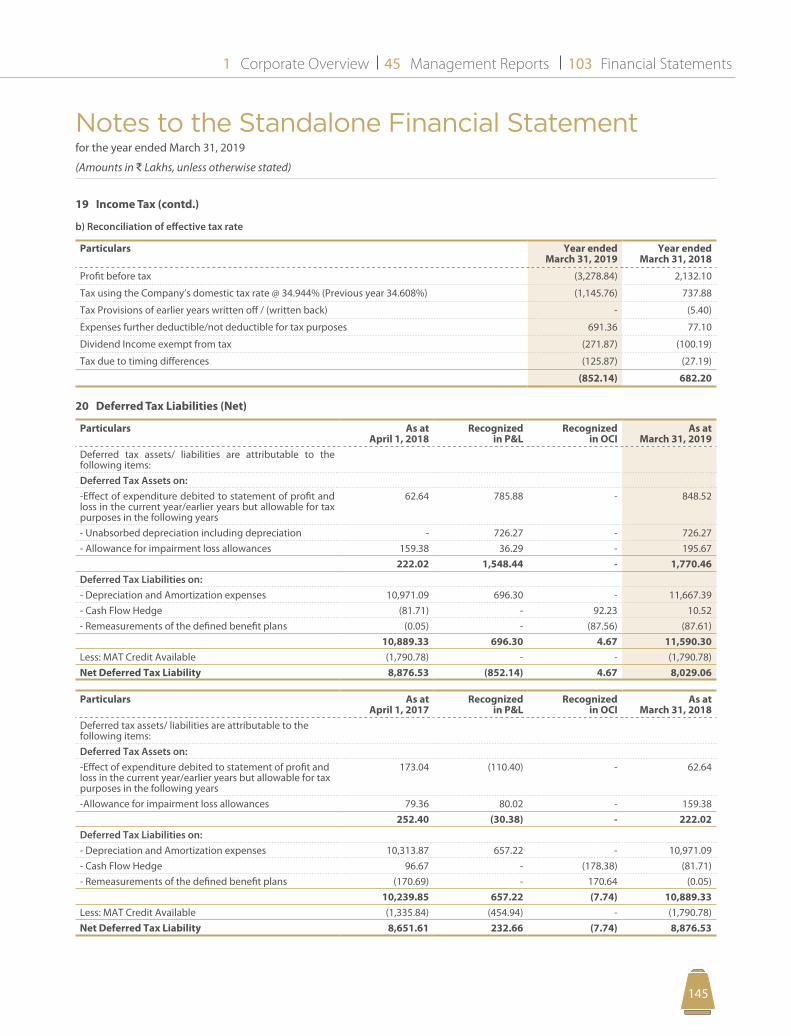
Notes to the Standalone Financial Statement for the year ended March 31, 2019
(Amounts in D Lakhs, unless otherwise stated)
Corporate Overview Management Reports Financial Statements1 45 103
145144
19 Income Tax (contd.)
b) Reconciliation of effective tax rate
Particulars Year ended March 31, 2019
Year ended March 31, 2018
Profit before tax (3,278.84) 2,132.10
Tax using the Company’s domestic tax rate @ 34.944% (Previous year 34.608%) (1,145.76) 737.88
Tax Provisions of earlier years written off / (written back) - (5.40)
Expenses further deductible/not deductible for tax purposes 691.36 77.10
Dividend Income exempt from tax (271.87) (100.19)
Tax due to timing differences (125.87) (27.19)
(852.14) 682.20
20 Deferred Tax Liabilities (Net)
Particulars As at April 1, 2018
Recognized in P&L
Recognized in OCI
As at March 31, 2019
Deferred tax assets/ liabilities are attributable to the following items:Deferred Tax Assets on:-Effect of expenditure debited to statement of profit and loss in the current year/earlier years but allowable for tax purposes in the following years
62.64 785.88 - 848.52
- Unabsorbed depreciation including depreciation - 726.27 - 726.27 - Allowance for impairment loss allowances 159.38 36.29 - 195.67
222.02 1,548.44 - 1,770.46 Deferred Tax Liabilities on:- Depreciation and Amortization expenses 10,971.09 696.30 - 11,667.39 - Cash Flow Hedge (81.71) - 92.23 10.52 - Remeasurements of the defined benefit plans (0.05) - (87.56) (87.61)
10,889.33 696.30 4.67 11,590.30 Less: MAT Credit Available (1,790.78) - - (1,790.78)Net Deferred Tax Liability 8,876.53 (852.14) 4.67 8,029.06
Particulars As at April 1, 2017
Recognized in P&L
Recognized in OCI
As at March 31, 2018
Deferred tax assets/ liabilities are attributable to the following items:Deferred Tax Assets on:-Effect of expenditure debited to statement of profit and loss in the current year/earlier years but allowable for tax purposes in the following years
173.04 (110.40) - 62.64
-Allowance for impairment loss allowances 79.36 80.02 - 159.38 252.40 (30.38) - 222.02
Deferred Tax Liabilities on:- Depreciation and Amortization expenses 10,313.87 657.22 - 10,971.09 - Cash Flow Hedge 96.67 - (178.38) (81.71)- Remeasurements of the defined benefit plans (170.69) - 170.64 (0.05)
10,239.85 657.22 (7.74) 10,889.33 Less: MAT Credit Available (1,335.84) (454.94) - (1,790.78)Net Deferred Tax Liability 8,651.61 232.66 (7.74) 8,876.53
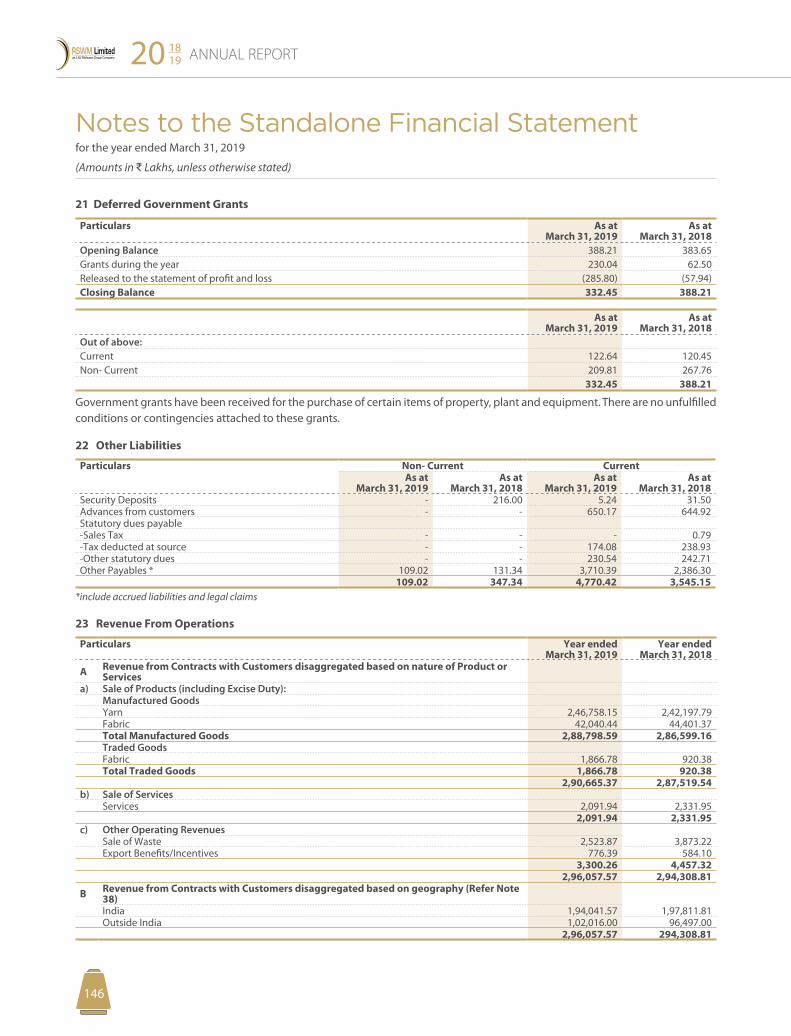
Notes to the Standalone Financial Statement for the year ended March 31, 2019
(Amounts in D Lakhs, unless otherwise stated)
ANNUAL REPORT20 1819
147146
21 Deferred Government Grants
Particulars As at March 31, 2019
As at March 31, 2018
Opening Balance 388.21 383.65 Grants during the year 230.04 62.50 Released to the statement of profit and loss (285.80) (57.94)Closing Balance 332.45 388.21
As at March 31, 2019
As at March 31, 2018
Out of above:Current 122.64 120.45 Non- Current 209.81 267.76
332.45 388.21
Government grants have been received for the purchase of certain items of property, plant and equipment. There are no unfulfilled conditions or contingencies attached to these grants.
22 Other Liabilities
Particulars Non- Current CurrentAs at
March 31, 2019As at
March 31, 2018As at
March 31, 2019As at
March 31, 2018Security Deposits - 216.00 5.24 31.50 Advances from customers - - 650.17 644.92 Statutory dues payable-Sales Tax - - - 0.79 -Tax deducted at source - - 174.08 238.93 -Other statutory dues - - 230.54 242.71 Other Payables * 109.02 131.34 3,710.39 2,386.30
109.02 347.34 4,770.42 3,545.15*include accrued liabilities and legal claims
23 Revenue From Operations
Particulars Year ended March 31, 2019
Year ended March 31, 2018
A Revenue from Contracts with Customers disaggregated based on nature of Product or Services
a) Sale of Products (including Excise Duty):Manufactured GoodsYarn 2,46,758.15 2,42,197.79 Fabric 42,040.44 44,401.37 Total Manufactured Goods 2,88,798.59 2,86,599.16 Traded GoodsFabric 1,866.78 920.38 Total Traded Goods 1,866.78 920.38
2,90,665.37 2,87,519.54 b) Sale of Services
Services 2,091.94 2,331.95 2,091.94 2,331.95
c) Other Operating RevenuesSale of Waste 2,523.87 3,873.22 Export Benefits/Incentives 776.39 584.10
3,300.26 4,457.32 2,96,057.57 2,94,308.81
B Revenue from Contracts with Customers disaggregated based on geography (Refer Note 38)India 1,94,041.57 1,97,811.81 Outside India 1,02,016.00 96,497.00
2,96,057.57 294,308.81
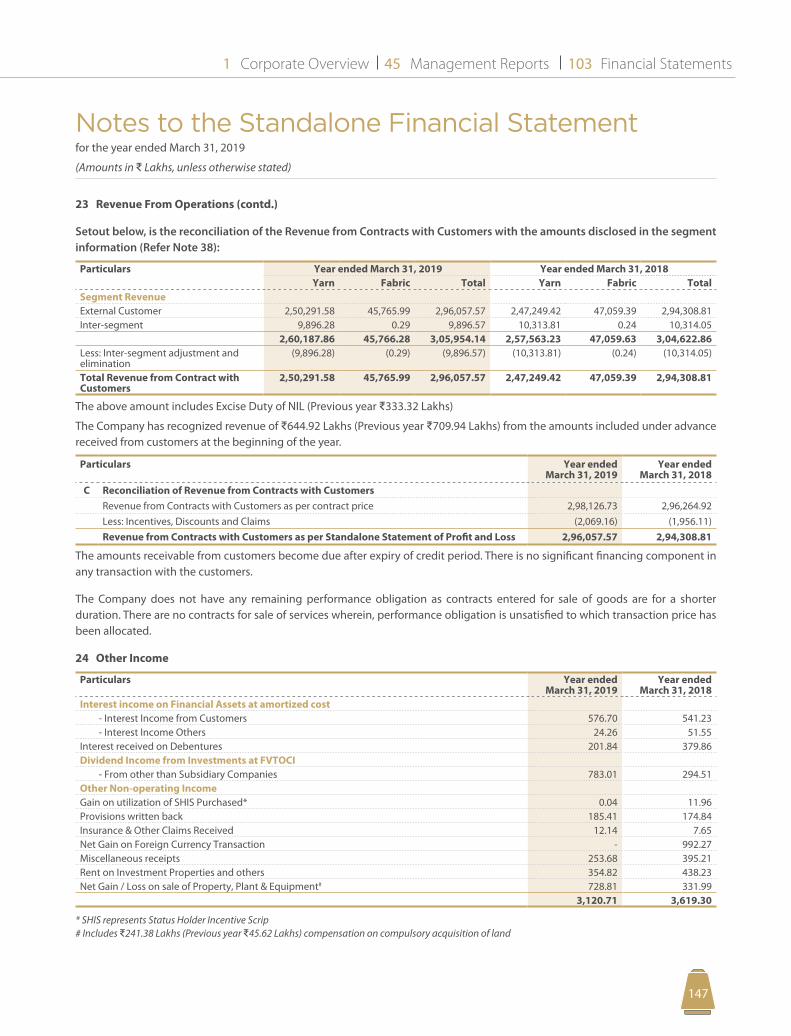
Notes to the Standalone Financial Statement for the year ended March 31, 2019
(Amounts in D Lakhs, unless otherwise stated)
Corporate Overview Management Reports Financial Statements1 45 103
147146
23 Revenue From Operations (contd.)
Setout below, is the reconciliation of the Revenue from Contracts with Customers with the amounts disclosed in the segment information (Refer Note 38):
Particulars Year ended March 31, 2019 Year ended March 31, 2018 Yarn Fabric Total Yarn Fabric Total
Segment RevenueExternal Customer 2,50,291.58 45,765.99 2,96,057.57 2,47,249.42 47,059.39 2,94,308.81 Inter-segment 9,896.28 0.29 9,896.57 10,313.81 0.24 10,314.05
2,60,187.86 45,766.28 3,05,954.14 2,57,563.23 47,059.63 3,04,622.86 Less: Inter-segment adjustment and elimination
(9,896.28) (0.29) (9,896.57) (10,313.81) (0.24) (10,314.05)
Total Revenue from Contract with Customers
2,50,291.58 45,765.99 2,96,057.57 2,47,249.42 47,059.39 2,94,308.81
The above amount includes Excise Duty of NIL (Previous year D333.32 Lakhs)
The Company has recognized revenue of D644.92 Lakhs (Previous year D709.94 Lakhs) from the amounts included under advance received from customers at the beginning of the year.
Particulars Year ended March 31, 2019
Year ended March 31, 2018
C Reconciliation of Revenue from Contracts with CustomersRevenue from Contracts with Customers as per contract price 2,98,126.73 2,96,264.92 Less: Incentives, Discounts and Claims (2,069.16) (1,956.11)Revenue from Contracts with Customers as per Standalone Statement of Profit and Loss 2,96,057.57 2,94,308.81
The amounts receivable from customers become due after expiry of credit period. There is no significant financing component in any transaction with the customers.
The Company does not have any remaining performance obligation as contracts entered for sale of goods are for a shorter duration. There are no contracts for sale of services wherein, performance obligation is unsatisfied to which transaction price has been allocated.
24 Other Income
Particulars Year ended March 31, 2019
Year ended March 31, 2018
Interest income on Financial Assets at amortized cost- Interest Income from Customers 576.70 541.23 - Interest Income Others 24.26 51.55
Interest received on Debentures 201.84 379.86 Dividend Income from Investments at FVTOCI
- From other than Subsidiary Companies 783.01 294.51 Other Non-operating IncomeGain on utilization of SHIS Purchased* 0.04 11.96 Provisions written back 185.41 174.84 Insurance & Other Claims Received 12.14 7.65 Net Gain on Foreign Currency Transaction - 992.27 Miscellaneous receipts 253.68 395.21 Rent on Investment Properties and others 354.82 438.23 Net Gain / Loss on sale of Property, Plant & Equipment# 728.81 331.99
3,120.71 3,619.30
* SHIS represents Status Holder Incentive Scrip# Includes D241.38 Lakhs (Previous year D45.62 Lakhs) compensation on compulsory acquisition of land
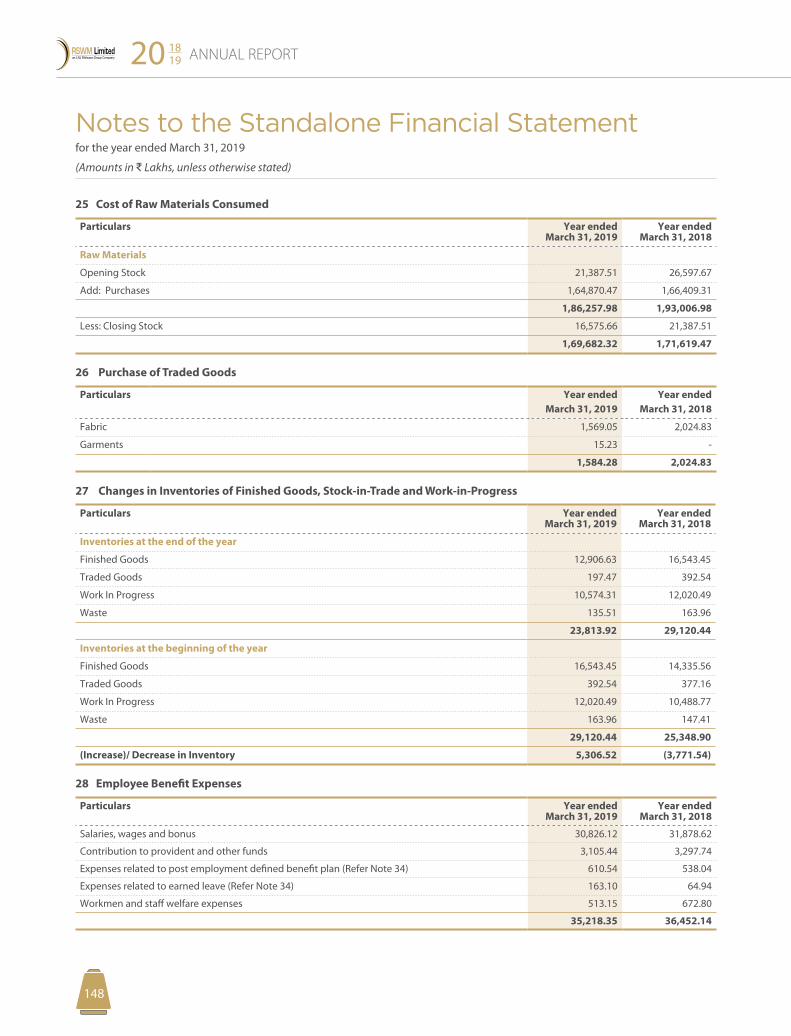
Notes to the Standalone Financial Statement for the year ended March 31, 2019
(Amounts in D Lakhs, unless otherwise stated)
ANNUAL REPORT20 1819
149148
25 Cost of Raw Materials Consumed
Particulars Year ended March 31, 2019
Year ended March 31, 2018
Raw Materials
Opening Stock 21,387.51 26,597.67
Add: Purchases 1,64,870.47 1,66,409.31
1,86,257.98 1,93,006.98
Less: Closing Stock 16,575.66 21,387.51
1,69,682.32 1,71,619.47
26 Purchase of Traded Goods
Particulars Year ended March 31, 2019
Year ended March 31, 2018
Fabric 1,569.05 2,024.83
Garments 15.23 -
1,584.28 2,024.83
27 Changes in Inventories of Finished Goods, Stock-in-Trade and Work-in-Progress
Particulars Year ended March 31, 2019
Year ended March 31, 2018
Inventories at the end of the year
Finished Goods 12,906.63 16,543.45
Traded Goods 197.47 392.54
Work In Progress 10,574.31 12,020.49
Waste 135.51 163.96
23,813.92 29,120.44
Inventories at the beginning of the year
Finished Goods 16,543.45 14,335.56
Traded Goods 392.54 377.16
Work In Progress 12,020.49 10,488.77
Waste 163.96 147.41
29,120.44 25,348.90
(Increase)/ Decrease in Inventory 5,306.52 (3,771.54)
28 Employee Benefit Expenses
Particulars Year ended March 31, 2019
Year ended March 31, 2018
Salaries, wages and bonus 30,826.12 31,878.62
Contribution to provident and other funds 3,105.44 3,297.74
Expenses related to post employment defined benefit plan (Refer Note 34) 610.54 538.04
Expenses related to earned leave (Refer Note 34) 163.10 64.94
Workmen and staff welfare expenses 513.15 672.80
35,218.35 36,452.14
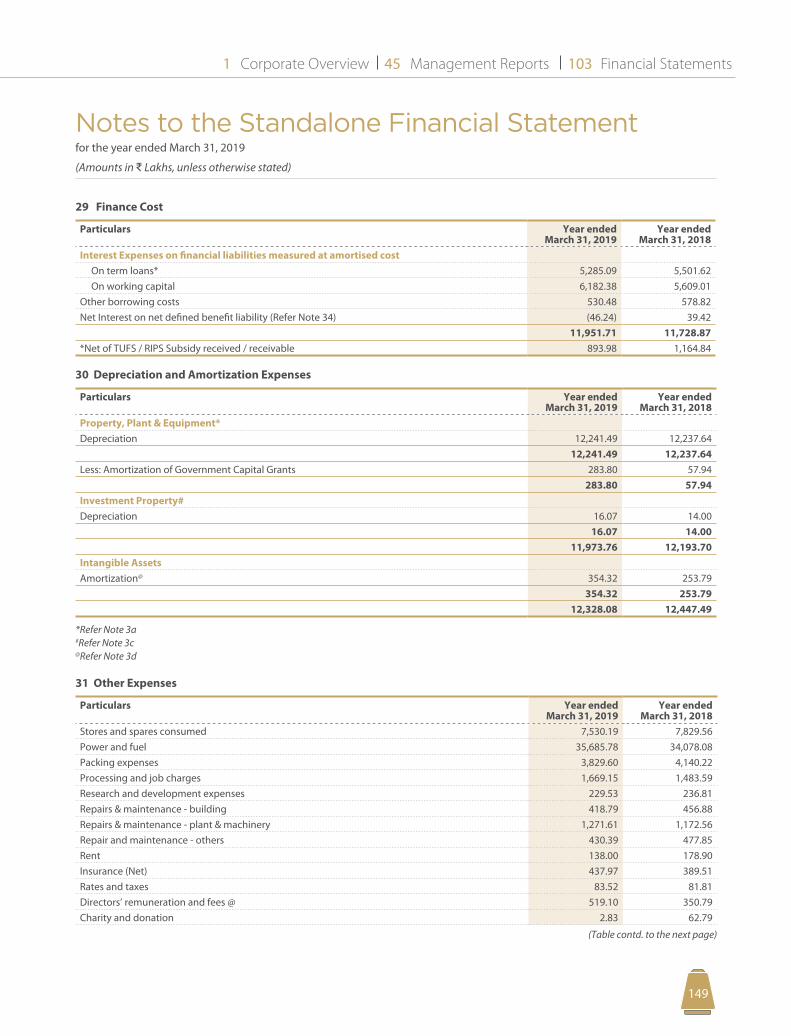
Notes to the Standalone Financial Statement for the year ended March 31, 2019
(Amounts in D Lakhs, unless otherwise stated)
Corporate Overview Management Reports Financial Statements1 45 103
149148
29 Finance Cost
Particulars Year ended March 31, 2019
Year ended March 31, 2018
Interest Expenses on financial liabilities measured at amortised cost On term loans* 5,285.09 5,501.62 On working capital 6,182.38 5,609.01 Other borrowing costs 530.48 578.82 Net Interest on net defined benefit liability (Refer Note 34) (46.24) 39.42
11,951.71 11,728.87 *Net of TUFS / RIPS Subsidy received / receivable 893.98 1,164.84
30 Depreciation and Amortization Expenses
Particulars Year ended March 31, 2019
Year ended March 31, 2018
Property, Plant & Equipment*Depreciation 12,241.49 12,237.64
12,241.49 12,237.64 Less: Amortization of Government Capital Grants 283.80 57.94
283.80 57.94 Investment Property#Depreciation 16.07 14.00
16.07 14.00 11,973.76 12,193.70
Intangible AssetsAmortization@ 354.32 253.79
354.32 253.79 12,328.08 12,447.49
*Refer Note 3a#Refer Note 3c@Refer Note 3d
31 Other Expenses
Particulars Year ended March 31, 2019
Year ended March 31, 2018
Stores and spares consumed 7,530.19 7,829.56 Power and fuel 35,685.78 34,078.08 Packing expenses 3,829.60 4,140.22 Processing and job charges 1,669.15 1,483.59 Research and development expenses 229.53 236.81 Repairs & maintenance - building 418.79 456.88 Repairs & maintenance - plant & machinery 1,271.61 1,172.56 Repair and maintenance - others 430.39 477.85 Rent 138.00 178.90 Insurance (Net) 437.97 389.51 Rates and taxes 83.52 81.81 Directors’ remuneration and fees @ 519.10 350.79 Charity and donation 2.83 62.79
(Table contd. to the next page)
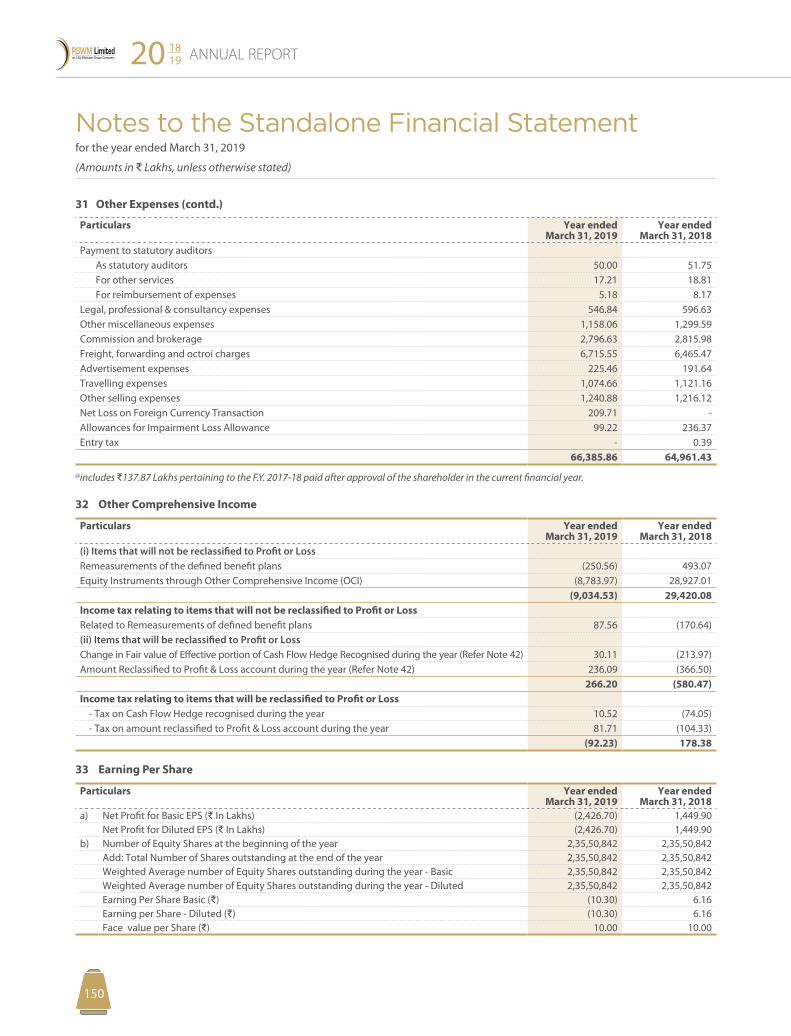
Notes to the Standalone Financial Statement for the year ended March 31, 2019
(Amounts in D Lakhs, unless otherwise stated)
ANNUAL REPORT20 1819
151150
31 Other Expenses (contd.)
Particulars Year ended March 31, 2019
Year ended March 31, 2018
Payment to statutory auditors As statutory auditors 50.00 51.75 For other services 17.21 18.81 For reimbursement of expenses 5.18 8.17 Legal, professional & consultancy expenses 546.84 596.63 Other miscellaneous expenses 1,158.06 1,299.59 Commission and brokerage 2,796.63 2,815.98 Freight, forwarding and octroi charges 6,715.55 6,465.47 Advertisement expenses 225.46 191.64 Travelling expenses 1,074.66 1,121.16 Other selling expenses 1,240.88 1,216.12 Net Loss on Foreign Currency Transaction 209.71 - Allowances for Impairment Loss Allowance 99.22 236.37 Entry tax - 0.39
66,385.86 64,961.43
@includes D137.87 Lakhs pertaining to the F.Y. 2017-18 paid after approval of the shareholder in the current financial year.
32 Other Comprehensive Income
Particulars Year ended March 31, 2019
Year ended March 31, 2018
(i) Items that will not be reclassified to Profit or LossRemeasurements of the defined benefit plans (250.56) 493.07 Equity Instruments through Other Comprehensive Income (OCI) (8,783.97) 28,927.01
(9,034.53) 29,420.08 Income tax relating to items that will not be reclassified to Profit or LossRelated to Remeasurements of defined benefit plans 87.56 (170.64)(ii) Items that will be reclassified to Profit or LossChange in Fair value of Effective portion of Cash Flow Hedge Recognised during the year (Refer Note 42) 30.11 (213.97)Amount Reclassified to Profit & Loss account during the year (Refer Note 42) 236.09 (366.50)
266.20 (580.47)Income tax relating to items that will be reclassified to Profit or Loss - Tax on Cash Flow Hedge recognised during the year 10.52 (74.05) - Tax on amount reclassified to Profit & Loss account during the year 81.71 (104.33)
(92.23) 178.38
33 Earning Per Share
Particulars Year ended March 31, 2019
Year ended March 31, 2018
a) Net Profit for Basic EPS (D In Lakhs) (2,426.70) 1,449.90 Net Profit for Diluted EPS (D In Lakhs) (2,426.70) 1,449.90
b) Number of Equity Shares at the beginning of the year 2,35,50,842 2,35,50,842 Add: Total Number of Shares outstanding at the end of the year 2,35,50,842 2,35,50,842 Weighted Average number of Equity Shares outstanding during the year - Basic 2,35,50,842 2,35,50,842 Weighted Average number of Equity Shares outstanding during the year - Diluted 2,35,50,842 2,35,50,842 Earning Per Share Basic (D) (10.30) 6.16 Earning per Share - Diluted (D) (10.30) 6.16 Face value per Share (D) 10.00 10.00
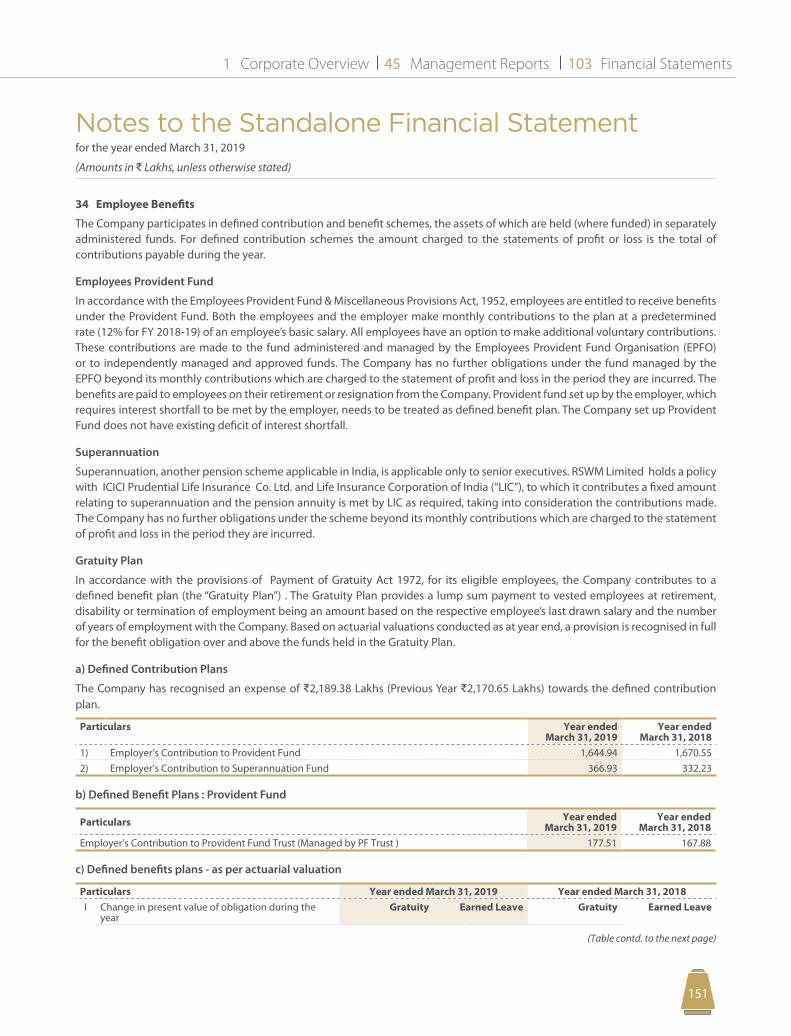
Notes to the Standalone Financial Statement for the year ended March 31, 2019
(Amounts in D Lakhs, unless otherwise stated)
Corporate Overview Management Reports Financial Statements1 45 103
151150
34 Employee Benefits
The Company participates in defined contribution and benefit schemes, the assets of which are held (where funded) in separately administered funds. For defined contribution schemes the amount charged to the statements of profit or loss is the total of contributions payable during the year.
Employees Provident Fund
In accordance with the Employees Provident Fund & Miscellaneous Provisions Act, 1952, employees are entitled to receive benefits under the Provident Fund. Both the employees and the employer make monthly contributions to the plan at a predetermined rate (12% for FY 2018-19) of an employee’s basic salary. All employees have an option to make additional voluntary contributions. These contributions are made to the fund administered and managed by the Employees Provident Fund Organisation (EPFO) or to independently managed and approved funds. The Company has no further obligations under the fund managed by the EPFO beyond its monthly contributions which are charged to the statement of profit and loss in the period they are incurred. The benefits are paid to employees on their retirement or resignation from the Company. Provident fund set up by the employer, which requires interest shortfall to be met by the employer, needs to be treated as defined benefit plan. The Company set up Provident Fund does not have existing deficit of interest shortfall.
Superannuation
Superannuation, another pension scheme applicable in India, is applicable only to senior executives. RSWM Limited holds a policy with ICICI Prudential Life Insurance Co. Ltd. and Life Insurance Corporation of India (“LIC”), to which it contributes a fixed amount relating to superannuation and the pension annuity is met by LIC as required, taking into consideration the contributions made. The Company has no further obligations under the scheme beyond its monthly contributions which are charged to the statement of profit and loss in the period they are incurred.
Gratuity Plan
In accordance with the provisions of Payment of Gratuity Act 1972, for its eligible employees, the Company contributes to a defined benefit plan (the “Gratuity Plan”) . The Gratuity Plan provides a lump sum payment to vested employees at retirement, disability or termination of employment being an amount based on the respective employee’s last drawn salary and the number of years of employment with the Company. Based on actuarial valuations conducted as at year end, a provision is recognised in full for the benefit obligation over and above the funds held in the Gratuity Plan.
a) Defined Contribution Plans
The Company has recognised an expense of D2,189.38 Lakhs (Previous Year D2,170.65 Lakhs) towards the defined contribution plan.
Particulars Year ended March 31, 2019
Year ended March 31, 2018
1) Employer’s Contribution to Provident Fund 1,644.94 1,670.55 2) Employer’s Contribution to Superannuation Fund 366.93 332.23
b) Defined Benefit Plans : Provident Fund
Particulars Year ended March 31, 2019
Year ended March 31, 2018
Employer’s Contribution to Provident Fund Trust (Managed by PF Trust ) 177.51 167.88
c) Defined benefits plans - as per actuarial valuation
Particulars Year ended March 31, 2019 Year ended March 31, 2018I Change in present value of obligation during the
yearGratuity Earned Leave Gratuity Earned Leave
(Table contd. to the next page)
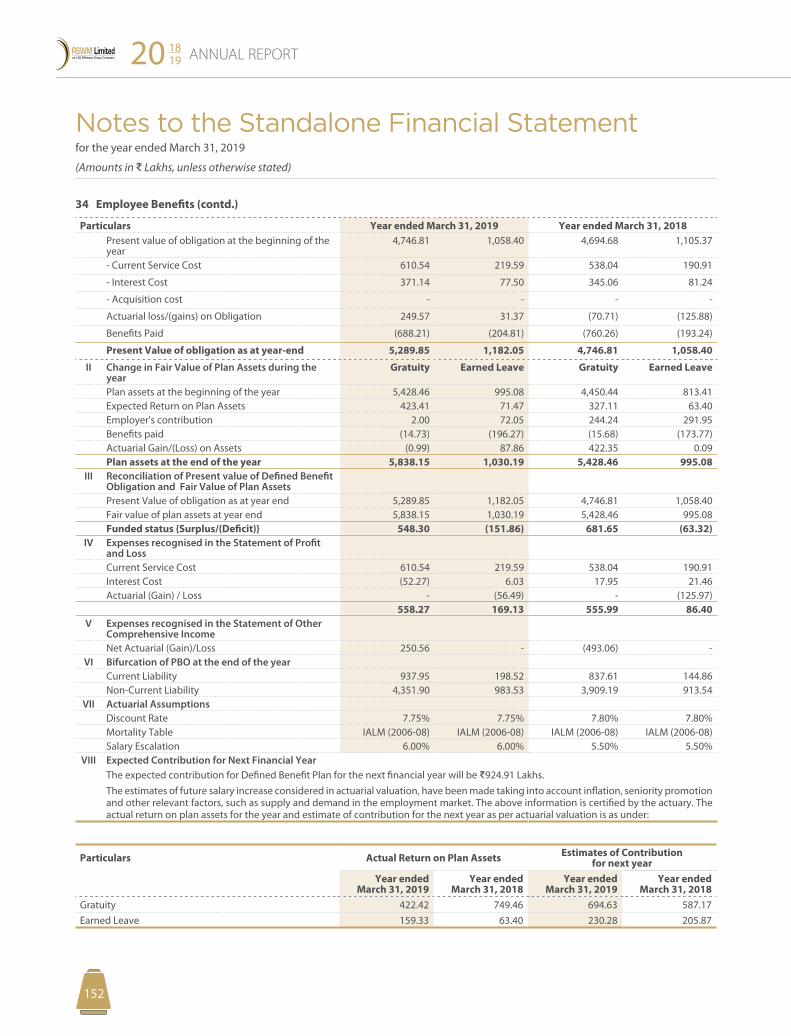
Notes to the Standalone Financial Statement for the year ended March 31, 2019
(Amounts in D Lakhs, unless otherwise stated)
ANNUAL REPORT20 1819
153152
34 Employee Benefits (contd.)
Particulars Year ended March 31, 2019 Year ended March 31, 2018Present value of obligation at the beginning of the year
4,746.81 1,058.40 4,694.68 1,105.37
- Current Service Cost 610.54 219.59 538.04 190.91
- Interest Cost 371.14 77.50 345.06 81.24
- Acquisition cost - - - -
Actuarial loss/(gains) on Obligation 249.57 31.37 (70.71) (125.88)
Benefits Paid (688.21) (204.81) (760.26) (193.24)
Present Value of obligation as at year-end 5,289.85 1,182.05 4,746.81 1,058.40
II Change in Fair Value of Plan Assets during the year
Gratuity Earned Leave Gratuity Earned Leave
Plan assets at the beginning of the year 5,428.46 995.08 4,450.44 813.41 Expected Return on Plan Assets 423.41 71.47 327.11 63.40 Employer's contribution 2.00 72.05 244.24 291.95 Benefits paid (14.73) (196.27) (15.68) (173.77)Actuarial Gain/(Loss) on Assets (0.99) 87.86 422.35 0.09 Plan assets at the end of the year 5,838.15 1,030.19 5,428.46 995.08
III Reconciliation of Present value of Defined Benefit Obligation and Fair Value of Plan AssetsPresent Value of obligation as at year end 5,289.85 1,182.05 4,746.81 1,058.40 Fair value of plan assets at year end 5,838.15 1,030.19 5,428.46 995.08 Funded status {Surplus/(Deficit)} 548.30 (151.86) 681.65 (63.32)
IV Expenses recognised in the Statement of Profit and LossCurrent Service Cost 610.54 219.59 538.04 190.91 Interest Cost (52.27) 6.03 17.95 21.46 Actuarial (Gain) / Loss - (56.49) - (125.97)
558.27 169.13 555.99 86.40 V Expenses recognised in the Statement of Other
Comprehensive IncomeNet Actuarial (Gain)/Loss 250.56 - (493.06) -
VI Bifurcation of PBO at the end of the yearCurrent Liability 937.95 198.52 837.61 144.86 Non-Current Liability 4,351.90 983.53 3,909.19 913.54
VII Actuarial AssumptionsDiscount Rate 7.75% 7.75% 7.80% 7.80%Mortality Table IALM (2006-08) IALM (2006-08) IALM (2006-08) IALM (2006-08) Salary Escalation 6.00% 6.00% 5.50% 5.50%
VIII Expected Contribution for Next Financial YearThe expected contribution for Defined Benefit Plan for the next financial year will be D924.91 Lakhs.The estimates of future salary increase considered in actuarial valuation, have been made taking into account inflation, seniority promotion and other relevant factors, such as supply and demand in the employment market. The above information is certified by the actuary. The actual return on plan assets for the year and estimate of contribution for the next year as per actuarial valuation is as under:
Particulars Actual Return on Plan Assets Estimates of Contribution for next year
Year ended March 31, 2019
Year ended March 31, 2018
Year ended March 31, 2019
Year ended March 31, 2018
Gratuity 422.42 749.46 694.63 587.17 Earned Leave 159.33 63.40 230.28 205.87
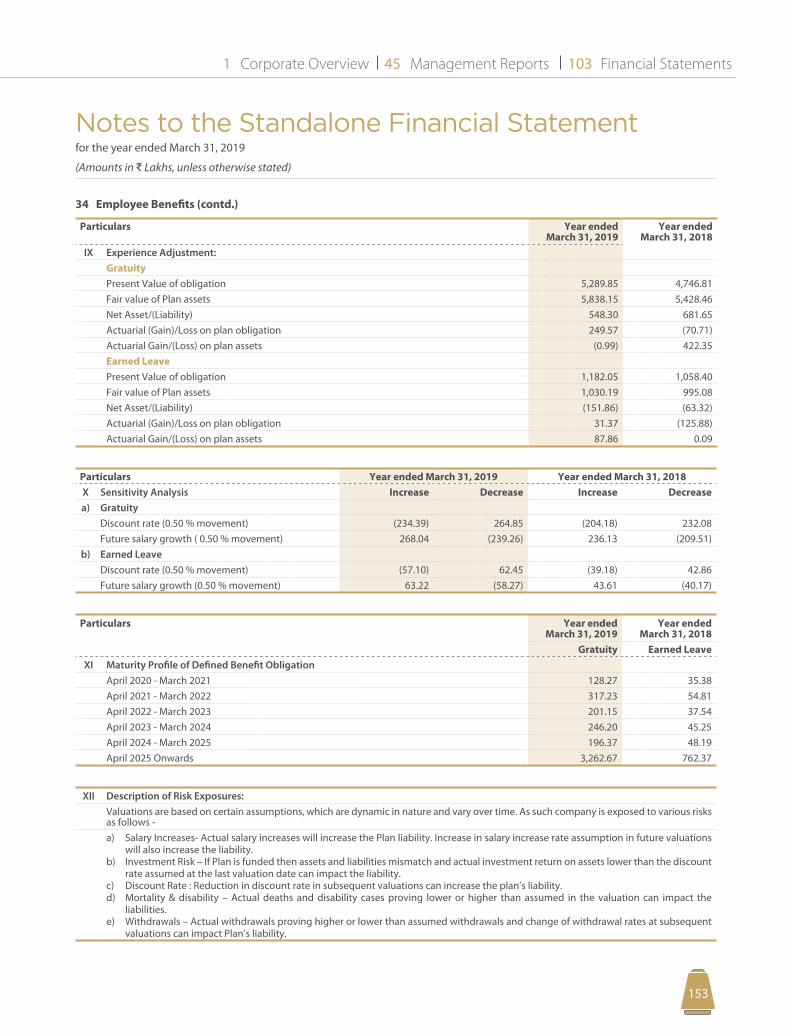
Notes to the Standalone Financial Statement for the year ended March 31, 2019
(Amounts in D Lakhs, unless otherwise stated)
Corporate Overview Management Reports Financial Statements1 45 103
153152
34 Employee Benefits (contd.)
Particulars Year ended March 31, 2019
Year ended March 31, 2018
IX Experience Adjustment:GratuityPresent Value of obligation 5,289.85 4,746.81 Fair value of Plan assets 5,838.15 5,428.46 Net Asset/(Liability) 548.30 681.65 Actuarial (Gain)/Loss on plan obligation 249.57 (70.71)Actuarial Gain/(Loss) on plan assets (0.99) 422.35 Earned LeavePresent Value of obligation 1,182.05 1,058.40 Fair value of Plan assets 1,030.19 995.08 Net Asset/(Liability) (151.86) (63.32)Actuarial (Gain)/Loss on plan obligation 31.37 (125.88)Actuarial Gain/(Loss) on plan assets 87.86 0.09
Particulars Year ended March 31, 2019 Year ended March 31, 2018X Sensitivity Analysis Increase Decrease Increase Decreasea) Gratuity
Discount rate (0.50 % movement) (234.39) 264.85 (204.18) 232.08 Future salary growth ( 0.50 % movement) 268.04 (239.26) 236.13 (209.51)
b) Earned LeaveDiscount rate (0.50 % movement) (57.10) 62.45 (39.18) 42.86 Future salary growth (0.50 % movement) 63.22 (58.27) 43.61 (40.17)
Particulars Year ended March 31, 2019
Year ended March 31, 2018
Gratuity Earned LeaveXI Maturity Profile of Defined Benefit Obligation
April 2020 - March 2021 128.27 35.38 April 2021 - March 2022 317.23 54.81 April 2022 - March 2023 201.15 37.54 April 2023 - March 2024 246.20 45.25 April 2024 - March 2025 196.37 48.19 April 2025 Onwards 3,262.67 762.37
XII Description of Risk Exposures:Valuations are based on certain assumptions, which are dynamic in nature and vary over time. As such company is exposed to various risks as follows - a) Salary Increases- Actual salary increases will increase the Plan liability. Increase in salary increase rate assumption in future valuations
will also increase the liability.b) Investment Risk – If Plan is funded then assets and liabilities mismatch and actual investment return on assets lower than the discount
rate assumed at the last valuation date can impact the liability.c) Discount Rate : Reduction in discount rate in subsequent valuations can increase the plan’s liability.d) Mortality & disability – Actual deaths and disability cases proving lower or higher than assumed in the valuation can impact the
liabilities.e) Withdrawals – Actual withdrawals proving higher or lower than assumed withdrawals and change of withdrawal rates at subsequent
valuations can impact Plan’s liability.
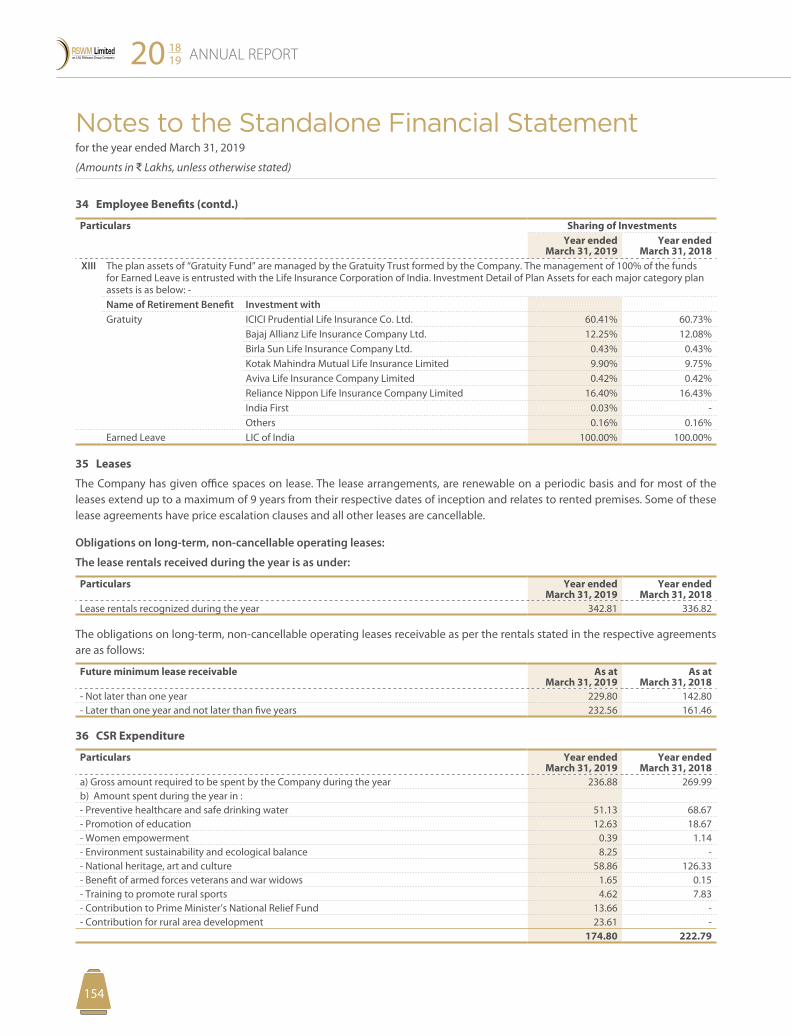
Notes to the Standalone Financial Statement for the year ended March 31, 2019
(Amounts in D Lakhs, unless otherwise stated)
ANNUAL REPORT20 1819
155154
34 Employee Benefits (contd.)
Particulars Sharing of InvestmentsYear ended
March 31, 2019Year ended
March 31, 2018XIII The plan assets of “Gratuity Fund” are managed by the Gratuity Trust formed by the Company. The management of 100% of the funds
for Earned Leave is entrusted with the Life Insurance Corporation of India. Investment Detail of Plan Assets for each major category plan assets is as below: -Name of Retirement Benefit Investment withGratuity ICICI Prudential Life Insurance Co. Ltd. 60.41% 60.73%
Bajaj Allianz Life Insurance Company Ltd. 12.25% 12.08%Birla Sun Life Insurance Company Ltd. 0.43% 0.43%Kotak Mahindra Mutual Life Insurance Limited 9.90% 9.75%Aviva Life Insurance Company Limited 0.42% 0.42%Reliance Nippon Life Insurance Company Limited 16.40% 16.43%India First 0.03% -Others 0.16% 0.16%
Earned Leave LIC of India 100.00% 100.00%
35 Leases
The Company has given office spaces on lease. The lease arrangements, are renewable on a periodic basis and for most of the leases extend up to a maximum of 9 years from their respective dates of inception and relates to rented premises. Some of these lease agreements have price escalation clauses and all other leases are cancellable.
Obligations on long-term, non-cancellable operating leases:
The lease rentals received during the year is as under:
Particulars Year ended March 31, 2019
Year ended March 31, 2018
Lease rentals recognized during the year 342.81 336.82
The obligations on long-term, non-cancellable operating leases receivable as per the rentals stated in the respective agreements are as follows:
Future minimum lease receivable As at March 31, 2019
As at March 31, 2018
- Not later than one year 229.80 142.80 - Later than one year and not later than five years 232.56 161.46
36 CSR Expenditure
Particulars Year ended March 31, 2019
Year ended March 31, 2018
a) Gross amount required to be spent by the Company during the year 236.88 269.99 b) Amount spent during the year in :- Preventive healthcare and safe drinking water 51.13 68.67 - Promotion of education 12.63 18.67 - Women empowerment 0.39 1.14 - Environment sustainability and ecological balance 8.25 - - National heritage, art and culture 58.86 126.33 - Benefit of armed forces veterans and war widows 1.65 0.15 - Training to promote rural sports 4.62 7.83 - Contribution to Prime Minister’s National Relief Fund 13.66 - - Contribution for rural area development 23.61 -
174.80 222.79
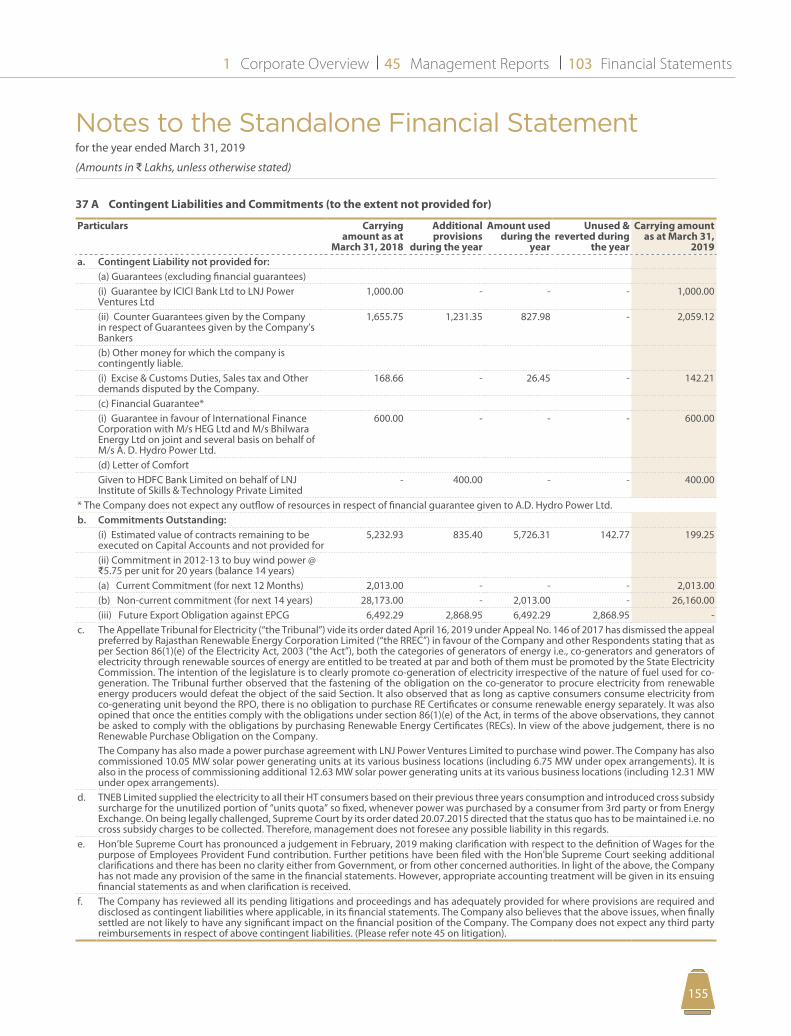
Notes to the Standalone Financial Statement for the year ended March 31, 2019
(Amounts in D Lakhs, unless otherwise stated)
Corporate Overview Management Reports Financial Statements1 45 103
155154
37 A Contingent Liabilities and Commitments (to the extent not provided for)
Particulars Carrying amount as at
March 31, 2018
Additional provisions
during the year
Amount used during the
year
Unused & reverted during
the year
Carrying amount as at March 31,
2019a. Contingent Liability not provided for:
(a) Guarantees (excluding financial guarantees)(i) Guarantee by ICICI Bank Ltd to LNJ Power Ventures Ltd
1,000.00 - - - 1,000.00
(ii) Counter Guarantees given by the Company in respect of Guarantees given by the Company’s Bankers
1,655.75 1,231.35 827.98 - 2,059.12
(b) Other money for which the company is contingently liable.(i) Excise & Customs Duties, Sales tax and Other demands disputed by the Company.
168.66 - 26.45 - 142.21
(c) Financial Guarantee*(i) Guarantee in favour of International Finance Corporation with M/s HEG Ltd and M/s Bhilwara Energy Ltd on joint and several basis on behalf of M/s A. D. Hydro Power Ltd.
600.00 - - - 600.00
(d) Letter of ComfortGiven to HDFC Bank Limited on behalf of LNJ Institute of Skills & Technology Private Limited
- 400.00 - - 400.00
* The Company does not expect any outflow of resources in respect of financial guarantee given to A.D. Hydro Power Ltd.b. Commitments Outstanding:
(i) Estimated value of contracts remaining to be executed on Capital Accounts and not provided for
5,232.93 835.40 5,726.31 142.77 199.25
(ii) Commitment in 2012-13 to buy wind power @ D5.75 per unit for 20 years (balance 14 years)(a) Current Commitment (for next 12 Months) 2,013.00 - - - 2,013.00 (b) Non-current commitment (for next 14 years) 28,173.00 - 2,013.00 - 26,160.00 (iii) Future Export Obligation against EPCG 6,492.29 2,868.95 6,492.29 2,868.95 -
c. The Appellate Tribunal for Electricity (“the Tribunal”) vide its order dated April 16, 2019 under Appeal No. 146 of 2017 has dismissed the appeal preferred by Rajasthan Renewable Energy Corporation Limited (“the RREC”) in favour of the Company and other Respondents stating that as per Section 86(1)(e) of the Electricity Act, 2003 (“the Act”), both the categories of generators of energy i.e., co-generators and generators of electricity through renewable sources of energy are entitled to be treated at par and both of them must be promoted by the State Electricity Commission. The intention of the legislature is to clearly promote co-generation of electricity irrespective of the nature of fuel used for co-generation. The Tribunal further observed that the fastening of the obligation on the co-generator to procure electricity from renewable energy producers would defeat the object of the said Section. It also observed that as long as captive consumers consume electricity from co-generating unit beyond the RPO, there is no obligation to purchase RE Certificates or consume renewable energy separately. It was also opined that once the entities comply with the obligations under section 86(1)(e) of the Act, in terms of the above observations, they cannot be asked to comply with the obligations by purchasing Renewable Energy Certificates (RECs). In view of the above judgement, there is no Renewable Purchase Obligation on the Company. The Company has also made a power purchase agreement with LNJ Power Ventures Limited to purchase wind power. The Company has also commissioned 10.05 MW solar power generating units at its various business locations (including 6.75 MW under opex arrangements). It is also in the process of commissioning additional 12.63 MW solar power generating units at its various business locations (including 12.31 MW under opex arrangements).
d. TNEB Limited supplied the electricity to all their HT consumers based on their previous three years consumption and introduced cross subsidy surcharge for the unutilized portion of “units quota” so fixed, whenever power was purchased by a consumer from 3rd party or from Energy Exchange. On being legally challenged, Supreme Court by its order dated 20.07.2015 directed that the status quo has to be maintained i.e. no cross subsidy charges to be collected. Therefore, management does not foresee any possible liability in this regards.
e. Hon’ble Supreme Court has pronounced a judgement in February, 2019 making clarification with respect to the definition of Wages for the purpose of Employees Provident Fund contribution. Further petitions have been filed with the Hon'ble Supreme Court seeking additional clarifications and there has been no clarity either from Government, or from other concerned authorities. In light of the above, the Company has not made any provision of the same in the financial statements. However, appropriate accounting treatment will be given in its ensuing financial statements as and when clarification is received.
f. The Company has reviewed all its pending litigations and proceedings and has adequately provided for where provisions are required and disclosed as contingent liabilities where applicable, in its financial statements. The Company also believes that the above issues, when finally settled are not likely to have any significant impact on the financial position of the Company. The Company does not expect any third party reimbursements in respect of above contingent liabilities. (Please refer note 45 on litigation).
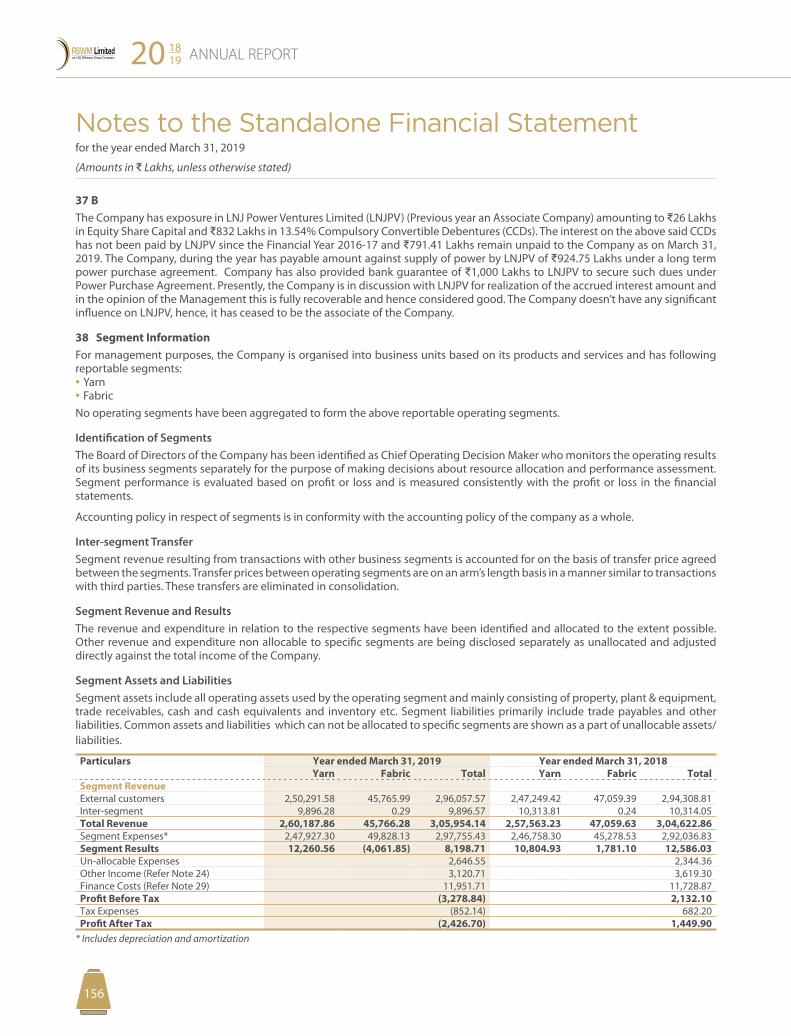
Notes to the Standalone Financial Statement for the year ended March 31, 2019
(Amounts in D Lakhs, unless otherwise stated)
ANNUAL REPORT20 1819
157156
37 BThe Company has exposure in LNJ Power Ventures Limited (LNJPV) (Previous year an Associate Company) amounting to D26 Lakhs in Equity Share Capital and D832 Lakhs in 13.54% Compulsory Convertible Debentures (CCDs). The interest on the above said CCDs has not been paid by LNJPV since the Financial Year 2016-17 and D791.41 Lakhs remain unpaid to the Company as on March 31, 2019. The Company, during the year has payable amount against supply of power by LNJPV of D924.75 Lakhs under a long term power purchase agreement. Company has also provided bank guarantee of D1,000 Lakhs to LNJPV to secure such dues under Power Purchase Agreement. Presently, the Company is in discussion with LNJPV for realization of the accrued interest amount and in the opinion of the Management this is fully recoverable and hence considered good. The Company doesn’t have any significant influence on LNJPV, hence, it has ceased to be the associate of the Company.
38 Segment InformationFor management purposes, the Company is organised into business units based on its products and services and has following reportable segments:• Yarn• FabricNo operating segments have been aggregated to form the above reportable operating segments.
Identification of SegmentsThe Board of Directors of the Company has been identified as Chief Operating Decision Maker who monitors the operating results of its business segments separately for the purpose of making decisions about resource allocation and performance assessment. Segment performance is evaluated based on profit or loss and is measured consistently with the profit or loss in the financial statements.
Accounting policy in respect of segments is in conformity with the accounting policy of the company as a whole.
Inter-segment TransferSegment revenue resulting from transactions with other business segments is accounted for on the basis of transfer price agreed between the segments. Transfer prices between operating segments are on an arm’s length basis in a manner similar to transactions with third parties. These transfers are eliminated in consolidation.
Segment Revenue and ResultsThe revenue and expenditure in relation to the respective segments have been identified and allocated to the extent possible. Other revenue and expenditure non allocable to specific segments are being disclosed separately as unallocated and adjusted directly against the total income of the Company.
Segment Assets and LiabilitiesSegment assets include all operating assets used by the operating segment and mainly consisting of property, plant & equipment, trade receivables, cash and cash equivalents and inventory etc. Segment liabilities primarily include trade payables and other liabilities. Common assets and liabilities which can not be allocated to specific segments are shown as a part of unallocable assets/liabilities.
Particulars Year ended March 31, 2019 Year ended March 31, 2018Yarn Fabric Total Yarn Fabric Total
Segment RevenueExternal customers 2,50,291.58 45,765.99 2,96,057.57 2,47,249.42 47,059.39 2,94,308.81 Inter-segment 9,896.28 0.29 9,896.57 10,313.81 0.24 10,314.05 Total Revenue 2,60,187.86 45,766.28 3,05,954.14 2,57,563.23 47,059.63 3,04,622.86 Segment Expenses* 2,47,927.30 49,828.13 2,97,755.43 2,46,758.30 45,278.53 2,92,036.83 Segment Results 12,260.56 (4,061.85) 8,198.71 10,804.93 1,781.10 12,586.03 Un-allocable Expenses 2,646.55 2,344.36 Other Income (Refer Note 24) 3,120.71 3,619.30 Finance Costs (Refer Note 29) 11,951.71 11,728.87 Profit Before Tax (3,278.84) 2,132.10 Tax Expenses (852.14) 682.20 Profit After Tax (2,426.70) 1,449.90
* Includes depreciation and amortization
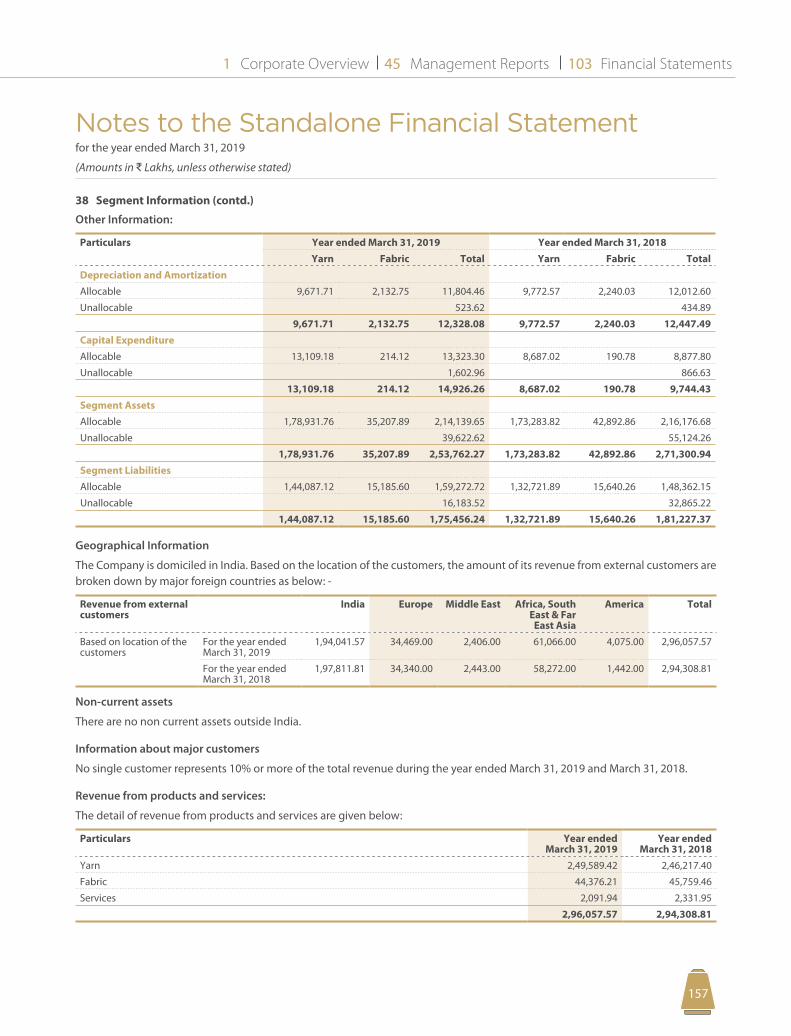
Notes to the Standalone Financial Statement for the year ended March 31, 2019
(Amounts in D Lakhs, unless otherwise stated)
Corporate Overview Management Reports Financial Statements1 45 103
157156
38 Segment Information (contd.)
Other Information:
Particulars Year ended March 31, 2019 Year ended March 31, 2018Yarn Fabric Total Yarn Fabric Total
Depreciation and AmortizationAllocable 9,671.71 2,132.75 11,804.46 9,772.57 2,240.03 12,012.60
Unallocable 523.62 434.89
9,671.71 2,132.75 12,328.08 9,772.57 2,240.03 12,447.49 Capital Expenditure Allocable 13,109.18 214.12 13,323.30 8,687.02 190.78 8,877.80
Unallocable 1,602.96 866.63
13,109.18 214.12 14,926.26 8,687.02 190.78 9,744.43 Segment AssetsAllocable 1,78,931.76 35,207.89 2,14,139.65 1,73,283.82 42,892.86 2,16,176.68
Unallocable 39,622.62 55,124.26
1,78,931.76 35,207.89 2,53,762.27 1,73,283.82 42,892.86 2,71,300.94 Segment LiabilitiesAllocable 1,44,087.12 15,185.60 1,59,272.72 1,32,721.89 15,640.26 1,48,362.15
Unallocable 16,183.52 32,865.22
1,44,087.12 15,185.60 1,75,456.24 1,32,721.89 15,640.26 1,81,227.37
Geographical Information
The Company is domiciled in India. Based on the location of the customers, the amount of its revenue from external customers are broken down by major foreign countries as below: -
Revenue from external customers
India Europe Middle East Africa, South East & Far
East Asia
America Total
Based on location of the customers
For the year ended March 31, 2019
1,94,041.57 34,469.00 2,406.00 61,066.00 4,075.00 2,96,057.57
For the year ended March 31, 2018
1,97,811.81 34,340.00 2,443.00 58,272.00 1,442.00 2,94,308.81
Non-current assets
There are no non current assets outside India.
Information about major customers
No single customer represents 10% or more of the total revenue during the year ended March 31, 2019 and March 31, 2018.
Revenue from products and services:
The detail of revenue from products and services are given below:
Particulars Year ended March 31, 2019
Year ended March 31, 2018
Yarn 2,49,589.42 2,46,217.40
Fabric 44,376.21 45,759.46
Services 2,091.94 2,331.95
2,96,057.57 2,94,308.81
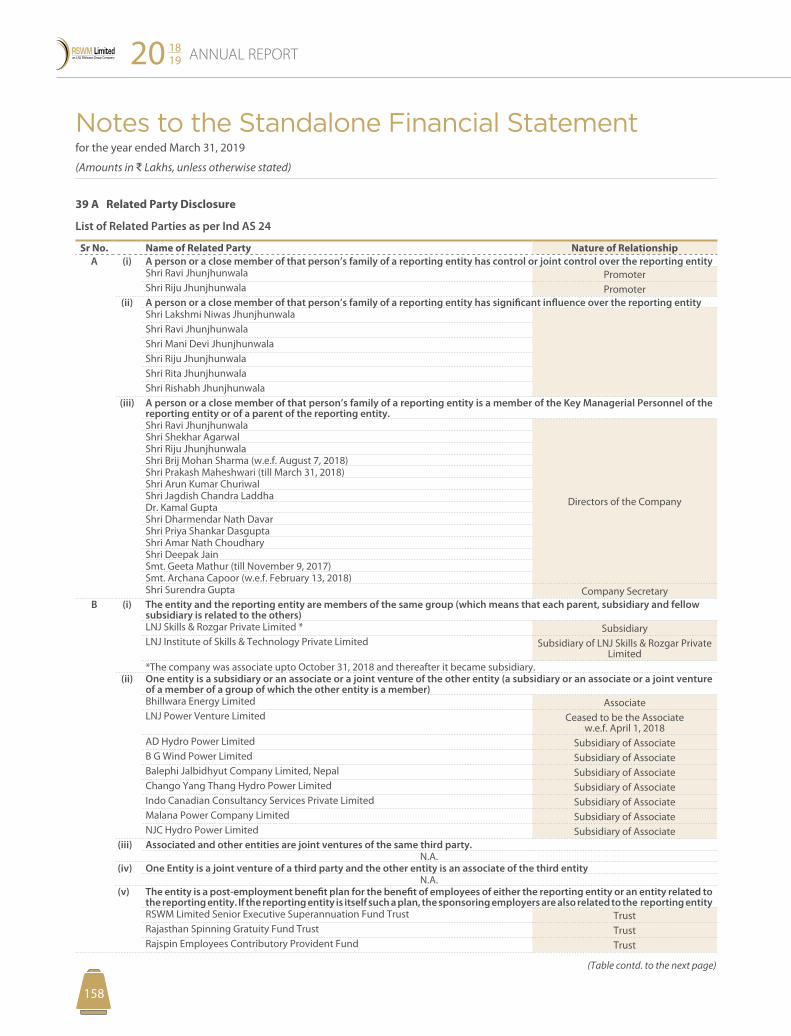
Notes to the Standalone Financial Statement for the year ended March 31, 2019
(Amounts in D Lakhs, unless otherwise stated)
ANNUAL REPORT20 1819
159158
39 A Related Party Disclosure
List of Related Parties as per Ind AS 24
Sr No. Name of Related Party Nature of RelationshipA (i) A person or a close member of that person’s family of a reporting entity has control or joint control over the reporting entity
Shri Ravi Jhunjhunwala PromoterShri Riju Jhunjhunwala Promoter
(ii) A person or a close member of that person’s family of a reporting entity has significant influence over the reporting entityShri Lakshmi Niwas JhunjhunwalaShri Ravi JhunjhunwalaShri Mani Devi JhunjhunwalaShri Riju JhunjhunwalaShri Rita JhunjhunwalaShri Rishabh Jhunjhunwala
(iii) A person or a close member of that person’s family of a reporting entity is a member of the Key Managerial Personnel of the reporting entity or of a parent of the reporting entity.Shri Ravi Jhunjhunwala
Directors of the Company
Shri Shekhar AgarwalShri Riju JhunjhunwalaShri Brij Mohan Sharma (w.e.f. August 7, 2018)Shri Prakash Maheshwari (till March 31, 2018)Shri Arun Kumar ChuriwalShri Jagdish Chandra LaddhaDr. Kamal GuptaShri Dharmendar Nath DavarShri Priya Shankar DasguptaShri Amar Nath ChoudharyShri Deepak JainSmt. Geeta Mathur (till November 9, 2017)Smt. Archana Capoor (w.e.f. February 13, 2018)Shri Surendra Gupta Company Secretary
B (i) The entity and the reporting entity are members of the same group (which means that each parent, subsidiary and fellow subsidiary is related to the others)LNJ Skills & Rozgar Private Limited * SubsidiaryLNJ Institute of Skills & Technology Private Limited Subsidiary of LNJ Skills & Rozgar Private
Limited*The company was associate upto October 31, 2018 and thereafter it became subsidiary.
(ii) One entity is a subsidiary or an associate or a joint venture of the other entity (a subsidiary or an associate or a joint venture of a member of a group of which the other entity is a member)Bhillwara Energy Limited AssociateLNJ Power Venture Limited Ceased to be the Associate
w.e.f. April 1, 2018AD Hydro Power Limited Subsidiary of AssociateB G Wind Power Limited Subsidiary of AssociateBalephi Jalbidhyut Company Limited, Nepal Subsidiary of AssociateChango Yang Thang Hydro Power Limited Subsidiary of AssociateIndo Canadian Consultancy Services Private Limited Subsidiary of AssociateMalana Power Company Limited Subsidiary of AssociateNJC Hydro Power Limited Subsidiary of Associate
(iii) Associated and other entities are joint ventures of the same third party.N.A.
(iv) One Entity is a joint venture of a third party and the other entity is an associate of the third entityN.A.
(v) The entity is a post-employment benefit plan for the benefit of employees of either the reporting entity or an entity related to the reporting entity. If the reporting entity is itself such a plan, the sponsoring employers are also related to the reporting entityRSWM Limited Senior Executive Superannuation Fund Trust TrustRajasthan Spinning Gratuity Fund Trust TrustRajspin Employees Contributory Provident Fund Trust
(Table contd. to the next page)
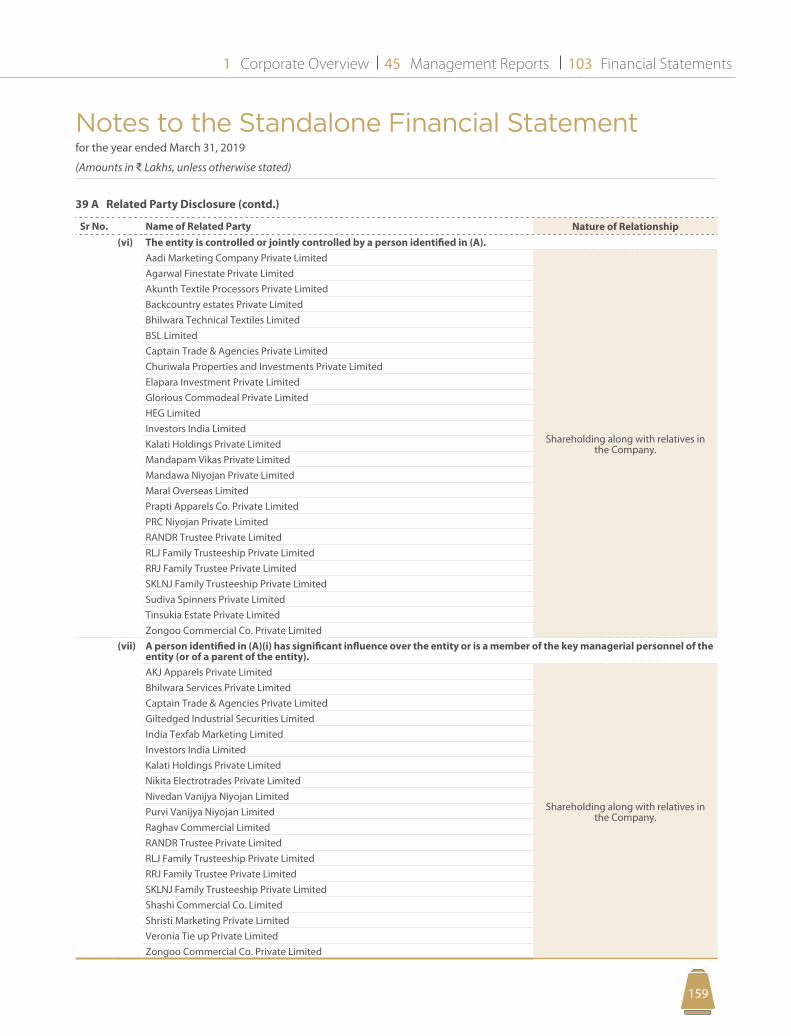
Notes to the Standalone Financial Statement for the year ended March 31, 2019
(Amounts in D Lakhs, unless otherwise stated)
Corporate Overview Management Reports Financial Statements1 45 103
159158
39 A Related Party Disclosure (contd.)
Sr No. Name of Related Party Nature of Relationship(vi) The entity is controlled or jointly controlled by a person identified in (A).
Aadi Marketing Company Private Limited
Shareholding along with relatives in the Company.
Agarwal Finestate Private LimitedAkunth Textile Processors Private LimitedBackcountry estates Private LimitedBhilwara Technical Textiles LimitedBSL LimitedCaptain Trade & Agencies Private LimitedChuriwala Properties and Investments Private LimitedElapara Investment Private LimitedGlorious Commodeal Private LimitedHEG LimitedInvestors India Limited Kalati Holdings Private LimitedMandapam Vikas Private LimitedMandawa Niyojan Private LimitedMaral Overseas LimitedPrapti Apparels Co. Private LimitedPRC Niyojan Private LimitedRANDR Trustee Private LimitedRLJ Family Trusteeship Private LimitedRRJ Family Trustee Private LimitedSKLNJ Family Trusteeship Private LimitedSudiva Spinners Private LimitedTinsukia Estate Private LimitedZongoo Commercial Co. Private Limited
(vii) A person identified in (A)(i) has significant influence over the entity or is a member of the key managerial personnel of the entity (or of a parent of the entity).AKJ Apparels Private Limited
Shareholding along with relatives in the Company.
Bhilwara Services Private LimitedCaptain Trade & Agencies Private LimitedGiltedged Industrial Securities LimitedIndia Texfab Marketing LimitedInvestors India LimitedKalati Holdings Private LimitedNikita Electrotrades Private LimitedNivedan Vanijya Niyojan LimitedPurvi Vanijya Niyojan LimitedRaghav Commercial LimitedRANDR Trustee Private LimitedRLJ Family Trusteeship Private LimitedRRJ Family Trustee Private LimitedSKLNJ Family Trusteeship Private LimitedShashi Commercial Co. LimitedShristi Marketing Private LimitedVeronia Tie up Private LimitedZongoo Commercial Co. Private Limited

Notes to the Standalone Financial Statement for the year ended March 31, 2019
(Amounts in D Lakhs, unless otherwise stated)
ANNUAL REPORT20 1819
161160
39 B Related Party Disclosure
Transaction Subsidiaries (Including their Subsidiaries) B-(i-iv)
Associates (Including Subsidiaries of Associates) B-(i-iv)
Key Managerial Personnel A-(i-iii)
A Person and enterprises over which any person described in B-(v-vii) is able to exercise significant influence over the reporting enterprise.
Year ended March 31,
2019
Year ended March 31,
2018
Year ended March 31,
2019
Year ended March 31,
2018
Year ended March 31,
2019
Year ended March 31,
2018
Year ended March 31,
2019
Year ended March 31,
2018(a) (b) (c) (d)
Sale of Finished Goods (including sales to BSL Ltd D5,522.00 Lakhs (Previous year D4,862.41 Lakhs)
5,741.60 4,927.13
Sale of Raw Material 82.33 81.38 Purchases of Raw Material & Finished Goods (including purchase from BSL Ltd D19.24 Lakhs (Previous year D649.73 Lakhs)
2,237.63 2,116.61
Sale of Stores Items - 12.22 Purchase of Stores Items 17.50 47.53 Rent Received 5.59 - 58.65 46.71 114.73 113.81 Rent Paid 231.54 - 324.15 - 44.83 58.65 Reimbursement of revenue expenditure received
47.12 51.24 113.43 105.97
Reimbursement of revenue expenditure made
189.17 - 111.54 11.95 44.49 16.45
Job Charges Received -including D431.35 Lakhs received from BSL Ltd (Previous year D 507.93 Lakhs)
431.35 536.50
Job Charges paid 3.14 2.85 Interest received - 345.18 129.60 8.34 Interest paid - - - 0.52 Purchase of Wind Power - 1,461.94 - - Sale of Equity Shares 2,982.26 - Dividend Received 782.71 293.78 Dividend Paid 59.65 376.52 Investment in Equity Shares of LNJ Skills & Rozgar Private Limited
230.00 - 100.00 750.00 50.00 -
RSWM Limited Senior Executive Superannuation Fund Trust
366.93 332.23
Rajasthan Spinning Gratuity Fund Trust
2.00 244.24
Rajspin Employees Contributory Provident Fund
177.51 167.88
Remuneration and other perquisites(a) Short-term employee benefits @
495.10 384.91
(b) Post-employment benefits 55.73 39.18 (c) Other long-term benefits - - (d) Termination benefits, and - - (e) Share-based payment. - - Directors' Sitting Fees 58.50 70.39
*The company was associate upto October 31, 2018 and thereafter become subsidiary.@Including remuneration amounting to D113.82 Lakhs paid to Managing Director and D24.04 Lakhs paid to ex-Executive Director for the year 2017-18 after approval of shareholders in A.G.M.
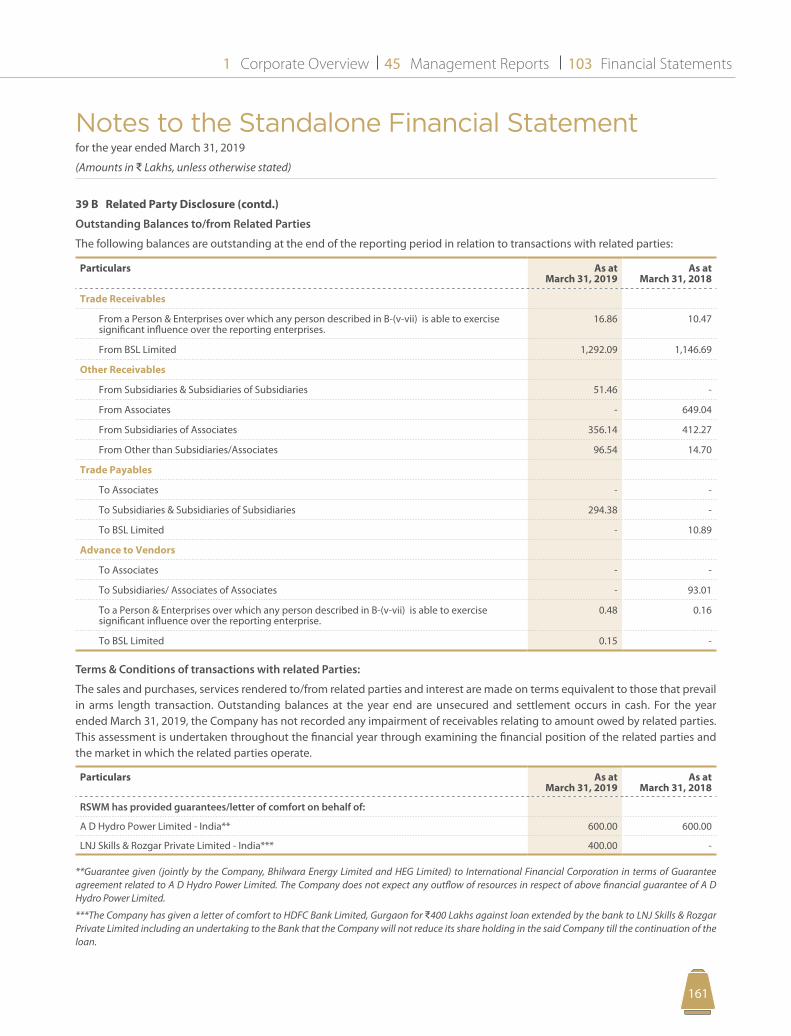
Notes to the Standalone Financial Statement for the year ended March 31, 2019
(Amounts in D Lakhs, unless otherwise stated)
Corporate Overview Management Reports Financial Statements1 45 103
161160
39 B Related Party Disclosure (contd.)
Outstanding Balances to/from Related Parties
The following balances are outstanding at the end of the reporting period in relation to transactions with related parties:
Particulars As at March 31, 2019
As at March 31, 2018
Trade Receivables
From a Person & Enterprises over which any person described in B-(v-vii) is able to exercise significant influence over the reporting enterprises.
16.86 10.47
From BSL Limited 1,292.09 1,146.69
Other Receivables
From Subsidiaries & Subsidiaries of Subsidiaries 51.46 -
From Associates - 649.04
From Subsidiaries of Associates 356.14 412.27
From Other than Subsidiaries/Associates 96.54 14.70
Trade Payables
To Associates - -
To Subsidiaries & Subsidiaries of Subsidiaries 294.38 -
To BSL Limited - 10.89
Advance to Vendors
To Associates - -
To Subsidiaries/ Associates of Associates - 93.01
To a Person & Enterprises over which any person described in B-(v-vii) is able to exercise significant influence over the reporting enterprise.
0.48 0.16
To BSL Limited 0.15 -
Terms & Conditions of transactions with related Parties:
The sales and purchases, services rendered to/from related parties and interest are made on terms equivalent to those that prevail in arms length transaction. Outstanding balances at the year end are unsecured and settlement occurs in cash. For the year ended March 31, 2019, the Company has not recorded any impairment of receivables relating to amount owed by related parties. This assessment is undertaken throughout the financial year through examining the financial position of the related parties and the market in which the related parties operate.
Particulars As at March 31, 2019
As at March 31, 2018
RSWM has provided guarantees/letter of comfort on behalf of:
A D Hydro Power Limited - India** 600.00 600.00
LNJ Skills & Rozgar Private Limited - India*** 400.00 -
**Guarantee given (jointly by the Company, Bhilwara Energy Limited and HEG Limited) to International Financial Corporation in terms of Guarantee agreement related to A D Hydro Power Limited. The Company does not expect any outflow of resources in respect of above financial guarantee of A D Hydro Power Limited.
***The Company has given a letter of comfort to HDFC Bank Limited, Gurgaon for D400 Lakhs against loan extended by the bank to LNJ Skills & Rozgar Private Limited including an undertaking to the Bank that the Company will not reduce its share holding in the said Company till the continuation of the loan.
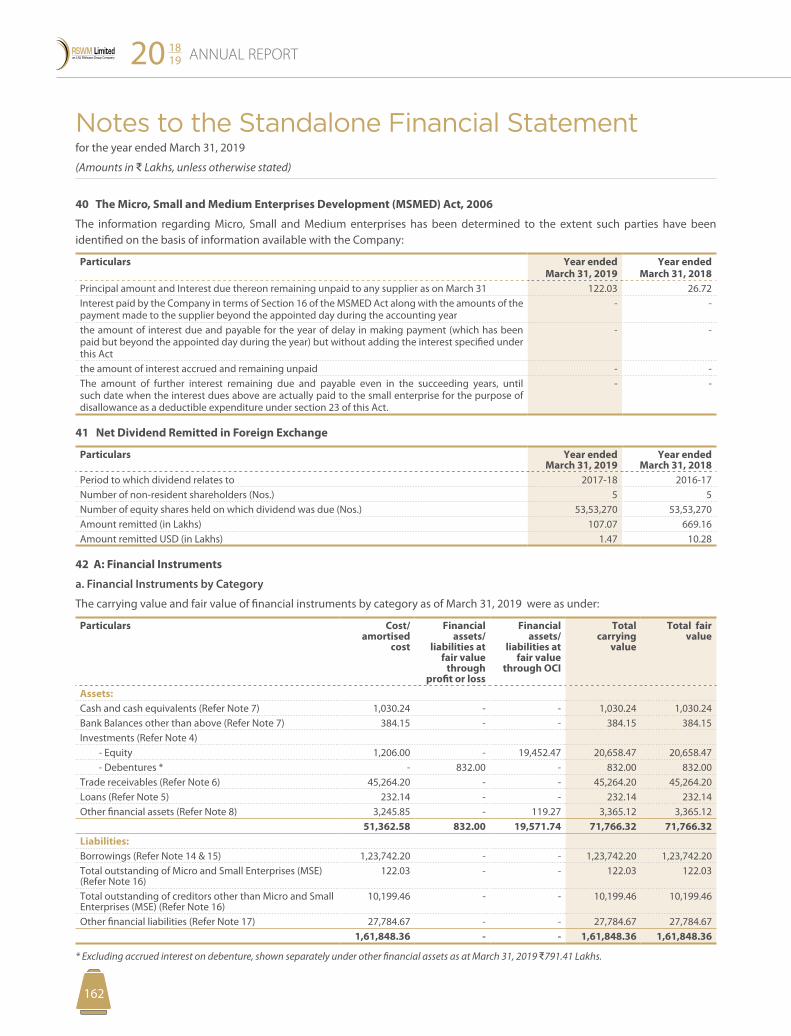
Notes to the Standalone Financial Statement for the year ended March 31, 2019
(Amounts in D Lakhs, unless otherwise stated)
ANNUAL REPORT20 1819
163162
40 The Micro, Small and Medium Enterprises Development (MSMED) Act, 2006
The information regarding Micro, Small and Medium enterprises has been determined to the extent such parties have been identified on the basis of information available with the Company:
Particulars Year ended March 31, 2019
Year ended March 31, 2018
Principal amount and Interest due thereon remaining unpaid to any supplier as on March 31 122.03 26.72 Interest paid by the Company in terms of Section 16 of the MSMED Act along with the amounts of the payment made to the supplier beyond the appointed day during the accounting year
- -
the amount of interest due and payable for the year of delay in making payment (which has been paid but beyond the appointed day during the year) but without adding the interest specified under this Act
- -
the amount of interest accrued and remaining unpaid - - The amount of further interest remaining due and payable even in the succeeding years, until such date when the interest dues above are actually paid to the small enterprise for the purpose of disallowance as a deductible expenditure under section 23 of this Act.
- -
41 Net Dividend Remitted in Foreign Exchange
Particulars Year ended March 31, 2019
Year ended March 31, 2018
Period to which dividend relates to 2017-18 2016-17Number of non-resident shareholders (Nos.) 5 5Number of equity shares held on which dividend was due (Nos.) 53,53,270 53,53,270 Amount remitted (in Lakhs) 107.07 669.16 Amount remitted USD (in Lakhs) 1.47 10.28
42 A: Financial Instruments
a. Financial Instruments by Category
The carrying value and fair value of financial instruments by category as of March 31, 2019 were as under:
Particulars Cost/amortised
cost
Financial assets/
liabilities at fair value
through profit or loss
Financial assets/
liabilities at fair value
through OCI
Total carrying
value
Total fair value
Assets:Cash and cash equivalents (Refer Note 7) 1,030.24 - - 1,030.24 1,030.24 Bank Balances other than above (Refer Note 7) 384.15 - - 384.15 384.15 Investments (Refer Note 4)
- Equity 1,206.00 - 19,452.47 20,658.47 20,658.47 - Debentures * - 832.00 - 832.00 832.00
Trade receivables (Refer Note 6) 45,264.20 - - 45,264.20 45,264.20 Loans (Refer Note 5) 232.14 - - 232.14 232.14 Other financial assets (Refer Note 8) 3,245.85 - 119.27 3,365.12 3,365.12
51,362.58 832.00 19,571.74 71,766.32 71,766.32 Liabilities:Borrowings (Refer Note 14 & 15) 1,23,742.20 - - 1,23,742.20 1,23,742.20 Total outstanding of Micro and Small Enterprises (MSE) (Refer Note 16)
122.03 - - 122.03 122.03
Total outstanding of creditors other than Micro and Small Enterprises (MSE) (Refer Note 16)
10,199.46 - - 10,199.46 10,199.46
Other financial liabilities (Refer Note 17) 27,784.67 - - 27,784.67 27,784.67 1,61,848.36 - - 1,61,848.36 1,61,848.36
* Excluding accrued interest on debenture, shown separately under other financial assets as at March 31, 2019 D791.41 Lakhs.
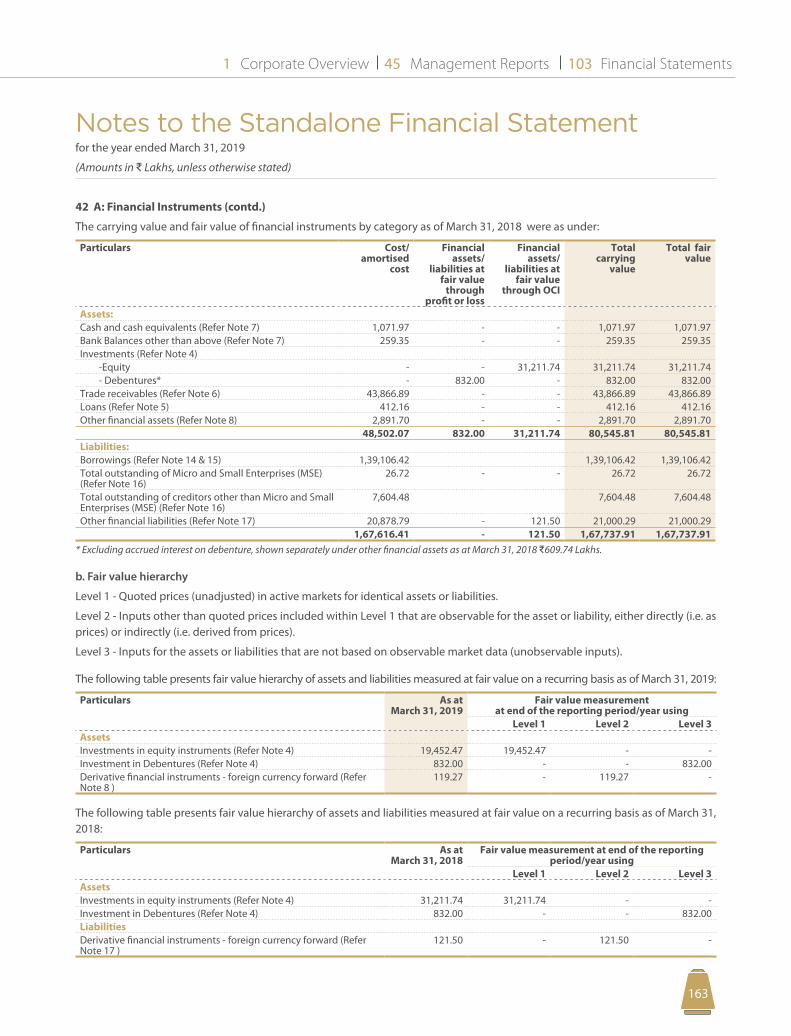
Notes to the Standalone Financial Statement for the year ended March 31, 2019
(Amounts in D Lakhs, unless otherwise stated)
Corporate Overview Management Reports Financial Statements1 45 103
163162
42 A: Financial Instruments (contd.)
The carrying value and fair value of financial instruments by category as of March 31, 2018 were as under:
Particulars Cost/amortised
cost
Financial assets/
liabilities at fair value
through profit or loss
Financial assets/
liabilities at fair value
through OCI
Total carrying
value
Total fair value
Assets:Cash and cash equivalents (Refer Note 7) 1,071.97 - - 1,071.97 1,071.97 Bank Balances other than above (Refer Note 7) 259.35 - - 259.35 259.35 Investments (Refer Note 4)
-Equity - - 31,211.74 31,211.74 31,211.74 - Debentures* - 832.00 - 832.00 832.00
Trade receivables (Refer Note 6) 43,866.89 - - 43,866.89 43,866.89 Loans (Refer Note 5) 412.16 - - 412.16 412.16 Other financial assets (Refer Note 8) 2,891.70 - - 2,891.70 2,891.70
48,502.07 832.00 31,211.74 80,545.81 80,545.81 Liabilities:Borrowings (Refer Note 14 & 15) 1,39,106.42 1,39,106.42 1,39,106.42 Total outstanding of Micro and Small Enterprises (MSE) (Refer Note 16)
26.72 - - 26.72 26.72
Total outstanding of creditors other than Micro and Small Enterprises (MSE) (Refer Note 16)
7,604.48 7,604.48 7,604.48
Other financial liabilities (Refer Note 17) 20,878.79 - 121.50 21,000.29 21,000.29 1,67,616.41 - 121.50 1,67,737.91 1,67,737.91
* Excluding accrued interest on debenture, shown separately under other financial assets as at March 31, 2018 D609.74 Lakhs.
b. Fair value hierarchy
Level 1 - Quoted prices (unadjusted) in active markets for identical assets or liabilities.
Level 2 - Inputs other than quoted prices included within Level 1 that are observable for the asset or liability, either directly (i.e. as prices) or indirectly (i.e. derived from prices).
Level 3 - Inputs for the assets or liabilities that are not based on observable market data (unobservable inputs).
The following table presents fair value hierarchy of assets and liabilities measured at fair value on a recurring basis as of March 31, 2019:
Particulars As at March 31, 2019
Fair value measurement at end of the reporting period/year using
Level 1 Level 2 Level 3AssetsInvestments in equity instruments (Refer Note 4) 19,452.47 19,452.47 - - Investment in Debentures (Refer Note 4) 832.00 - - 832.00 Derivative financial instruments - foreign currency forward (Refer Note 8 )
119.27 - 119.27 -
The following table presents fair value hierarchy of assets and liabilities measured at fair value on a recurring basis as of March 31, 2018:
Particulars As at March 31, 2018
Fair value measurement at end of the reporting period/year using
Level 1 Level 2 Level 3AssetsInvestments in equity instruments (Refer Note 4) 31,211.74 31,211.74 - - Investment in Debentures (Refer Note 4) 832.00 - - 832.00 LiabilitiesDerivative financial instruments - foreign currency forward (Refer Note 17 )
121.50 - 121.50 -
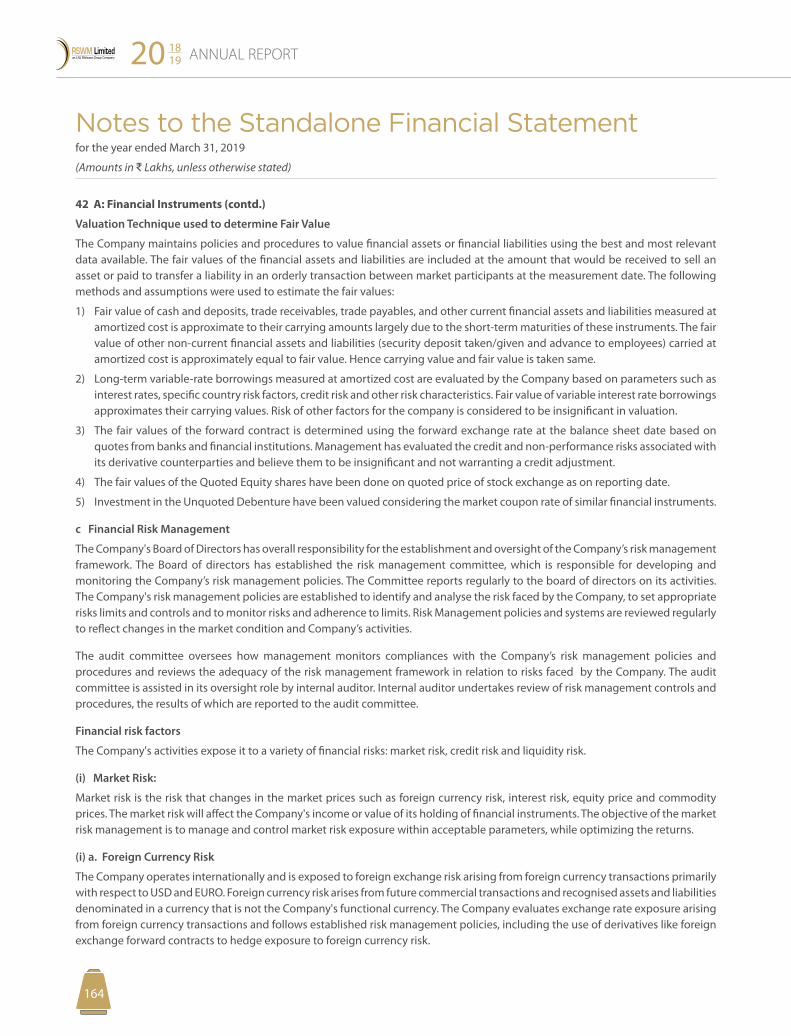
Notes to the Standalone Financial Statement for the year ended March 31, 2019
(Amounts in D Lakhs, unless otherwise stated)
ANNUAL REPORT20 1819
165164
42 A: Financial Instruments (contd.)
Valuation Technique used to determine Fair Value
The Company maintains policies and procedures to value financial assets or financial liabilities using the best and most relevant data available. The fair values of the financial assets and liabilities are included at the amount that would be received to sell an asset or paid to transfer a liability in an orderly transaction between market participants at the measurement date. The following methods and assumptions were used to estimate the fair values:
1) Fair value of cash and deposits, trade receivables, trade payables, and other current financial assets and liabilities measured at amortized cost is approximate to their carrying amounts largely due to the short-term maturities of these instruments. The fair value of other non-current financial assets and liabilities (security deposit taken/given and advance to employees) carried at amortized cost is approximately equal to fair value. Hence carrying value and fair value is taken same.
2) Long-term variable-rate borrowings measured at amortized cost are evaluated by the Company based on parameters such as interest rates, specific country risk factors, credit risk and other risk characteristics. Fair value of variable interest rate borrowings approximates their carrying values. Risk of other factors for the company is considered to be insignificant in valuation.
3) The fair values of the forward contract is determined using the forward exchange rate at the balance sheet date based on quotes from banks and financial institutions. Management has evaluated the credit and non-performance risks associated with its derivative counterparties and believe them to be insignificant and not warranting a credit adjustment.
4) The fair values of the Quoted Equity shares have been done on quoted price of stock exchange as on reporting date.
5) Investment in the Unquoted Debenture have been valued considering the market coupon rate of similar financial instruments.
c Financial Risk Management
The Company's Board of Directors has overall responsibility for the establishment and oversight of the Company’s risk management framework. The Board of directors has established the risk management committee, which is responsible for developing and monitoring the Company’s risk management policies. The Committee reports regularly to the board of directors on its activities. The Company's risk management policies are established to identify and analyse the risk faced by the Company, to set appropriate risks limits and controls and to monitor risks and adherence to limits. Risk Management policies and systems are reviewed regularly to reflect changes in the market condition and Company’s activities.
The audit committee oversees how management monitors compliances with the Company’s risk management policies and procedures and reviews the adequacy of the risk management framework in relation to risks faced by the Company. The audit committee is assisted in its oversight role by internal auditor. Internal auditor undertakes review of risk management controls and procedures, the results of which are reported to the audit committee.
Financial risk factors
The Company's activities expose it to a variety of financial risks: market risk, credit risk and liquidity risk.
(i) Market Risk:
Market risk is the risk that changes in the market prices such as foreign currency risk, interest risk, equity price and commodity prices. The market risk will affect the Company's income or value of its holding of financial instruments. The objective of the market risk management is to manage and control market risk exposure within acceptable parameters, while optimizing the returns.
(i) a. Foreign Currency Risk
The Company operates internationally and is exposed to foreign exchange risk arising from foreign currency transactions primarily with respect to USD and EURO. Foreign currency risk arises from future commercial transactions and recognised assets and liabilities denominated in a currency that is not the Company's functional currency. The Company evaluates exchange rate exposure arising from foreign currency transactions and follows established risk management policies, including the use of derivatives like foreign exchange forward contracts to hedge exposure to foreign currency risk.
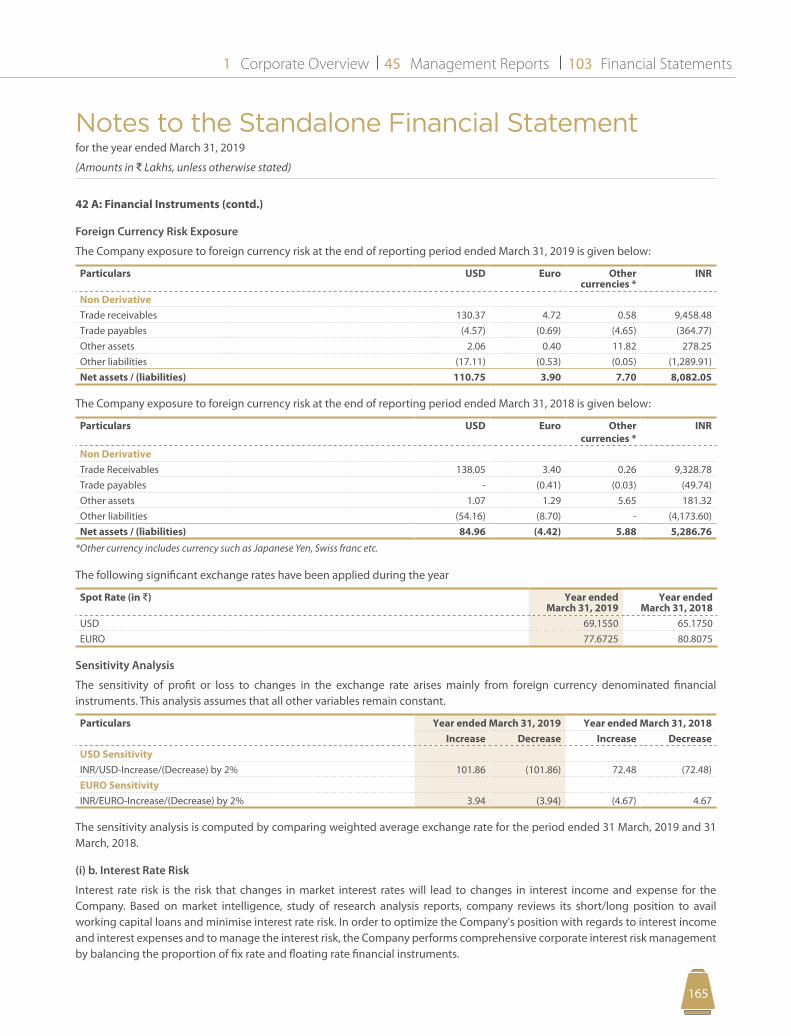
Notes to the Standalone Financial Statement for the year ended March 31, 2019
(Amounts in D Lakhs, unless otherwise stated)
Corporate Overview Management Reports Financial Statements1 45 103
165164
42 A: Financial Instruments (contd.)
Foreign Currency Risk Exposure
The Company exposure to foreign currency risk at the end of reporting period ended March 31, 2019 is given below:
Particulars USD Euro Other currencies *
INR
Non DerivativeTrade receivables 130.37 4.72 0.58 9,458.48 Trade payables (4.57) (0.69) (4.65) (364.77)Other assets 2.06 0.40 11.82 278.25 Other liabilities (17.11) (0.53) (0.05) (1,289.91)Net assets / (liabilities) 110.75 3.90 7.70 8,082.05
The Company exposure to foreign currency risk at the end of reporting period ended March 31, 2018 is given below:
Particulars USD Euro Other currencies *
INR
Non DerivativeTrade Receivables 138.05 3.40 0.26 9,328.78 Trade payables - (0.41) (0.03) (49.74)Other assets 1.07 1.29 5.65 181.32 Other liabilities (54.16) (8.70) - (4,173.60)Net assets / (liabilities) 84.96 (4.42) 5.88 5,286.76
*Other currency includes currency such as Japanese Yen, Swiss franc etc.
The following significant exchange rates have been applied during the year
Spot Rate (in D) Year ended March 31, 2019
Year ended March 31, 2018
USD 69.1550 65.1750 EURO 77.6725 80.8075
Sensitivity Analysis
The sensitivity of profit or loss to changes in the exchange rate arises mainly from foreign currency denominated financial instruments. This analysis assumes that all other variables remain constant.
Particulars Year ended March 31, 2019 Year ended March 31, 2018Increase Decrease Increase Decrease
USD Sensitivity INR/USD-Increase/(Decrease) by 2% 101.86 (101.86) 72.48 (72.48)EURO Sensitivity INR/EURO-Increase/(Decrease) by 2% 3.94 (3.94) (4.67) 4.67
The sensitivity analysis is computed by comparing weighted average exchange rate for the period ended 31 March, 2019 and 31 March, 2018.
(i) b. Interest Rate Risk
Interest rate risk is the risk that changes in market interest rates will lead to changes in interest income and expense for the Company. Based on market intelligence, study of research analysis reports, company reviews its short/long position to avail working capital loans and minimise interest rate risk. In order to optimize the Company's position with regards to interest income and interest expenses and to manage the interest risk, the Company performs comprehensive corporate interest risk management by balancing the proportion of fix rate and floating rate financial instruments.
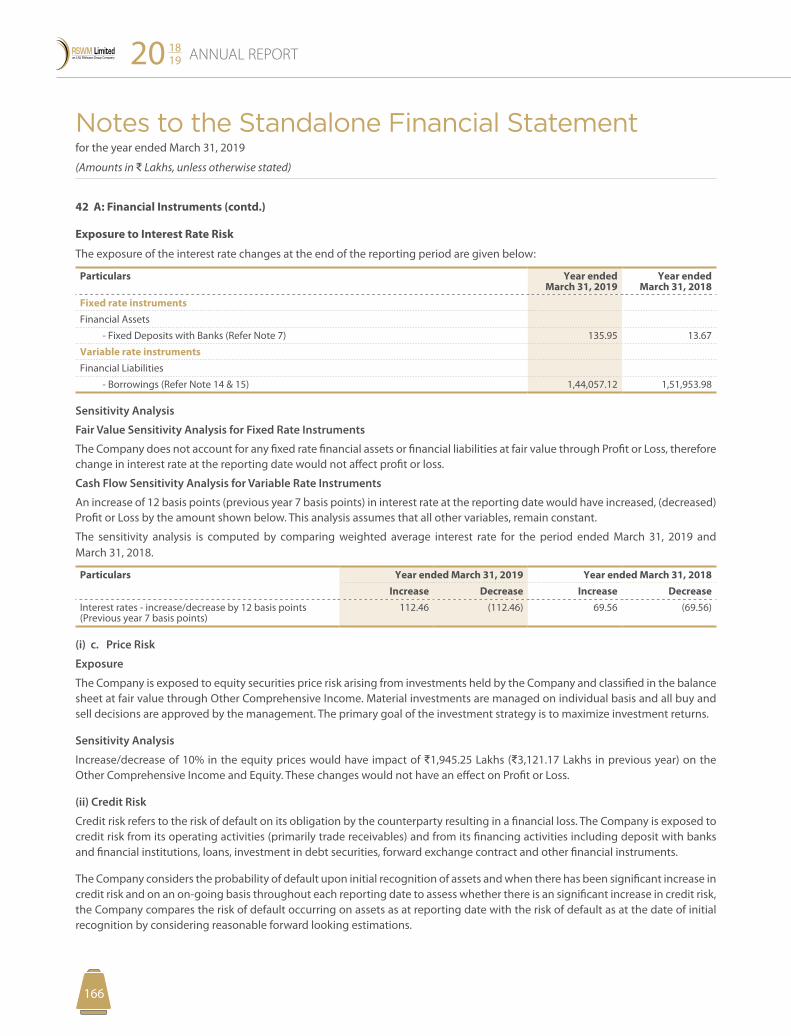
Notes to the Standalone Financial Statement for the year ended March 31, 2019
(Amounts in D Lakhs, unless otherwise stated)
ANNUAL REPORT20 1819
167166
42 A: Financial Instruments (contd.)
Exposure to Interest Rate Risk
The exposure of the interest rate changes at the end of the reporting period are given below:
Particulars Year ended March 31, 2019
Year ended March 31, 2018
Fixed rate instrumentsFinancial Assets
- Fixed Deposits with Banks (Refer Note 7) 135.95 13.67
Variable rate instrumentsFinancial Liabilities
- Borrowings (Refer Note 14 & 15) 1,44,057.12 1,51,953.98
Sensitivity Analysis
Fair Value Sensitivity Analysis for Fixed Rate Instruments
The Company does not account for any fixed rate financial assets or financial liabilities at fair value through Profit or Loss, therefore change in interest rate at the reporting date would not affect profit or loss.
Cash Flow Sensitivity Analysis for Variable Rate Instruments
An increase of 12 basis points (previous year 7 basis points) in interest rate at the reporting date would have increased, (decreased) Profit or Loss by the amount shown below. This analysis assumes that all other variables, remain constant.
The sensitivity analysis is computed by comparing weighted average interest rate for the period ended March 31, 2019 and March 31, 2018.
Particulars Year ended March 31, 2019 Year ended March 31, 2018Increase Decrease Increase Decrease
Interest rates - increase/decrease by 12 basis points (Previous year 7 basis points)
112.46 (112.46) 69.56 (69.56)
(i) c. Price Risk
Exposure
The Company is exposed to equity securities price risk arising from investments held by the Company and classified in the balance sheet at fair value through Other Comprehensive Income. Material investments are managed on individual basis and all buy and sell decisions are approved by the management. The primary goal of the investment strategy is to maximize investment returns.
Sensitivity Analysis
Increase/decrease of 10% in the equity prices would have impact of D1,945.25 Lakhs (D3,121.17 Lakhs in previous year) on the Other Comprehensive Income and Equity. These changes would not have an effect on Profit or Loss.
(ii) Credit Risk
Credit risk refers to the risk of default on its obligation by the counterparty resulting in a financial loss. The Company is exposed to credit risk from its operating activities (primarily trade receivables) and from its financing activities including deposit with banks and financial institutions, loans, investment in debt securities, forward exchange contract and other financial instruments.
The Company considers the probability of default upon initial recognition of assets and when there has been significant increase in credit risk and on an on-going basis throughout each reporting date to assess whether there is an significant increase in credit risk, the Company compares the risk of default occurring on assets as at reporting date with the risk of default as at the date of initial recognition by considering reasonable forward looking estimations.
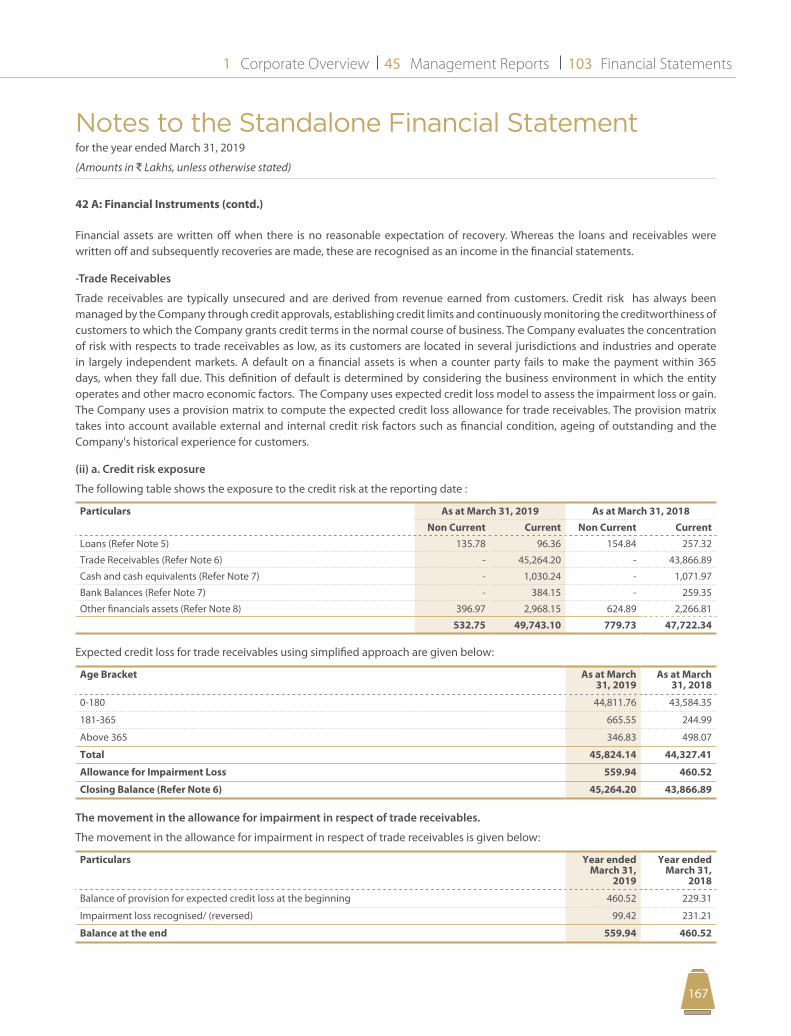
Notes to the Standalone Financial Statement for the year ended March 31, 2019
(Amounts in D Lakhs, unless otherwise stated)
Corporate Overview Management Reports Financial Statements1 45 103
167166
Financial assets are written off when there is no reasonable expectation of recovery. Whereas the loans and receivables were written off and subsequently recoveries are made, these are recognised as an income in the financial statements.
-Trade Receivables
Trade receivables are typically unsecured and are derived from revenue earned from customers. Credit risk has always been managed by the Company through credit approvals, establishing credit limits and continuously monitoring the creditworthiness of customers to which the Company grants credit terms in the normal course of business. The Company evaluates the concentration of risk with respects to trade receivables as low, as its customers are located in several jurisdictions and industries and operate in largely independent markets. A default on a financial assets is when a counter party fails to make the payment within 365 days, when they fall due. This definition of default is determined by considering the business environment in which the entity operates and other macro economic factors. The Company uses expected credit loss model to assess the impairment loss or gain. The Company uses a provision matrix to compute the expected credit loss allowance for trade receivables. The provision matrix takes into account available external and internal credit risk factors such as financial condition, ageing of outstanding and the Company's historical experience for customers.
(ii) a. Credit risk exposure
The following table shows the exposure to the credit risk at the reporting date :
Particulars As at March 31, 2019 As at March 31, 2018Non Current Current Non Current Current
Loans (Refer Note 5) 135.78 96.36 154.84 257.32
Trade Receivables (Refer Note 6) - 45,264.20 - 43,866.89
Cash and cash equivalents (Refer Note 7) - 1,030.24 - 1,071.97
Bank Balances (Refer Note 7) - 384.15 - 259.35
Other financials assets (Refer Note 8) 396.97 2,968.15 624.89 2,266.81
532.75 49,743.10 779.73 47,722.34
Expected credit loss for trade receivables using simplified approach are given below:
Age Bracket As at March 31, 2019
As at March 31, 2018
0-180 44,811.76 43,584.35
181-365 665.55 244.99
Above 365 346.83 498.07
Total 45,824.14 44,327.41
Allowance for Impairment Loss 559.94 460.52
Closing Balance (Refer Note 6) 45,264.20 43,866.89
The movement in the allowance for impairment in respect of trade receivables.
The movement in the allowance for impairment in respect of trade receivables is given below:
Particulars Year ended March 31,
2019
Year ended March 31,
2018
Balance of provision for expected credit loss at the beginning 460.52 229.31
Impairment loss recognised/ (reversed) 99.42 231.21
Balance at the end 559.94 460.52
42 A: Financial Instruments (contd.)
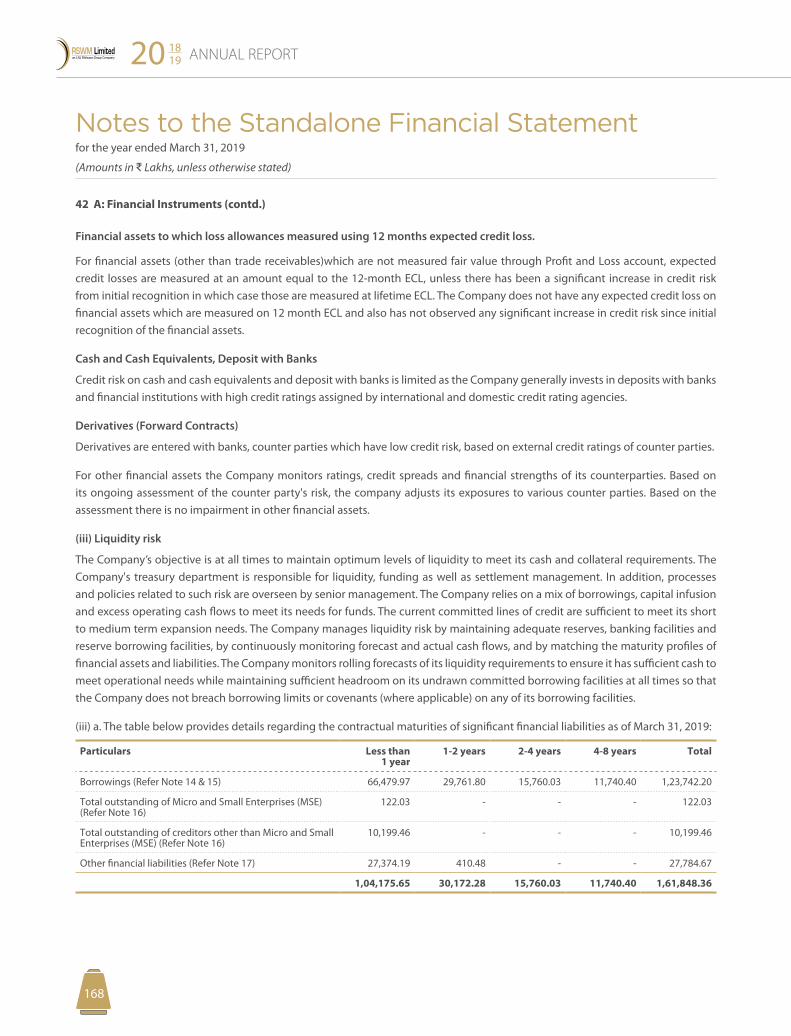
Notes to the Standalone Financial Statement for the year ended March 31, 2019
(Amounts in D Lakhs, unless otherwise stated)
ANNUAL REPORT20 1819
169168
Financial assets to which loss allowances measured using 12 months expected credit loss.
For financial assets (other than trade receivables)which are not measured fair value through Profit and Loss account, expected credit losses are measured at an amount equal to the 12-month ECL, unless there has been a significant increase in credit risk from initial recognition in which case those are measured at lifetime ECL. The Company does not have any expected credit loss on financial assets which are measured on 12 month ECL and also has not observed any significant increase in credit risk since initial recognition of the financial assets.
Cash and Cash Equivalents, Deposit with Banks
Credit risk on cash and cash equivalents and deposit with banks is limited as the Company generally invests in deposits with banks and financial institutions with high credit ratings assigned by international and domestic credit rating agencies.
Derivatives (Forward Contracts)
Derivatives are entered with banks, counter parties which have low credit risk, based on external credit ratings of counter parties.
For other financial assets the Company monitors ratings, credit spreads and financial strengths of its counterparties. Based on its ongoing assessment of the counter party's risk, the company adjusts its exposures to various counter parties. Based on the assessment there is no impairment in other financial assets.
(iii) Liquidity risk
The Company’s objective is at all times to maintain optimum levels of liquidity to meet its cash and collateral requirements. The Company's treasury department is responsible for liquidity, funding as well as settlement management. In addition, processes and policies related to such risk are overseen by senior management. The Company relies on a mix of borrowings, capital infusion and excess operating cash flows to meet its needs for funds. The current committed lines of credit are sufficient to meet its short to medium term expansion needs. The Company manages liquidity risk by maintaining adequate reserves, banking facilities and reserve borrowing facilities, by continuously monitoring forecast and actual cash flows, and by matching the maturity profiles of financial assets and liabilities. The Company monitors rolling forecasts of its liquidity requirements to ensure it has sufficient cash to meet operational needs while maintaining sufficient headroom on its undrawn committed borrowing facilities at all times so that the Company does not breach borrowing limits or covenants (where applicable) on any of its borrowing facilities.
(iii) a. The table below provides details regarding the contractual maturities of significant financial liabilities as of March 31, 2019:
Particulars Less than 1 year
1-2 years 2-4 years 4-8 years Total
Borrowings (Refer Note 14 & 15) 66,479.97 29,761.80 15,760.03 11,740.40 1,23,742.20
Total outstanding of Micro and Small Enterprises (MSE) (Refer Note 16)
122.03 - - - 122.03
Total outstanding of creditors other than Micro and Small Enterprises (MSE) (Refer Note 16)
10,199.46 - - - 10,199.46
Other financial liabilities (Refer Note 17) 27,374.19 410.48 - - 27,784.67
1,04,175.65 30,172.28 15,760.03 11,740.40 1,61,848.36
42 A: Financial Instruments (contd.)
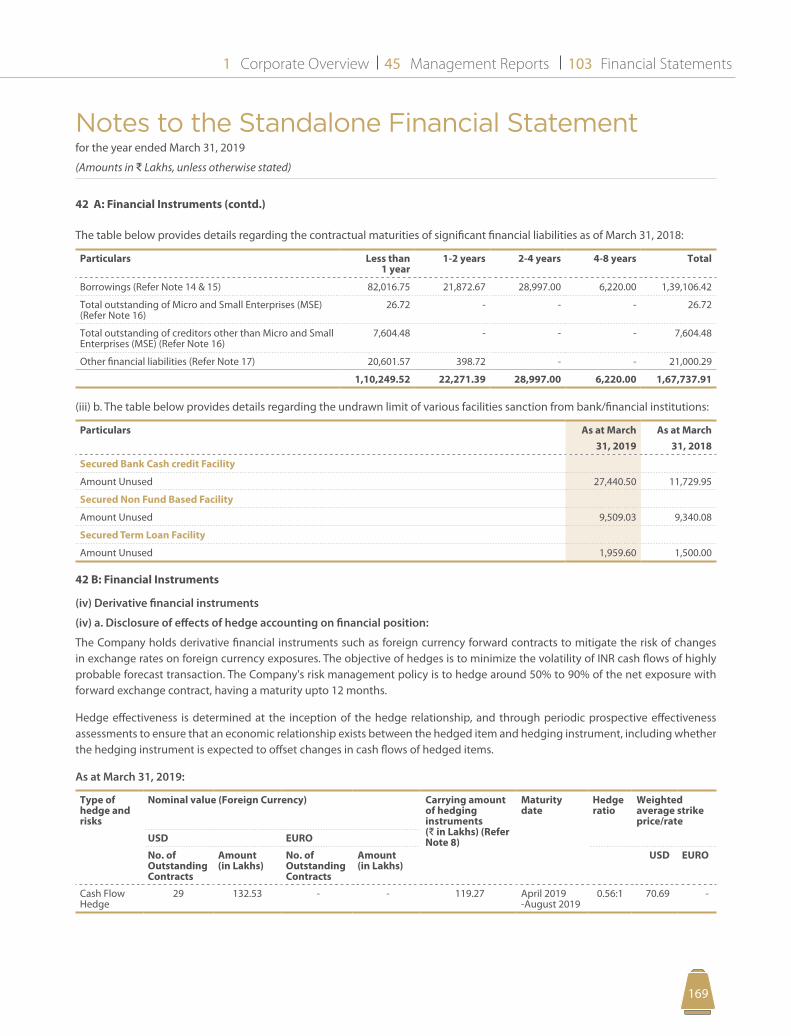
Notes to the Standalone Financial Statement for the year ended March 31, 2019
(Amounts in D Lakhs, unless otherwise stated)
Corporate Overview Management Reports Financial Statements1 45 103
169168
42 A: Financial Instruments (contd.)
The table below provides details regarding the contractual maturities of significant financial liabilities as of March 31, 2018:
Particulars Less than 1 year
1-2 years 2-4 years 4-8 years Total
Borrowings (Refer Note 14 & 15) 82,016.75 21,872.67 28,997.00 6,220.00 1,39,106.42
Total outstanding of Micro and Small Enterprises (MSE) (Refer Note 16)
26.72 - - - 26.72
Total outstanding of creditors other than Micro and Small Enterprises (MSE) (Refer Note 16)
7,604.48 - - - 7,604.48
Other financial liabilities (Refer Note 17) 20,601.57 398.72 - - 21,000.29
1,10,249.52 22,271.39 28,997.00 6,220.00 1,67,737.91
(iii) b. The table below provides details regarding the undrawn limit of various facilities sanction from bank/financial institutions:
Particulars As at March 31, 2019
As at March 31, 2018
Secured Bank Cash credit Facility
Amount Unused 27,440.50 11,729.95
Secured Non Fund Based Facility
Amount Unused 9,509.03 9,340.08
Secured Term Loan Facility
Amount Unused 1,959.60 1,500.00
42 B: Financial Instruments
(iv) Derivative financial instruments
(iv) a. Disclosure of effects of hedge accounting on financial position:
The Company holds derivative financial instruments such as foreign currency forward contracts to mitigate the risk of changes in exchange rates on foreign currency exposures. The objective of hedges is to minimize the volatility of INR cash flows of highly probable forecast transaction. The Company's risk management policy is to hedge around 50% to 90% of the net exposure with forward exchange contract, having a maturity upto 12 months.
Hedge effectiveness is determined at the inception of the hedge relationship, and through periodic prospective effectiveness assessments to ensure that an economic relationship exists between the hedged item and hedging instrument, including whether the hedging instrument is expected to offset changes in cash flows of hedged items.
As at March 31, 2019:
Type of hedge and risks
Nominal value (Foreign Currency) Carrying amount of hedging instruments (D in Lakhs) (Refer Note 8)
Maturity date
Hedge ratio
Weighted average strike price/rate
USD EURO
No. of Outstanding Contracts
Amount (in Lakhs)
No. of Outstanding Contracts
Amount (in Lakhs)
USD EURO
Cash Flow Hedge
29 132.53 - - 119.27 April 2019 -August 2019
0.56:1 70.69 -
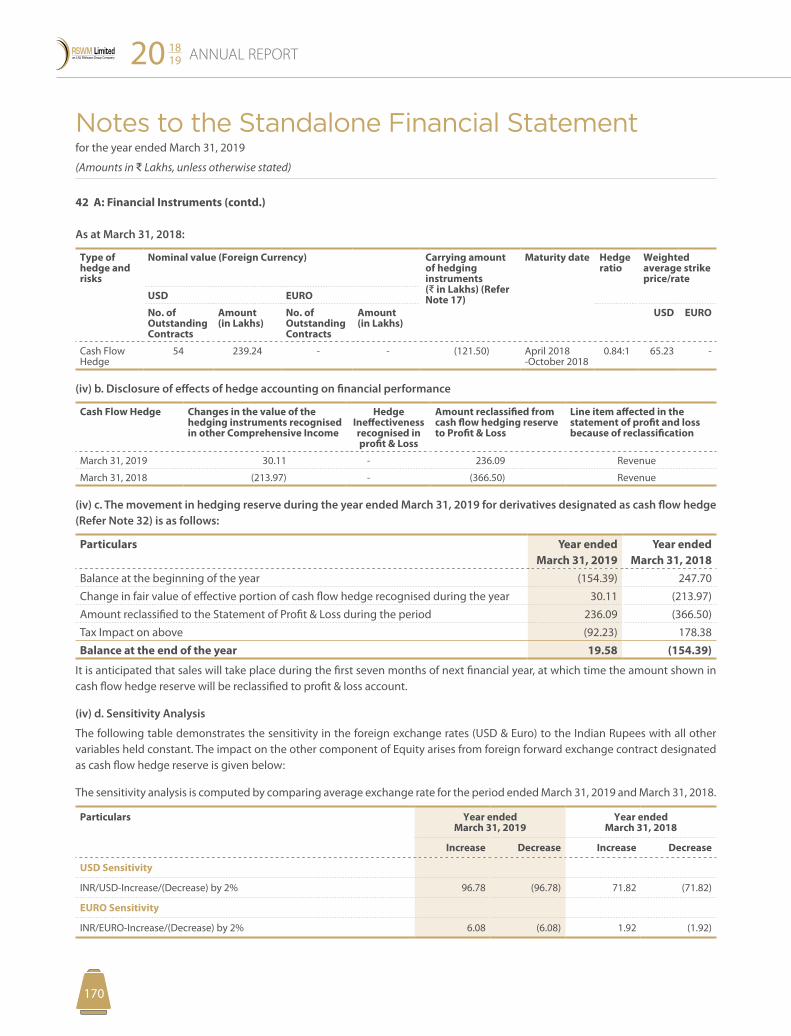
Notes to the Standalone Financial Statement for the year ended March 31, 2019
(Amounts in D Lakhs, unless otherwise stated)
ANNUAL REPORT20 1819
171170
As at March 31, 2018:
Type of hedge and risks
Nominal value (Foreign Currency) Carrying amount of hedging instruments (D in Lakhs) (Refer Note 17)
Maturity date Hedge ratio
Weighted average strike price/rate
USD EURO
No. of Outstanding Contracts
Amount (in Lakhs)
No. of Outstanding Contracts
Amount (in Lakhs)
USD EURO
Cash Flow Hedge
54 239.24 - - (121.50) April 2018 -October 2018
0.84:1 65.23 -
(iv) b. Disclosure of effects of hedge accounting on financial performance
Cash Flow Hedge Changes in the value of the hedging instruments recognised in other Comprehensive Income
Hedge Ineffectiveness recognised in profit & Loss
Amount reclassified from cash flow hedging reserve to Profit & Loss
Line item affected in the statement of profit and loss because of reclassification
March 31, 2019 30.11 - 236.09 Revenue
March 31, 2018 (213.97) - (366.50) Revenue
(iv) c. The movement in hedging reserve during the year ended March 31, 2019 for derivatives designated as cash flow hedge (Refer Note 32) is as follows:
Particulars Year ended March 31, 2019
Year ended March 31, 2018
Balance at the beginning of the year (154.39) 247.70
Change in fair value of effective portion of cash flow hedge recognised during the year 30.11 (213.97)
Amount reclassified to the Statement of Profit & Loss during the period 236.09 (366.50)
Tax Impact on above (92.23) 178.38
Balance at the end of the year 19.58 (154.39)
It is anticipated that sales will take place during the first seven months of next financial year, at which time the amount shown in cash flow hedge reserve will be reclassified to profit & loss account.
(iv) d. Sensitivity Analysis
The following table demonstrates the sensitivity in the foreign exchange rates (USD & Euro) to the Indian Rupees with all other variables held constant. The impact on the other component of Equity arises from foreign forward exchange contract designated as cash flow hedge reserve is given below:
The sensitivity analysis is computed by comparing average exchange rate for the period ended March 31, 2019 and March 31, 2018.
Particulars Year ended March 31, 2019
Year ended March 31, 2018
Increase Decrease Increase Decrease
USD Sensitivity
INR/USD-Increase/(Decrease) by 2% 96.78 (96.78) 71.82 (71.82)
EURO Sensitivity
INR/EURO-Increase/(Decrease) by 2% 6.08 (6.08) 1.92 (1.92)
42 A: Financial Instruments (contd.)
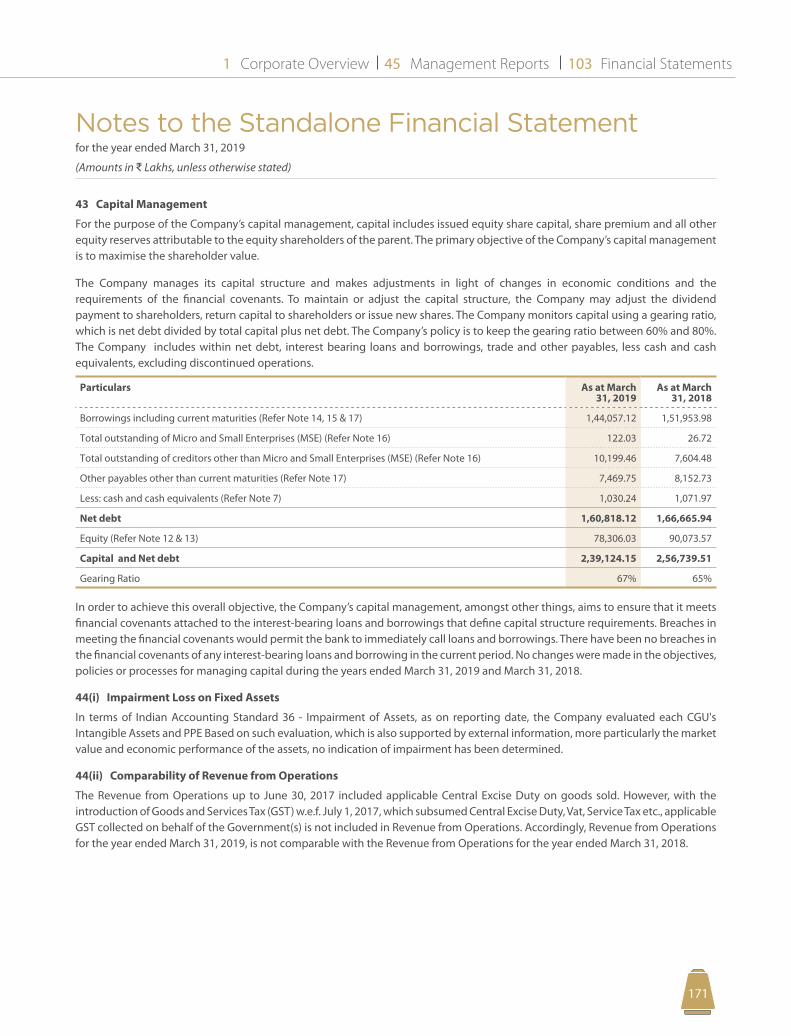
Notes to the Standalone Financial Statement for the year ended March 31, 2019
(Amounts in D Lakhs, unless otherwise stated)
Corporate Overview Management Reports Financial Statements1 45 103
171170
43 Capital Management
For the purpose of the Company’s capital management, capital includes issued equity share capital, share premium and all other equity reserves attributable to the equity shareholders of the parent. The primary objective of the Company’s capital management is to maximise the shareholder value.
The Company manages its capital structure and makes adjustments in light of changes in economic conditions and the requirements of the financial covenants. To maintain or adjust the capital structure, the Company may adjust the dividend payment to shareholders, return capital to shareholders or issue new shares. The Company monitors capital using a gearing ratio, which is net debt divided by total capital plus net debt. The Company’s policy is to keep the gearing ratio between 60% and 80%. The Company includes within net debt, interest bearing loans and borrowings, trade and other payables, less cash and cash equivalents, excluding discontinued operations.
Particulars As at March 31, 2019
As at March 31, 2018
Borrowings including current maturities (Refer Note 14, 15 & 17) 1,44,057.12 1,51,953.98
Total outstanding of Micro and Small Enterprises (MSE) (Refer Note 16) 122.03 26.72
Total outstanding of creditors other than Micro and Small Enterprises (MSE) (Refer Note 16) 10,199.46 7,604.48
Other payables other than current maturities (Refer Note 17) 7,469.75 8,152.73
Less: cash and cash equivalents (Refer Note 7) 1,030.24 1,071.97
Net debt 1,60,818.12 1,66,665.94
Equity (Refer Note 12 & 13) 78,306.03 90,073.57
Capital and Net debt 2,39,124.15 2,56,739.51
Gearing Ratio 67% 65%
In order to achieve this overall objective, the Company’s capital management, amongst other things, aims to ensure that it meets financial covenants attached to the interest-bearing loans and borrowings that define capital structure requirements. Breaches in meeting the financial covenants would permit the bank to immediately call loans and borrowings. There have been no breaches in the financial covenants of any interest-bearing loans and borrowing in the current period. No changes were made in the objectives, policies or processes for managing capital during the years ended March 31, 2019 and March 31, 2018.
44(i) Impairment Loss on Fixed Assets
In terms of Indian Accounting Standard 36 - Impairment of Assets, as on reporting date, the Company evaluated each CGU's Intangible Assets and PPE Based on such evaluation, which is also supported by external information, more particularly the market value and economic performance of the assets, no indication of impairment has been determined.
44(ii) Comparability of Revenue from Operations
The Revenue from Operations up to June 30, 2017 included applicable Central Excise Duty on goods sold. However, with the introduction of Goods and Services Tax (GST) w.e.f. July 1, 2017, which subsumed Central Excise Duty, Vat, Service Tax etc., applicable GST collected on behalf of the Government(s) is not included in Revenue from Operations. Accordingly, Revenue from Operations for the year ended March 31, 2019, is not comparable with the Revenue from Operations for the year ended March 31, 2018.
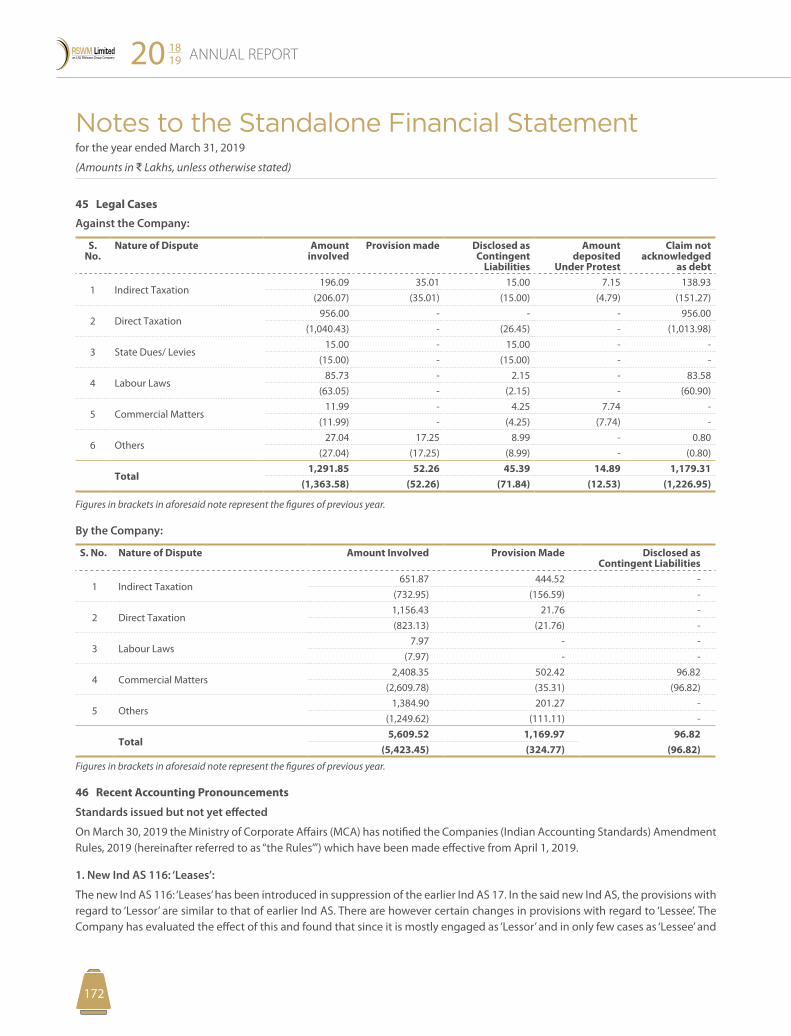
Notes to the Standalone Financial Statement for the year ended March 31, 2019
(Amounts in D Lakhs, unless otherwise stated)
ANNUAL REPORT20 1819
173172
45 Legal Cases
Against the Company:
S. No.
Nature of Dispute Amount involved
Provision made Disclosed as Contingent
Liabilities
Amount deposited
Under Protest
Claim not acknowledged
as debt
1 Indirect Taxation 196.09 35.01 15.00 7.15 138.93
(206.07) (35.01) (15.00) (4.79) (151.27)
2 Direct Taxation 956.00 - - - 956.00
(1,040.43) - (26.45) - (1,013.98)
3 State Dues/ Levies 15.00 - 15.00 - -
(15.00) - (15.00) - -
4 Labour Laws 85.73 - 2.15 - 83.58
(63.05) - (2.15) - (60.90)
5 Commercial Matters 11.99 - 4.25 7.74 -
(11.99) - (4.25) (7.74) -
6 Others 27.04 17.25 8.99 - 0.80
(27.04) (17.25) (8.99) - (0.80)
Total 1,291.85 52.26 45.39 14.89 1,179.31
(1,363.58) (52.26) (71.84) (12.53) (1,226.95)
Figures in brackets in aforesaid note represent the figures of previous year.
By the Company:
S. No. Nature of Dispute Amount Involved Provision Made Disclosed as Contingent Liabilities
1 Indirect Taxation 651.87 444.52 -
(732.95) (156.59) -
2 Direct Taxation 1,156.43 21.76 - (823.13) (21.76) -
3 Labour Laws 7.97 - -
(7.97) - -
4 Commercial Matters 2,408.35 502.42 96.82
(2,609.78) (35.31) (96.82)
5 Others 1,384.90 201.27 -
(1,249.62) (111.11) -
Total 5,609.52 1,169.97 96.82
(5,423.45) (324.77) (96.82)
Figures in brackets in aforesaid note represent the figures of previous year.
46 Recent Accounting Pronouncements
Standards issued but not yet effected
On March 30, 2019 the Ministry of Corporate Affairs (MCA) has notified the Companies (Indian Accounting Standards) Amendment Rules, 2019 (hereinafter referred to as “the Rules’”) which have been made effective from April 1, 2019.
1. New Ind AS 116: ‘Leases’:
The new Ind AS 116: ‘Leases’ has been introduced in suppression of the earlier Ind AS 17. In the said new Ind AS, the provisions with regard to ‘Lessor’ are similar to that of earlier Ind AS. There are however certain changes in provisions with regard to ‘Lessee’. The Company has evaluated the effect of this and found that since it is mostly engaged as ‘Lessor’ and in only few cases as ‘Lessee’ and
Notes to the Standalone Financial Statement for the year ended March 31, 2019
(Amounts in D Lakhs, unless otherwise stated)
Corporate Overview Management Reports Financial Statements1 45 103
173172
the leases in those cases are for short term having low value of assets, the impact of the new Ind AS 116 shall not have any material impact on its financial statements.
2. Amendment to Ind AS 109: ‘Financial Instruments’:
The amendment pertains to classification of financial instruments with feature of prepayment with negative compensation, which permits the holder or the borrower to make the prepayment and at the same time permits the lender or the issuer to put the instrument for repayment before the holder or borrower for making its payment before its maturity at an amount less than unpaid amount of principal and interest. Such instruments can be measured at amortised cost or at fair value through the statement of profit and loss or other comprehensive income by lender or issuer. The Company has evaluated the effect of the said amendment and found that since it is not dealing in such financial instruments, there will not be any impact of this amendment on its financial statements.
3. Amendment to Ind AS 19: ‘Employee Benefits’:
The amendment relates to measurement and disclosure of effects of plan amendment, curtailment and settlement. When an entity determines the past service cost at the time of plan amendment or curtailment, it shall re-measure the amount of net defined benefit liability/asset using the current value of plan assets and current actuarial assumptions which should reflect the benefits offered under the plan and plan assets before and after the plan amendment, curtailment and settlement. The Company has evaluated the effect of the said amendment and found that there will not be any material impact of this amendment on its financial statements.
4. Amendment to Ind AS 103: ‘Business Combinations’:
The amendment relates to relates to provide additional guidance in case of party to the joint operation, achieved control over the joint operation. Such transaction is required to be accounted like the business combination achieved in stages. The Company has evaluated the effect of the said amendment and found that there will not be any material impact of this amendment on its financial statements.
5. Amendment to Ind AS 111: ‘Joint Arrangements’:
As per the said amendment, a party participating in a joint operation but does not have joint control, shall not re-measure its previously held interest in the joint operation, which constitutes a business, while attaining the joint control over the joint operation, on acquisition of additional interest or otherwise. The Company has evaluated the effect of the said amendment and found that there will not be any material impact of this amendment on its financial statements.
6. Amendment to Ind AS 28: ‘Investments in Associates and Joint Ventures’:
The said amendment clarifies that Ind AS 109 should be applied to the financial instruments, including long-term interests in associates and joint venture, that, in substance, form part of an entity's net investment in associate or joint venture, to which the equity method is not applied. The Company has evaluated the effect of the said amendment and found that since the company already applies equity method for investments made in associates and joint ventures, this amendment shall not have any impact on its financial statements.
7. Amendment to Ind AS 23: ‘Borrowing Costs’:
The said amendment clarifies that the borrowing cost applicable to borrowing made specifically for obtaining a qualifying asset, shall be excluded while determining the general capitalization rate until substantially all the activities necessary make such specific asset useful for the intended purpose or its sale are completed. The Company has evaluated the effect of the said amendment and found that there will not be any material impact of this amendment on its financial statements.
46 Recent Accounting Pronouncements (Contd.)
Notes to the Standalone Financial Statement for the year ended March 31, 2019
(Amounts in D Lakhs, unless otherwise stated)
ANNUAL REPORT20 1819
PB174
8. Amendment to Ind AS 12: ‘Income Taxes’:
The first amendment relates to creation of a corresponding liability for payment of Dividend Distribution Tax (DDT) when it recognises a liability to pay a dividend. The Company has evaluated the effect of the said amendment and found that it is already creating corresponding liability for payment of DDT when it recognises a liability to pay a dividend. So, there is no any impact on its financial statements further, due to this amendment. The second amendment relates to recognition of tax consequence of an item whose tax treatment is uncertain. Tax treatment of an item is considered as uncertain when there is uncertainty whether the relevant taxation authority will accept the tax treatment of that item or not. The Company has evaluated the effect of the said amendment and found that it is already recognising tax liability in all such cases where it considers that the tax treatment is uncertain. So there shall not be any additional impact on its financial statements due to the said amendment.
46 Recent Accounting Pronouncements (Contd.)
As per our report of even date For and on Behalf of Board of DirectorsFor Lodha & Co. For S.S. Kothari Mehta & Co. Ravi Jhunjhunwala Riju JhunjhunwalaChartered Accountants Chartered Accountants Chairman Managing Director & Chief Executive OfficerFirm Regn. No. 301051E Firm Regn. No. 000756N DIN: 00060972 DIN: 00061060
N. K. Lodha Yogesh K. Gupta B. M. SharmaPartner Partner Joint Managing Director & Chief Financial OfficerM. No. 085155 M. No. 093214 DIN: 08195895 | M.No. FCA 035012
Surender GuptaPlace: Noida, (U.P.) Company SecretaryDate: May 21, 2019 M.No. FCS 2615
Corporate Overview Management Reports Financial Statements1 45 103
175PB
OpinionWe have audited the accompanying consolidated financial statements of RSWM Limited (hereinafter referred to as "the Holding Company") and its subsidiaries (the Holding and its subsidiaries together referred to as "the Group") and its associate, comprising the Consolidated Balance Sheet as at March 31, 2019, the Consolidated Statement of Profit and Loss (including Other Comprehensive Income), the Consolidated Cash Flow Statement, the Consolidated Statement of Changes in Equity, for the year then ended, and notes to the consolidated financial statements, including a summary of significant accounting policies (hereinafter referred to as “the consolidated financial statements”).
In our opinion and to the best of our information and according to the explanations given to us and based on the consideration of the reports of the other auditors on separate financial statements and on the other financial information of the subsidiaries and associate, the aforesaid consolidated financial statements give the information required by the Companies Act 2013 (“the Act”) in the manner so required and give a true and fair view in conformity with the accounting principles generally accepted in India, of their consolidated state of affairs of the Group and its associate as at March 31, 2019, of consolidated loss (including Other Comprehensive Income), consolidated changes in equity and its consolidated cash flows for the year ended on that date.
Basis for OpinionWe conducted our audit of the consolidated financial statements in accordance with the Standards on Auditing specified under section 143 (10) of the Act (SAs). Our responsibilities under those Standards are further described in the Auditor’s Responsibility for the Audit of the Consolidated Financial Statements section of our report. We are independent of the Group in accordance with the Code of Ethics issued by the Institute of Chartered Accountants of India (ICAI) together
Independent Auditor's Report
with the ethical requirements that are relevant to our audit of the consolidated financial statements under the provisions of the Act and the Rules made thereunder, and we have fulfilled our other ethical responsibilities in accordance with these requirements and the ICAI’s Code of Ethics. We believe that the audit evidence obtained by us and the audit evidence obtained by other auditors in terms of their reports referred to in the Other Matters section below is sufficient and appropriate to provide a basis for our audit opinion on the consolidated financial statements.
Material Uncertainty Related to Going ConcernRelating to Subsidiary of an Associate
In case of Chango Yangthang Hydro Power Limited (CYHPL), a subsidiary of an associate Bhilwara Energy Limited (BEL), as stated in Note No. 47 ii) b) of the Consolidated Financial Statements, the board of directors of CYHPL decision to surrender the Chango Yangthang HEP (180 MW) project to Directorate of Energy, Government of Himachal Pradesh due to delay and uncertainty in project execution/long delay in Government approvals and licenses lapse. Further, CYHPL had written off capital work in progress amounting to D2,713.18 Lakhs during the previous year. As CYHPL was incorporated as Special Purpose Vehicle (SPV) hence these events/conditions indicate that there exists material uncertainty that may cast significant doubt on ability to continue as a going concern. This matter was reported under heading “Material uncertainty relating to Going Concern” in the auditor’s report on consolidated financial statements of an associate (BEL). Our opinion is not modified in respect of this matter.
Emphasis of matter:Relating to Subsidiary of an Associate
Attention is drawn to:
a) In case of Chango Yang Thang Hydro Power Limited (CYHPL),
To the Members of RSWM Limited
Report on Audit of the Consolidated Financial Statements
ANNUAL REPORT20 1819
177176
a subsidiary of an Associate (BEL), as stated in Note No 47 ii) b) of the consolidated financial statements regarding pending refund of upfront premium D3,789.45 Lakhs and Security Deposit of D180 Lakhs (Company indirect share of D705.76 Lakhs) with interest from the Directorate of Energy, Government of Himachal Pradesh, where the management of CYHPL is confident of recovering the upfront premium and security deposit.
b) In case of NJC Hydro Power Limited (NHPL), a subsidiary of an Associate (BEL), as stated in Note No 47 ii) c) of the consolidated financial statements regarding the viability of the Nyamjang Chhu HEP Project is dependent on the outcome of the report of Wildlife Institute of India, Dehradun. The auditor of Associate (BEL) reported in their consolidated Auditor’s Report that they are unable to comment on the financial implications and the future operations of the NHPL till outcome of report of Wildlife Institute of India, Dehradun.
c) In case of Malana Power Company Limited, a subsidiary of an Associate (BEL), as stated in Note No 47 ii) d) of the consolidated financial statements which describes the uncertainty relating to the effects of outcome of litigation with Himachal Pradesh State Electricity Board (HPSEBL).
The Emphasis of matters were reported in the auditor’s report on consolidated financial statements of an associate. Our opinion is not modified in respect of above matters.
Key Audit Matters Key audit matters are those matters that, in our professional judgment, were of most significance in our audit of the consolidated financial statements of the current period. These matters were addressed in the context of our audit of the consolidated financial statements as a whole, and in forming our opinion thereon, and we do not provide a separate opinion on these matters.
We have determined that there are no key audit matters to be communicated in our report.
Information Other than the Consolidated Financial Statements and Auditor’s Report ThereonThe Holding Company’s is responsible for the other information. The other information comprises the information included in the Management Discussion and Analysis, Board’s Report including Annexures to Board’s Report, Business Responsibility Report, Corporate Governance and Shareholder’s Information, but does not include the consolidated financial statements and our auditor’s report thereon.
Our opinion on the consolidated financial statements does not cover the other information and we do not express any form of assurance conclusion thereon.
In connection with our audit of the consolidated financial statements, our responsibility is to read the other information identified above and, in doing so, consider whether the other information is materially inconsistent with the financial statements or our knowledge obtained in the audit, or otherwise appears to be materially misstated.
If, based on the work we have performed, we conclude that there is a material misstatement of this other information, we are required to report that fact. We have nothing to report in this regard.
Management’s Responsibility for the Consolidated Financial StatementsThe Holding Company’s Board of Directors is responsible for the preparation and presentation of these consolidated financial statements in term of the requirements of the Companies Act, 2013 that give a true and fair view of the consolidated financial position, consolidated financial performance and consolidated cash flows of the Group including its Associate in accordance with the accounting principles generally accepted in India, including the Accounting Standards specified under section 133 of the Act. The respective Board of Directors of the companies included in the Group and of its associates are responsible for maintenance of adequate accounting records in accordance with the provisions of the Act for safeguarding the assets of the Group and for preventing and detecting frauds and other irregularities; selection and application of appropriate accounting policies; making judgments and estimates that are reasonable and prudent; and the design, implementation and maintenance of adequate internal financial controls, that were operating effectively for ensuring accuracy and completeness of the accounting records, relevant to the preparation and presentation of the financial statements that give a true and fair view and are free from material misstatement, whether due to fraud or error, which have been used for the purpose of preparation of the consolidated financial statements by the Directors of the Holding Company, as aforesaid.
In preparing the consolidated financial statements, the respective Board of Directors of the companies included in the Group and of its associate are responsible for assessing the ability of the Group and of its associates to continue as a going concern, disclosing, as applicable, matters related to going concern and using the going concern basis of accounting unless management either intends to liquidate the Group or to cease operations, or has no realistic alternative but to do so.
Corporate Overview Management Reports Financial Statements1 45 103
177176
The respective Board of Directors of the companies included in the Group and of its associate are responsible for overseeing the financial reporting process of the Group and of its associates.
Auditor’s Responsibility for the Audit of the Consolidated Financial StatementsOur objectives are to obtain reasonable assurance about whether the consolidated financial statements as a whole are free from material misstatement, whether due to fraud or error, and to issue an auditor’s report that includes our opinion. Reasonable assurance is a high level of assurance, but is not a guarantee that an audit conducted in accordance with SAs will always detect a material misstatement when it exists. Misstatements can arise from fraud or error and are considered material if, individually or in the aggregate, they could reasonably be expected to influence the economic decisions of users taken on the basis of these consolidated financial statements.
As part of an audit in accordance with SAs, we exercise professional judgment and maintain professional scepticism throughout the audit. We also:
• Identify and assess the risks of material misstatement of the consolidated financial statements, whether due to fraud or error, design and perform audit procedures responsive to those risks, and obtain audit evidence that is sufficient and appropriate to provide a basis for our opinion. The risk of not detecting a material misstatement resulting from fraud is higher than for one resulting from error, as fraud may involve collusion, forgery, intentional omissions, misrepresentations, or the override of internal control.
• Obtain an understanding of internal financial control relevant to the audit in order to design audit procedures that are appropriate in the circumstances. Under section 143(3)(i) of the Act, we are also responsible for expressing our opinion on whether the Holding Company has adequate internal financial controls system in place and the operating effectiveness of such controls.
• Evaluate the appropriateness of accounting policies used and the reasonableness of accounting estimates and related disclosures made by the management.
• Conclude on the appropriateness of management’s use of the going concern basis of accounting and, based on the audit evidence obtained, whether a material uncertainty exists related to events or conditions that may cast significant doubt on the ability of the Group to continue as a going concern. If we conclude that a material uncertainty exists, we are required to draw attention in our auditor’s report to the related disclosures in the consolidated financial statements or, if such disclosures are inadequate, to modify our opinion. Our conclusions are based on the
audit evidence obtained up to the date of our auditor’s report. However, future events or conditions may cause the Group to cease to continue as a going concern.
• Evaluate the overall presentation, structure and content of the consolidated financial statements, including the disclosures, and whether the consolidated financial statements represent the underlying transactions and events in a manner that achieves fair presentation.
• Obtain sufficient appropriate audit evidence regarding the financial information of the entities or business activities within the Group to express an opinion on the consolidated financial statements. We are responsible for the direction, supervision and performance of the audit of the financial statements of such entities included in the consolidated financial statements of which we are the independent auditors. For the other entities included in the consolidated financial statements, which have been audited by other auditors, such other auditors remain responsible for the direction, supervision and performance of the audits carried out by them. We remain solely responsible for our audit opinion.
Materiality is the magnitude of misstatements in the consolidated financial statements that, individually or in aggregate, makes it probable that the economic decisions of a reasonably knowledgeable user of the consolidated financial statements may be influenced. We consider quantitative materiality and qualitative factors in (i) planning the scope of our audit work and in evaluating the results of our work; and (ii) to evaluate the effect of any identified misstatements in the consolidated financial statements.
We communicate with those charged with governance of the Holding Company and other entities included in the consolidated financial statements of which we are the independent auditors regarding, among other matters, the planned scope and timing of the audit and significant audit findings, including any significant deficiencies in internal control that we identify during our audit.
We also provide those charged with governance with a statement that we have complied with relevant ethical requirements regarding independence, and to communicate with them all relationships and other matters that may reasonably be thought to bear on our independence, and where applicable, related safeguards.
From the matters communicated with those charged with governance, we determine those matters that were of most significance in the audit of the consolidated financial statements of the current period and are therefore the key audit matters. We describe these matters in our auditor’s report unless law
ANNUAL REPORT20 1819
179178
or regulation precludes public disclosure about the matter or when, in extremely rare circumstances, we determine that a matter should not be communicated in our report because the adverse consequences of doing so would reasonably be expected to outweigh the public interest benefits of such communication.
Other MattersWe did not audit the financial statements of two subsidiaries (Including one step-down subsidiary) whose financial statements reflect total assets of D1,664.65 Lakhs, net assets of D1,048.52 Lakhs and net cash inflows of D(278.26) Lakhs as at March 31, 2019, total revenues of D1,187.84 Lakhs, total profit/(loss) after tax of D109.98 Lakhs and Other Comprehensive Income of D(0.07) Lakhs for year ended on that date, as considered in the consolidated financial statements. The consolidated financial statements of the group include the Group’s share of net Loss of D(1,568.80) Lakhs and Other Comprehensive Income of D(2.17) Lakhs for the year ended March 31, 2019 as considered in the consolidated financial statements, in respect of associate whose financial statements have not been audited by us. These financial statements have been audited by other auditors whose reports have been furnished to us by the management and our opinion on the consolidated financial statements, in so far as it relates to the amounts and disclosures included in respect of the subsidiaries and associate and our report in terms of sub-sections (3) of Section 143 of the Act, in so far as it relates to the aforesaid subsidiaries and associates is based solely on the reports of the other auditors.
Our opinion on the consolidated financial statements, and our report on Other Legal and Regulatory Requirements below, is not modified in respect of the above matters with respect to our reliance on the work done and the reports of the other auditors.
Report on Other Legal and Regulatory Requirements1. As required by Section 143 (3) of the Act, based on our
audit and on the consideration of the reports of the other auditors on separate financial statements / consolidated financial statements and other financial information of the subsidiaries and associate, we report, to the extent applicable, that:
a) We have sought and obtained all the information and explanations which to the best of our knowledge and belief were necessary for the purposes of our audit of the aforesaid consolidated financial statements.
b) In our opinion, proper books of account as required by law relating to preparation of the aforesaid consolidated
financial statements have been kept so far as it appears from our examination of those books and the reports of the other auditors.
c) The Consolidated Balance Sheet, the Consolidated Statement of Profit and Loss including Other Comprehensive Income, the Consolidated Statement of Cash Flows and the Consolidated Statement of Changes in Equity dealt with by this Report are in agreement with the relevant books of account maintained for the purpose of preparation of the consolidated financial statements
d) In our opinion, the aforesaid consolidated financial statements comply with the Ind AS specified under Section 133 of the Act.
e) On the basis of the written representations received from the directors of the Holding Company and taken on record by the Board of Directors of the Holding Company and the reports of the other statutory auditors of its subsidiary companies and associate company covered under the Act, none of the directors of the Group companies, its associate companies covered under the Act, are disqualified as on March 31, 2019 from being appointed as a director in terms of Section 164(2) of the Act.
f ) With respect to the adequacy of the internal financial controls over financial reporting and the operating effectiveness of such controls, refer to our separate Report in “Annexure A”. Our report expresses an unmodified opinion on the adequacy and operating effectiveness of internal financial controls over financial reporting of Group.
g) With respect to the other matters to be included in the Auditor’s Report in accordance with the requirements of section 197(16) of the Act, as amended,
In our opinion and to the best of our information and according to the explanations given to us and on the consideration of the reports of the other auditors, referred to in other matter paragraph, on separate financial statements / consolidated financial statements of the subsidiaries and its associates, we report that the remuneration paid by the Group and its associate to its directors during the year is in accordance with the provisions of section 197 of the Act.
h) With respect to the other matters to be included in the Auditor’s Report in accordance with rule 11 of the Companies (Audit and Auditors) Rules, 2014 (as amended), in our opinion and to the best of our information and according to the explanations given to us and based on the consideration of the report of
Corporate Overview Management Reports Financial Statements1 45 103
179178
the other auditors on separate financial statements / consolidated financial statements as also the other financial information of the subsidiary and associate:
i. The consolidated Ind AS financial statements disclose the impact of pending litigations on the consolidated financial position of the Group and its associate. Refer Note-45 to the Consolidated Ind AS financial statements.
ii. The Group and its associate did not have any material foreseeable losses on long-term contracts including derivative contracts.
iii. There has been no delay in transferring amounts, required to be transferred, to the Investor Education and Protection Fund by the Holding Company
during the year ended 31st March, 2019 and there were no amounts which were required to be transferred to the Investor Education and Protection Fund by the subsidiaries company and associate incorporated in India.
For Lodha & Co. For S. S. KOTHARI MEHTA & COChartered Accountants Chartered AccountantsFirm Registration No.:301051E Firm Registration No.000756N
N. K. Lodha Yogesh K. GuptaPartner PartnerMembership No.: 085155 Membership No.: 093214
Place : NoidaDate : May 21, 2019
ANNUAL REPORT20 1819
181180
In conjunction with our audit of the consolidated Ind AS financial statements of the Company as of and for the year ended March 31, 2019, we have audited the internal financial controls over financial reporting RSWM Limited (hereinafter referred to as “the Holding Company”) and its two subsidiary companies (including one step-down subsidiary) and associate, which are the Company incorporated in India, as of that date.
Management’s Responsibility for Internal Financial ControlsThe respective Board of Directors of the Holding company , its subsidiary company and its associate company which is the company incorporated in India, are responsible for establishing and maintaining internal financial controls based on the internal control over financial reporting criteria established by the Company considering the essential components of internal control stated in the Guidance Note on Audit of Internal Financial Controls Over Financial Reporting issued by the Institute of Chartered Accountants of India (ICAI). These responsibilities include the design, implementation and maintenance of adequate internal financial controls that were operating effectively for ensuring the orderly and efficient conduct of its business, including adherence to the respective company’s policies, the safeguarding of its assets, the prevention and detection of frauds and errors, the accuracy and completeness of the accounting records, and the timely preparation of reliable financial information, as required under the Companies Act, 2013.
Auditor’s ResponsibilityOur responsibility is to express an opinion on the internal financial controls over financial reporting of the Holding Company, its subsidiary company and associate which is the company incorporated in India, based on our audit. We conducted our audit in accordance with the Guidance Note on Audit of Internal Financial Controls Over Financial Reporting (the “Guidance Note”) issued by the Institute of Chartered Accountants of India and the Standards on Auditing, prescribed under Section 143(10) of the Companies Act, 2013, to the extent applicable to an audit of internal financial controls. Those Standards and the Guidance Note require that we comply with ethical requirements and plan and perform the audit to
Annexure "A" to the Independent Auditor's Report (Referred to in paragraph (f) under ‘Report on Other Legal and Regulatory Requirements’ section of our report of even date) Report on the Internal Financial Controls Over Financial Reporting under Clause (i) of Sub-section 3 of Section 143 of the Companies Act, 2013 (“the Act”)
obtain reasonable assurance about whether adequate internal financial controls over financial reporting was established and maintained and if such controls operated effectively in all material respects.
Our audit involves performing procedures to obtain audit evidence about the adequacy of the internal financial controls system over financial reporting and their operating effectiveness. Our audit of internal financial controls over financial reporting included obtaining an understanding of internal financial controls over financial reporting, assessing the risk that a material weakness exists, and testing and evaluating the design and operating effectiveness of internal control based on the assessed risk. The procedures selected depend on the auditor’s judgement, including the assessment of the risks of material misstatement of the financial statements, whether due to fraud or error.
We believe that the audit evidence we have obtained and the audit evidence obtained by the other auditors in terms of their reports referred to in the Other Matter paragraph below, is sufficient and appropriate to provide a basis for our audit opinion on the internal financial controls system over financial reporting of the Holding Company, its subsidiary company and associate which is the company incorporated in India.
Meaning of Internal Financial Controls over Financial ReportingA company's internal financial control over financial reporting is a process designed to provide reasonable assurance regarding the reliability of financial reporting and the preparation of financial statements for external purposes in accordance with generally accepted accounting principles. A company's internal financial control over financial reporting includes those policies and procedures that (1) pertain to the maintenance of records that, in reasonable detail, accurately and fairly reflect the transactions and dispositions of the assets of the company; (2) provide reasonable assurance that transactions are recorded as necessary to permit preparation of financial statements in accordance with generally accepted accounting principles, and that receipts and expenditures of the company are being made only in accordance with authorisations of management and
Corporate Overview Management Reports Financial Statements1 45 103
181180
directors of the company; and (3) provide reasonable assurance regarding prevention or timely detection of unauthorised acquisition, use, or disposition of the company's assets that could have a material effect on the financial statements.
Inherent Limitations of Internal Financial Controls over Financial ReportingBecause of the inherent limitations of internal financial controls over financial reporting, including the possibility of collusion or improper management override of controls, material misstatements due to error or fraud may occur and not be detected. Also, projections of any evaluation of the internal financial controls over financial reporting to future periods are subject to the risk that the internal financial control over financial reporting may become inadequate because of changes in conditions, or that the degree of compliance with the policies or procedures may deteriorate.
OpinionIn our opinion to the best of our information and according to the explanations given to us and based on the consideration of reports of the other auditors, the Holding Company, subsidiaries company (including a step-down subsidiary) and associate, which is the company incorporated in India, have, in all material respects, an adequate internal financial controls system over financial reporting and such internal financial controls over
financial reporting were operating effectively as at March 31, 2019, based on the criteria for internal financial control over financial reporting established by the respective companies considering the essential components of internal control stated in the Guidance Note on Audit of Internal Financial Controls Over Financial Reporting issued by the Institute of Chartered Accountants of India.
Other matters Our aforesaid reports under Section 143(3)(i) of the Act on the adequacy and operating effectiveness of the internal financial controls over financial reporting insofar as it relates to 2 subsidiaries (including a step-down subsidiary) and an associate, which are companies incorporated in India, is based on the corresponding reports of the auditors of such companies incorporated in India.
For Lodha & Co. For S. S. KOTHARI MEHTA & COChartered Accountants Chartered AccountantsFirm Registration No.:301051E Firm Registration No.000756N
N. K. Lodha Yogesh K. GuptaPartner PartnerMembership No.: 085155 Membership No.: 093214
Place : NoidaDate : May 21, 2019
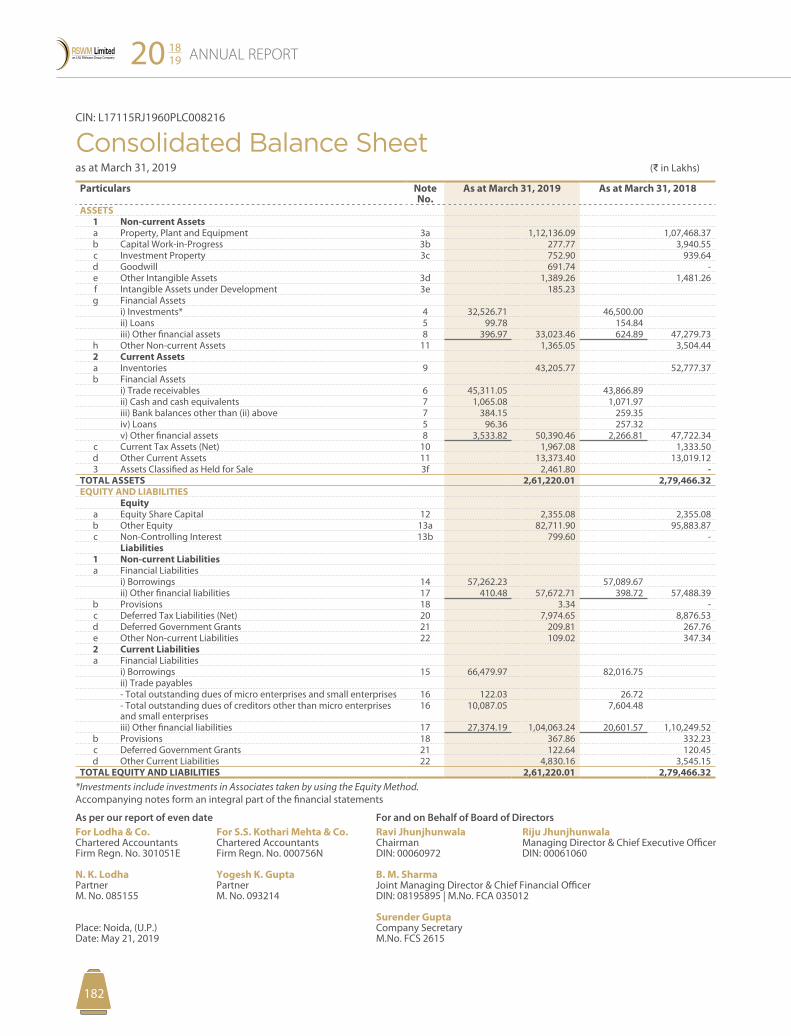
ANNUAL REPORT20 1819
183182
CIN: L17115RJ1960PLC008216
Consolidated Balance Sheet as at March 31, 2019 (D in Lakhs)
Particulars Note No.
As at March 31, 2019 As at March 31, 2018
ASSETS1 Non-current Assetsa Property, Plant and Equipment 3a 1,12,136.09 1,07,468.37 b Capital Work-in-Progress 3b 277.77 3,940.55 c Investment Property 3c 752.90 939.64 d Goodwill 691.74 - e Other Intangible Assets 3d 1,389.26 1,481.26 f Intangible Assets under Development 3e 185.23 g Financial Assets
i) Investments* 4 32,526.71 46,500.00 ii) Loans 5 99.78 154.84 iii) Other financial assets 8 396.97 33,023.46 624.89 47,279.73
h Other Non-current Assets 11 1,365.05 3,504.44 2 Current Assetsa Inventories 9 43,205.77 52,777.37 b Financial Assets
i) Trade receivables 6 45,311.05 43,866.89 ii) Cash and cash equivalents 7 1,065.08 1,071.97 iii) Bank balances other than (ii) above 7 384.15 259.35 iv) Loans 5 96.36 257.32 v) Other financial assets 8 3,533.82 50,390.46 2,266.81 47,722.34
c Current Tax Assets (Net) 10 1,967.08 1,333.50 d Other Current Assets 11 13,373.40 13,019.12 3 Assets Classified as Held for Sale 3f 2,461.80 -
TOTAL ASSETS 2,61,220.01 2,79,466.32 EQUITY AND LIABILITIES
Equitya Equity Share Capital 12 2,355.08 2,355.08 b Other Equity 13a 82,711.90 95,883.87 c Non-Controlling Interest 13b 799.60 -
Liabilities1 Non-current Liabilitiesa Financial Liabilities
i) Borrowings 14 57,262.23 57,089.67 ii) Other financial liabilities 17 410.48 57,672.71 398.72 57,488.39
b Provisions 18 3.34 - c Deferred Tax Liabilities (Net) 20 7,974.65 8,876.53 d Deferred Government Grants 21 209.81 267.76 e Other Non-current Liabilities 22 109.02 347.34 2 Current Liabilitiesa Financial Liabilities
i) Borrowings 15 66,479.97 82,016.75 ii) Trade payables- Total outstanding dues of micro enterprises and small enterprises 16 122.03 26.72 - Total outstanding dues of creditors other than micro enterprises and small enterprises
16 10,087.05 7,604.48
iii) Other financial liabilities 17 27,374.19 1,04,063.24 20,601.57 1,10,249.52 b Provisions 18 367.86 332.23 c Deferred Government Grants 21 122.64 120.45 d Other Current Liabilities 22 4,830.16 3,545.15
TOTAL EQUITY AND LIABILITIES 2,61,220.01 2,79,466.32*Investments include investments in Associates taken by using the Equity Method.Accompanying notes form an integral part of the financial statements
As per our report of even date For and on Behalf of Board of DirectorsFor Lodha & Co. For S.S. Kothari Mehta & Co. Ravi Jhunjhunwala Riju JhunjhunwalaChartered Accountants Chartered Accountants Chairman Managing Director & Chief Executive OfficerFirm Regn. No. 301051E Firm Regn. No. 000756N DIN: 00060972 DIN: 00061060
N. K. Lodha Yogesh K. Gupta B. M. SharmaPartner Partner Joint Managing Director & Chief Financial OfficerM. No. 085155 M. No. 093214 DIN: 08195895 | M.No. FCA 035012
Surender GuptaPlace: Noida, (U.P.) Company SecretaryDate: May 21, 2019 M.No. FCS 2615
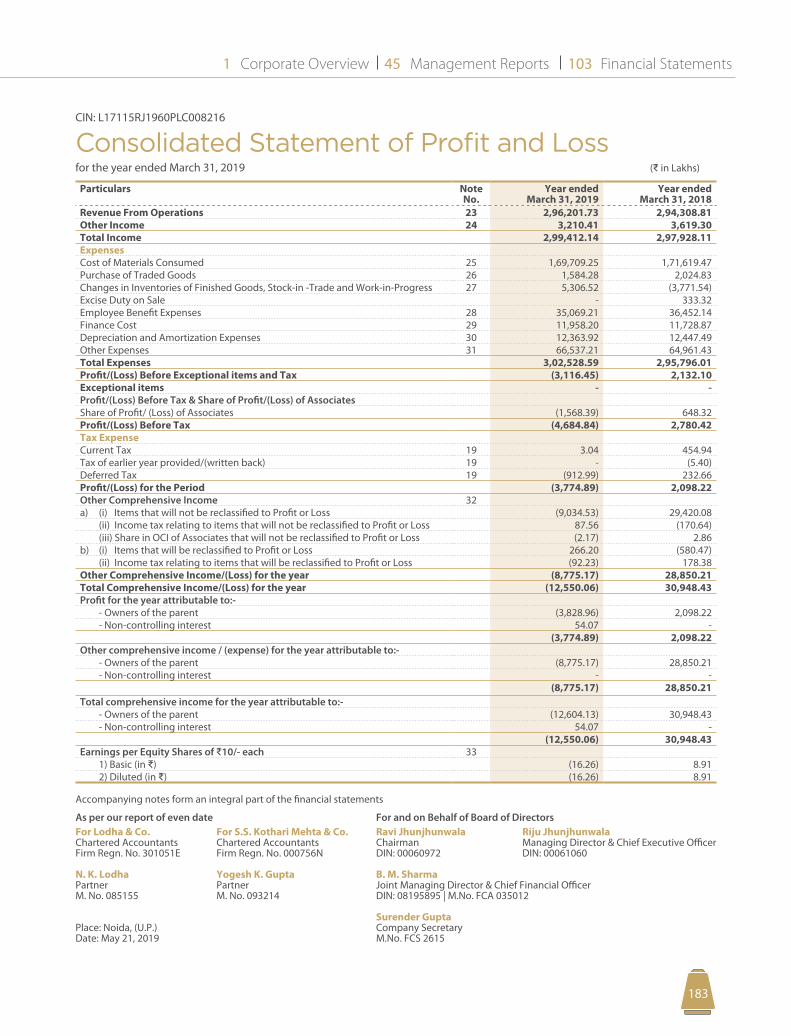
Corporate Overview Management Reports Financial Statements1 45 103
183182
CIN: L17115RJ1960PLC008216
Consolidated Statement of Profit and Lossfor the year ended March 31, 2019 (D in Lakhs)
Particulars Note No.
Year ended March 31, 2019
Year ended March 31, 2018
Revenue From Operations 23 2,96,201.73 2,94,308.81 Other Income 24 3,210.41 3,619.30 Total Income 2,99,412.14 2,97,928.11 ExpensesCost of Materials Consumed 25 1,69,709.25 1,71,619.47 Purchase of Traded Goods 26 1,584.28 2,024.83 Changes in Inventories of Finished Goods, Stock-in -Trade and Work-in-Progress 27 5,306.52 (3,771.54)Excise Duty on Sale - 333.32 Employee Benefit Expenses 28 35,069.21 36,452.14 Finance Cost 29 11,958.20 11,728.87 Depreciation and Amortization Expenses 30 12,363.92 12,447.49 Other Expenses 31 66,537.21 64,961.43 Total Expenses 3,02,528.59 2,95,796.01 Profit/(Loss) Before Exceptional items and Tax (3,116.45) 2,132.10 Exceptional items - - Profit/(Loss) Before Tax & Share of Profit/(Loss) of AssociatesShare of Profit/ (Loss) of Associates (1,568.39) 648.32 Profit/(Loss) Before Tax (4,684.84) 2,780.42 Tax Expense Current Tax 19 3.04 454.94 Tax of earlier year provided/(written back) 19 - (5.40)Deferred Tax 19 (912.99) 232.66 Profit/(Loss) for the Period (3,774.89) 2,098.22 Other Comprehensive Income 32a) (i) Items that will not be reclassified to Profit or Loss (9,034.53) 29,420.08 (ii) Income tax relating to items that will not be reclassified to Profit or Loss 87.56 (170.64) (iii) Share in OCI of Associates that will not be reclassified to Profit or Loss (2.17) 2.86 b) (i) Items that will be reclassified to Profit or Loss 266.20 (580.47) (ii) Income tax relating to items that will be reclassified to Profit or Loss (92.23) 178.38 Other Comprehensive Income/(Loss) for the year (8,775.17) 28,850.21 Total Comprehensive Income/(Loss) for the year (12,550.06) 30,948.43 Profit for the year attributable to:-
- Owners of the parent (3,828.96) 2,098.22 - Non-controlling interest 54.07 -
(3,774.89) 2,098.22 Other comprehensive income / (expense) for the year attributable to:-
- Owners of the parent (8,775.17) 28,850.21 - Non-controlling interest - -
(8,775.17) 28,850.21 Total comprehensive income for the year attributable to:-
- Owners of the parent (12,604.13) 30,948.43 - Non-controlling interest 54.07 -
(12,550.06) 30,948.43 Earnings per Equity Shares of D10/- each 33
1) Basic (in D) (16.26) 8.91 2) Diluted (in D) (16.26) 8.91
Accompanying notes form an integral part of the financial statements
As per our report of even date For and on Behalf of Board of DirectorsFor Lodha & Co. For S.S. Kothari Mehta & Co. Ravi Jhunjhunwala Riju JhunjhunwalaChartered Accountants Chartered Accountants Chairman Managing Director & Chief Executive OfficerFirm Regn. No. 301051E Firm Regn. No. 000756N DIN: 00060972 DIN: 00061060
N. K. Lodha Yogesh K. Gupta B. M. SharmaPartner Partner Joint Managing Director & Chief Financial OfficerM. No. 085155 M. No. 093214 DIN: 08195895 | M.No. FCA 035012
Surender GuptaPlace: Noida, (U.P.) Company SecretaryDate: May 21, 2019 M.No. FCS 2615
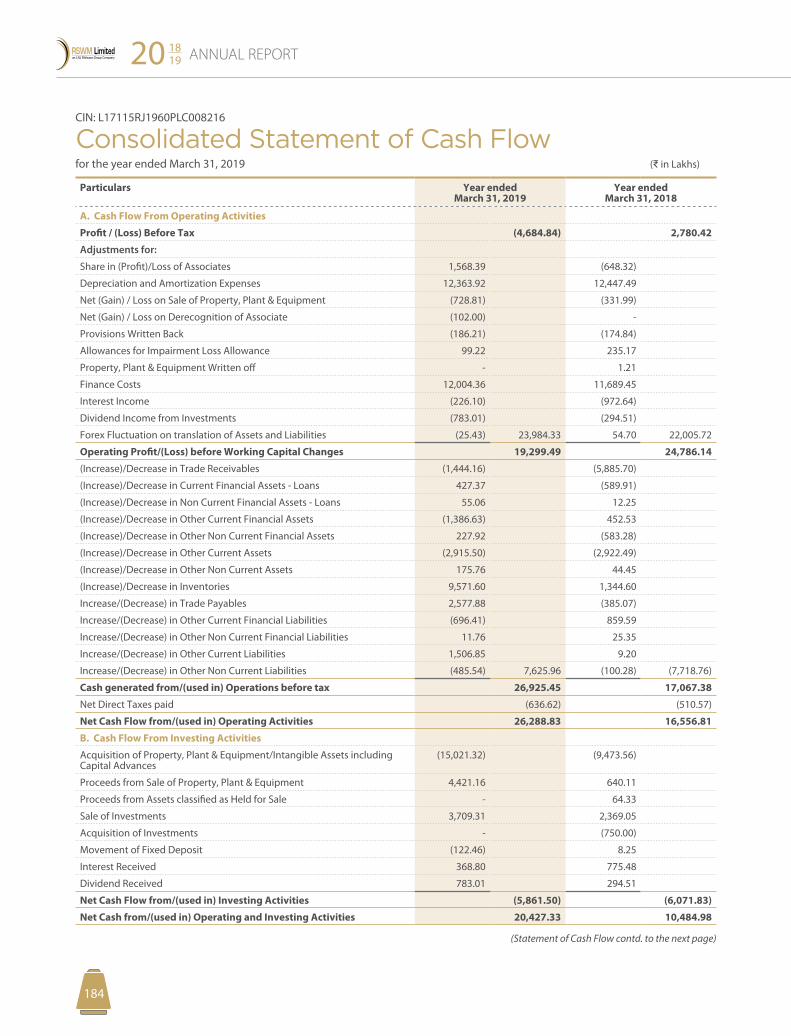
ANNUAL REPORT20 1819
185184
CIN: L17115RJ1960PLC008216
Consolidated Statement of Cash Flow for the year ended March 31, 2019 (D in Lakhs)
Particulars Year ended March 31, 2019
Year ended March 31, 2018
A. Cash Flow From Operating Activities
Profit / (Loss) Before Tax (4,684.84) 2,780.42
Adjustments for:
Share in (Profit)/Loss of Associates 1,568.39 (648.32)
Depreciation and Amortization Expenses 12,363.92 12,447.49
Net (Gain) / Loss on Sale of Property, Plant & Equipment (728.81) (331.99)
Net (Gain) / Loss on Derecognition of Associate (102.00) -
Provisions Written Back (186.21) (174.84)
Allowances for Impairment Loss Allowance 99.22 235.17
Property, Plant & Equipment Written off - 1.21
Finance Costs 12,004.36 11,689.45
Interest Income (226.10) (972.64)
Dividend Income from Investments (783.01) (294.51)
Forex Fluctuation on translation of Assets and Liabilities (25.43) 23,984.33 54.70 22,005.72
Operating Profit/(Loss) before Working Capital Changes 19,299.49 24,786.14
(Increase)/Decrease in Trade Receivables (1,444.16) (5,885.70)
(Increase)/Decrease in Current Financial Assets - Loans 427.37 (589.91)
(Increase)/Decrease in Non Current Financial Assets - Loans 55.06 12.25
(Increase)/Decrease in Other Current Financial Assets (1,386.63) 452.53
(Increase)/Decrease in Other Non Current Financial Assets 227.92 (583.28)
(Increase)/Decrease in Other Current Assets (2,915.50) (2,922.49)
(Increase)/Decrease in Other Non Current Assets 175.76 44.45
(Increase)/Decrease in Inventories 9,571.60 1,344.60
Increase/(Decrease) in Trade Payables 2,577.88 (385.07)
Increase/(Decrease) in Other Current Financial Liabilities (696.41) 859.59
Increase/(Decrease) in Other Non Current Financial Liabilities 11.76 25.35
Increase/(Decrease) in Other Current Liabilities 1,506.85 9.20
Increase/(Decrease) in Other Non Current Liabilities (485.54) 7,625.96 (100.28) (7,718.76)
Cash generated from/(used in) Operations before tax 26,925.45 17,067.38
Net Direct Taxes paid (636.62) (510.57)
Net Cash Flow from/(used in) Operating Activities 26,288.83 16,556.81
B. Cash Flow From Investing Activities
Acquisition of Property, Plant & Equipment/Intangible Assets including Capital Advances
(15,021.32) (9,473.56)
Proceeds from Sale of Property, Plant & Equipment 4,421.16 640.11
Proceeds from Assets classified as Held for Sale - 64.33
Sale of Investments 3,709.31 2,369.05
Acquisition of Investments - (750.00)
Movement of Fixed Deposit (122.46) 8.25
Interest Received 368.80 775.48
Dividend Received 783.01 294.51
Net Cash Flow from/(used in) Investing Activities (5,861.50) (6,071.83)
Net Cash from/(used in) Operating and Investing Activities 20,427.33 10,484.98
(Statement of Cash Flow contd. to the next page)
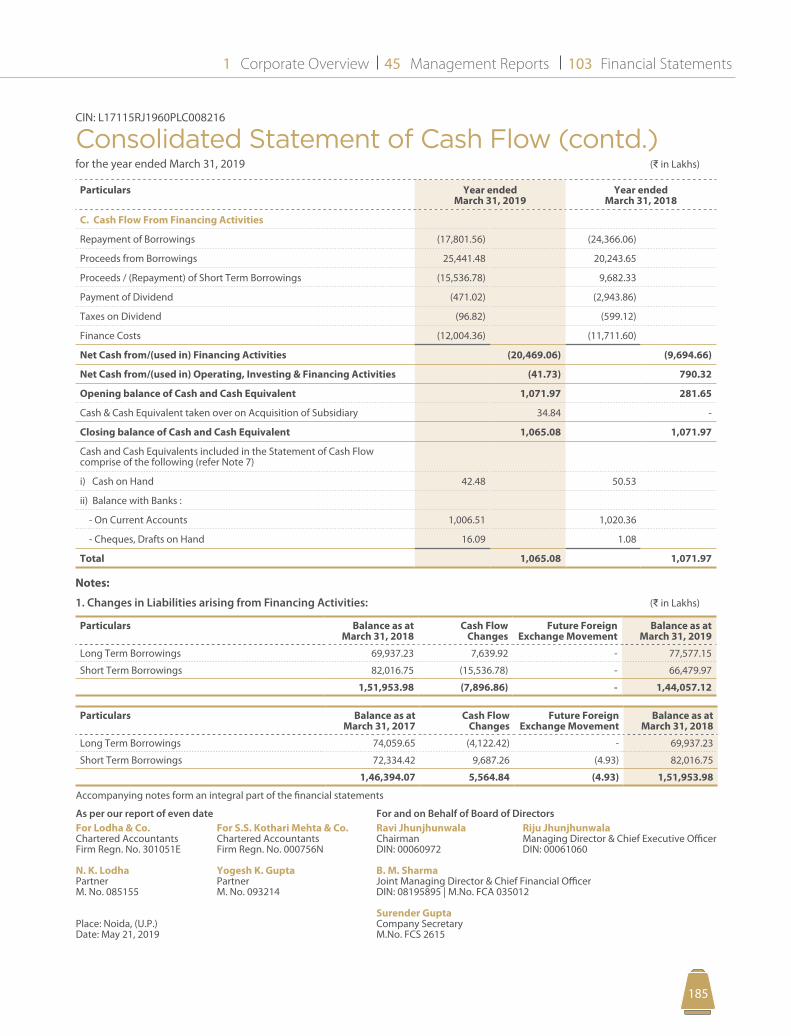
Corporate Overview Management Reports Financial Statements1 45 103
185184
CIN: L17115RJ1960PLC008216
Consolidated Statement of Cash Flow (contd.) for the year ended March 31, 2019 (D in Lakhs)
Particulars Year ended March 31, 2019
Year ended March 31, 2018
C. Cash Flow From Financing Activities
Repayment of Borrowings (17,801.56) (24,366.06)
Proceeds from Borrowings 25,441.48 20,243.65
Proceeds / (Repayment) of Short Term Borrowings (15,536.78) 9,682.33
Payment of Dividend (471.02) (2,943.86)
Taxes on Dividend (96.82) (599.12)
Finance Costs (12,004.36) (11,711.60)
Net Cash from/(used in) Financing Activities (20,469.06) (9,694.66)
Net Cash from/(used in) Operating, Investing & Financing Activities (41.73) 790.32
Opening balance of Cash and Cash Equivalent 1,071.97 281.65
Cash & Cash Equivalent taken over on Acquisition of Subsidiary 34.84 -
Closing balance of Cash and Cash Equivalent 1,065.08 1,071.97
Cash and Cash Equivalents included in the Statement of Cash Flow comprise of the following (refer Note 7)
i) Cash on Hand 42.48 50.53
ii) Balance with Banks :
- On Current Accounts 1,006.51 1,020.36
- Cheques, Drafts on Hand 16.09 1.08
Total 1,065.08 1,071.97
Notes:
1. Changes in Liabilities arising from Financing Activities: (D in Lakhs)
Particulars Balance as at March 31, 2018
Cash Flow Changes
Future Foreign Exchange Movement
Balance as at March 31, 2019
Long Term Borrowings 69,937.23 7,639.92 - 77,577.15
Short Term Borrowings 82,016.75 (15,536.78) - 66,479.97
1,51,953.98 (7,896.86) - 1,44,057.12
Particulars Balance as at March 31, 2017
Cash Flow Changes
Future Foreign Exchange Movement
Balance as at March 31, 2018
Long Term Borrowings 74,059.65 (4,122.42) - 69,937.23
Short Term Borrowings 72,334.42 9,687.26 (4.93) 82,016.75
1,46,394.07 5,564.84 (4.93) 1,51,953.98
Accompanying notes form an integral part of the financial statements
As per our report of even date For and on Behalf of Board of DirectorsFor Lodha & Co. For S.S. Kothari Mehta & Co. Ravi Jhunjhunwala Riju JhunjhunwalaChartered Accountants Chartered Accountants Chairman Managing Director & Chief Executive OfficerFirm Regn. No. 301051E Firm Regn. No. 000756N DIN: 00060972 DIN: 00061060
N. K. Lodha Yogesh K. Gupta B. M. SharmaPartner Partner Joint Managing Director & Chief Financial OfficerM. No. 085155 M. No. 093214 DIN: 08195895 | M.No. FCA 035012
Surender GuptaPlace: Noida, (U.P.) Company SecretaryDate: May 21, 2019 M.No. FCS 2615
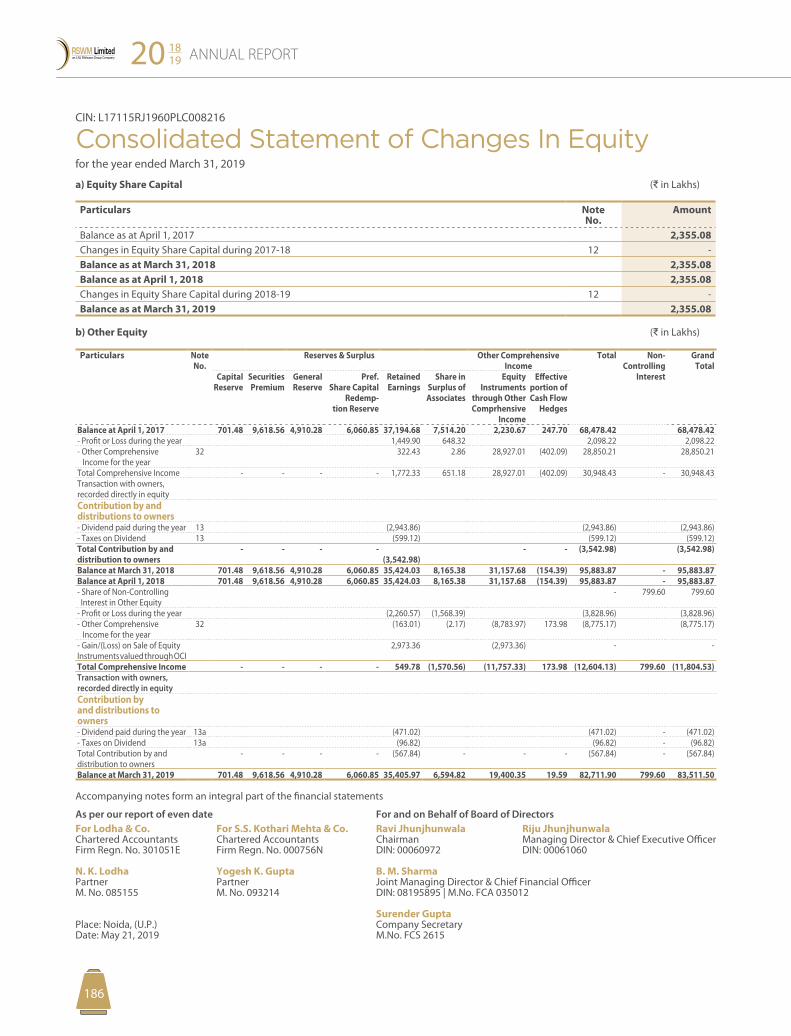
187186
ANNUAL REPORT20 1819
187186
CIN: L17115RJ1960PLC008216
Consolidated Statement of Changes In Equity for the year ended March 31, 2019
a) Equity Share Capital (D in Lakhs)
Particulars NoteNo.
Amount
Balance as at April 1, 2017 2,355.08 Changes in Equity Share Capital during 2017-18 12 - Balance as at March 31, 2018 2,355.08 Balance as at April 1, 2018 2,355.08 Changes in Equity Share Capital during 2018-19 12 - Balance as at March 31, 2019 2,355.08
b) Other Equity (D in Lakhs)
Particulars Note No.
Reserves & Surplus Other Comprehensive Income
Total Non-Controlling
Interest
Grand Total
Capital Reserve
Securities Premium
General Reserve
Pref. Share Capital
Redemp-tion Reserve
Retained Earnings
Share in Surplus of Associates
Equity Instruments
through Other Comprhensive
Income
Effective portion of Cash Flow
Hedges
Balance at April 1, 2017 701.48 9,618.56 4,910.28 6,060.85 37,194.68 7,514.20 2,230.67 247.70 68,478.42 68,478.42 - Profit or Loss during the year 1,449.90 648.32 2,098.22 2,098.22 - Other Comprehensive Income for the year
32 322.43 2.86 28,927.01 (402.09) 28,850.21 28,850.21
Total Comprehensive Income - - - - 1,772.33 651.18 28,927.01 (402.09) 30,948.43 - 30,948.43 Transaction with owners, recorded directly in equityContribution by and distributions to owners- Dividend paid during the year 13 (2,943.86) (2,943.86) (2,943.86)- Taxes on Dividend 13 (599.12) (599.12) (599.12)Total Contribution by and distribution to owners
- - - - (3,542.98)
- - (3,542.98) (3,542.98)
Balance at March 31, 2018 701.48 9,618.56 4,910.28 6,060.85 35,424.03 8,165.38 31,157.68 (154.39) 95,883.87 - 95,883.87 Balance at April 1, 2018 701.48 9,618.56 4,910.28 6,060.85 35,424.03 8,165.38 31,157.68 (154.39) 95,883.87 - 95,883.87 - Share of Non-Controlling Interest in Other Equity
- 799.60 799.60
- Profit or Loss during the year (2,260.57) (1,568.39) (3,828.96) (3,828.96)- Other Comprehensive Income for the year
32 (163.01) (2.17) (8,783.97) 173.98 (8,775.17) (8,775.17)
- Gain/(Loss) on Sale of EquityInstruments valued through OCI
2,973.36 (2,973.36) - -
Total Comprehensive Income - - - - 549.78 (1,570.56) (11,757.33) 173.98 (12,604.13) 799.60 (11,804.53)Transaction with owners, recorded directly in equityContribution by and distributions to owners- Dividend paid during the year 13a (471.02) (471.02) - (471.02)- Taxes on Dividend 13a (96.82) (96.82) - (96.82)Total Contribution by and distribution to owners
- - - - (567.84) - - - (567.84) - (567.84)
Balance at March 31, 2019 701.48 9,618.56 4,910.28 6,060.85 35,405.97 6,594.82 19,400.35 19.59 82,711.90 799.60 83,511.50
Accompanying notes form an integral part of the financial statements
As per our report of even date For and on Behalf of Board of DirectorsFor Lodha & Co. For S.S. Kothari Mehta & Co. Ravi Jhunjhunwala Riju JhunjhunwalaChartered Accountants Chartered Accountants Chairman Managing Director & Chief Executive OfficerFirm Regn. No. 301051E Firm Regn. No. 000756N DIN: 00060972 DIN: 00061060
N. K. Lodha Yogesh K. Gupta B. M. SharmaPartner Partner Joint Managing Director & Chief Financial OfficerM. No. 085155 M. No. 093214 DIN: 08195895 | M.No. FCA 035012
Surender GuptaPlace: Noida, (U.P.) Company SecretaryDate: May 21, 2019 M.No. FCS 2615
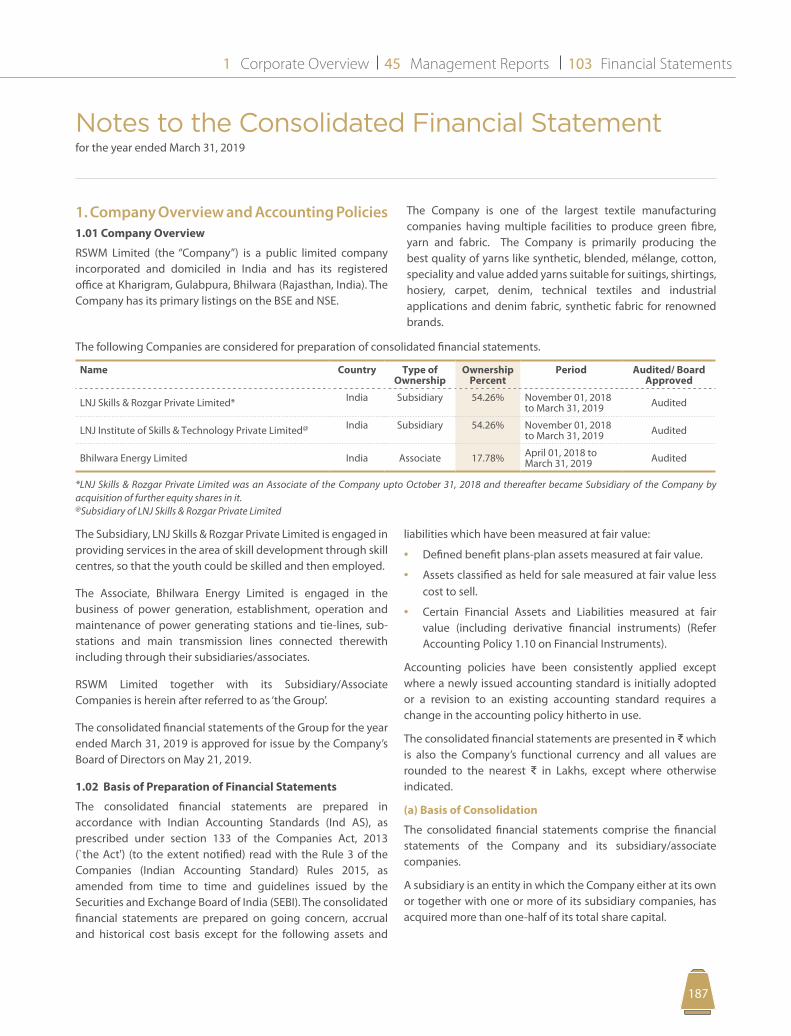
Corporate Overview Management Reports Financial Statements1 45 103
187186 187186
Notes to the Consolidated Financial Statement for the year ended March 31, 2019
(Amounts in D Lakhs, unless otherwise stated)
1. Company Overview and Accounting Policies1.01 Company Overview
RSWM Limited (the “Company”) is a public limited company incorporated and domiciled in India and has its registered office at Kharigram, Gulabpura, Bhilwara (Rajasthan, India). The Company has its primary listings on the BSE and NSE.
The following Companies are considered for preparation of consolidated financial statements.
Name Country Type of Ownership
Ownership Percent
Period Audited/ Board Approved
LNJ Skills & Rozgar Private Limited* India Subsidiary 54.26% November 01, 2018 to March 31, 2019 Audited
LNJ Institute of Skills & Technology Private Limited@ India Subsidiary 54.26% November 01, 2018 to March 31, 2019 Audited
Bhilwara Energy Limited India Associate 17.78% April 01, 2018 to March 31, 2019 Audited
*LNJ Skills & Rozgar Private Limited was an Associate of the Company upto October 31, 2018 and thereafter became Subsidiary of the Company by acquisition of further equity shares in it. @Subsidiary of LNJ Skills & Rozgar Private Limited
The Company is one of the largest textile manufacturing companies having multiple facilities to produce green fibre, yarn and fabric. The Company is primarily producing the best quality of yarns like synthetic, blended, mélange, cotton, speciality and value added yarns suitable for suitings, shirtings, hosiery, carpet, denim, technical textiles and industrial applications and denim fabric, synthetic fabric for renowned brands.
The Subsidiary, LNJ Skills & Rozgar Private Limited is engaged in providing services in the area of skill development through skill centres, so that the youth could be skilled and then employed.
The Associate, Bhilwara Energy Limited is engaged in the business of power generation, establishment, operation and maintenance of power generating stations and tie-lines, sub-stations and main transmission lines connected therewith including through their subsidiaries/associates.
RSWM Limited together with its Subsidiary/Associate Companies is herein after referred to as ‘the Group’.
The consolidated financial statements of the Group for the year ended March 31, 2019 is approved for issue by the Company’s Board of Directors on May 21, 2019.
1.02 Basis of Preparation of Financial Statements
The consolidated financial statements are prepared in accordance with Indian Accounting Standards (Ind AS), as prescribed under section 133 of the Companies Act, 2013 (`the Act') (to the extent notified) read with the Rule 3 of the Companies (Indian Accounting Standard) Rules 2015, as amended from time to time and guidelines issued by the Securities and Exchange Board of India (SEBI). The consolidated financial statements are prepared on going concern, accrual and historical cost basis except for the following assets and
liabilities which have been measured at fair value:
• Defined benefit plans-plan assets measured at fair value.
• Assets classified as held for sale measured at fair value less cost to sell.
• Certain Financial Assets and Liabilities measured at fair value (including derivative financial instruments) (Refer Accounting Policy 1.10 on Financial Instruments).
Accounting policies have been consistently applied except where a newly issued accounting standard is initially adopted or a revision to an existing accounting standard requires a change in the accounting policy hitherto in use.
The consolidated financial statements are presented in D which is also the Company’s functional currency and all values are rounded to the nearest D in Lakhs, except where otherwise indicated.
(a) Basis of Consolidation
The consolidated financial statements comprise the financial statements of the Company and its subsidiary/associate companies.
A subsidiary is an entity in which the Company either at its own or together with one or more of its subsidiary companies, has acquired more than one-half of its total share capital.
ANNUAL REPORT20 1819
189188
Notes to the Consolidated Financial Statement for the year ended March 31, 2019
(Amounts in D Lakhs, unless otherwise stated)
An associate is an entity over which the Company has significant influence or holding substantial number of shares with voting rights. Significant influence is the power to participate in the financial and operating decisions of the investee. In case of associate, the Company has as such, no control over their policies.
(i) The group combines the financial statements of its Subsidiary company line by line adding together like items of assets, liabilities, equity, income and expenses. Inter-company transactions, balances and unrealized gains on transactions between group companies are eliminated. Unrealized losses are also eliminated unless the transaction provides evidence of an impairment of the transferred asset.
Non-controlling interests in the results and equity of subsidiary company are shown separately in the consolidated statement of profit and loss, consolidated statement of changes in equity and consolidated balance sheet respectively.
(ii) Investments in Associates are accounted for, using equity method of accounting: Under the equity method of accounting, the investments are initially recognised at cost and adjusted thereafter to recognize the group’s share of the post-acquisition profits or losses of the investee in profit and loss, and the group’s share of other comprehensive income of the investee in other comprehensive income. Dividends received or receivable from associates are recognised as a reduction in the carrying amount of the investment. When the group’s share of losses in an equity-accounted investment equals or exceeds its interest in the entity, including any other unsecured long-term receivables, the group does not recognize further losses, unless it has incurred obligations or made payments on behalf of the other entity. Unrealized gains on transactions between the group and its associates are eliminated to the extent of the group’s interest in these entities. Unrealized losses are also eliminated unless the transaction provides evidence of an impairment of the asset transferred. Accounting policies of equity accounted investees have been changed where necessary to ensure consistency with the policies adopted
by the group. The carrying amount of equity accounted investments is tested for impairment in accordance with the policy.
(b) Use of Estimates
The preparation of the consolidated financial statements in conformity with Ind AS requires management to make estimates, judgments and assumptions. These estimates, judgments and assumptions affect the application of accounting policies and the reported amounts of assets and liabilities, the disclosures of contingent assets and liabilities at the date of the consolidated financial statements and reported amounts of revenues and expenses during the period. Application of accounting policies that require critical accounting estimates involving complex and subjective judgments and the use of assumptions in these financial statements have been disclosed in Note 2 annexed to the standalone financial statements.
Accounting estimates could change from period to period. Actual results could differ from those estimates. Appropriate changes in estimates are made as management becomes aware of changes in circumstances surrounding the estimates. Changes in estimates are reflected in the consolidated financial statements in the period in which changes are made and, if material, their effects are disclosed in the notes to the financial statements.
(c) Classification of Assets and Liabilities as Current and Non-Current
All Assets and Liabilities have been classified as current or non-current. Based on the nature of product & activities of the Group and their realization in cash and cash equivalent, the Group has determined its operating cycle as 12 months for the purpose of current and non-current classification of assets and liabilities.
Deferred tax assets and deferred tax liabilities are classified as non-current assets and liabilities.
(d) For significant accounting policies, please refer note no. 1.03 to 1.23 annexed to the standalone financial statements.
(For Note No. 2, Please refer Standalone Financial Statements)
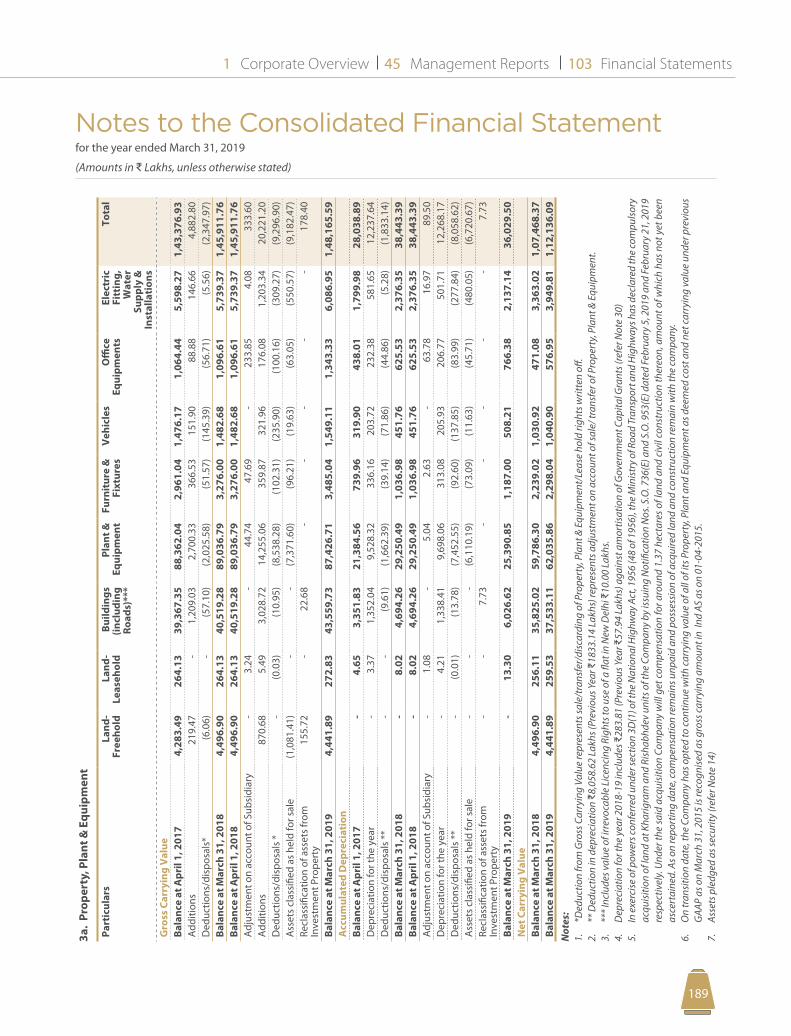
Notes to the Consolidated Financial Statement for the year ended March 31, 2019
(Amounts in D Lakhs, unless otherwise stated)
Corporate Overview Management Reports Financial Statements1 45 103
189188
3a.
Prop
erty
, Pla
nt &
Equ
ipm
ent
Part
icul
ars
Land
-Fr
eeho
ldLa
nd-
Leas
ehol
dBu
ildin
gs
(incl
udin
g Ro
ads)
***
Plan
t &
Equi
pmen
tFu
rnit
ure
&
Fixt
ures
Veh
icle
sO
ffice
Eq
uipm
ents
Elec
tric
Fi
ttin
g,
Wat
er
Supp
ly &
In
stal
lati
ons
Tota
l
Gro
ss C
arry
ing
Val
ue
Bala
nce
at A
pril
1, 2
017
4,2
83.4
9 2
64.1
3 3
9,36
7.35
8
8,36
2.04
2
,961
.04
1,4
76.1
7 1
,064
.44
5,5
98.2
7 1
,43,
376.
93
Add
ition
s 2
19.4
7 -
1,2
09.0
3 2
,700
.33
366
.53
151
.90
88.
88
146
.66
4,8
82.8
0 D
educ
tions
/dis
posa
ls*
(6.0
6) -
(57.
10)
(2,0
25.5
8) (5
1.57
) (1
45.3
9) (5
6.71
) (5
.56)
(2,3
47.9
7)Ba
lanc
e at
Mar
ch 3
1, 2
018
4,4
96.9
0 2
64.1
3 4
0,51
9.28
8
9,03
6.79
3
,276
.00
1,4
82.6
8 1
,096
.61
5,7
39.3
7 1
,45,
911.
76
Bala
nce
at A
pril
1, 2
018
4,4
96.9
0 2
64.1
3 4
0,51
9.28
8
9,03
6.79
3
,276
.00
1,4
82.6
8 1
,096
.61
5,7
39.3
7 1
,45,
911.
76
Adj
ustm
ent o
n ac
coun
t of S
ubsi
diar
y -
3.2
4 -
44.
74
47.
69
- 2
33.8
5 4
.08
333
.60
Add
ition
s 8
70.6
8 5
.49
3,0
28.7
2 1
4,25
5.06
3
59.8
7 3
21.9
6 1
76.0
8 1
,203
.34
20,
221.
20
Ded
uctio
ns/d
ispo
sals
* -
(0.0
3) (1
0.95
) (8
,538
.28)
(102
.31)
(235
.90)
(100
.16)
(309
.27)
(9,2
96.9
0)A
sset
s cl
assi
fied
as h
eld
for s
ale
(1,0
81.4
1) -
- (7
,371
.60)
(96.
21)
(19.
63)
(63.
05)
(550
.57)
(9,1
82.4
7)Re
clas
sific
atio
n of
ass
ets
from
In
vest
men
t Pro
pert
y 1
55.7
2 -
22.
68
- -
- -
- 1
78.4
0
Bala
nce
at M
arch
31,
201
9 4
,441
.89
272
.83
43,
559.
73
87,
426.
71
3,4
85.0
4 1
,549
.11
1,3
43.3
3 6
,086
.95
1,4
8,16
5.59
A
ccum
ulat
ed D
epre
ciat
ion
Bala
nce
at A
pril
1, 2
017
- 4
.65
3,3
51.8
3 2
1,38
4.56
7
39.9
6 3
19.9
0 4
38.0
1 1
,799
.98
28,
038.
89
Dep
reci
atio
n fo
r the
yea
r -
3.3
7 1
,352
.04
9,5
28.3
2 3
36.1
6 2
03.7
2 2
32.3
8 5
81.6
5 1
2,23
7.64
D
educ
tions
/dis
posa
ls *
* -
- (9
.61)
(1,6
62.3
9) (3
9.14
) (7
1.86
) (4
4.86
) (5
.28)
(1,8
33.1
4)Ba
lanc
e at
Mar
ch 3
1, 2
018
- 8
.02
4,6
94.2
6 2
9,25
0.49
1
,036
.98
451
.76
625
.53
2,3
76.3
5 3
8,44
3.39
Ba
lanc
e at
Apr
il 1,
201
8 -
8.0
2 4
,694
.26
29,
250.
49
1,0
36.9
8 4
51.7
6 6
25.5
3 2
,376
.35
38,
443.
39
Adj
ustm
ent o
n ac
coun
t of S
ubsi
diar
y -
1.0
8 -
5.0
4 2
.63
- 6
3.78
1
6.97
8
9.50
D
epre
ciat
ion
for t
he y
ear
- 4
.21
1,3
38.4
1 9
,698
.06
313
.08
205
.93
206
.77
501
.71
12,
268.
17
Ded
uctio
ns/d
ispo
sals
**
- (0
.01)
(13.
78)
(7,4
52.5
5) (9
2.60
) (1
37.8
5) (8
3.99
) (2
77.8
4) (8
,058
.62)
Ass
ets
clas
sifie
d as
hel
d fo
r sal
e -
- -
(6,1
10.1
9) (7
3.09
) (1
1.63
) (4
5.71
) (4
80.0
5) (6
,720
.67)
Recl
assi
ficat
ion
of a
sset
s fr
om
Inve
stm
ent P
rope
rty
- -
7.7
3 -
- -
- -
7.7
3
Bala
nce
at M
arch
31,
201
9 -
13.
30
6,0
26.6
2 2
5,39
0.85
1
,187
.00
508
.21
766
.38
2,1
37.1
4 3
6,02
9.50
N
et C
arry
ing
Val
ueBa
lanc
e at
Mar
ch 3
1, 2
018
4,4
96.9
0 2
56.1
1 3
5,82
5.02
5
9,78
6.30
2
,239
.02
1,0
30.9
2 4
71.0
8 3
,363
.02
1,0
7,46
8.37
Ba
lanc
e at
Mar
ch 3
1, 2
019
4,4
41.8
9 2
59.5
3 3
7,53
3.11
6
2,03
5.86
2
,298
.04
1,0
40.9
0 5
76.9
5 3
,949
.81
1,1
2,13
6.09
Not
es:
1.
*Ded
uctio
n fro
m G
ross
Car
ryin
g Va
lue
repr
esen
ts sa
le/t
rans
fer/
disc
ardi
ng o
f Pro
pert
y, P
lant
& E
quip
men
t/Le
ase
hold
righ
ts w
ritte
n off
.2.
**
Ded
uctio
n in
dep
reci
atio
n D
8,05
8.62
Lak
hs (P
revi
ous Y
ear D
1833
.14
Lakh
s) re
pres
ents
adj
ustm
ent o
n ac
coun
t of s
ale/
tran
sfer
of P
rope
rty,
Pla
nt &
Equ
ipm
ent.
3.
*** I
nclu
des v
alue
of i
rrev
ocab
le L
icen
cing
Rig
hts t
o us
e of
a fl
at in
New
Del
hi D
10.0
0 La
khs.
4.
Dep
reci
atio
n fo
r the
yea
r 201
8-19
incl
udes
D28
3.81
(Pre
viou
s Yea
r D57
.94
Lakh
s) a
gain
st a
mor
tisat
ion
of G
over
nmen
t Cap
ital G
rant
s (re
fer N
ote
30)
5.
In e
xerc
ise
of p
ower
s con
ferr
ed u
nder
sect
ion
3D(1
) of t
he N
atio
nal H
ighw
ay A
ct, 1
956
(48
of 1
956)
, the
Min
istr
y of
Roa
d Tr
ansp
ort a
nd H
ighw
ays h
as d
ecla
red
the
com
puls
ory
acqu
isiti
on o
f lan
d at
Kha
rigra
m a
nd R
isha
bhde
v un
its o
f the
Com
pany
by
issu
ing
Not
ifica
tion
Nos
. S.O
. 736
(E) a
nd S
.O. 9
53(E
) dat
ed F
ebru
ary
5, 2
019
and
Febr
uary
21,
201
9 re
spec
tivel
y. U
nder
the
said
acq
uisi
tion
Com
pany
will
get
com
pens
atio
n fo
r aro
und
1.37
hec
tare
s of l
and
and
civi
l con
stru
ctio
n th
ereo
n, a
mou
nt o
f whi
ch h
as n
ot y
et b
een
asce
rtai
ned.
As o
n re
port
ing
date
, com
pens
atio
n re
mai
ns u
npai
d an
d po
sses
sion
of a
cqui
red
land
and
cons
truc
tion
rem
ain
with
the
com
pany
.6.
O
n tr
ansi
tion
date
, the
Com
pany
has
opt
ed to
con
tinue
with
carr
ying
val
ue o
f all
of it
s Pro
pert
y, P
lant
and
Equ
ipm
ent a
s dee
med
cos
t and
net
carr
ying
val
ue u
nder
pre
viou
s G
AAP
as o
n M
arch
31,
201
5 is
reco
gnis
ed a
s gro
ss ca
rryi
ng a
mou
nt in
Ind
AS a
s on
01-0
4-20
15.
7.
Asse
ts p
ledg
ed a
s sec
urity
(ref
er N
ote
14)
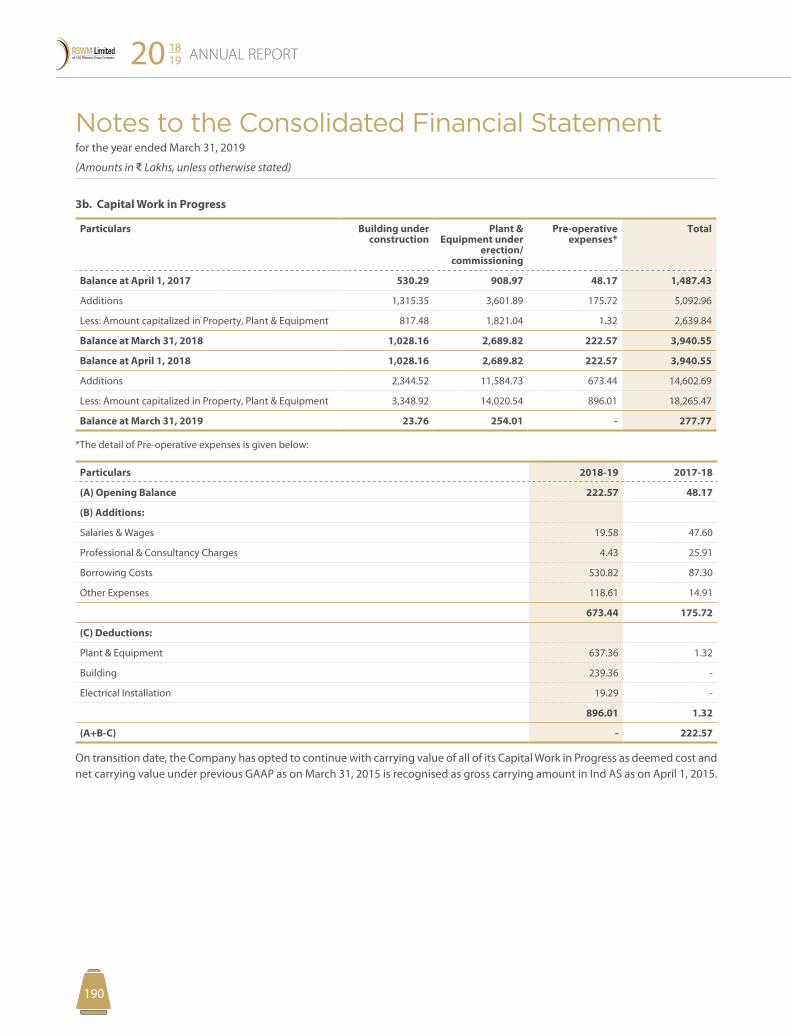
Notes to the Consolidated Financial Statement for the year ended March 31, 2019
(Amounts in D Lakhs, unless otherwise stated)
ANNUAL REPORT20 1819
191190
3b. Capital Work in Progress
Particulars Building under construction
Plant & Equipment under
erection/ commissioning
Pre-operative expenses*
Total
Balance at April 1, 2017 530.29 908.97 48.17 1,487.43
Additions 1,315.35 3,601.89 175.72 5,092.96
Less: Amount capitalized in Property, Plant & Equipment 817.48 1,821.04 1.32 2,639.84
Balance at March 31, 2018 1,028.16 2,689.82 222.57 3,940.55
Balance at April 1, 2018 1,028.16 2,689.82 222.57 3,940.55
Additions 2,344.52 11,584.73 673.44 14,602.69
Less: Amount capitalized in Property, Plant & Equipment 3,348.92 14,020.54 896.01 18,265.47
Balance at March 31, 2019 23.76 254.01 - 277.77
*The detail of Pre-operative expenses is given below:
Particulars 2018-19 2017-18
(A) Opening Balance 222.57 48.17
(B) Additions:
Salaries & Wages 19.58 47.60
Professional & Consultancy Charges 4.43 25.91
Borrowing Costs 530.82 87.30
Other Expenses 118.61 14.91
673.44 175.72
(C) Deductions:
Plant & Equipment 637.36 1.32
Building 239.36 -
Electrical Installation 19.29 -
896.01 1.32
(A+B-C) - 222.57
On transition date, the Company has opted to continue with carrying value of all of its Capital Work in Progress as deemed cost and net carrying value under previous GAAP as on March 31, 2015 is recognised as gross carrying amount in Ind AS as on April 1, 2015.
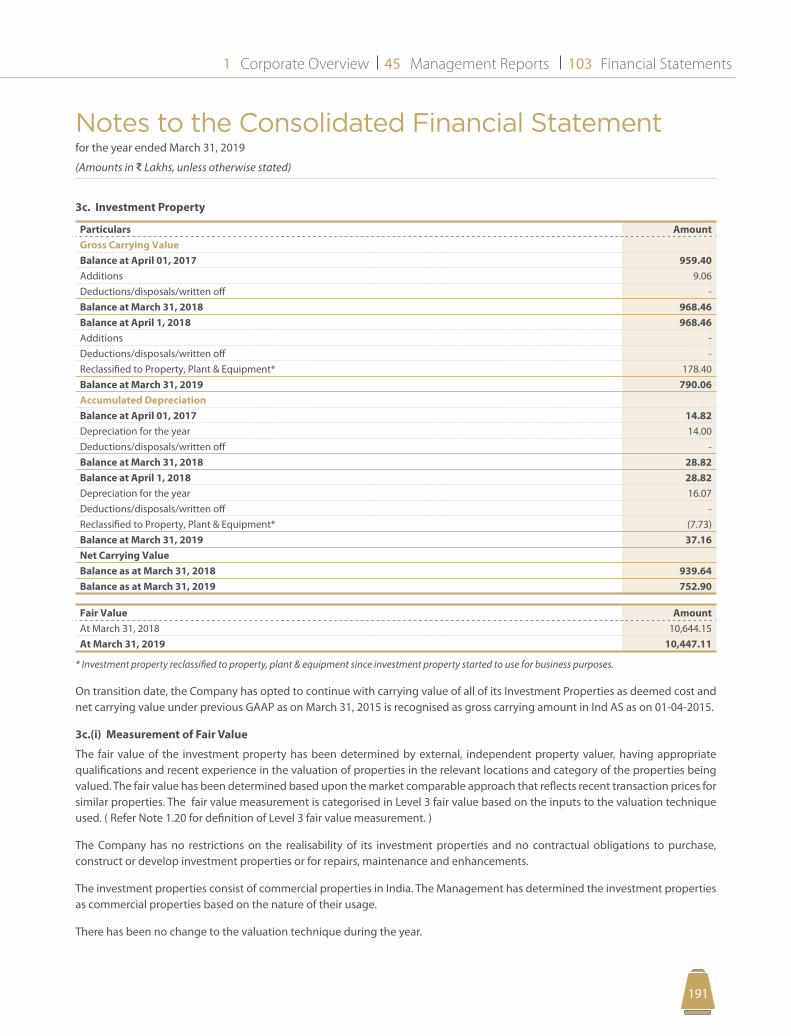
Notes to the Consolidated Financial Statement for the year ended March 31, 2019
(Amounts in D Lakhs, unless otherwise stated)
Corporate Overview Management Reports Financial Statements1 45 103
191190
3c. Investment Property
Particulars AmountGross Carrying ValueBalance at April 01, 2017 959.40 Additions 9.06 Deductions/disposals/written off - Balance at March 31, 2018 968.46 Balance at April 1, 2018 968.46 Additions - Deductions/disposals/written off - Reclassified to Property, Plant & Equipment* 178.40 Balance at March 31, 2019 790.06 Accumulated DepreciationBalance at April 01, 2017 14.82 Depreciation for the year 14.00 Deductions/disposals/written off - Balance at March 31, 2018 28.82 Balance at April 1, 2018 28.82 Depreciation for the year 16.07 Deductions/disposals/written off - Reclassified to Property, Plant & Equipment* (7.73)Balance at March 31, 2019 37.16 Net Carrying ValueBalance as at March 31, 2018 939.64 Balance as at March 31, 2019 752.90
Fair Value AmountAt March 31, 2018 10,644.15 At March 31, 2019 10,447.11
* Investment property reclassified to property, plant & equipment since investment property started to use for business purposes.
On transition date, the Company has opted to continue with carrying value of all of its Investment Properties as deemed cost and net carrying value under previous GAAP as on March 31, 2015 is recognised as gross carrying amount in Ind AS as on 01-04-2015.
3c.(i) Measurement of Fair Value
The fair value of the investment property has been determined by external, independent property valuer, having appropriate qualifications and recent experience in the valuation of properties in the relevant locations and category of the properties being valued. The fair value has been determined based upon the market comparable approach that reflects recent transaction prices for similar properties. The fair value measurement is categorised in Level 3 fair value based on the inputs to the valuation technique used. ( Refer Note 1.20 for definition of Level 3 fair value measurement. )
The Company has no restrictions on the realisability of its investment properties and no contractual obligations to purchase, construct or develop investment properties or for repairs, maintenance and enhancements.
The investment properties consist of commercial properties in India. The Management has determined the investment properties as commercial properties based on the nature of their usage.
There has been no change to the valuation technique during the year.
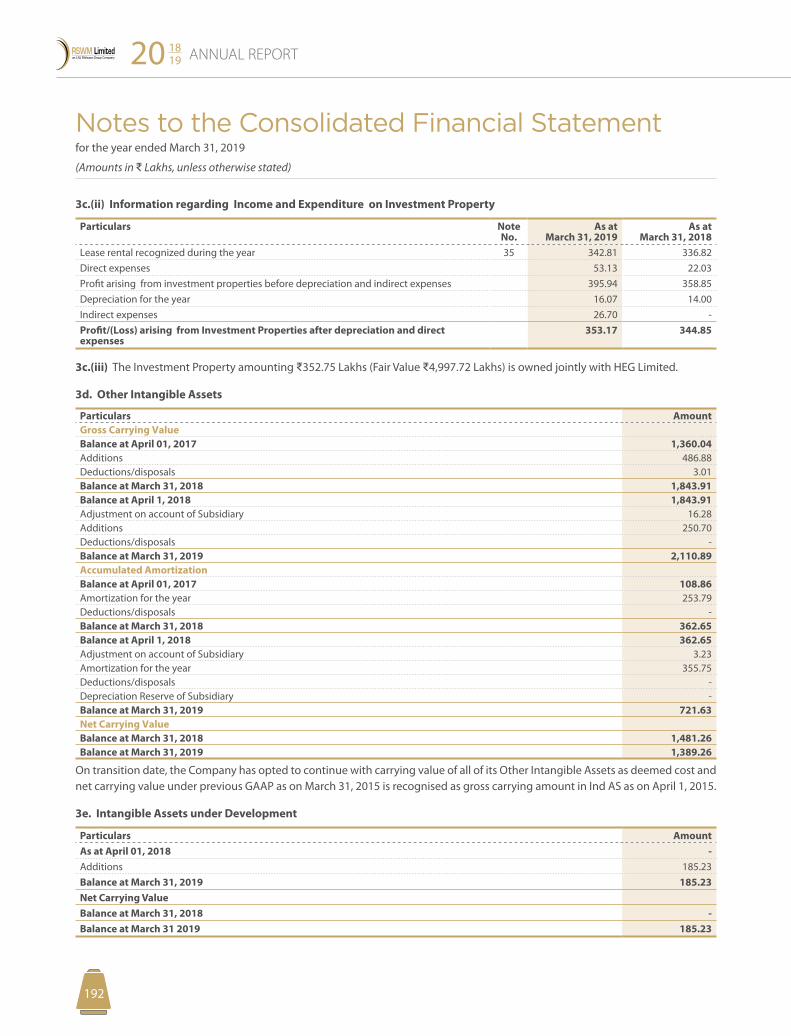
Notes to the Consolidated Financial Statement for the year ended March 31, 2019
(Amounts in D Lakhs, unless otherwise stated)
ANNUAL REPORT20 1819
193192
3c.(ii) Information regarding Income and Expenditure on Investment Property
Particulars Note No.
As at March 31, 2019
As at March 31, 2018
Lease rental recognized during the year 35 342.81 336.82Direct expenses 53.13 22.03 Profit arising from investment properties before depreciation and indirect expenses 395.94 358.85Depreciation for the year 16.07 14.00 Indirect expenses 26.70 - Profit/(Loss) arising from Investment Properties after depreciation and direct expenses
353.17 344.85
3c.(iii) The Investment Property amounting D352.75 Lakhs (Fair Value D4,997.72 Lakhs) is owned jointly with HEG Limited.
3d. Other Intangible Assets
Particulars AmountGross Carrying ValueBalance at April 01, 2017 1,360.04 Additions 486.88 Deductions/disposals 3.01 Balance at March 31, 2018 1,843.91 Balance at April 1, 2018 1,843.91 Adjustment on account of Subsidiary 16.28 Additions 250.70 Deductions/disposals - Balance at March 31, 2019 2,110.89 Accumulated AmortizationBalance at April 01, 2017 108.86 Amortization for the year 253.79 Deductions/disposals - Balance at March 31, 2018 362.65 Balance at April 1, 2018 362.65 Adjustment on account of Subsidiary 3.23 Amortization for the year 355.75 Deductions/disposals - Depreciation Reserve of Subsidiary -Balance at March 31, 2019 721.63 Net Carrying ValueBalance at March 31, 2018 1,481.26 Balance at March 31, 2019 1,389.26
On transition date, the Company has opted to continue with carrying value of all of its Other Intangible Assets as deemed cost and net carrying value under previous GAAP as on March 31, 2015 is recognised as gross carrying amount in Ind AS as on April 1, 2015.
3e. Intangible Assets under Development
Particulars AmountAs at April 01, 2018 - Additions 185.23Balance at March 31, 2019 185.23Net Carrying ValueBalance at March 31, 2018 - Balance at March 31 2019 185.23
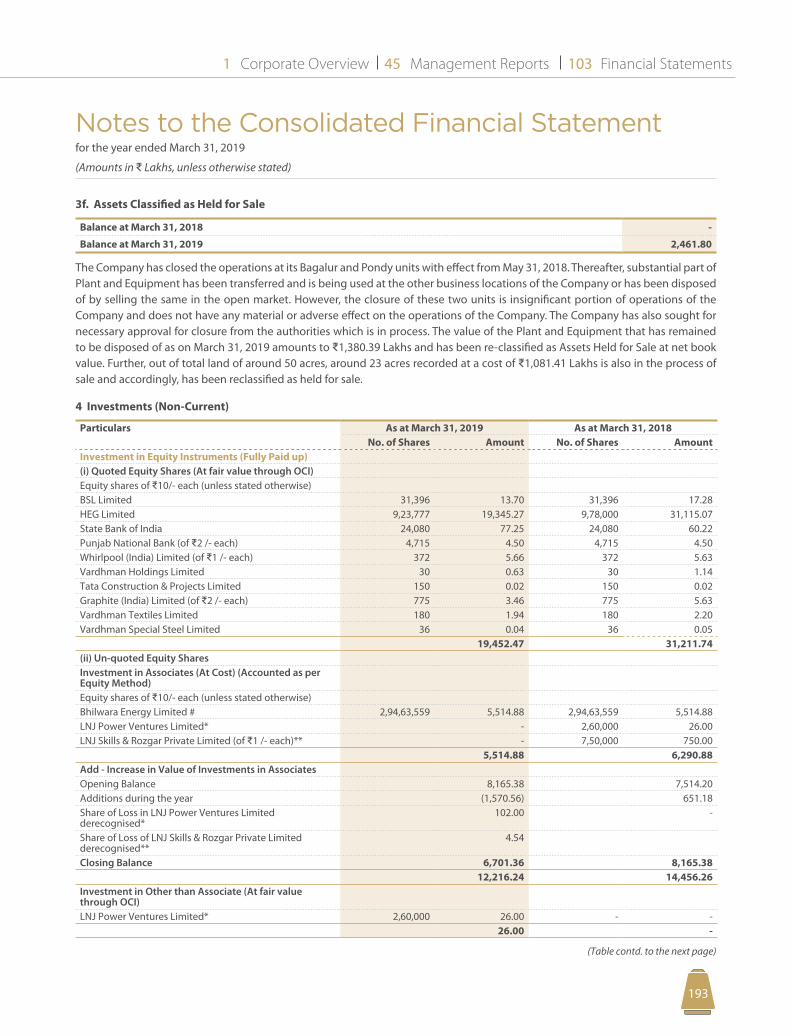
Notes to the Consolidated Financial Statement for the year ended March 31, 2019
(Amounts in D Lakhs, unless otherwise stated)
Corporate Overview Management Reports Financial Statements1 45 103
193192
3f. Assets Classified as Held for Sale
Balance at March 31, 2018 -
Balance at March 31, 2019 2,461.80
The Company has closed the operations at its Bagalur and Pondy units with effect from May 31, 2018. Thereafter, substantial part of Plant and Equipment has been transferred and is being used at the other business locations of the Company or has been disposed of by selling the same in the open market. However, the closure of these two units is insignificant portion of operations of the Company and does not have any material or adverse effect on the operations of the Company. The Company has also sought for necessary approval for closure from the authorities which is in process. The value of the Plant and Equipment that has remained to be disposed of as on March 31, 2019 amounts to D1,380.39 Lakhs and has been re-classified as Assets Held for Sale at net book value. Further, out of total land of around 50 acres, around 23 acres recorded at a cost of D1,081.41 Lakhs is also in the process of sale and accordingly, has been reclassified as held for sale.
4 Investments (Non-Current)
Particulars As at March 31, 2019 As at March 31, 2018No. of Shares Amount No. of Shares Amount
Investment in Equity Instruments (Fully Paid up)(i) Quoted Equity Shares (At fair value through OCI)Equity shares of D10/- each (unless stated otherwise)BSL Limited 31,396 13.70 31,396 17.28 HEG Limited 9,23,777 19,345.27 9,78,000 31,115.07 State Bank of India 24,080 77.25 24,080 60.22 Punjab National Bank (of D2 /- each) 4,715 4.50 4,715 4.50 Whirlpool (India) Limited (of D1 /- each) 372 5.66 372 5.63 Vardhman Holdings Limited 30 0.63 30 1.14 Tata Construction & Projects Limited 150 0.02 150 0.02 Graphite (India) Limited (of D2 /- each) 775 3.46 775 5.63 Vardhman Textiles Limited 180 1.94 180 2.20 Vardhman Special Steel Limited 36 0.04 36 0.05
19,452.47 31,211.74 (ii) Un-quoted Equity SharesInvestment in Associates (At Cost) (Accounted as per Equity Method)Equity shares of D10/- each (unless stated otherwise)Bhilwara Energy Limited # 2,94,63,559 5,514.88 2,94,63,559 5,514.88 LNJ Power Ventures Limited* - 2,60,000 26.00 LNJ Skills & Rozgar Private Limited (of D1 /- each)** - 7,50,000 750.00
5,514.88 6,290.88 Add - Increase in Value of Investments in AssociatesOpening Balance 8,165.38 7,514.20 Additions during the year (1,570.56) 651.18 Share of Loss in LNJ Power Ventures Limited derecognised*
102.00 -
Share of Loss of LNJ Skills & Rozgar Private Limited derecognised**
4.54
Closing Balance 6,701.36 8,165.38 12,216.24 14,456.26
Investment in Other than Associate (At fair value through OCI)LNJ Power Ventures Limited* 2,60,000 26.00 - -
26.00 -
(Table contd. to the next page)
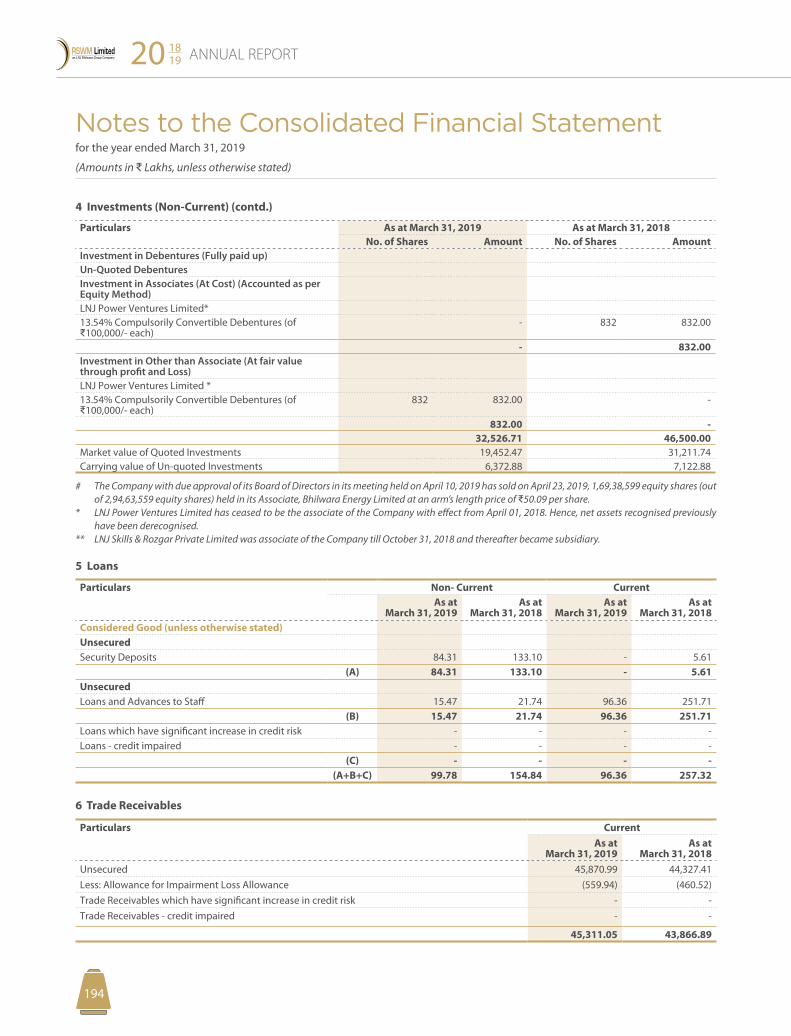
Notes to the Consolidated Financial Statement for the year ended March 31, 2019
(Amounts in D Lakhs, unless otherwise stated)
ANNUAL REPORT20 1819
195194
4 Investments (Non-Current) (contd.)
Particulars As at March 31, 2019 As at March 31, 2018No. of Shares Amount No. of Shares Amount
Investment in Debentures (Fully paid up)Un-Quoted DebenturesInvestment in Associates (At Cost) (Accounted as per Equity Method)LNJ Power Ventures Limited*13.54% Compulsorily Convertible Debentures (of D100,000/- each)
- 832 832.00
- 832.00 Investment in Other than Associate (At fair value through profit and Loss)LNJ Power Ventures Limited *13.54% Compulsorily Convertible Debentures (of D100,000/- each)
832 832.00 -
832.00 - 32,526.71 46,500.00
Market value of Quoted Investments 19,452.47 31,211.74 Carrying value of Un-quoted Investments 6,372.88 7,122.88
# The Company with due approval of its Board of Directors in its meeting held on April 10, 2019 has sold on April 23, 2019, 1,69,38,599 equity shares (out of 2,94,63,559 equity shares) held in its Associate, Bhilwara Energy Limited at an arm’s length price of D50.09 per share.
* LNJ Power Ventures Limited has ceased to be the associate of the Company with effect from April 01, 2018. Hence, net assets recognised previously have been derecognised.
** LNJ Skills & Rozgar Private Limited was associate of the Company till October 31, 2018 and thereafter became subsidiary.
5 Loans
Particulars Non- Current CurrentAs at
March 31, 2019As at
March 31, 2018As at
March 31, 2019As at
March 31, 2018Considered Good (unless otherwise stated)UnsecuredSecurity Deposits 84.31 133.10 - 5.61
(A) 84.31 133.10 - 5.61 UnsecuredLoans and Advances to Staff 15.47 21.74 96.36 251.71
(B) 15.47 21.74 96.36 251.71 Loans which have significant increase in credit risk - - - - Loans - credit impaired - - - -
(C) - - - - (A+B+C) 99.78 154.84 96.36 257.32
6 Trade Receivables
Particulars CurrentAs at
March 31, 2019As at
March 31, 2018Unsecured 45,870.99 44,327.41 Less: Allowance for Impairment Loss Allowance (559.94) (460.52)Trade Receivables which have significant increase in credit risk - - Trade Receivables - credit impaired - -
45,311.05 43,866.89
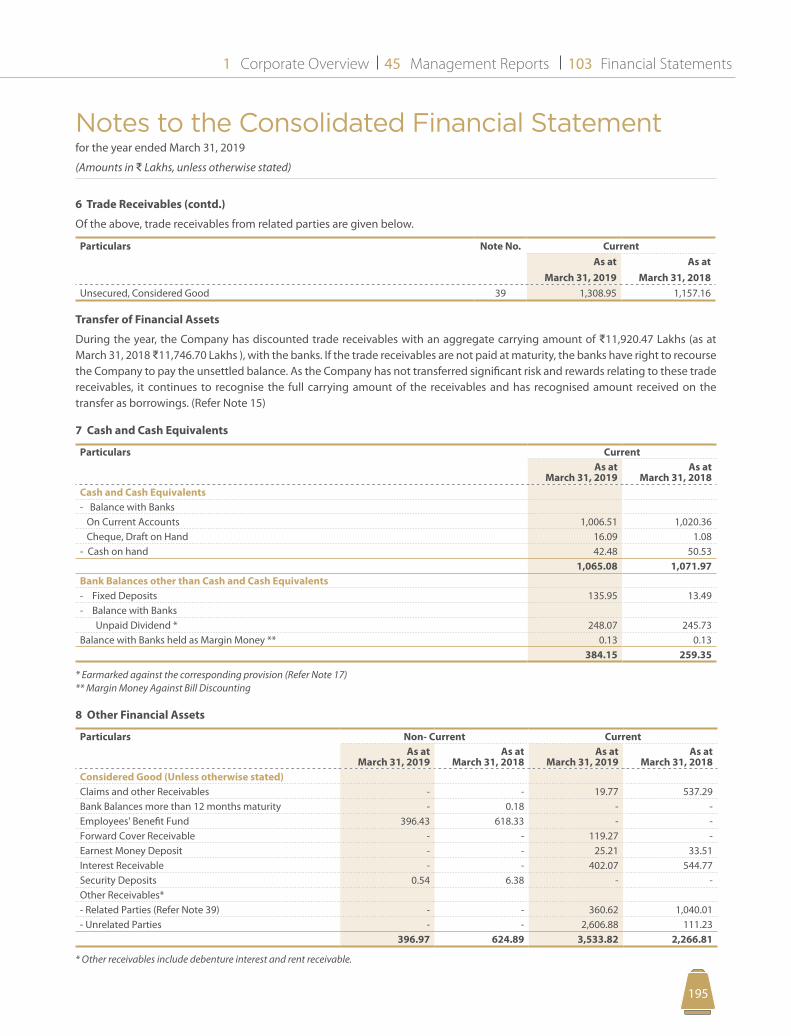
Notes to the Consolidated Financial Statement for the year ended March 31, 2019
(Amounts in D Lakhs, unless otherwise stated)
Corporate Overview Management Reports Financial Statements1 45 103
195194
6 Trade Receivables (contd.)
Of the above, trade receivables from related parties are given below.
Particulars Note No. Current As at
March 31, 2019As at
March 31, 2018Unsecured, Considered Good 39 1,308.95 1,157.16
Transfer of Financial Assets
During the year, the Company has discounted trade receivables with an aggregate carrying amount of D11,920.47 Lakhs (as at March 31, 2018 D11,746.70 Lakhs ), with the banks. If the trade receivables are not paid at maturity, the banks have right to recourse the Company to pay the unsettled balance. As the Company has not transferred significant risk and rewards relating to these trade receivables, it continues to recognise the full carrying amount of the receivables and has recognised amount received on the transfer as borrowings. (Refer Note 15)
7 Cash and Cash Equivalents
Particulars CurrentAs at
March 31, 2019As at
March 31, 2018Cash and Cash Equivalents- Balance with Banks On Current Accounts 1,006.51 1,020.36 Cheque, Draft on Hand 16.09 1.08 - Cash on hand 42.48 50.53
1,065.08 1,071.97 Bank Balances other than Cash and Cash Equivalents- Fixed Deposits 135.95 13.49 - Balance with Banks Unpaid Dividend * 248.07 245.73 Balance with Banks held as Margin Money ** 0.13 0.13
384.15 259.35
* Earmarked against the corresponding provision (Refer Note 17)** Margin Money Against Bill Discounting
8 Other Financial Assets
Particulars Non- Current CurrentAs at
March 31, 2019As at
March 31, 2018As at
March 31, 2019As at
March 31, 2018Considered Good (Unless otherwise stated)Claims and other Receivables - - 19.77 537.29 Bank Balances more than 12 months maturity - 0.18 - - Employees' Benefit Fund 396.43 618.33 - - Forward Cover Receivable - - 119.27 - Earnest Money Deposit - - 25.21 33.51 Interest Receivable - - 402.07 544.77 Security Deposits 0.54 6.38 - - Other Receivables* - Related Parties (Refer Note 39) - - 360.62 1,040.01 - Unrelated Parties - - 2,606.88 111.23
396.97 624.89 3,533.82 2,266.81
* Other receivables include debenture interest and rent receivable.
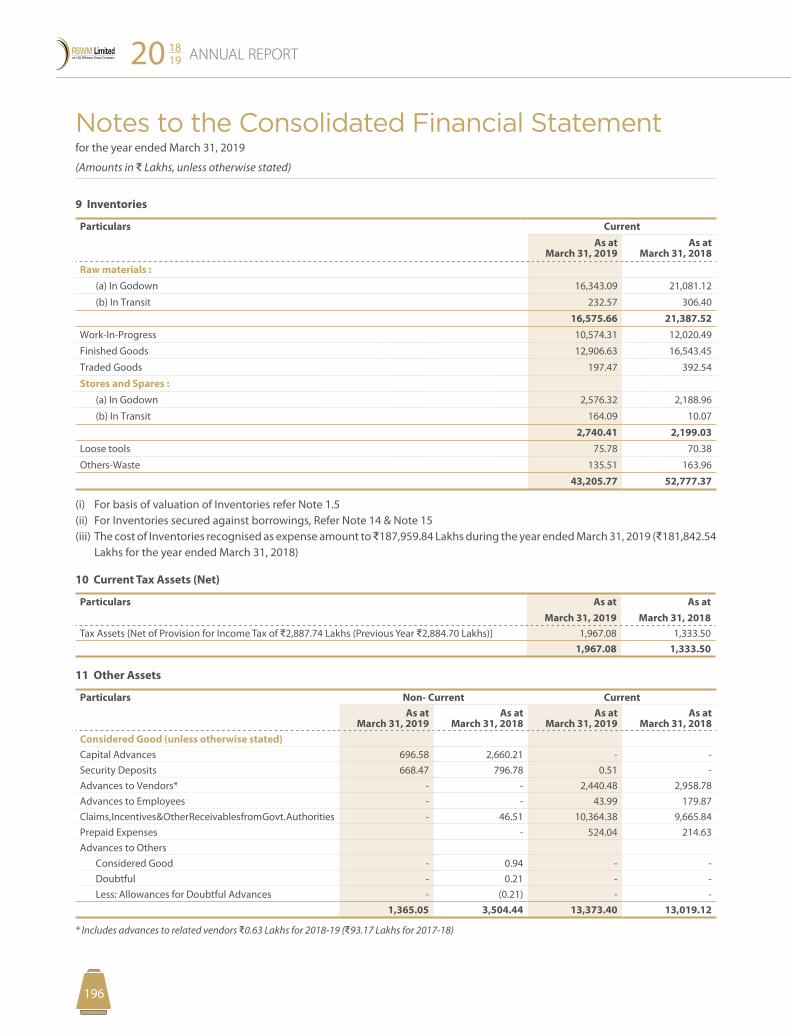
Notes to the Consolidated Financial Statement for the year ended March 31, 2019
(Amounts in D Lakhs, unless otherwise stated)
ANNUAL REPORT20 1819
197196
9 Inventories
Particulars CurrentAs at
March 31, 2019As at
March 31, 2018Raw materials : (a) In Godown 16,343.09 21,081.12
(b) In Transit 232.57 306.40
16,575.66 21,387.52 Work-In-Progress 10,574.31 12,020.49
Finished Goods 12,906.63 16,543.45
Traded Goods 197.47 392.54
Stores and Spares : (a) In Godown 2,576.32 2,188.96
(b) In Transit 164.09 10.07
2,740.41 2,199.03 Loose tools 75.78 70.38
Others-Waste 135.51 163.96
43,205.77 52,777.37
(i) For basis of valuation of Inventories refer Note 1.5(ii) For Inventories secured against borrowings, Refer Note 14 & Note 15(iii) The cost of Inventories recognised as expense amount to D187,959.84 Lakhs during the year ended March 31, 2019 (D181,842.54
Lakhs for the year ended March 31, 2018)
10 Current Tax Assets (Net)
Particulars As at March 31, 2019
As at March 31, 2018
Tax Assets {Net of Provision for Income Tax of D2,887.74 Lakhs (Previous Year D2,884.70 Lakhs)} 1,967.08 1,333.50 1,967.08 1,333.50
11 Other Assets
Particulars Non- Current CurrentAs at
March 31, 2019As at
March 31, 2018As at
March 31, 2019As at
March 31, 2018Considered Good (unless otherwise stated)Capital Advances 696.58 2,660.21 - - Security Deposits 668.47 796.78 0.51 - Advances to Vendors* - - 2,440.48 2,958.78 Advances to Employees - - 43.99 179.87 Claims, Incentives & Other Receivables from Govt. Authorities - 46.51 10,364.38 9,665.84 Prepaid Expenses - 524.04 214.63 Advances to Others Considered Good - 0.94 - - Doubtful - 0.21 - - Less: Allowances for Doubtful Advances - (0.21) - -
1,365.05 3,504.44 13,373.40 13,019.12
* Includes advances to related vendors D0.63 Lakhs for 2018-19 (D93.17 Lakhs for 2017-18)
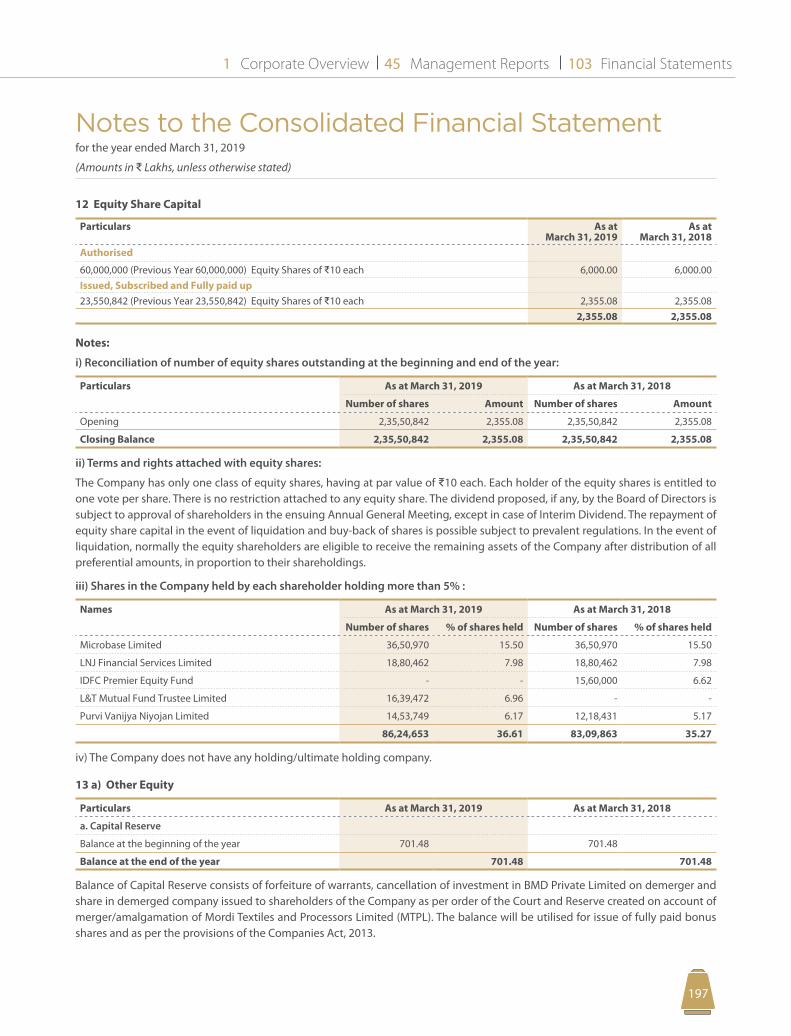
Notes to the Consolidated Financial Statement for the year ended March 31, 2019
(Amounts in D Lakhs, unless otherwise stated)
Corporate Overview Management Reports Financial Statements1 45 103
197196
12 Equity Share Capital
Particulars As at March 31, 2019
As at March 31, 2018
Authorised
60,000,000 (Previous Year 60,000,000) Equity Shares of D10 each 6,000.00 6,000.00 Issued, Subscribed and Fully paid up23,550,842 (Previous Year 23,550,842) Equity Shares of D10 each 2,355.08 2,355.08
2,355.08 2,355.08
Notes:
i) Reconciliation of number of equity shares outstanding at the beginning and end of the year:
Particulars As at March 31, 2019 As at March 31, 2018
Number of shares Amount Number of shares Amount
Opening 2,35,50,842 2,355.08 2,35,50,842 2,355.08
Closing Balance 2,35,50,842 2,355.08 2,35,50,842 2,355.08
ii) Terms and rights attached with equity shares:
The Company has only one class of equity shares, having at par value of D10 each. Each holder of the equity shares is entitled to one vote per share. There is no restriction attached to any equity share. The dividend proposed, if any, by the Board of Directors is subject to approval of shareholders in the ensuing Annual General Meeting, except in case of Interim Dividend. The repayment of equity share capital in the event of liquidation and buy-back of shares is possible subject to prevalent regulations. In the event of liquidation, normally the equity shareholders are eligible to receive the remaining assets of the Company after distribution of all preferential amounts, in proportion to their shareholdings.
iii) Shares in the Company held by each shareholder holding more than 5% :
Names As at March 31, 2019 As at March 31, 2018
Number of shares % of shares held Number of shares % of shares held
Microbase Limited 36,50,970 15.50 36,50,970 15.50
LNJ Financial Services Limited 18,80,462 7.98 18,80,462 7.98
IDFC Premier Equity Fund - - 15,60,000 6.62
L&T Mutual Fund Trustee Limited 16,39,472 6.96 - -
Purvi Vanijya Niyojan Limited 14,53,749 6.17 12,18,431 5.17
86,24,653 36.61 83,09,863 35.27
iv) The Company does not have any holding/ultimate holding company.
13 a) Other Equity
Particulars As at March 31, 2019 As at March 31, 2018
a. Capital Reserve
Balance at the beginning of the year 701.48 701.48
Balance at the end of the year 701.48 701.48
Balance of Capital Reserve consists of forfeiture of warrants, cancellation of investment in BMD Private Limited on demerger and share in demerged company issued to shareholders of the Company as per order of the Court and Reserve created on account of merger/amalgamation of Mordi Textiles and Processors Limited (MTPL). The balance will be utilised for issue of fully paid bonus shares and as per the provisions of the Companies Act, 2013.
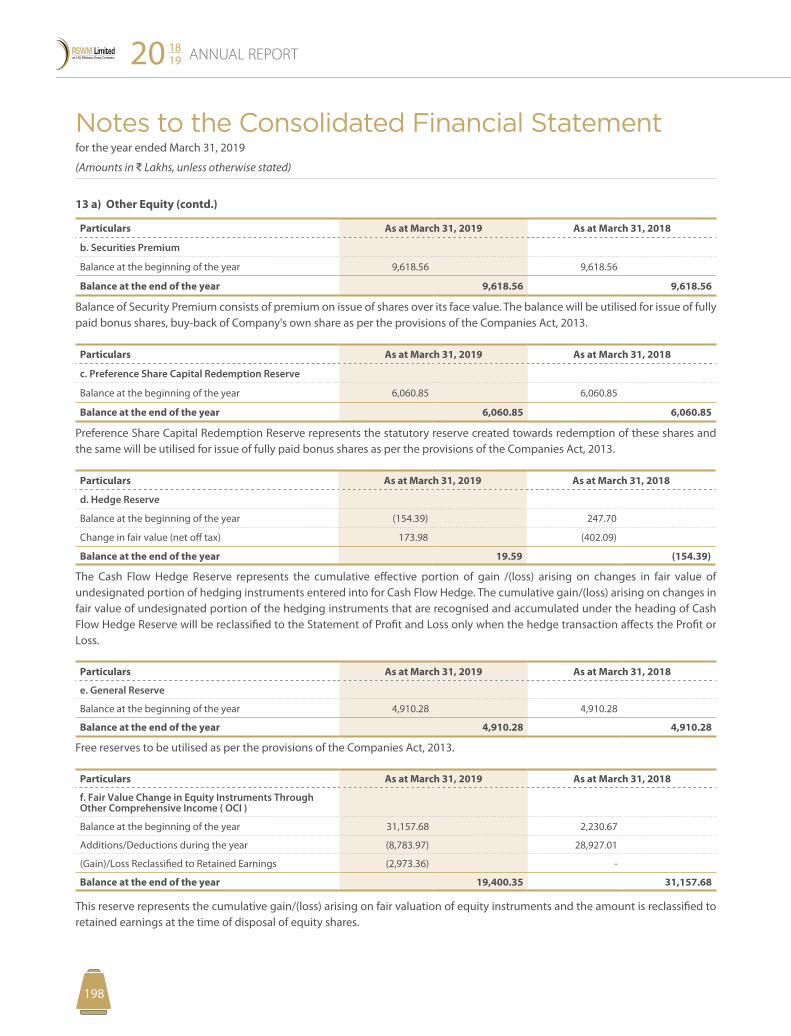
Notes to the Consolidated Financial Statement for the year ended March 31, 2019
(Amounts in D Lakhs, unless otherwise stated)
ANNUAL REPORT20 1819
199198
13 a) Other Equity (contd.)
Particulars As at March 31, 2019 As at March 31, 2018
b. Securities Premium
Balance at the beginning of the year 9,618.56 9,618.56
Balance at the end of the year 9,618.56 9,618.56
Balance of Security Premium consists of premium on issue of shares over its face value. The balance will be utilised for issue of fully paid bonus shares, buy-back of Company's own share as per the provisions of the Companies Act, 2013.
Particulars As at March 31, 2019 As at March 31, 2018
c. Preference Share Capital Redemption Reserve
Balance at the beginning of the year 6,060.85 6,060.85
Balance at the end of the year 6,060.85 6,060.85
Preference Share Capital Redemption Reserve represents the statutory reserve created towards redemption of these shares and the same will be utilised for issue of fully paid bonus shares as per the provisions of the Companies Act, 2013.
Particulars As at March 31, 2019 As at March 31, 2018
d. Hedge Reserve
Balance at the beginning of the year (154.39) 247.70
Change in fair value (net off tax) 173.98 (402.09)
Balance at the end of the year 19.59 (154.39)
The Cash Flow Hedge Reserve represents the cumulative effective portion of gain /(loss) arising on changes in fair value of undesignated portion of hedging instruments entered into for Cash Flow Hedge. The cumulative gain/(loss) arising on changes in fair value of undesignated portion of the hedging instruments that are recognised and accumulated under the heading of Cash Flow Hedge Reserve will be reclassified to the Statement of Profit and Loss only when the hedge transaction affects the Profit or Loss.
Particulars As at March 31, 2019 As at March 31, 2018
e. General Reserve
Balance at the beginning of the year 4,910.28 4,910.28
Balance at the end of the year 4,910.28 4,910.28
Free reserves to be utilised as per the provisions of the Companies Act, 2013.
Particulars As at March 31, 2019 As at March 31, 2018
f. Fair Value Change in Equity Instruments Through Other Comprehensive Income ( OCI )
Balance at the beginning of the year 31,157.68 2,230.67
Additions/Deductions during the year (8,783.97) 28,927.01
(Gain)/Loss Reclassified to Retained Earnings (2,973.36) -
Balance at the end of the year 19,400.35 31,157.68
This reserve represents the cumulative gain/(loss) arising on fair valuation of equity instruments and the amount is reclassified to retained earnings at the time of disposal of equity shares.
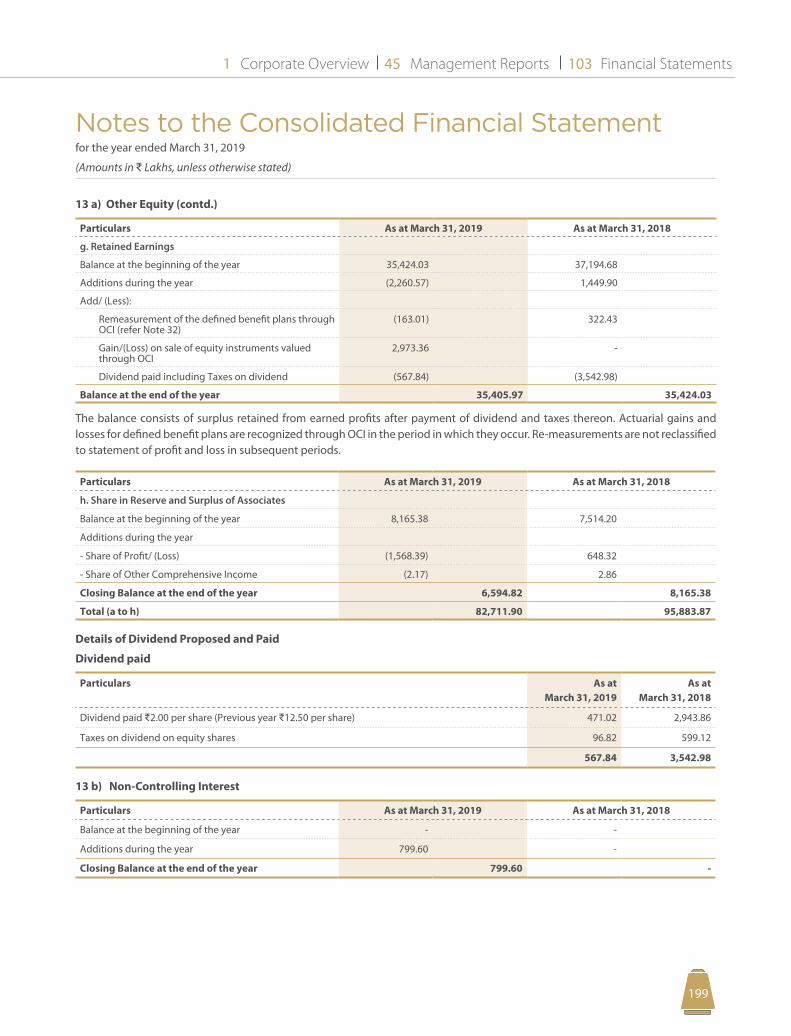
Notes to the Consolidated Financial Statement for the year ended March 31, 2019
(Amounts in D Lakhs, unless otherwise stated)
Corporate Overview Management Reports Financial Statements1 45 103
199198
13 a) Other Equity (contd.)
Particulars As at March 31, 2019 As at March 31, 2018
g. Retained Earnings
Balance at the beginning of the year 35,424.03 37,194.68
Additions during the year (2,260.57) 1,449.90
Add/ (Less):
Remeasurement of the defined benefit plans through OCI (refer Note 32)
(163.01) 322.43
Gain/(Loss) on sale of equity instruments valued through OCI
2,973.36 -
Dividend paid including Taxes on dividend (567.84) (3,542.98)
Balance at the end of the year 35,405.97 35,424.03
The balance consists of surplus retained from earned profits after payment of dividend and taxes thereon. Actuarial gains and losses for defined benefit plans are recognized through OCI in the period in which they occur. Re-measurements are not reclassified to statement of profit and loss in subsequent periods.
Particulars As at March 31, 2019 As at March 31, 2018
h. Share in Reserve and Surplus of Associates
Balance at the beginning of the year 8,165.38 7,514.20
Additions during the year
- Share of Profit/ (Loss) (1,568.39) 648.32
- Share of Other Comprehensive Income (2.17) 2.86
Closing Balance at the end of the year 6,594.82 8,165.38
Total (a to h) 82,711.90 95,883.87
Details of Dividend Proposed and Paid
Dividend paid
Particulars As at March 31, 2019
As at March 31, 2018
Dividend paid D2.00 per share (Previous year D12.50 per share) 471.02 2,943.86
Taxes on dividend on equity shares 96.82 599.12
567.84 3,542.98
13 b) Non-Controlling Interest
Particulars As at March 31, 2019 As at March 31, 2018
Balance at the beginning of the year - -
Additions during the year 799.60 -
Closing Balance at the end of the year 799.60 -
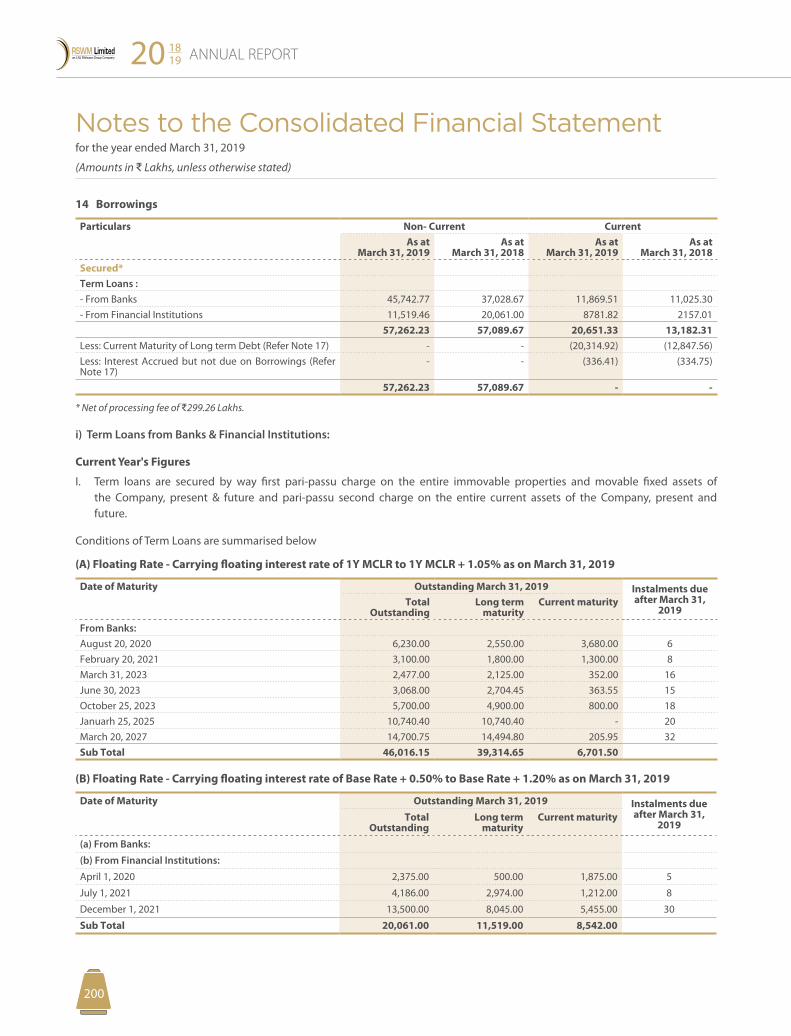
Notes to the Consolidated Financial Statement for the year ended March 31, 2019
(Amounts in D Lakhs, unless otherwise stated)
ANNUAL REPORT20 1819
201200
14 Borrowings
Particulars Non- Current CurrentAs at
March 31, 2019As at
March 31, 2018As at
March 31, 2019As at
March 31, 2018Secured*Term Loans :- From Banks 45,742.77 37,028.67 11,869.51 11,025.30- From Financial Institutions 11,519.46 20,061.00 8781.82 2157.01
57,262.23 57,089.67 20,651.33 13,182.31 Less: Current Maturity of Long term Debt (Refer Note 17) - - (20,314.92) (12,847.56)Less: Interest Accrued but not due on Borrowings (Refer Note 17)
- - (336.41) (334.75)
57,262.23 57,089.67 - -
* Net of processing fee of D299.26 Lakhs.
i) Term Loans from Banks & Financial Institutions:
Current Year's Figures
I. Term loans are secured by way first pari-passu charge on the entire immovable properties and movable fixed assets of the Company, present & future and pari-passu second charge on the entire current assets of the Company, present and future.
Conditions of Term Loans are summarised below
(A) Floating Rate - Carrying floating interest rate of 1Y MCLR to 1Y MCLR + 1.05% as on March 31, 2019
Date of Maturity Outstanding March 31, 2019 Instalments due after March 31,
2019Total
OutstandingLong term
maturityCurrent maturity
From Banks:August 20, 2020 6,230.00 2,550.00 3,680.00 6February 20, 2021 3,100.00 1,800.00 1,300.00 8March 31, 2023 2,477.00 2,125.00 352.00 16June 30, 2023 3,068.00 2,704.45 363.55 15October 25, 2023 5,700.00 4,900.00 800.00 18Januarh 25, 2025 10,740.40 10,740.40 - 20March 20, 2027 14,700.75 14,494.80 205.95 32Sub Total 46,016.15 39,314.65 6,701.50
(B) Floating Rate - Carrying floating interest rate of Base Rate + 0.50% to Base Rate + 1.20% as on March 31, 2019
Date of Maturity Outstanding March 31, 2019 Instalments due after March 31,
2019Total
OutstandingLong term
maturityCurrent maturity
(a) From Banks:
(b) From Financial Institutions:
April 1, 2020 2,375.00 500.00 1,875.00 5
July 1, 2021 4,186.00 2,974.00 1,212.00 8
December 1, 2021 13,500.00 8,045.00 5,455.00 30
Sub Total 20,061.00 11,519.00 8,542.00
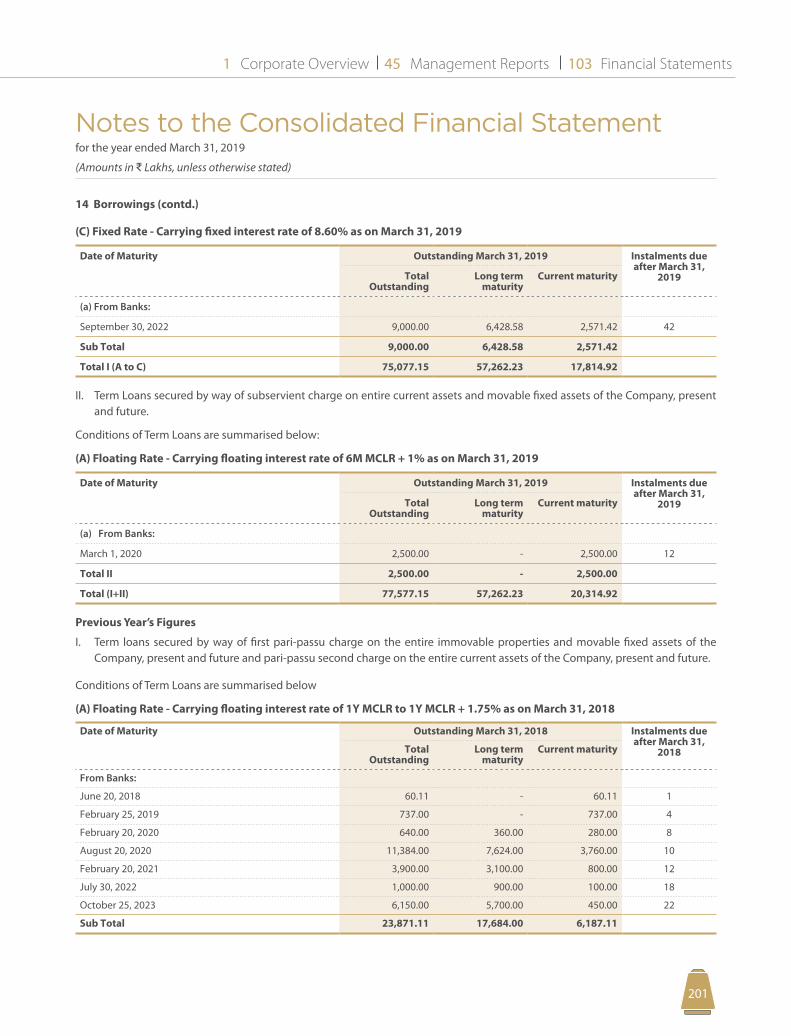
Notes to the Consolidated Financial Statement for the year ended March 31, 2019
(Amounts in D Lakhs, unless otherwise stated)
Corporate Overview Management Reports Financial Statements1 45 103
201200
14 Borrowings (contd.)
(C) Fixed Rate - Carrying fixed interest rate of 8.60% as on March 31, 2019
Date of Maturity Outstanding March 31, 2019 Instalments due after March 31,
2019Total Outstanding
Long term maturity
Current maturity
(a) From Banks:
September 30, 2022 9,000.00 6,428.58 2,571.42 42
Sub Total 9,000.00 6,428.58 2,571.42
Total I (A to C) 75,077.15 57,262.23 17,814.92
II. Term Loans secured by way of subservient charge on entire current assets and movable fixed assets of the Company, present and future.
Conditions of Term Loans are summarised below:
(A) Floating Rate - Carrying floating interest rate of 6M MCLR + 1% as on March 31, 2019
Date of Maturity Outstanding March 31, 2019 Instalments due after March 31,
2019Total Outstanding
Long term maturity
Current maturity
(a) From Banks:
March 1, 2020 2,500.00 - 2,500.00 12
Total II 2,500.00 - 2,500.00
Total (I+II) 77,577.15 57,262.23 20,314.92
Previous Year’s Figures
I. Term loans secured by way of first pari-passu charge on the entire immovable properties and movable fixed assets of the Company, present and future and pari-passu second charge on the entire current assets of the Company, present and future.
Conditions of Term Loans are summarised below
(A) Floating Rate - Carrying floating interest rate of 1Y MCLR to 1Y MCLR + 1.75% as on March 31, 2018
Date of Maturity Outstanding March 31, 2018 Instalments due after March 31,
2018Total Outstanding
Long term maturity
Current maturity
From Banks:
June 20, 2018 60.11 - 60.11 1
February 25, 2019 737.00 - 737.00 4
February 20, 2020 640.00 360.00 280.00 8
August 20, 2020 11,384.00 7,624.00 3,760.00 10
February 20, 2021 3,900.00 3,100.00 800.00 12
July 30, 2022 1,000.00 900.00 100.00 18
October 25, 2023 6,150.00 5,700.00 450.00 22
Sub Total 23,871.11 17,684.00 6,187.11
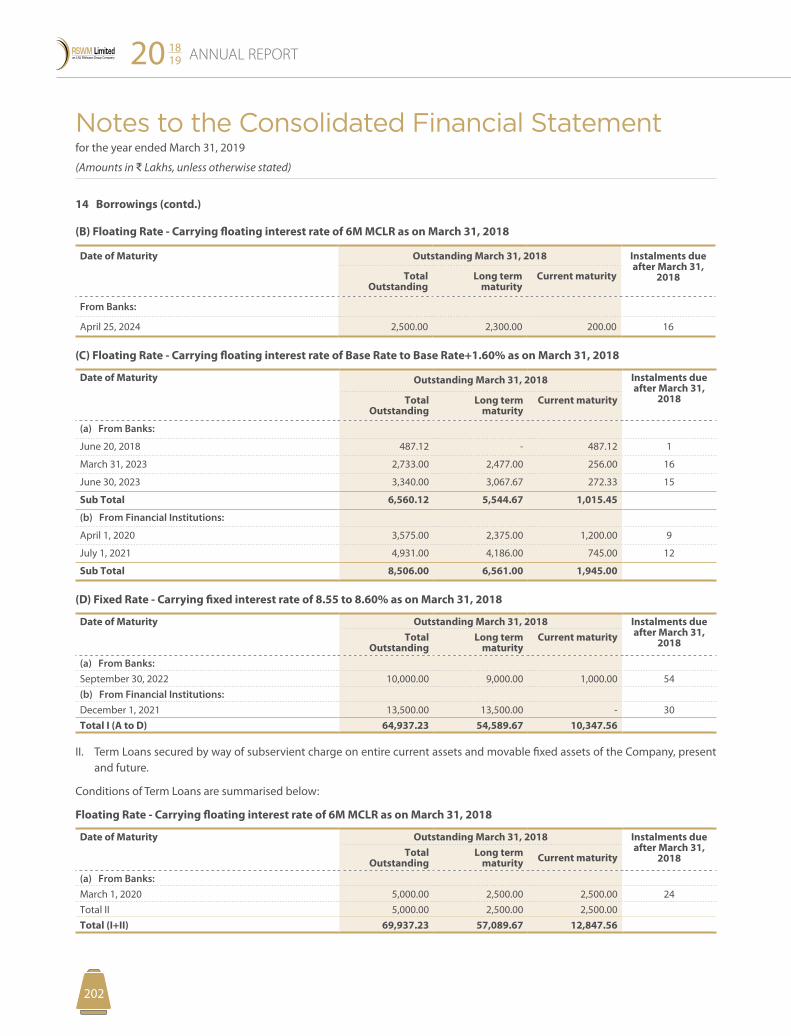
Notes to the Consolidated Financial Statement for the year ended March 31, 2019
(Amounts in D Lakhs, unless otherwise stated)
ANNUAL REPORT20 1819
203202
14 Borrowings (contd.)
(B) Floating Rate - Carrying floating interest rate of 6M MCLR as on March 31, 2018
Date of Maturity Outstanding March 31, 2018 Instalments due after March 31,
2018Total Outstanding
Long term maturity
Current maturity
From Banks:
April 25, 2024 2,500.00 2,300.00 200.00 16
(C) Floating Rate - Carrying floating interest rate of Base Rate to Base Rate+1.60% as on March 31, 2018
Date of Maturity Outstanding March 31, 2018 Instalments due after March 31,
2018Total Outstanding
Long term maturity
Current maturity
(a) From Banks:
June 20, 2018 487.12 - 487.12 1
March 31, 2023 2,733.00 2,477.00 256.00 16
June 30, 2023 3,340.00 3,067.67 272.33 15
Sub Total 6,560.12 5,544.67 1,015.45
(b) From Financial Institutions:
April 1, 2020 3,575.00 2,375.00 1,200.00 9
July 1, 2021 4,931.00 4,186.00 745.00 12
Sub Total 8,506.00 6,561.00 1,945.00
(D) Fixed Rate - Carrying fixed interest rate of 8.55 to 8.60% as on March 31, 2018
Date of Maturity Outstanding March 31, 2018 Instalments due after March 31,
2018Total Outstanding
Long term maturity
Current maturity
(a) From Banks:September 30, 2022 10,000.00 9,000.00 1,000.00 54(b) From Financial Institutions:December 1, 2021 13,500.00 13,500.00 - 30Total I (A to D) 64,937.23 54,589.67 10,347.56
II. Term Loans secured by way of subservient charge on entire current assets and movable fixed assets of the Company, present and future.
Conditions of Term Loans are summarised below:
Floating Rate - Carrying floating interest rate of 6M MCLR as on March 31, 2018
Date of Maturity Outstanding March 31, 2018 Instalments due after March 31,
2018Total Outstanding
Long term maturity Current maturity
(a) From Banks:March 1, 2020 5,000.00 2,500.00 2,500.00 24Total II 5,000.00 2,500.00 2,500.00 Total (I+II) 69,937.23 57,089.67 12,847.56
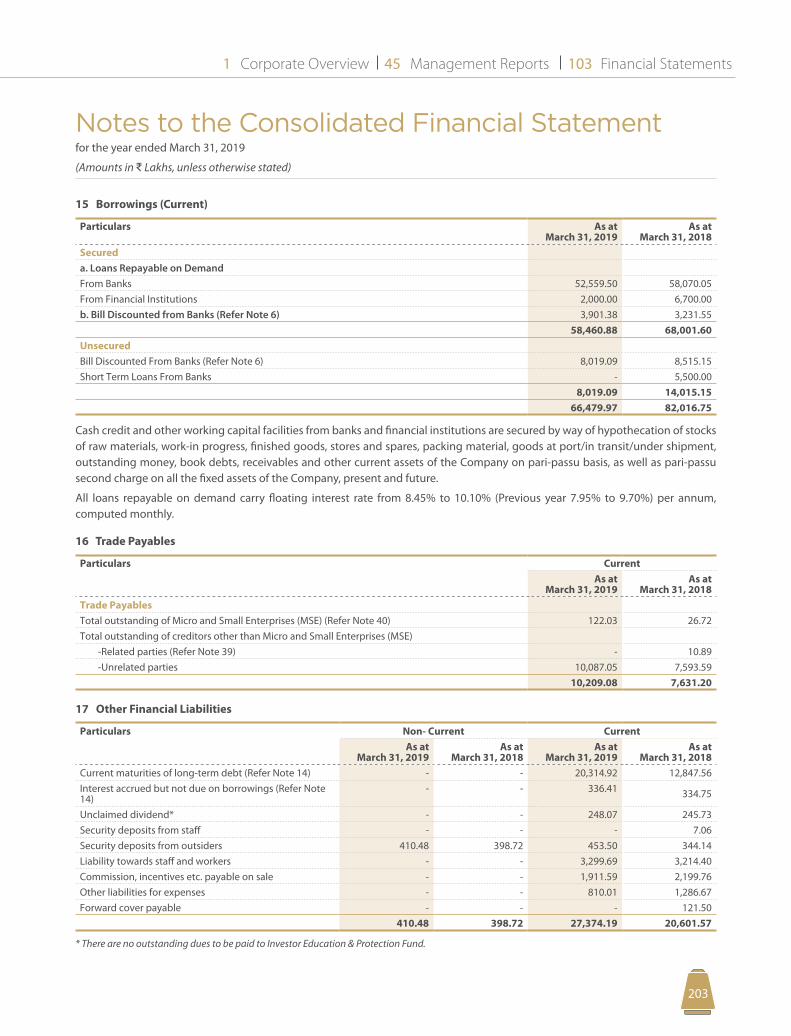
Notes to the Consolidated Financial Statement for the year ended March 31, 2019
(Amounts in D Lakhs, unless otherwise stated)
Corporate Overview Management Reports Financial Statements1 45 103
203202
15 Borrowings (Current)
Particulars As at March 31, 2019
As at March 31, 2018
Secureda. Loans Repayable on Demand From Banks 52,559.50 58,070.05 From Financial Institutions 2,000.00 6,700.00 b. Bill Discounted from Banks (Refer Note 6) 3,901.38 3,231.55
58,460.88 68,001.60 UnsecuredBill Discounted From Banks (Refer Note 6) 8,019.09 8,515.15 Short Term Loans From Banks - 5,500.00
8,019.09 14,015.15 66,479.97 82,016.75
Cash credit and other working capital facilities from banks and financial institutions are secured by way of hypothecation of stocks of raw materials, work-in progress, finished goods, stores and spares, packing material, goods at port/in transit/under shipment, outstanding money, book debts, receivables and other current assets of the Company on pari-passu basis, as well as pari-passu second charge on all the fixed assets of the Company, present and future.
All loans repayable on demand carry floating interest rate from 8.45% to 10.10% (Previous year 7.95% to 9.70%) per annum, computed monthly.
16 Trade Payables
Particulars Current As at
March 31, 2019 As at
March 31, 2018 Trade PayablesTotal outstanding of Micro and Small Enterprises (MSE) (Refer Note 40) 122.03 26.72 Total outstanding of creditors other than Micro and Small Enterprises (MSE) -Related parties (Refer Note 39) - 10.89 -Unrelated parties 10,087.05 7,593.59
10,209.08 7,631.20
17 Other Financial Liabilities
Particulars Non- Current CurrentAs at
March 31, 2019As at
March 31, 2018As at
March 31, 2019As at
March 31, 2018Current maturities of long-term debt (Refer Note 14) - - 20,314.92 12,847.56 Interest accrued but not due on borrowings (Refer Note 14)
- - 336.41 334.75
Unclaimed dividend* - - 248.07 245.73 Security deposits from staff - - - 7.06 Security deposits from outsiders 410.48 398.72 453.50 344.14 Liability towards staff and workers - - 3,299.69 3,214.40 Commission, incentives etc. payable on sale - - 1,911.59 2,199.76 Other liabilities for expenses - - 810.01 1,286.67 Forward cover payable - - - 121.50
410.48 398.72 27,374.19 20,601.57
* There are no outstanding dues to be paid to Investor Education & Protection Fund.
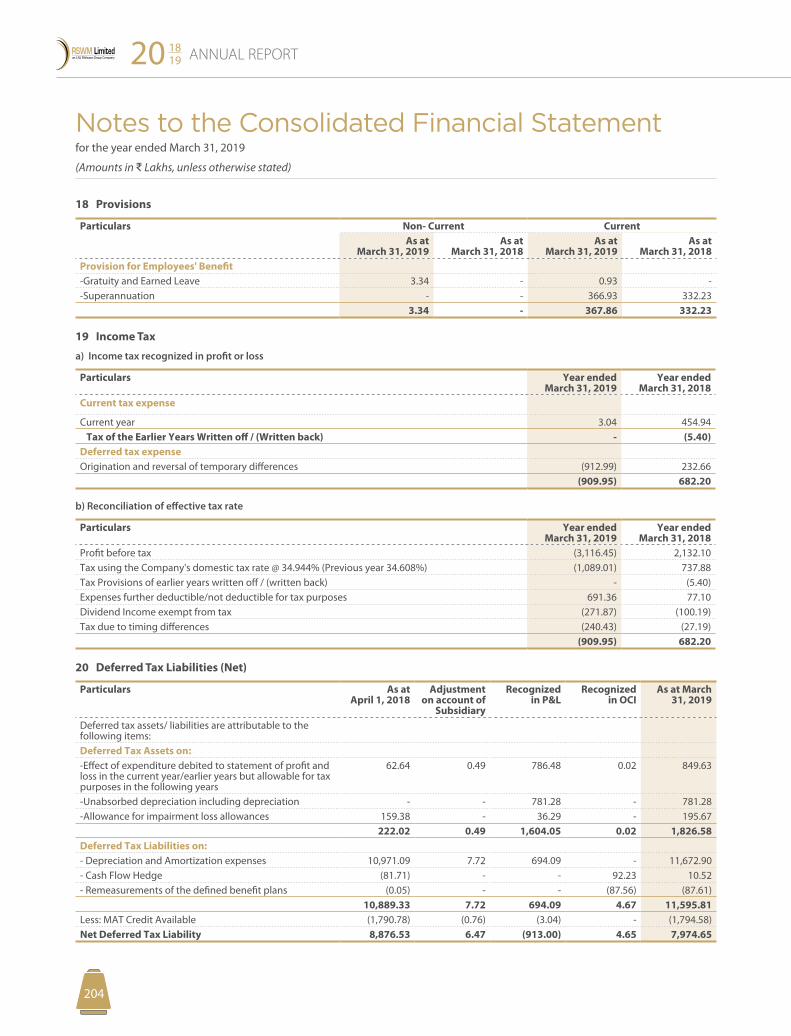
Notes to the Consolidated Financial Statement for the year ended March 31, 2019
(Amounts in D Lakhs, unless otherwise stated)
ANNUAL REPORT20 1819
205204
18 Provisions
Particulars Non- Current CurrentAs at
March 31, 2019As at
March 31, 2018As at
March 31, 2019As at
March 31, 2018Provision for Employees' Benefit-Gratuity and Earned Leave 3.34 - 0.93 - -Superannuation - - 366.93 332.23
3.34 - 367.86 332.23
19 Income Tax
a) Income tax recognized in profit or loss
Particulars Year ended March 31, 2019
Year ended March 31, 2018
Current tax expense
Current year 3.04 454.94 Tax of the Earlier Years Written off / (Written back) - (5.40)Deferred tax expenseOrigination and reversal of temporary differences (912.99) 232.66
(909.95) 682.20
b) Reconciliation of effective tax rate
Particulars Year ended March 31, 2019
Year ended March 31, 2018
Profit before tax (3,116.45) 2,132.10 Tax using the Company's domestic tax rate @ 34.944% (Previous year 34.608%) (1,089.01) 737.88 Tax Provisions of earlier years written off / (written back) - (5.40)Expenses further deductible/not deductible for tax purposes 691.36 77.10 Dividend Income exempt from tax (271.87) (100.19)Tax due to timing differences (240.43) (27.19)
(909.95) 682.20
20 Deferred Tax Liabilities (Net)
Particulars As at April 1, 2018
Adjustment on account of
Subsidiary
Recognized in P&L
Recognized in OCI
As at March 31, 2019
Deferred tax assets/ liabilities are attributable to the following items:Deferred Tax Assets on:-Effect of expenditure debited to statement of profit and loss in the current year/earlier years but allowable for tax purposes in the following years
62.64 0.49 786.48 0.02 849.63
-Unabsorbed depreciation including depreciation - - 781.28 - 781.28 -Allowance for impairment loss allowances 159.38 - 36.29 - 195.67
222.02 0.49 1,604.05 0.02 1,826.58 Deferred Tax Liabilities on:- Depreciation and Amortization expenses 10,971.09 7.72 694.09 - 11,672.90 - Cash Flow Hedge (81.71) - - 92.23 10.52 - Remeasurements of the defined benefit plans (0.05) - - (87.56) (87.61)
10,889.33 7.72 694.09 4.67 11,595.81 Less: MAT Credit Available (1,790.78) (0.76) (3.04) - (1,794.58)Net Deferred Tax Liability 8,876.53 6.47 (913.00) 4.65 7,974.65
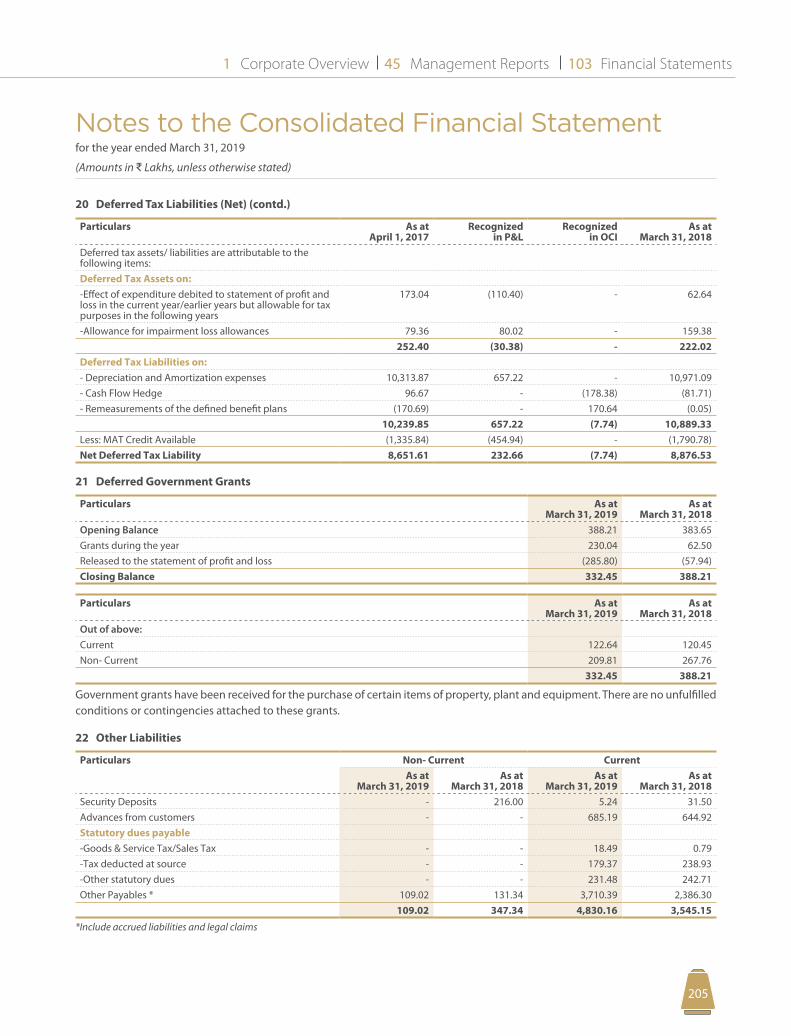
Notes to the Consolidated Financial Statement for the year ended March 31, 2019
(Amounts in D Lakhs, unless otherwise stated)
Corporate Overview Management Reports Financial Statements1 45 103
205204
20 Deferred Tax Liabilities (Net) (contd.)
Particulars As at April 1, 2017
Recognized in P&L
Recognized in OCI
As at March 31, 2018
Deferred tax assets/ liabilities are attributable to the following items:Deferred Tax Assets on:-Effect of expenditure debited to statement of profit and loss in the current year/earlier years but allowable for tax purposes in the following years
173.04 (110.40) - 62.64
-Allowance for impairment loss allowances 79.36 80.02 - 159.38 252.40 (30.38) - 222.02
Deferred Tax Liabilities on:- Depreciation and Amortization expenses 10,313.87 657.22 - 10,971.09 - Cash Flow Hedge 96.67 - (178.38) (81.71)- Remeasurements of the defined benefit plans (170.69) - 170.64 (0.05)
10,239.85 657.22 (7.74) 10,889.33 Less: MAT Credit Available (1,335.84) (454.94) - (1,790.78)Net Deferred Tax Liability 8,651.61 232.66 (7.74) 8,876.53
21 Deferred Government Grants
Particulars As at March 31, 2019
As at March 31, 2018
Opening Balance 388.21 383.65 Grants during the year 230.04 62.50 Released to the statement of profit and loss (285.80) (57.94)Closing Balance 332.45 388.21
Particulars As at March 31, 2019
As at March 31, 2018
Out of above:Current 122.64 120.45 Non- Current 209.81 267.76
332.45 388.21
Government grants have been received for the purchase of certain items of property, plant and equipment. There are no unfulfilled conditions or contingencies attached to these grants.
22 Other Liabilities
Particulars Non- Current CurrentAs at
March 31, 2019As at
March 31, 2018As at
March 31, 2019As at
March 31, 2018Security Deposits - 216.00 5.24 31.50 Advances from customers - - 685.19 644.92 Statutory dues payable-Goods & Service Tax/Sales Tax - - 18.49 0.79 -Tax deducted at source - - 179.37 238.93 -Other statutory dues - - 231.48 242.71 Other Payables * 109.02 131.34 3,710.39 2,386.30
109.02 347.34 4,830.16 3,545.15
*Include accrued liabilities and legal claims
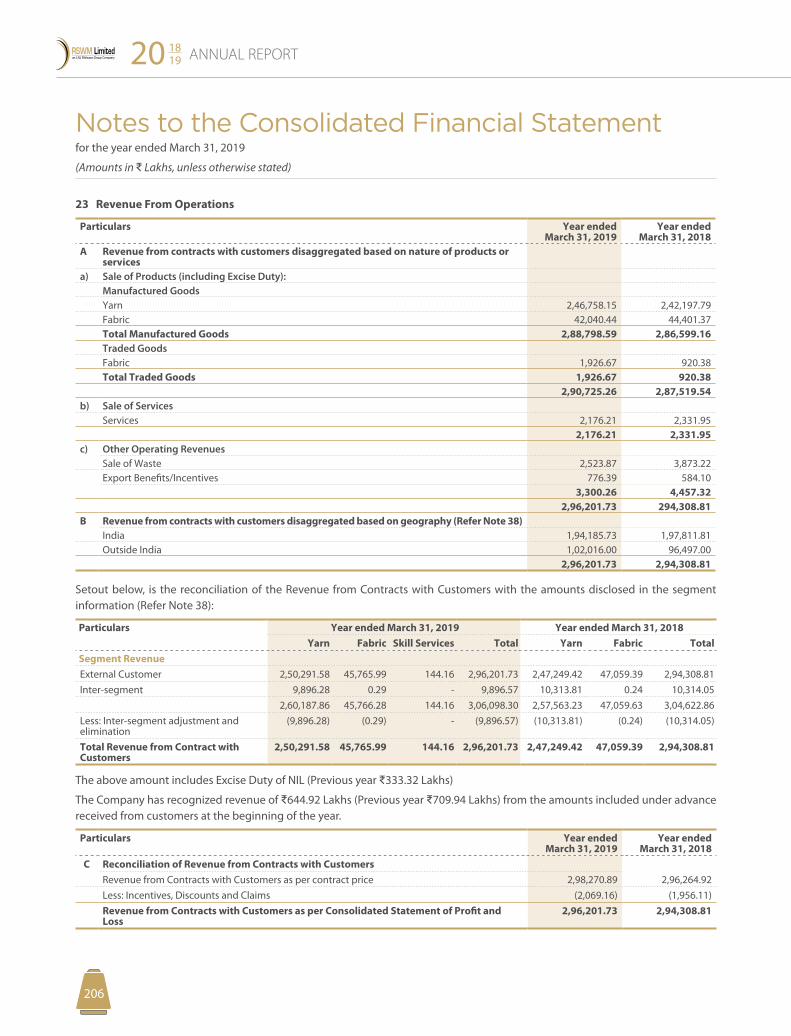
Notes to the Consolidated Financial Statement for the year ended March 31, 2019
(Amounts in D Lakhs, unless otherwise stated)
ANNUAL REPORT20 1819
207206
23 Revenue From Operations
Particulars Year ended March 31, 2019
Year ended March 31, 2018
A Revenue from contracts with customers disaggregated based on nature of products or services
a) Sale of Products (including Excise Duty):Manufactured GoodsYarn 2,46,758.15 2,42,197.79 Fabric 42,040.44 44,401.37 Total Manufactured Goods 2,88,798.59 2,86,599.16 Traded GoodsFabric 1,926.67 920.38 Total Traded Goods 1,926.67 920.38
2,90,725.26 2,87,519.54 b) Sale of Services
Services 2,176.21 2,331.95 2,176.21 2,331.95
c) Other Operating RevenuesSale of Waste 2,523.87 3,873.22 Export Benefits/Incentives 776.39 584.10
3,300.26 4,457.32 2,96,201.73 294,308.81
B Revenue from contracts with customers disaggregated based on geography (Refer Note 38)India 1,94,185.73 1,97,811.81 Outside India 1,02,016.00 96,497.00
2,96,201.73 2,94,308.81
Setout below, is the reconciliation of the Revenue from Contracts with Customers with the amounts disclosed in the segment information (Refer Note 38):
Particulars Year ended March 31, 2019 Year ended March 31, 2018 Yarn Fabric Skill Services Total Yarn Fabric Total
Segment RevenueExternal Customer 2,50,291.58 45,765.99 144.16 2,96,201.73 2,47,249.42 47,059.39 2,94,308.81 Inter-segment 9,896.28 0.29 - 9,896.57 10,313.81 0.24 10,314.05
2,60,187.86 45,766.28 144.16 3,06,098.30 2,57,563.23 47,059.63 3,04,622.86 Less: Inter-segment adjustment and elimination
(9,896.28) (0.29) - (9,896.57) (10,313.81) (0.24) (10,314.05)
Total Revenue from Contract with Customers
2,50,291.58 45,765.99 144.16 2,96,201.73 2,47,249.42 47,059.39 2,94,308.81
The above amount includes Excise Duty of NIL (Previous year D333.32 Lakhs)
The Company has recognized revenue of D644.92 Lakhs (Previous year D709.94 Lakhs) from the amounts included under advance received from customers at the beginning of the year.
Particulars Year ended March 31, 2019
Year ended March 31, 2018
C Reconciliation of Revenue from Contracts with CustomersRevenue from Contracts with Customers as per contract price 2,98,270.89 2,96,264.92 Less: Incentives, Discounts and Claims (2,069.16) (1,956.11)Revenue from Contracts with Customers as per Consolidated Statement of Profit and Loss
2,96,201.73 2,94,308.81
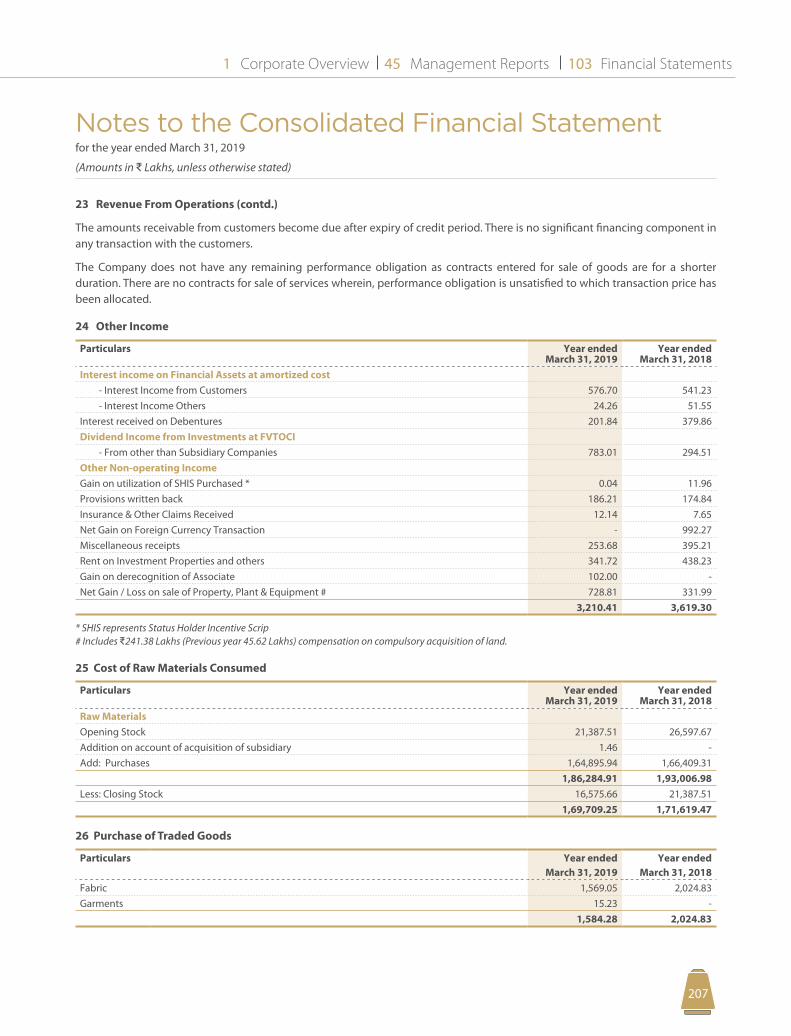
Notes to the Consolidated Financial Statement for the year ended March 31, 2019
(Amounts in D Lakhs, unless otherwise stated)
Corporate Overview Management Reports Financial Statements1 45 103
207206
23 Revenue From Operations (contd.)
The amounts receivable from customers become due after expiry of credit period. There is no significant financing component in any transaction with the customers.
The Company does not have any remaining performance obligation as contracts entered for sale of goods are for a shorter duration. There are no contracts for sale of services wherein, performance obligation is unsatisfied to which transaction price has been allocated.
24 Other Income
Particulars Year ended March 31, 2019
Year ended March 31, 2018
Interest income on Financial Assets at amortized cost- Interest Income from Customers 576.70 541.23 - Interest Income Others 24.26 51.55
Interest received on Debentures 201.84 379.86 Dividend Income from Investments at FVTOCI
- From other than Subsidiary Companies 783.01 294.51 Other Non-operating IncomeGain on utilization of SHIS Purchased * 0.04 11.96 Provisions written back 186.21 174.84 Insurance & Other Claims Received 12.14 7.65 Net Gain on Foreign Currency Transaction - 992.27 Miscellaneous receipts 253.68 395.21 Rent on Investment Properties and others 341.72 438.23 Gain on derecognition of Associate 102.00 - Net Gain / Loss on sale of Property, Plant & Equipment # 728.81 331.99
3,210.41 3,619.30
* SHIS represents Status Holder Incentive Scrip# Includes D241.38 Lakhs (Previous year 45.62 Lakhs) compensation on compulsory acquisition of land.
25 Cost of Raw Materials Consumed
Particulars Year ended March 31, 2019
Year ended March 31, 2018
Raw MaterialsOpening Stock 21,387.51 26,597.67 Addition on account of acquisition of subsidiary 1.46 - Add: Purchases 1,64,895.94 1,66,409.31
1,86,284.91 1,93,006.98 Less: Closing Stock 16,575.66 21,387.51
1,69,709.25 1,71,619.47
26 Purchase of Traded Goods
Particulars Year ended March 31, 2019
Year ended March 31, 2018
Fabric 1,569.05 2,024.83 Garments 15.23 -
1,584.28 2,024.83
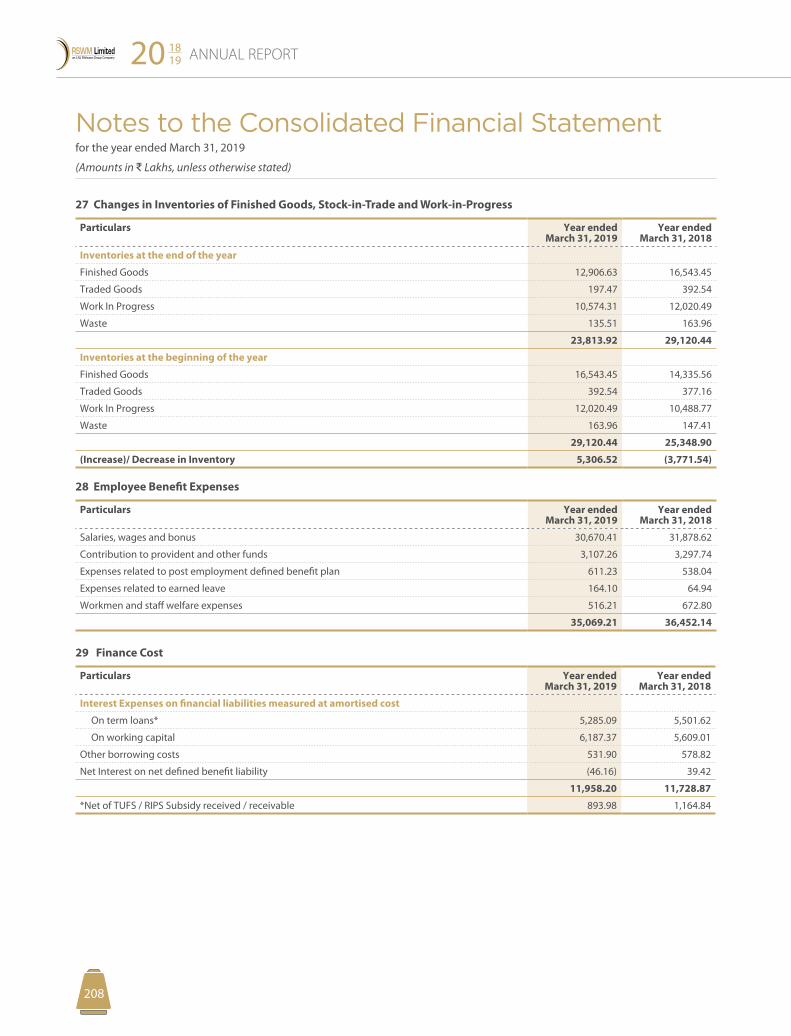
Notes to the Consolidated Financial Statement for the year ended March 31, 2019
(Amounts in D Lakhs, unless otherwise stated)
ANNUAL REPORT20 1819
209208
27 Changes in Inventories of Finished Goods, Stock-in-Trade and Work-in-Progress
Particulars Year ended March 31, 2019
Year ended March 31, 2018
Inventories at the end of the year
Finished Goods 12,906.63 16,543.45
Traded Goods 197.47 392.54
Work In Progress 10,574.31 12,020.49
Waste 135.51 163.96
23,813.92 29,120.44
Inventories at the beginning of the year
Finished Goods 16,543.45 14,335.56
Traded Goods 392.54 377.16
Work In Progress 12,020.49 10,488.77
Waste 163.96 147.41
29,120.44 25,348.90
(Increase)/ Decrease in Inventory 5,306.52 (3,771.54)
28 Employee Benefit Expenses
Particulars Year ended March 31, 2019
Year ended March 31, 2018
Salaries, wages and bonus 30,670.41 31,878.62
Contribution to provident and other funds 3,107.26 3,297.74
Expenses related to post employment defined benefit plan 611.23 538.04
Expenses related to earned leave 164.10 64.94
Workmen and staff welfare expenses 516.21 672.80
35,069.21 36,452.14
29 Finance Cost
Particulars Year ended March 31, 2019
Year ended March 31, 2018
Interest Expenses on financial liabilities measured at amortised cost
On term loans* 5,285.09 5,501.62
On working capital 6,187.37 5,609.01
Other borrowing costs 531.90 578.82
Net Interest on net defined benefit liability (46.16) 39.42
11,958.20 11,728.87
*Net of TUFS / RIPS Subsidy received / receivable 893.98 1,164.84
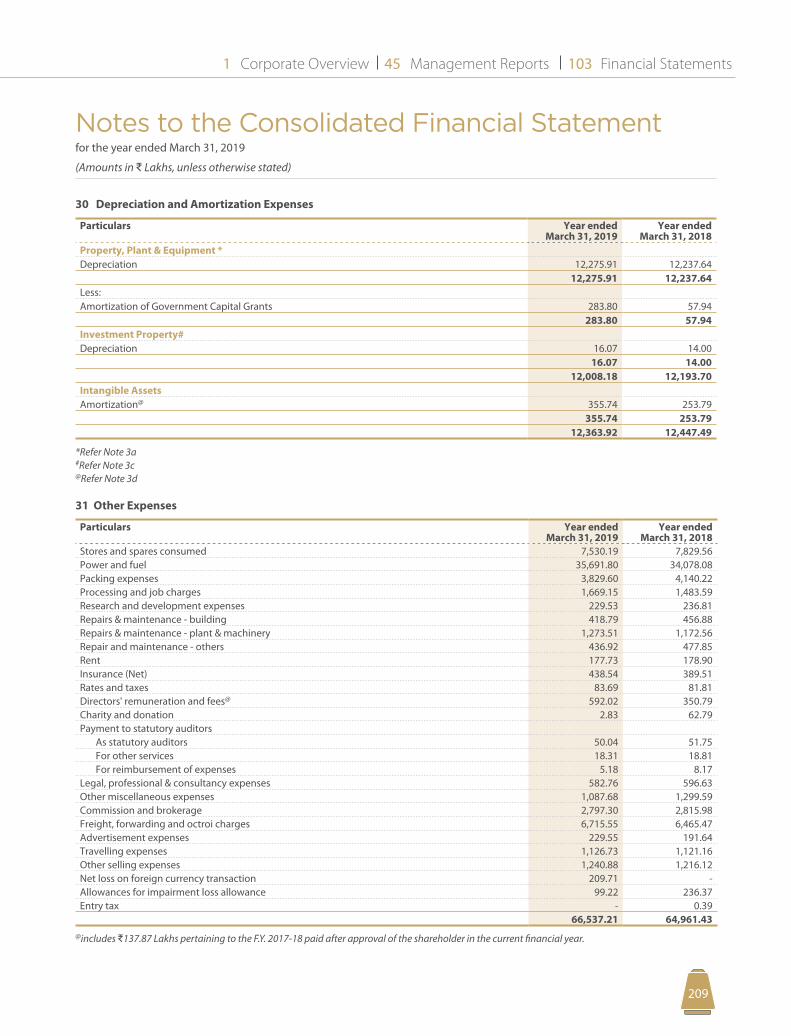
Notes to the Consolidated Financial Statement for the year ended March 31, 2019
(Amounts in D Lakhs, unless otherwise stated)
Corporate Overview Management Reports Financial Statements1 45 103
209208
30 Depreciation and Amortization Expenses
Particulars Year ended March 31, 2019
Year ended March 31, 2018
Property, Plant & Equipment *Depreciation 12,275.91 12,237.64
12,275.91 12,237.64 Less:Amortization of Government Capital Grants 283.80 57.94
283.80 57.94 Investment Property#Depreciation 16.07 14.00
16.07 14.00 12,008.18 12,193.70
Intangible AssetsAmortization@ 355.74 253.79
355.74 253.79 12,363.92 12,447.49
*Refer Note 3a#Refer Note 3c@Refer Note 3d
31 Other Expenses
Particulars Year ended March 31, 2019
Year ended March 31, 2018
Stores and spares consumed 7,530.19 7,829.56 Power and fuel 35,691.80 34,078.08 Packing expenses 3,829.60 4,140.22 Processing and job charges 1,669.15 1,483.59 Research and development expenses 229.53 236.81 Repairs & maintenance - building 418.79 456.88 Repairs & maintenance - plant & machinery 1,273.51 1,172.56 Repair and maintenance - others 436.92 477.85 Rent 177.73 178.90 Insurance (Net) 438.54 389.51 Rates and taxes 83.69 81.81 Directors' remuneration and fees@ 592.02 350.79 Charity and donation 2.83 62.79 Payment to statutory auditors As statutory auditors 50.04 51.75 For other services 18.31 18.81 For reimbursement of expenses 5.18 8.17 Legal, professional & consultancy expenses 582.76 596.63 Other miscellaneous expenses 1,087.68 1,299.59 Commission and brokerage 2,797.30 2,815.98 Freight, forwarding and octroi charges 6,715.55 6,465.47 Advertisement expenses 229.55 191.64 Travelling expenses 1,126.73 1,121.16 Other selling expenses 1,240.88 1,216.12 Net loss on foreign currency transaction 209.71 - Allowances for impairment loss allowance 99.22 236.37 Entry tax - 0.39
66,537.21 64,961.43 @includes D137.87 Lakhs pertaining to the F.Y. 2017-18 paid after approval of the shareholder in the current financial year.
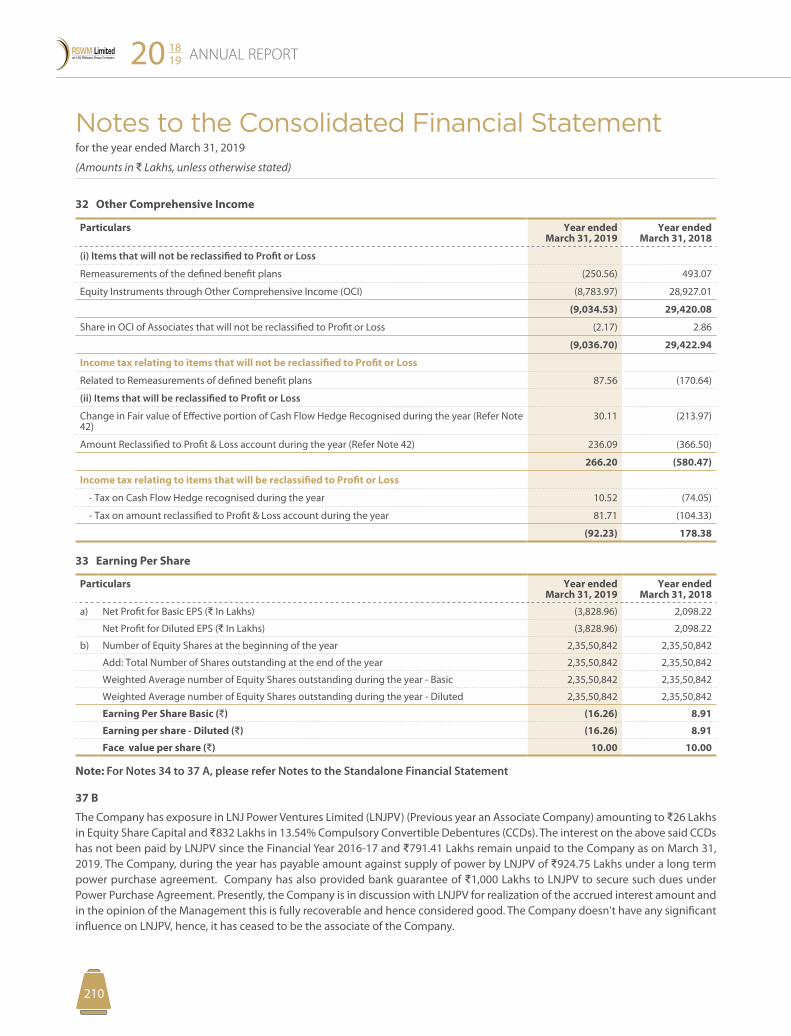
Notes to the Consolidated Financial Statement for the year ended March 31, 2019
(Amounts in D Lakhs, unless otherwise stated)
ANNUAL REPORT20 1819
211210
32 Other Comprehensive Income
Particulars Year ended March 31, 2019
Year ended March 31, 2018
(i) Items that will not be reclassified to Profit or Loss
Remeasurements of the defined benefit plans (250.56) 493.07
Equity Instruments through Other Comprehensive Income (OCI) (8,783.97) 28,927.01
(9,034.53) 29,420.08
Share in OCI of Associates that will not be reclassified to Profit or Loss (2.17) 2.86
(9,036.70) 29,422.94
Income tax relating to items that will not be reclassified to Profit or Loss
Related to Remeasurements of defined benefit plans 87.56 (170.64)
(ii) Items that will be reclassified to Profit or Loss
Change in Fair value of Effective portion of Cash Flow Hedge Recognised during the year (Refer Note 42)
30.11 (213.97)
Amount Reclassified to Profit & Loss account during the year (Refer Note 42) 236.09 (366.50)
266.20 (580.47)
Income tax relating to items that will be reclassified to Profit or Loss
- Tax on Cash Flow Hedge recognised during the year 10.52 (74.05)
- Tax on amount reclassified to Profit & Loss account during the year 81.71 (104.33)
(92.23) 178.38
33 Earning Per Share
Particulars Year ended March 31, 2019
Year ended March 31, 2018
a) Net Profit for Basic EPS (D In Lakhs) (3,828.96) 2,098.22
Net Profit for Diluted EPS (D In Lakhs) (3,828.96) 2,098.22
b) Number of Equity Shares at the beginning of the year 2,35,50,842 2,35,50,842
Add: Total Number of Shares outstanding at the end of the year 2,35,50,842 2,35,50,842
Weighted Average number of Equity Shares outstanding during the year - Basic 2,35,50,842 2,35,50,842
Weighted Average number of Equity Shares outstanding during the year - Diluted 2,35,50,842 2,35,50,842
Earning Per Share Basic (D) (16.26) 8.91
Earning per share - Diluted (D) (16.26) 8.91
Face value per share (D) 10.00 10.00
Note: For Notes 34 to 37 A, please refer Notes to the Standalone Financial Statement
37 B
The Company has exposure in LNJ Power Ventures Limited (LNJPV) (Previous year an Associate Company) amounting to D26 Lakhs in Equity Share Capital and D832 Lakhs in 13.54% Compulsory Convertible Debentures (CCDs). The interest on the above said CCDs has not been paid by LNJPV since the Financial Year 2016-17 and D791.41 Lakhs remain unpaid to the Company as on March 31, 2019. The Company, during the year has payable amount against supply of power by LNJPV of D924.75 Lakhs under a long term power purchase agreement. Company has also provided bank guarantee of D1,000 Lakhs to LNJPV to secure such dues under Power Purchase Agreement. Presently, the Company is in discussion with LNJPV for realization of the accrued interest amount and in the opinion of the Management this is fully recoverable and hence considered good. The Company doesn't have any significant influence on LNJPV, hence, it has ceased to be the associate of the Company.
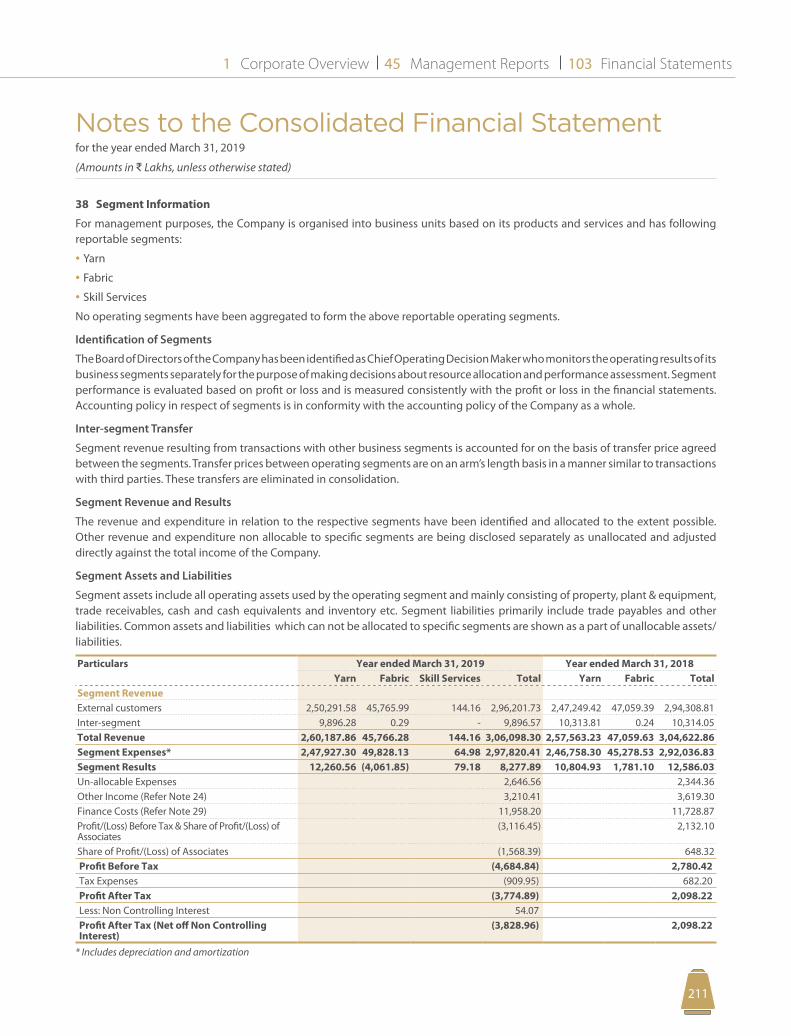
Notes to the Consolidated Financial Statement for the year ended March 31, 2019
(Amounts in D Lakhs, unless otherwise stated)
Corporate Overview Management Reports Financial Statements1 45 103
211210
38 Segment Information
For management purposes, the Company is organised into business units based on its products and services and has following reportable segments:
• Yarn
• Fabric
• Skill Services
No operating segments have been aggregated to form the above reportable operating segments.
Identification of Segments
The Board of Directors of the Company has been identified as Chief Operating Decision Maker who monitors the operating results of its business segments separately for the purpose of making decisions about resource allocation and performance assessment. Segment performance is evaluated based on profit or loss and is measured consistently with the profit or loss in the financial statements. Accounting policy in respect of segments is in conformity with the accounting policy of the Company as a whole.
Inter-segment Transfer
Segment revenue resulting from transactions with other business segments is accounted for on the basis of transfer price agreed between the segments. Transfer prices between operating segments are on an arm’s length basis in a manner similar to transactions with third parties. These transfers are eliminated in consolidation.
Segment Revenue and Results
The revenue and expenditure in relation to the respective segments have been identified and allocated to the extent possible. Other revenue and expenditure non allocable to specific segments are being disclosed separately as unallocated and adjusted directly against the total income of the Company.
Segment Assets and Liabilities
Segment assets include all operating assets used by the operating segment and mainly consisting of property, plant & equipment, trade receivables, cash and cash equivalents and inventory etc. Segment liabilities primarily include trade payables and other liabilities. Common assets and liabilities which can not be allocated to specific segments are shown as a part of unallocable assets/liabilities.
Particulars Year ended March 31, 2019 Year ended March 31, 2018Yarn Fabric Skill Services Total Yarn Fabric Total
Segment RevenueExternal customers 2,50,291.58 45,765.99 144.16 2,96,201.73 2,47,249.42 47,059.39 2,94,308.81 Inter-segment 9,896.28 0.29 - 9,896.57 10,313.81 0.24 10,314.05 Total Revenue 2,60,187.86 45,766.28 144.16 3,06,098.30 2,57,563.23 47,059.63 3,04,622.86 Segment Expenses* 2,47,927.30 49,828.13 64.98 2,97,820.41 2,46,758.30 45,278.53 2,92,036.83 Segment Results 12,260.56 (4,061.85) 79.18 8,277.89 10,804.93 1,781.10 12,586.03 Un-allocable Expenses 2,646.56 2,344.36 Other Income (Refer Note 24) 3,210.41 3,619.30 Finance Costs (Refer Note 29) 11,958.20 11,728.87 Profit/(Loss) Before Tax & Share of Profit/(Loss) of Associates
(3,116.45) 2,132.10
Share of Profit/(Loss) of Associates (1,568.39) 648.32 Profit Before Tax (4,684.84) 2,780.42 Tax Expenses (909.95) 682.20 Profit After Tax (3,774.89) 2,098.22 Less: Non Controlling Interest 54.07 Profit After Tax (Net off Non Controlling Interest)
(3,828.96) 2,098.22
* Includes depreciation and amortization
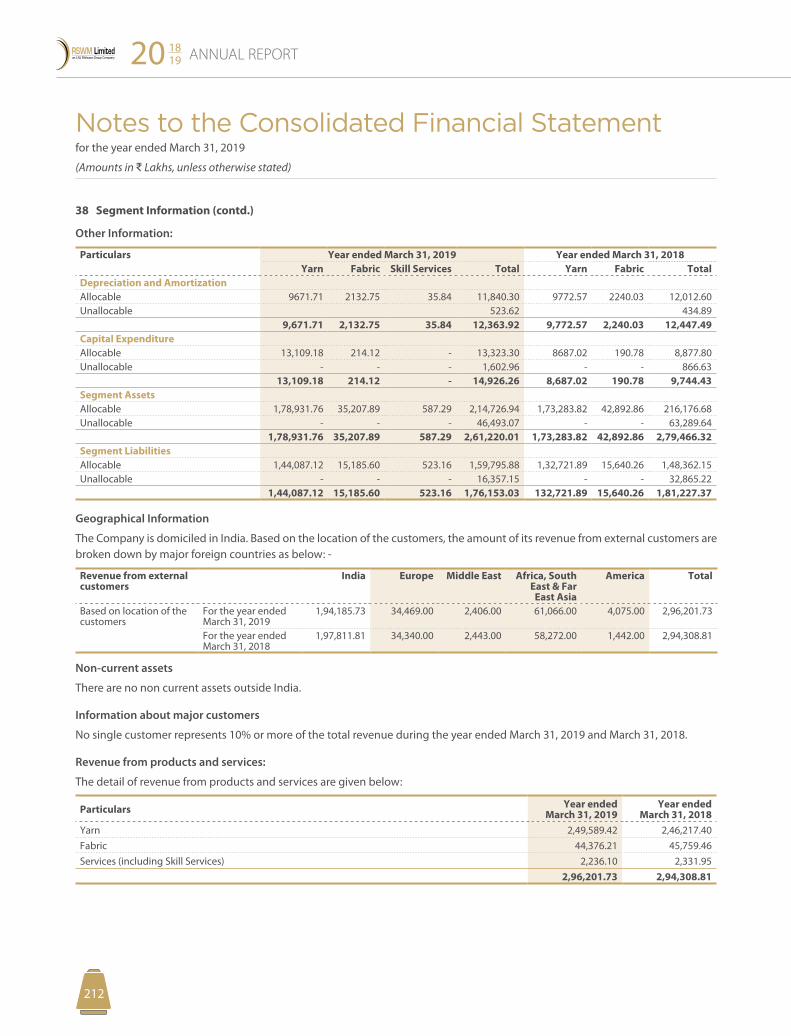
Notes to the Consolidated Financial Statement for the year ended March 31, 2019
(Amounts in D Lakhs, unless otherwise stated)
ANNUAL REPORT20 1819
213212
38 Segment Information (contd.)
Other Information:
Particulars Year ended March 31, 2019 Year ended March 31, 2018Yarn Fabric Skill Services Total Yarn Fabric Total
Depreciation and AmortizationAllocable 9671.71 2132.75 35.84 11,840.30 9772.57 2240.03 12,012.60 Unallocable 523.62 434.89
9,671.71 2,132.75 35.84 12,363.92 9,772.57 2,240.03 12,447.49 Capital Expenditure Allocable 13,109.18 214.12 - 13,323.30 8687.02 190.78 8,877.80 Unallocable - - - 1,602.96 - - 866.63
13,109.18 214.12 - 14,926.26 8,687.02 190.78 9,744.43 Segment AssetsAllocable 1,78,931.76 35,207.89 587.29 2,14,726.94 1,73,283.82 42,892.86 216,176.68 Unallocable - - - 46,493.07 - - 63,289.64
1,78,931.76 35,207.89 587.29 2,61,220.01 1,73,283.82 42,892.86 2,79,466.32 Segment LiabilitiesAllocable 1,44,087.12 15,185.60 523.16 1,59,795.88 1,32,721.89 15,640.26 1,48,362.15 Unallocable - - - 16,357.15 - - 32,865.22
1,44,087.12 15,185.60 523.16 1,76,153.03 132,721.89 15,640.26 1,81,227.37
Geographical Information
The Company is domiciled in India. Based on the location of the customers, the amount of its revenue from external customers are broken down by major foreign countries as below: -
Revenue from external customers
India Europe Middle East Africa, South East & Far
East Asia
America Total
Based on location of the customers
For the year ended March 31, 2019
1,94,185.73 34,469.00 2,406.00 61,066.00 4,075.00 2,96,201.73
For the year ended March 31, 2018
1,97,811.81 34,340.00 2,443.00 58,272.00 1,442.00 2,94,308.81
Non-current assets
There are no non current assets outside India.
Information about major customers
No single customer represents 10% or more of the total revenue during the year ended March 31, 2019 and March 31, 2018.
Revenue from products and services:
The detail of revenue from products and services are given below:
Particulars Year ended March 31, 2019
Year ended March 31, 2018
Yarn 2,49,589.42 2,46,217.40 Fabric 44,376.21 45,759.46 Services (including Skill Services) 2,236.10 2,331.95
2,96,201.73 2,94,308.81
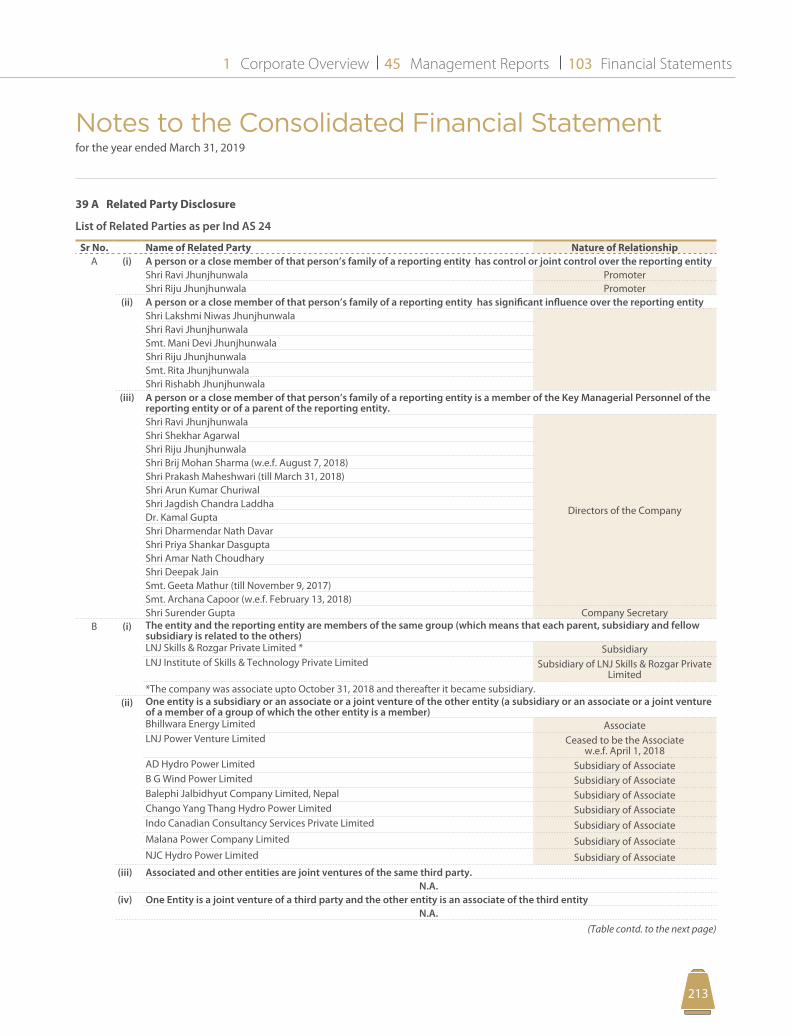
Corporate Overview Management Reports Financial Statements1 45 103
213212
Notes to the Consolidated Financial Statement for the year ended March 31, 2019
(Amounts in D Lakhs, unless otherwise stated)
39 A Related Party Disclosure
List of Related Parties as per Ind AS 24
Sr No. Name of Related Party Nature of RelationshipA (i) A person or a close member of that person’s family of a reporting entity has control or joint control over the reporting entity
Shri Ravi Jhunjhunwala PromoterShri Riju Jhunjhunwala Promoter
(ii) A person or a close member of that person’s family of a reporting entity has significant influence over the reporting entityShri Lakshmi Niwas JhunjhunwalaShri Ravi JhunjhunwalaSmt. Mani Devi JhunjhunwalaShri Riju JhunjhunwalaSmt. Rita JhunjhunwalaShri Rishabh Jhunjhunwala
(iii) A person or a close member of that person’s family of a reporting entity is a member of the Key Managerial Personnel of the reporting entity or of a parent of the reporting entity.Shri Ravi Jhunjhunwala
Directors of the Company
Shri Shekhar AgarwalShri Riju JhunjhunwalaShri Brij Mohan Sharma (w.e.f. August 7, 2018)Shri Prakash Maheshwari (till March 31, 2018)Shri Arun Kumar ChuriwalShri Jagdish Chandra LaddhaDr. Kamal GuptaShri Dharmendar Nath DavarShri Priya Shankar DasguptaShri Amar Nath ChoudharyShri Deepak JainSmt. Geeta Mathur (till November 9, 2017)Smt. Archana Capoor (w.e.f. February 13, 2018)Shri Surender Gupta Company Secretary
B (i) The entity and the reporting entity are members of the same group (which means that each parent, subsidiary and fellow subsidiary is related to the others)LNJ Skills & Rozgar Private Limited * SubsidiaryLNJ Institute of Skills & Technology Private Limited Subsidiary of LNJ Skills & Rozgar Private
Limited*The company was associate upto October 31, 2018 and thereafter it became subsidiary.
(ii) One entity is a subsidiary or an associate or a joint venture of the other entity (a subsidiary or an associate or a joint venture of a member of a group of which the other entity is a member)Bhillwara Energy Limited AssociateLNJ Power Venture Limited Ceased to be the Associate
w.e.f. April 1, 2018AD Hydro Power Limited Subsidiary of AssociateB G Wind Power Limited Subsidiary of AssociateBalephi Jalbidhyut Company Limited, Nepal Subsidiary of AssociateChango Yang Thang Hydro Power Limited Subsidiary of AssociateIndo Canadian Consultancy Services Private Limited Subsidiary of AssociateMalana Power Company Limited Subsidiary of AssociateNJC Hydro Power Limited Subsidiary of Associate
(iii) Associated and other entities are joint ventures of the same third party.N.A.
(iv) One Entity is a joint venture of a third party and the other entity is an associate of the third entityN.A.
(Table contd. to the next page)
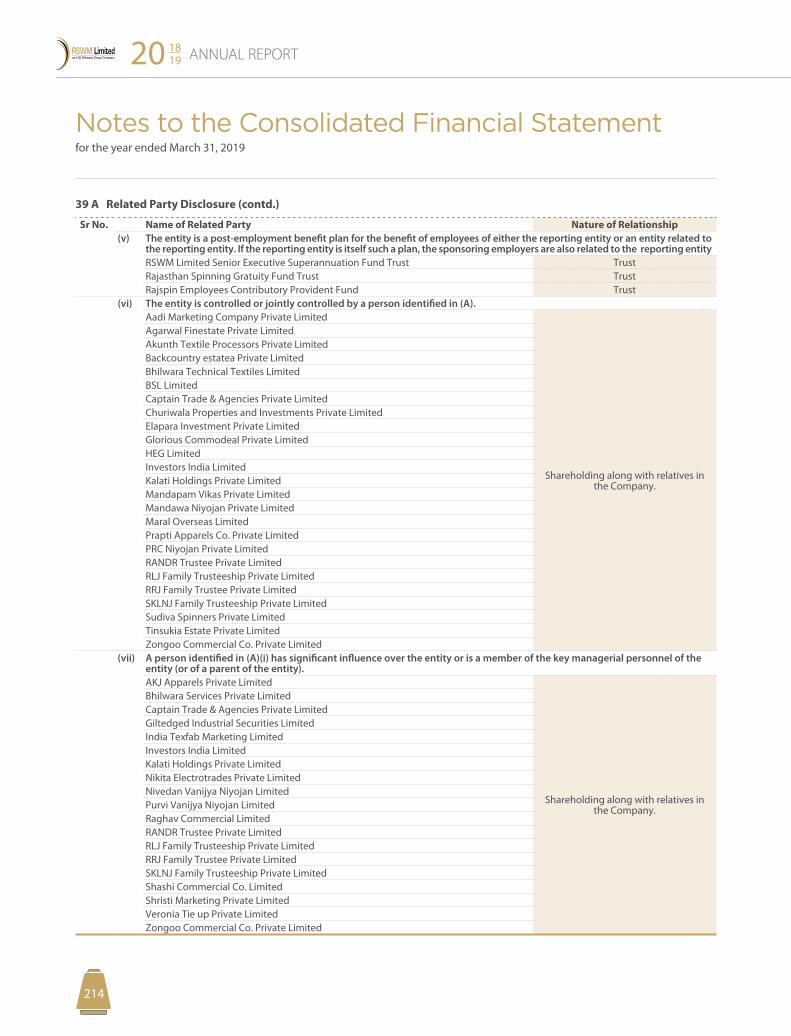
ANNUAL REPORT20 1819
215214
Notes to the Consolidated Financial Statement for the year ended March 31, 2019
(Amounts in D Lakhs, unless otherwise stated)
39 A Related Party Disclosure (contd.)
Sr No. Name of Related Party Nature of Relationship(v) The entity is a post-employment benefit plan for the benefit of employees of either the reporting entity or an entity related to
the reporting entity. If the reporting entity is itself such a plan, the sponsoring employers are also related to the reporting entityRSWM Limited Senior Executive Superannuation Fund Trust TrustRajasthan Spinning Gratuity Fund Trust TrustRajspin Employees Contributory Provident Fund Trust
(vi) The entity is controlled or jointly controlled by a person identified in (A).Aadi Marketing Company Private Limited
Shareholding along with relatives in the Company.
Agarwal Finestate Private LimitedAkunth Textile Processors Private LimitedBackcountry estatea Private LimitedBhilwara Technical Textiles LimitedBSL LimitedCaptain Trade & Agencies Private LimitedChuriwala Properties and Investments Private LimitedElapara Investment Private LimitedGlorious Commodeal Private LimitedHEG LimitedInvestors India Limited Kalati Holdings Private LimitedMandapam Vikas Private LimitedMandawa Niyojan Private LimitedMaral Overseas LimitedPrapti Apparels Co. Private LimitedPRC Niyojan Private LimitedRANDR Trustee Private LimitedRLJ Family Trusteeship Private LimitedRRJ Family Trustee Private LimitedSKLNJ Family Trusteeship Private LimitedSudiva Spinners Private LimitedTinsukia Estate Private LimitedZongoo Commercial Co. Private Limited
(vii) A person identified in (A)(i) has significant influence over the entity or is a member of the key managerial personnel of the entity (or of a parent of the entity).AKJ Apparels Private Limited
Shareholding along with relatives in the Company.
Bhilwara Services Private LimitedCaptain Trade & Agencies Private LimitedGiltedged Industrial Securities LimitedIndia Texfab Marketing LimitedInvestors India LimitedKalati Holdings Private LimitedNikita Electrotrades Private LimitedNivedan Vanijya Niyojan LimitedPurvi Vanijya Niyojan LimitedRaghav Commercial LimitedRANDR Trustee Private LimitedRLJ Family Trusteeship Private LimitedRRJ Family Trustee Private LimitedSKLNJ Family Trusteeship Private LimitedShashi Commercial Co. LimitedShristi Marketing Private LimitedVeronia Tie up Private LimitedZongoo Commercial Co. Private Limited
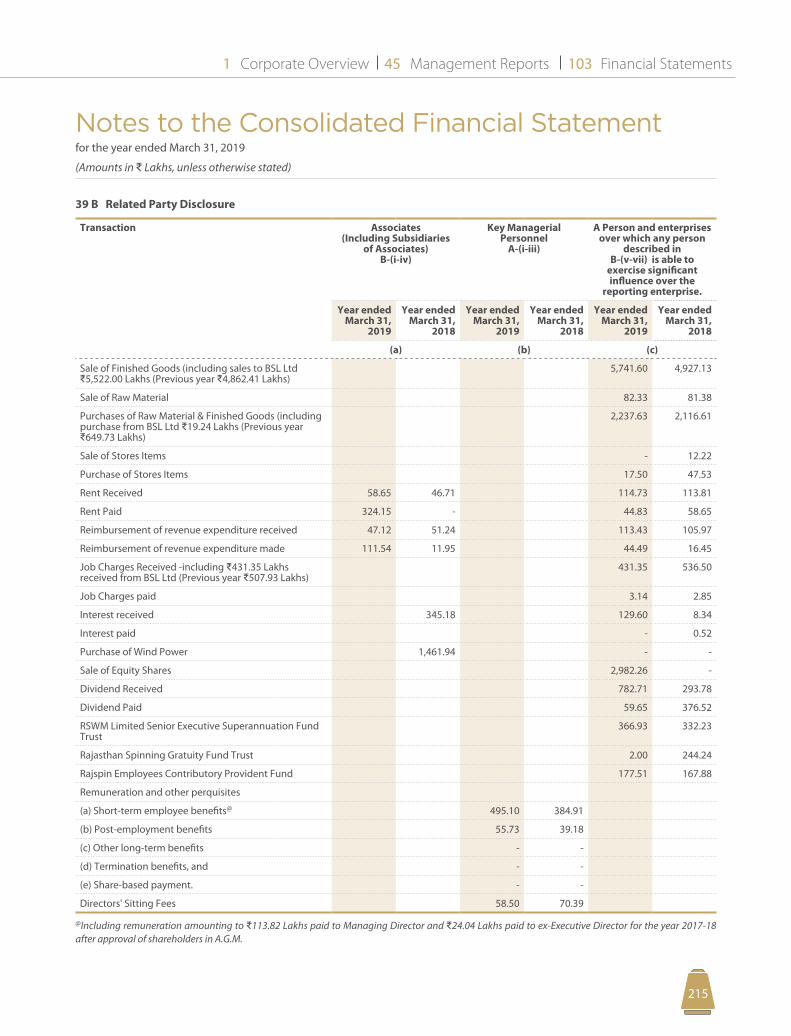
Notes to the Consolidated Financial Statement for the year ended March 31, 2019
(Amounts in D Lakhs, unless otherwise stated)
Corporate Overview Management Reports Financial Statements1 45 103
215214
39 B Related Party Disclosure
Transaction Associates (Including Subsidiaries
of Associates)B-(i-iv)
Key Managerial Personnel
A-(i-iii)
A Person and enterprises over which any person
described in B-(v-vii) is able to
exercise significant influence over the
reporting enterprise.
Year ended March 31,
2019
Year ended March 31,
2018
Year ended March 31,
2019
Year ended March 31,
2018
Year ended March 31,
2019
Year ended March 31,
2018
(a) (b) (c)
Sale of Finished Goods (including sales to BSL Ltd D5,522.00 Lakhs (Previous year D4,862.41 Lakhs)
5,741.60 4,927.13
Sale of Raw Material 82.33 81.38
Purchases of Raw Material & Finished Goods (including purchase from BSL Ltd D19.24 Lakhs (Previous year D649.73 Lakhs)
2,237.63 2,116.61
Sale of Stores Items - 12.22
Purchase of Stores Items 17.50 47.53
Rent Received 58.65 46.71 114.73 113.81
Rent Paid 324.15 - 44.83 58.65
Reimbursement of revenue expenditure received 47.12 51.24 113.43 105.97
Reimbursement of revenue expenditure made 111.54 11.95 44.49 16.45
Job Charges Received -including D431.35 Lakhs received from BSL Ltd (Previous year D507.93 Lakhs)
431.35 536.50
Job Charges paid 3.14 2.85
Interest received 345.18 129.60 8.34
Interest paid - 0.52
Purchase of Wind Power 1,461.94 - -
Sale of Equity Shares 2,982.26 -
Dividend Received 782.71 293.78
Dividend Paid 59.65 376.52
RSWM Limited Senior Executive Superannuation Fund Trust
366.93 332.23
Rajasthan Spinning Gratuity Fund Trust 2.00 244.24
Rajspin Employees Contributory Provident Fund 177.51 167.88
Remuneration and other perquisites
(a) Short-term employee benefits@ 495.10 384.91
(b) Post-employment benefits 55.73 39.18
(c) Other long-term benefits - -
(d) Termination benefits, and - -
(e) Share-based payment. - -
Directors' Sitting Fees 58.50 70.39
@Including remuneration amounting to D113.82 Lakhs paid to Managing Director and D24.04 Lakhs paid to ex-Executive Director for the year 2017-18 after approval of shareholders in A.G.M.
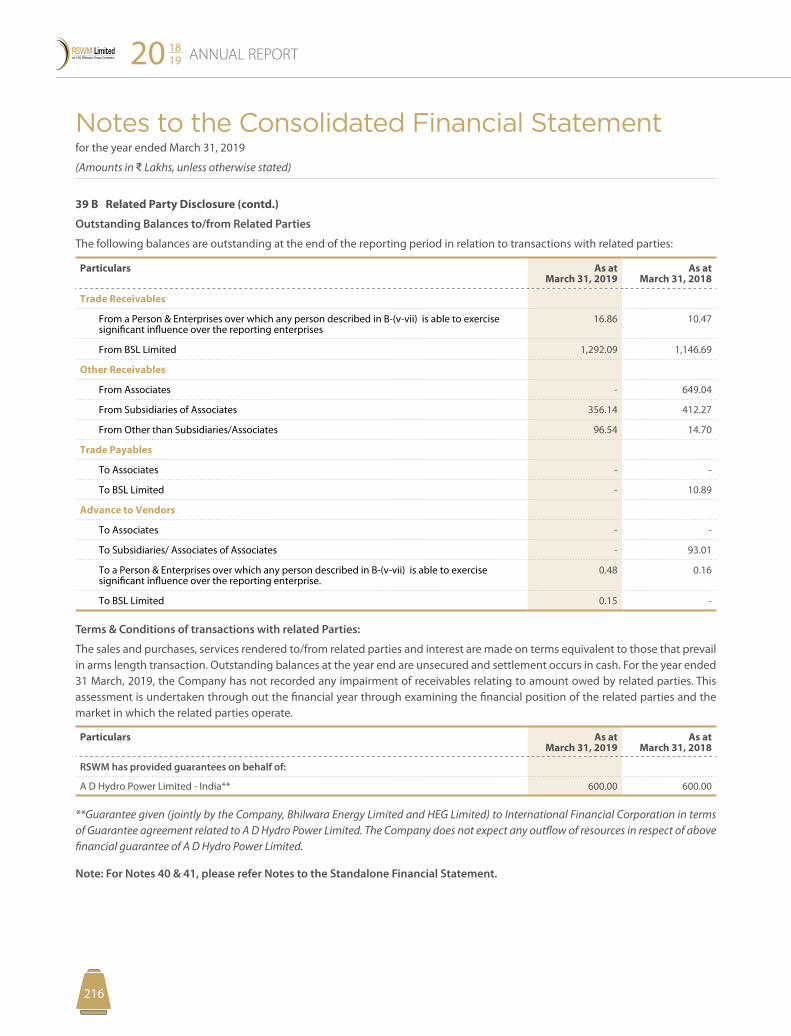
Notes to the Consolidated Financial Statement for the year ended March 31, 2019
(Amounts in D Lakhs, unless otherwise stated)
ANNUAL REPORT20 1819
217216
39 B Related Party Disclosure (contd.)
Outstanding Balances to/from Related Parties
The following balances are outstanding at the end of the reporting period in relation to transactions with related parties:
Particulars As at March 31, 2019
As at March 31, 2018
Trade Receivables
From a Person & Enterprises over which any person described in B-(v-vii) is able to exercise significant influence over the reporting enterprises
16.86 10.47
From BSL Limited 1,292.09 1,146.69
Other Receivables
From Associates - 649.04
From Subsidiaries of Associates 356.14 412.27
From Other than Subsidiaries/Associates 96.54 14.70
Trade Payables
To Associates - -
To BSL Limited - 10.89
Advance to Vendors
To Associates - -
To Subsidiaries/ Associates of Associates - 93.01
To a Person & Enterprises over which any person described in B-(v-vii) is able to exercise significant influence over the reporting enterprise.
0.48 0.16
To BSL Limited 0.15 -
Terms & Conditions of transactions with related Parties:
The sales and purchases, services rendered to/from related parties and interest are made on terms equivalent to those that prevail in arms length transaction. Outstanding balances at the year end are unsecured and settlement occurs in cash. For the year ended 31 March, 2019, the Company has not recorded any impairment of receivables relating to amount owed by related parties. This assessment is undertaken through out the financial year through examining the financial position of the related parties and the market in which the related parties operate.
Particulars As at March 31, 2019
As at March 31, 2018
RSWM has provided guarantees on behalf of:
A D Hydro Power Limited - India** 600.00 600.00
**Guarantee given (jointly by the Company, Bhilwara Energy Limited and HEG Limited) to International Financial Corporation in terms of Guarantee agreement related to A D Hydro Power Limited. The Company does not expect any outflow of resources in respect of above financial guarantee of A D Hydro Power Limited.
Note: For Notes 40 & 41, please refer Notes to the Standalone Financial Statement.
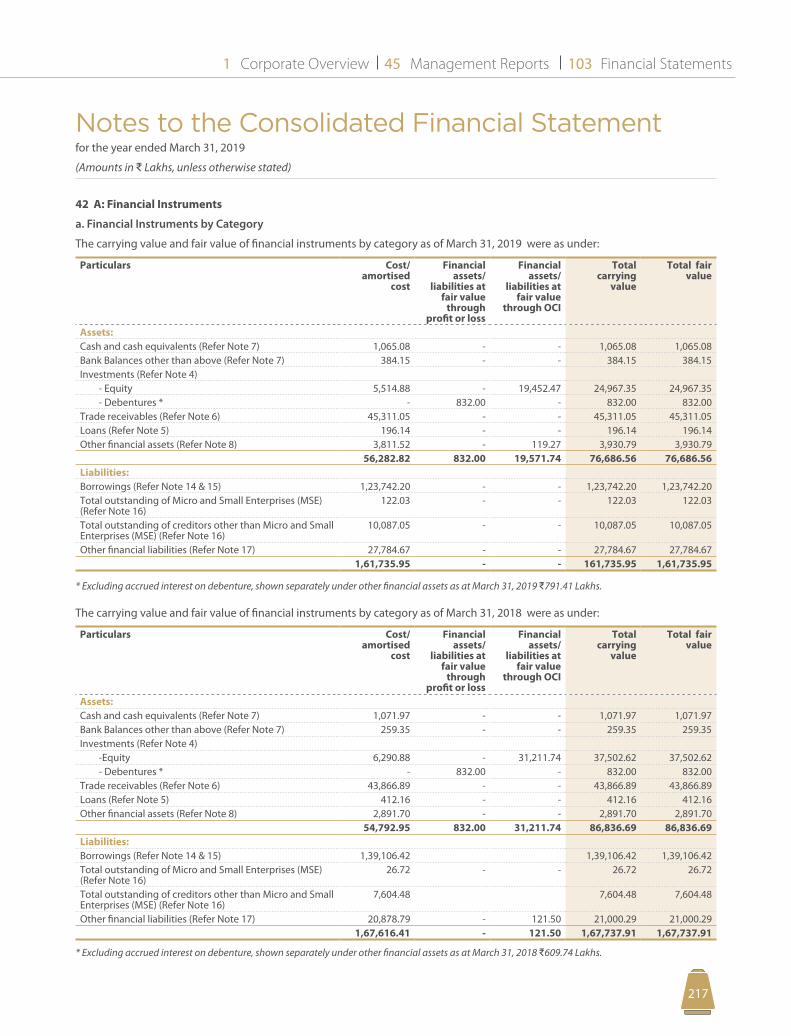
Notes to the Consolidated Financial Statement for the year ended March 31, 2019
(Amounts in D Lakhs, unless otherwise stated)
Corporate Overview Management Reports Financial Statements1 45 103
217216
42 A: Financial Instruments
a. Financial Instruments by Category
The carrying value and fair value of financial instruments by category as of March 31, 2019 were as under:
Particulars Cost/amortised
cost
Financial assets/
liabilities at fair value
through profit or loss
Financial assets/
liabilities at fair value
through OCI
Total carrying
value
Total fair value
Assets:Cash and cash equivalents (Refer Note 7) 1,065.08 - - 1,065.08 1,065.08 Bank Balances other than above (Refer Note 7) 384.15 - - 384.15 384.15 Investments (Refer Note 4)
- Equity 5,514.88 - 19,452.47 24,967.35 24,967.35- Debentures * - 832.00 - 832.00 832.00
Trade receivables (Refer Note 6) 45,311.05 - - 45,311.05 45,311.05 Loans (Refer Note 5) 196.14 - - 196.14 196.14 Other financial assets (Refer Note 8) 3,811.52 - 119.27 3,930.79 3,930.79
56,282.82 832.00 19,571.74 76,686.56 76,686.56Liabilities:Borrowings (Refer Note 14 & 15) 1,23,742.20 - - 1,23,742.20 1,23,742.20 Total outstanding of Micro and Small Enterprises (MSE) (Refer Note 16)
122.03 - - 122.03 122.03
Total outstanding of creditors other than Micro and Small Enterprises (MSE) (Refer Note 16)
10,087.05 - - 10,087.05 10,087.05
Other financial liabilities (Refer Note 17) 27,784.67 - - 27,784.67 27,784.67 1,61,735.95 - - 161,735.95 1,61,735.95
* Excluding accrued interest on debenture, shown separately under other financial assets as at March 31, 2019 D791.41 Lakhs.
The carrying value and fair value of financial instruments by category as of March 31, 2018 were as under:
Particulars Cost/amortised
cost
Financial assets/
liabilities at fair value
through profit or loss
Financial assets/
liabilities at fair value
through OCI
Total carrying
value
Total fair value
Assets:Cash and cash equivalents (Refer Note 7) 1,071.97 - - 1,071.97 1,071.97 Bank Balances other than above (Refer Note 7) 259.35 - - 259.35 259.35 Investments (Refer Note 4)
-Equity 6,290.88 - 31,211.74 37,502.62 37,502.62- Debentures * - 832.00 - 832.00 832.00
Trade receivables (Refer Note 6) 43,866.89 - - 43,866.89 43,866.89 Loans (Refer Note 5) 412.16 - - 412.16 412.16 Other financial assets (Refer Note 8) 2,891.70 - - 2,891.70 2,891.70
54,792.95 832.00 31,211.74 86,836.69 86,836.69Liabilities:Borrowings (Refer Note 14 & 15) 1,39,106.42 1,39,106.42 1,39,106.42 Total outstanding of Micro and Small Enterprises (MSE) (Refer Note 16)
26.72 - - 26.72 26.72
Total outstanding of creditors other than Micro and Small Enterprises (MSE) (Refer Note 16)
7,604.48 7,604.48 7,604.48
Other financial liabilities (Refer Note 17) 20,878.79 - 121.50 21,000.29 21,000.29 1,67,616.41 - 121.50 1,67,737.91 1,67,737.91
* Excluding accrued interest on debenture, shown separately under other financial assets as at March 31, 2018 D609.74 Lakhs.
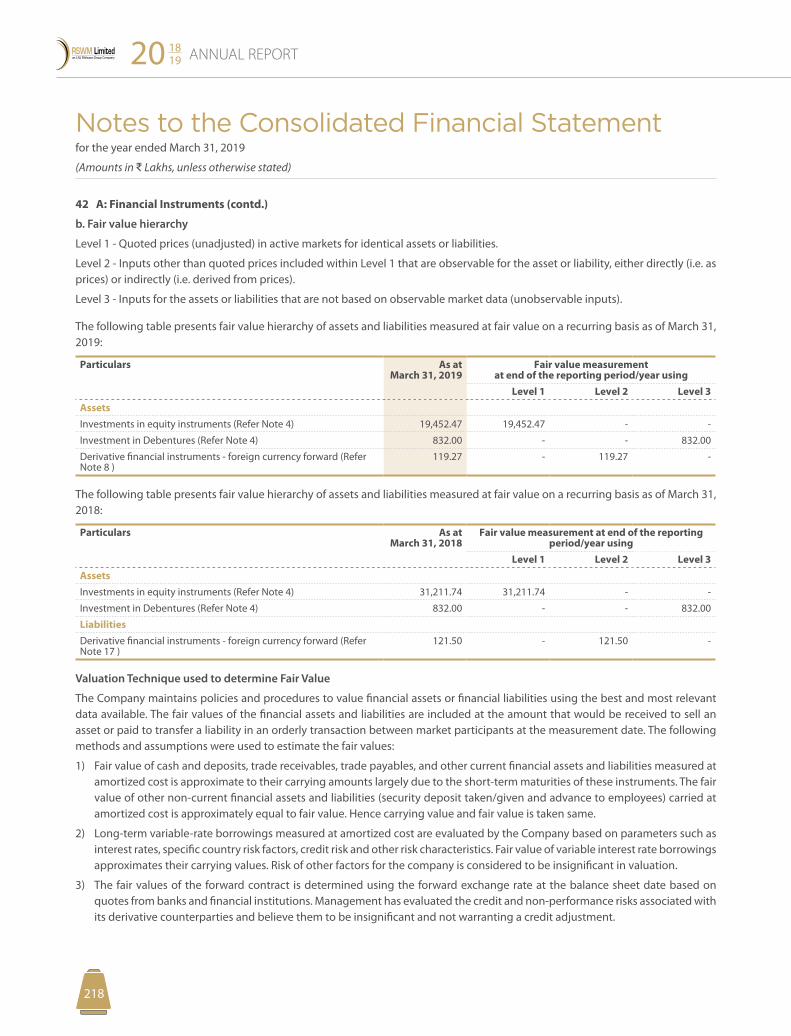
Notes to the Consolidated Financial Statement for the year ended March 31, 2019
(Amounts in D Lakhs, unless otherwise stated)
ANNUAL REPORT20 1819
219218
42 A: Financial Instruments (contd.)
b. Fair value hierarchy
Level 1 - Quoted prices (unadjusted) in active markets for identical assets or liabilities.
Level 2 - Inputs other than quoted prices included within Level 1 that are observable for the asset or liability, either directly (i.e. as prices) or indirectly (i.e. derived from prices).
Level 3 - Inputs for the assets or liabilities that are not based on observable market data (unobservable inputs).
The following table presents fair value hierarchy of assets and liabilities measured at fair value on a recurring basis as of March 31, 2019:
Particulars As at March 31, 2019
Fair value measurement at end of the reporting period/year using
Level 1 Level 2 Level 3AssetsInvestments in equity instruments (Refer Note 4) 19,452.47 19,452.47 - -
Investment in Debentures (Refer Note 4) 832.00 - - 832.00
Derivative financial instruments - foreign currency forward (Refer Note 8 )
119.27 - 119.27 -
The following table presents fair value hierarchy of assets and liabilities measured at fair value on a recurring basis as of March 31, 2018:
Particulars As at March 31, 2018
Fair value measurement at end of the reporting period/year using
Level 1 Level 2 Level 3AssetsInvestments in equity instruments (Refer Note 4) 31,211.74 31,211.74 - -
Investment in Debentures (Refer Note 4) 832.00 - - 832.00
LiabilitiesDerivative financial instruments - foreign currency forward (Refer Note 17 )
121.50 - 121.50 -
Valuation Technique used to determine Fair Value
The Company maintains policies and procedures to value financial assets or financial liabilities using the best and most relevant data available. The fair values of the financial assets and liabilities are included at the amount that would be received to sell an asset or paid to transfer a liability in an orderly transaction between market participants at the measurement date. The following methods and assumptions were used to estimate the fair values:
1) Fair value of cash and deposits, trade receivables, trade payables, and other current financial assets and liabilities measured at amortized cost is approximate to their carrying amounts largely due to the short-term maturities of these instruments. The fair value of other non-current financial assets and liabilities (security deposit taken/given and advance to employees) carried at amortized cost is approximately equal to fair value. Hence carrying value and fair value is taken same.
2) Long-term variable-rate borrowings measured at amortized cost are evaluated by the Company based on parameters such as interest rates, specific country risk factors, credit risk and other risk characteristics. Fair value of variable interest rate borrowings approximates their carrying values. Risk of other factors for the company is considered to be insignificant in valuation.
3) The fair values of the forward contract is determined using the forward exchange rate at the balance sheet date based on quotes from banks and financial institutions. Management has evaluated the credit and non-performance risks associated with its derivative counterparties and believe them to be insignificant and not warranting a credit adjustment.
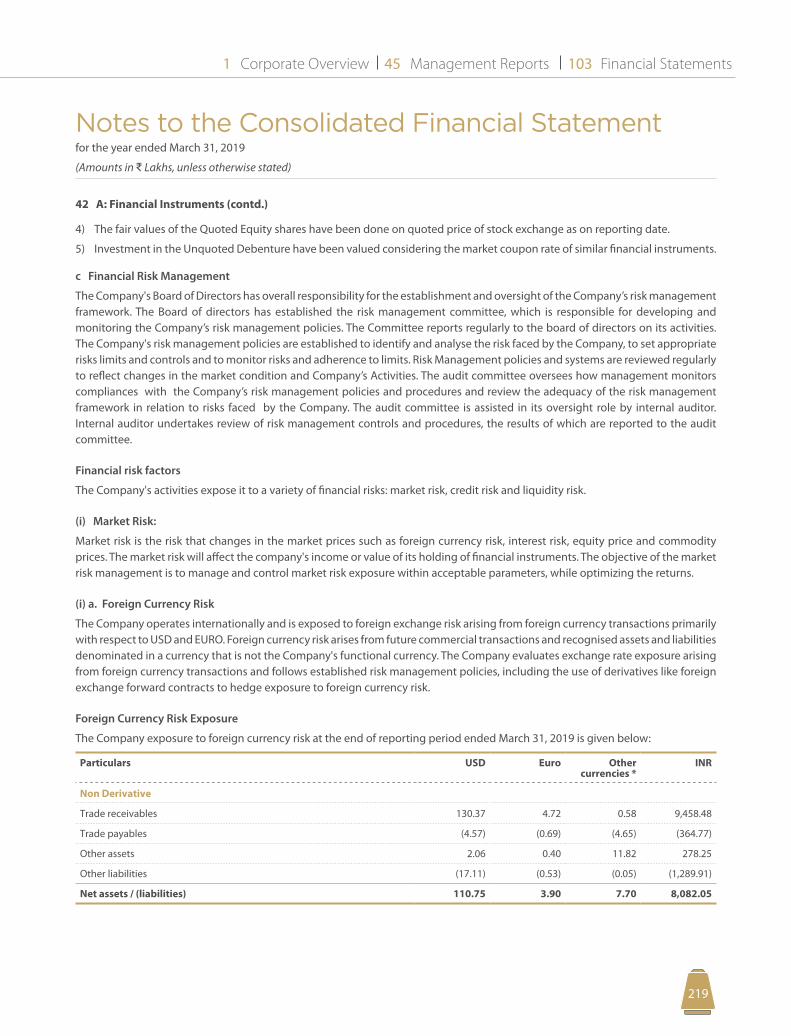
Notes to the Consolidated Financial Statement for the year ended March 31, 2019
(Amounts in D Lakhs, unless otherwise stated)
Corporate Overview Management Reports Financial Statements1 45 103
219218
4) The fair values of the Quoted Equity shares have been done on quoted price of stock exchange as on reporting date.
5) Investment in the Unquoted Debenture have been valued considering the market coupon rate of similar financial instruments.
c Financial Risk Management
The Company's Board of Directors has overall responsibility for the establishment and oversight of the Company’s risk management framework. The Board of directors has established the risk management committee, which is responsible for developing and monitoring the Company’s risk management policies. The Committee reports regularly to the board of directors on its activities. The Company's risk management policies are established to identify and analyse the risk faced by the Company, to set appropriate risks limits and controls and to monitor risks and adherence to limits. Risk Management policies and systems are reviewed regularly to reflect changes in the market condition and Company’s Activities. The audit committee oversees how management monitors compliances with the Company’s risk management policies and procedures and review the adequacy of the risk management framework in relation to risks faced by the Company. The audit committee is assisted in its oversight role by internal auditor. Internal auditor undertakes review of risk management controls and procedures, the results of which are reported to the audit committee.
Financial risk factors
The Company's activities expose it to a variety of financial risks: market risk, credit risk and liquidity risk.
(i) Market Risk:
Market risk is the risk that changes in the market prices such as foreign currency risk, interest risk, equity price and commodity prices. The market risk will affect the company's income or value of its holding of financial instruments. The objective of the market risk management is to manage and control market risk exposure within acceptable parameters, while optimizing the returns.
(i) a. Foreign Currency Risk
The Company operates internationally and is exposed to foreign exchange risk arising from foreign currency transactions primarily with respect to USD and EURO. Foreign currency risk arises from future commercial transactions and recognised assets and liabilities denominated in a currency that is not the Company's functional currency. The Company evaluates exchange rate exposure arising from foreign currency transactions and follows established risk management policies, including the use of derivatives like foreign exchange forward contracts to hedge exposure to foreign currency risk.
Foreign Currency Risk Exposure
The Company exposure to foreign currency risk at the end of reporting period ended March 31, 2019 is given below:
Particulars USD Euro Other currencies *
INR
Non Derivative
Trade receivables 130.37 4.72 0.58 9,458.48
Trade payables (4.57) (0.69) (4.65) (364.77)
Other assets 2.06 0.40 11.82 278.25
Other liabilities (17.11) (0.53) (0.05) (1,289.91)
Net assets / (liabilities) 110.75 3.90 7.70 8,082.05
42 A: Financial Instruments (contd.)
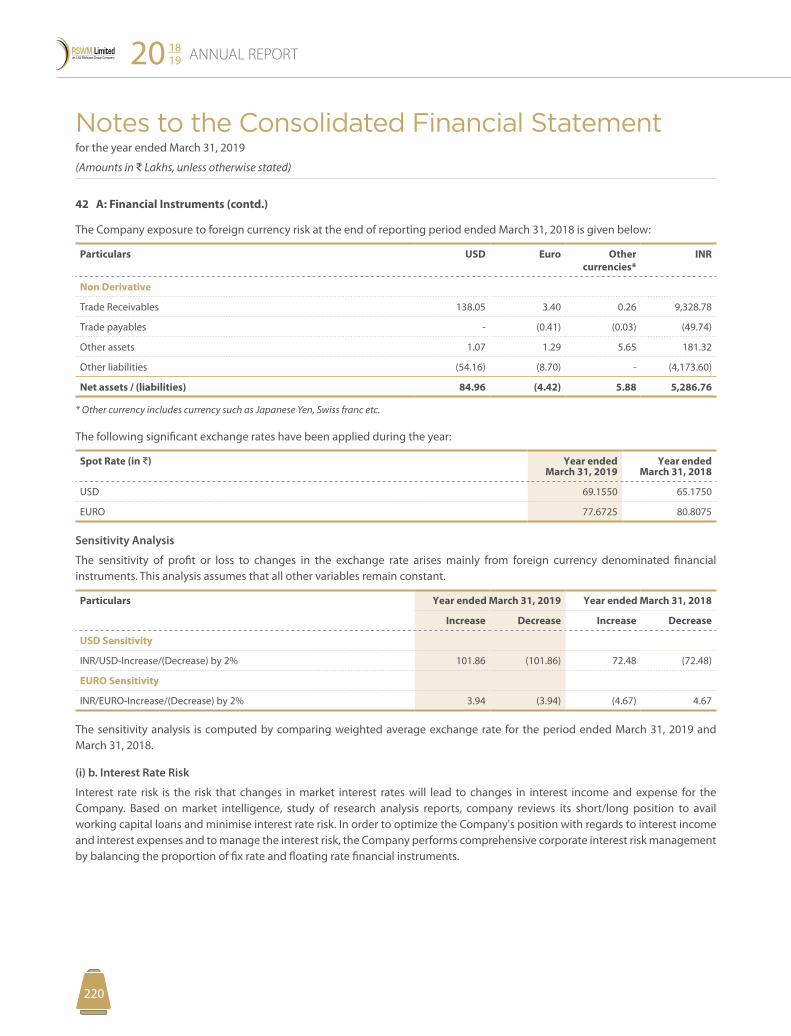
Notes to the Consolidated Financial Statement for the year ended March 31, 2019
(Amounts in D Lakhs, unless otherwise stated)
ANNUAL REPORT20 1819
221220
The Company exposure to foreign currency risk at the end of reporting period ended March 31, 2018 is given below:
Particulars USD Euro Other currencies*
INR
Non Derivative
Trade Receivables 138.05 3.40 0.26 9,328.78
Trade payables - (0.41) (0.03) (49.74)
Other assets 1.07 1.29 5.65 181.32
Other liabilities (54.16) (8.70) - (4,173.60)
Net assets / (liabilities) 84.96 (4.42) 5.88 5,286.76
* Other currency includes currency such as Japanese Yen, Swiss franc etc.
The following significant exchange rates have been applied during the year:
Spot Rate (in D) Year ended March 31, 2019
Year ended March 31, 2018
USD 69.1550 65.1750
EURO 77.6725 80.8075
Sensitivity Analysis
The sensitivity of profit or loss to changes in the exchange rate arises mainly from foreign currency denominated financial instruments. This analysis assumes that all other variables remain constant.
Particulars Year ended March 31, 2019 Year ended March 31, 2018
Increase Decrease Increase Decrease
USD Sensitivity
INR/USD-Increase/(Decrease) by 2% 101.86 (101.86) 72.48 (72.48)
EURO Sensitivity
INR/EURO-Increase/(Decrease) by 2% 3.94 (3.94) (4.67) 4.67
The sensitivity analysis is computed by comparing weighted average exchange rate for the period ended March 31, 2019 and March 31, 2018.
(i) b. Interest Rate Risk
Interest rate risk is the risk that changes in market interest rates will lead to changes in interest income and expense for the Company. Based on market intelligence, study of research analysis reports, company reviews its short/long position to avail working capital loans and minimise interest rate risk. In order to optimize the Company's position with regards to interest income and interest expenses and to manage the interest risk, the Company performs comprehensive corporate interest risk management by balancing the proportion of fix rate and floating rate financial instruments.
42 A: Financial Instruments (contd.)
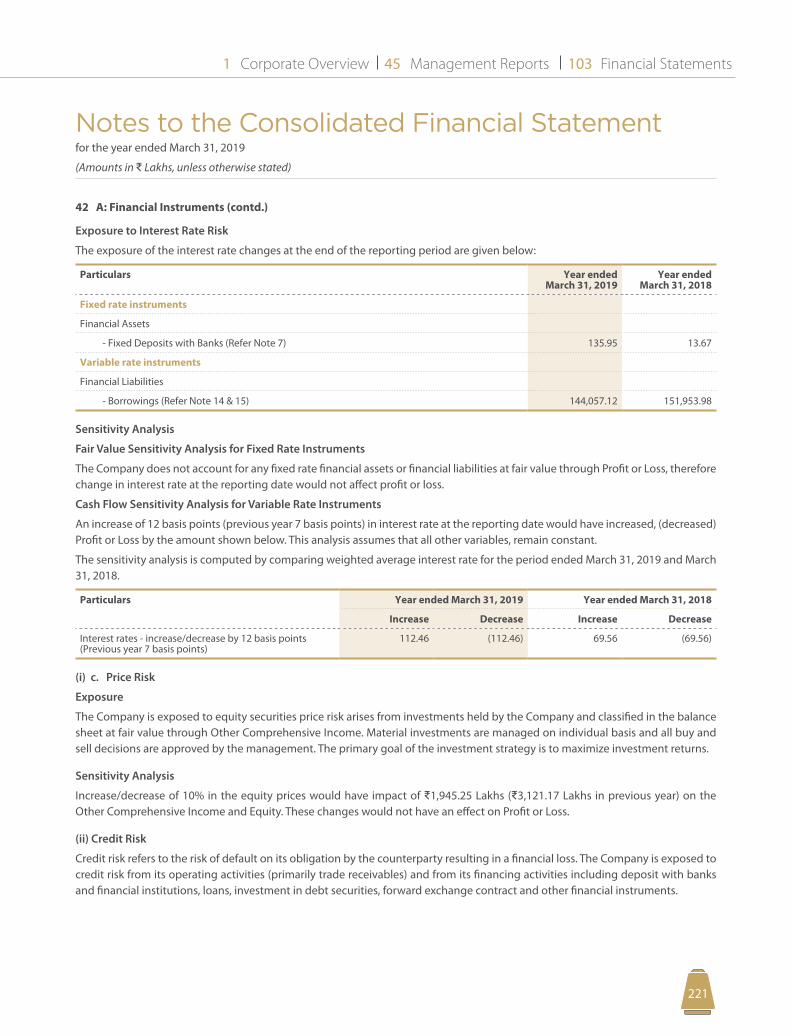
Notes to the Consolidated Financial Statement for the year ended March 31, 2019
(Amounts in D Lakhs, unless otherwise stated)
Corporate Overview Management Reports Financial Statements1 45 103
221220
42 A: Financial Instruments (contd.)
Exposure to Interest Rate Risk
The exposure of the interest rate changes at the end of the reporting period are given below:
Particulars Year ended March 31, 2019
Year ended March 31, 2018
Fixed rate instruments
Financial Assets
- Fixed Deposits with Banks (Refer Note 7) 135.95 13.67
Variable rate instruments
Financial Liabilities
- Borrowings (Refer Note 14 & 15) 144,057.12 151,953.98
Sensitivity Analysis
Fair Value Sensitivity Analysis for Fixed Rate Instruments
The Company does not account for any fixed rate financial assets or financial liabilities at fair value through Profit or Loss, therefore change in interest rate at the reporting date would not affect profit or loss.
Cash Flow Sensitivity Analysis for Variable Rate Instruments
An increase of 12 basis points (previous year 7 basis points) in interest rate at the reporting date would have increased, (decreased) Profit or Loss by the amount shown below. This analysis assumes that all other variables, remain constant.
The sensitivity analysis is computed by comparing weighted average interest rate for the period ended March 31, 2019 and March 31, 2018.
Particulars Year ended March 31, 2019 Year ended March 31, 2018
Increase Decrease Increase Decrease
Interest rates - increase/decrease by 12 basis points (Previous year 7 basis points)
112.46 (112.46) 69.56 (69.56)
(i) c. Price Risk
Exposure
The Company is exposed to equity securities price risk arises from investments held by the Company and classified in the balance sheet at fair value through Other Comprehensive Income. Material investments are managed on individual basis and all buy and sell decisions are approved by the management. The primary goal of the investment strategy is to maximize investment returns.
Sensitivity Analysis
Increase/decrease of 10% in the equity prices would have impact of D1,945.25 Lakhs (D3,121.17 Lakhs in previous year) on the Other Comprehensive Income and Equity. These changes would not have an effect on Profit or Loss.
(ii) Credit Risk
Credit risk refers to the risk of default on its obligation by the counterparty resulting in a financial loss. The Company is exposed to credit risk from its operating activities (primarily trade receivables) and from its financing activities including deposit with banks and financial institutions, loans, investment in debt securities, forward exchange contract and other financial instruments.
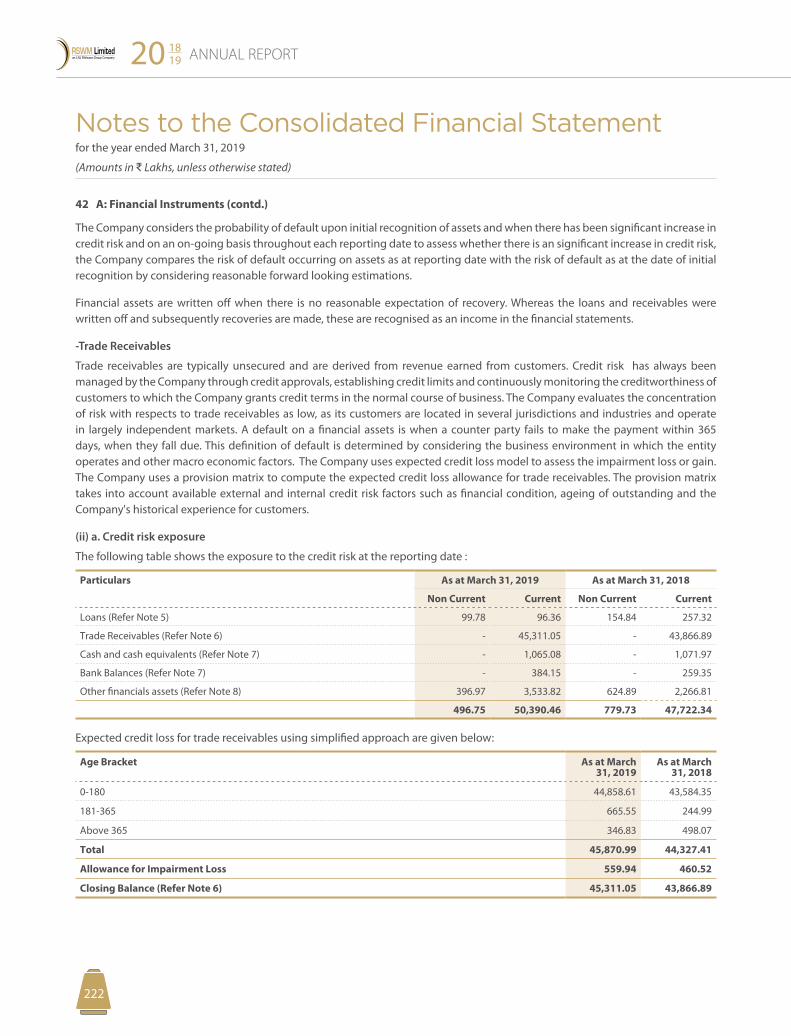
Notes to the Consolidated Financial Statement for the year ended March 31, 2019
(Amounts in D Lakhs, unless otherwise stated)
ANNUAL REPORT20 1819
223222
42 A: Financial Instruments (contd.)
The Company considers the probability of default upon initial recognition of assets and when there has been significant increase in credit risk and on an on-going basis throughout each reporting date to assess whether there is an significant increase in credit risk, the Company compares the risk of default occurring on assets as at reporting date with the risk of default as at the date of initial recognition by considering reasonable forward looking estimations.
Financial assets are written off when there is no reasonable expectation of recovery. Whereas the loans and receivables were written off and subsequently recoveries are made, these are recognised as an income in the financial statements.
-Trade Receivables
Trade receivables are typically unsecured and are derived from revenue earned from customers. Credit risk has always been managed by the Company through credit approvals, establishing credit limits and continuously monitoring the creditworthiness of customers to which the Company grants credit terms in the normal course of business. The Company evaluates the concentration of risk with respects to trade receivables as low, as its customers are located in several jurisdictions and industries and operate in largely independent markets. A default on a financial assets is when a counter party fails to make the payment within 365 days, when they fall due. This definition of default is determined by considering the business environment in which the entity operates and other macro economic factors. The Company uses expected credit loss model to assess the impairment loss or gain. The Company uses a provision matrix to compute the expected credit loss allowance for trade receivables. The provision matrix takes into account available external and internal credit risk factors such as financial condition, ageing of outstanding and the Company's historical experience for customers.
(ii) a. Credit risk exposure
The following table shows the exposure to the credit risk at the reporting date :
Particulars As at March 31, 2019 As at March 31, 2018
Non Current Current Non Current Current
Loans (Refer Note 5) 99.78 96.36 154.84 257.32
Trade Receivables (Refer Note 6) - 45,311.05 - 43,866.89
Cash and cash equivalents (Refer Note 7) - 1,065.08 - 1,071.97
Bank Balances (Refer Note 7) - 384.15 - 259.35
Other financials assets (Refer Note 8) 396.97 3,533.82 624.89 2,266.81
496.75 50,390.46 779.73 47,722.34
Expected credit loss for trade receivables using simplified approach are given below:
Age Bracket As at March 31, 2019
As at March 31, 2018
0-180 44,858.61 43,584.35
181-365 665.55 244.99
Above 365 346.83 498.07
Total 45,870.99 44,327.41
Allowance for Impairment Loss 559.94 460.52
Closing Balance (Refer Note 6) 45,311.05 43,866.89
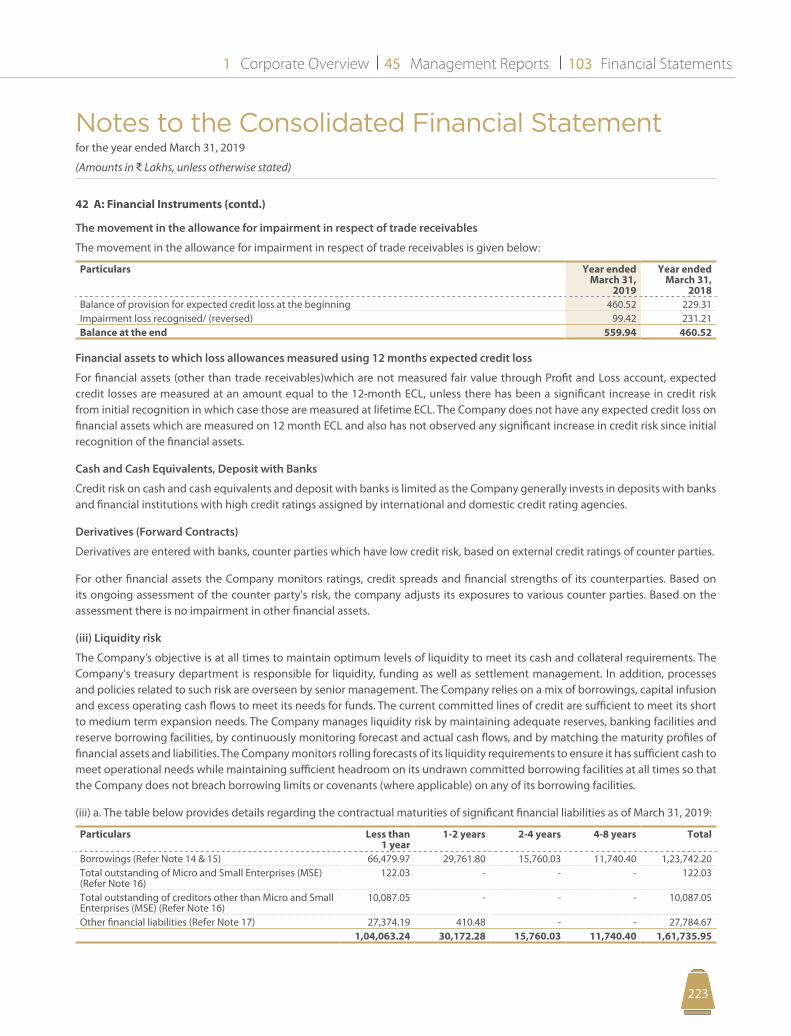
Notes to the Consolidated Financial Statement for the year ended March 31, 2019
(Amounts in D Lakhs, unless otherwise stated)
Corporate Overview Management Reports Financial Statements1 45 103
223222
The movement in the allowance for impairment in respect of trade receivables
The movement in the allowance for impairment in respect of trade receivables is given below:
Particulars Year ended March 31,
2019
Year ended March 31,
2018Balance of provision for expected credit loss at the beginning 460.52 229.31 Impairment loss recognised/ (reversed) 99.42 231.21 Balance at the end 559.94 460.52
Financial assets to which loss allowances measured using 12 months expected credit loss
For financial assets (other than trade receivables)which are not measured fair value through Profit and Loss account, expected credit losses are measured at an amount equal to the 12-month ECL, unless there has been a significant increase in credit risk from initial recognition in which case those are measured at lifetime ECL. The Company does not have any expected credit loss on financial assets which are measured on 12 month ECL and also has not observed any significant increase in credit risk since initial recognition of the financial assets.
Cash and Cash Equivalents, Deposit with Banks
Credit risk on cash and cash equivalents and deposit with banks is limited as the Company generally invests in deposits with banks and financial institutions with high credit ratings assigned by international and domestic credit rating agencies.
Derivatives (Forward Contracts)
Derivatives are entered with banks, counter parties which have low credit risk, based on external credit ratings of counter parties.
For other financial assets the Company monitors ratings, credit spreads and financial strengths of its counterparties. Based on its ongoing assessment of the counter party's risk, the company adjusts its exposures to various counter parties. Based on the assessment there is no impairment in other financial assets.
(iii) Liquidity risk
The Company’s objective is at all times to maintain optimum levels of liquidity to meet its cash and collateral requirements. The Company's treasury department is responsible for liquidity, funding as well as settlement management. In addition, processes and policies related to such risk are overseen by senior management. The Company relies on a mix of borrowings, capital infusion and excess operating cash flows to meet its needs for funds. The current committed lines of credit are sufficient to meet its short to medium term expansion needs. The Company manages liquidity risk by maintaining adequate reserves, banking facilities and reserve borrowing facilities, by continuously monitoring forecast and actual cash flows, and by matching the maturity profiles of financial assets and liabilities. The Company monitors rolling forecasts of its liquidity requirements to ensure it has sufficient cash to meet operational needs while maintaining sufficient headroom on its undrawn committed borrowing facilities at all times so that the Company does not breach borrowing limits or covenants (where applicable) on any of its borrowing facilities.
(iii) a. The table below provides details regarding the contractual maturities of significant financial liabilities as of March 31, 2019:
Particulars Less than 1 year
1-2 years 2-4 years 4-8 years Total
Borrowings (Refer Note 14 & 15) 66,479.97 29,761.80 15,760.03 11,740.40 1,23,742.20 Total outstanding of Micro and Small Enterprises (MSE) (Refer Note 16)
122.03 - - - 122.03
Total outstanding of creditors other than Micro and Small Enterprises (MSE) (Refer Note 16)
10,087.05 - - - 10,087.05
Other financial liabilities (Refer Note 17) 27,374.19 410.48 - - 27,784.67 1,04,063.24 30,172.28 15,760.03 11,740.40 1,61,735.95
42 A: Financial Instruments (contd.)
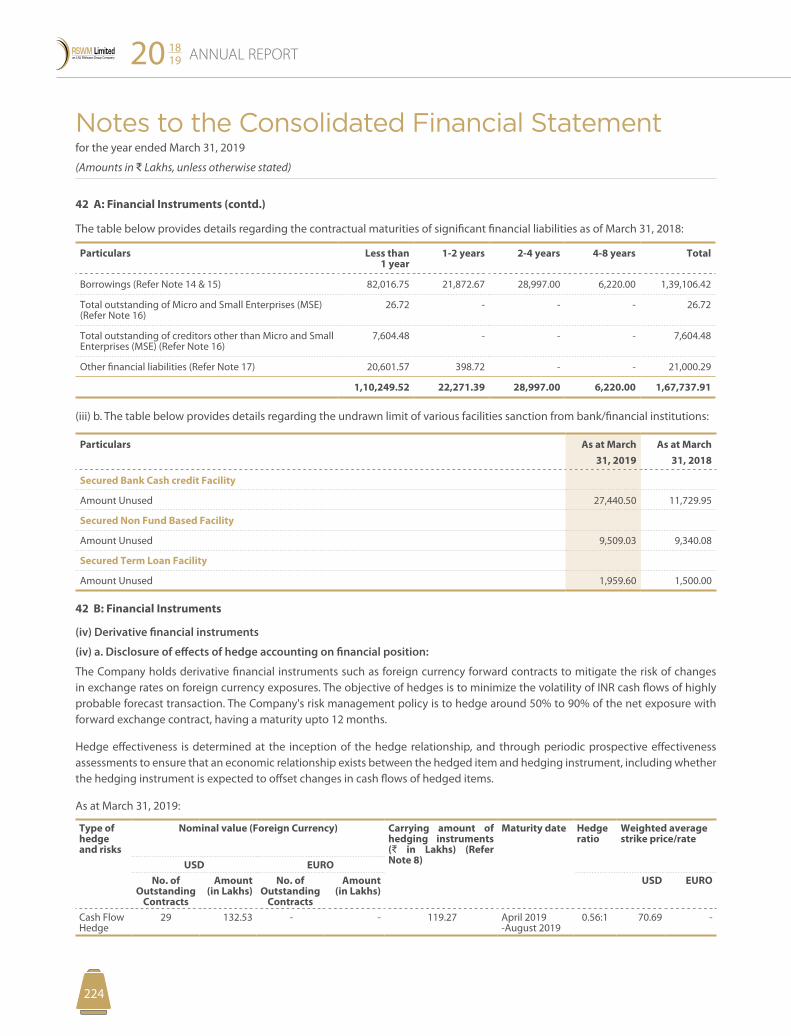
Notes to the Consolidated Financial Statement for the year ended March 31, 2019
(Amounts in D Lakhs, unless otherwise stated)
ANNUAL REPORT20 1819
225224
The table below provides details regarding the contractual maturities of significant financial liabilities as of March 31, 2018:
Particulars Less than 1 year
1-2 years 2-4 years 4-8 years Total
Borrowings (Refer Note 14 & 15) 82,016.75 21,872.67 28,997.00 6,220.00 1,39,106.42
Total outstanding of Micro and Small Enterprises (MSE) (Refer Note 16)
26.72 - - - 26.72
Total outstanding of creditors other than Micro and Small Enterprises (MSE) (Refer Note 16)
7,604.48 - - - 7,604.48
Other financial liabilities (Refer Note 17) 20,601.57 398.72 - - 21,000.29
1,10,249.52 22,271.39 28,997.00 6,220.00 1,67,737.91
(iii) b. The table below provides details regarding the undrawn limit of various facilities sanction from bank/financial institutions:
Particulars As at March 31, 2019
As at March 31, 2018
Secured Bank Cash credit Facility
Amount Unused 27,440.50 11,729.95
Secured Non Fund Based Facility
Amount Unused 9,509.03 9,340.08
Secured Term Loan Facility
Amount Unused 1,959.60 1,500.00
42 B: Financial Instruments
(iv) Derivative financial instruments
(iv) a. Disclosure of effects of hedge accounting on financial position:
The Company holds derivative financial instruments such as foreign currency forward contracts to mitigate the risk of changes in exchange rates on foreign currency exposures. The objective of hedges is to minimize the volatility of INR cash flows of highly probable forecast transaction. The Company's risk management policy is to hedge around 50% to 90% of the net exposure with forward exchange contract, having a maturity upto 12 months.
Hedge effectiveness is determined at the inception of the hedge relationship, and through periodic prospective effectiveness assessments to ensure that an economic relationship exists between the hedged item and hedging instrument, including whether the hedging instrument is expected to offset changes in cash flows of hedged items.
As at March 31, 2019:
Type of hedge and risks
Nominal value (Foreign Currency) Carrying amount of hedging instruments (D in Lakhs) (Refer Note 8)
Maturity date Hedge ratio
Weighted average strike price/rate
USD EURONo. of
Outstanding Contracts
Amount (in Lakhs)
No. of Outstanding
Contracts
Amount (in Lakhs)
USD EURO
Cash Flow Hedge
29 132.53 - - 119.27 April 2019 -August 2019
0.56:1 70.69 -
42 A: Financial Instruments (contd.)
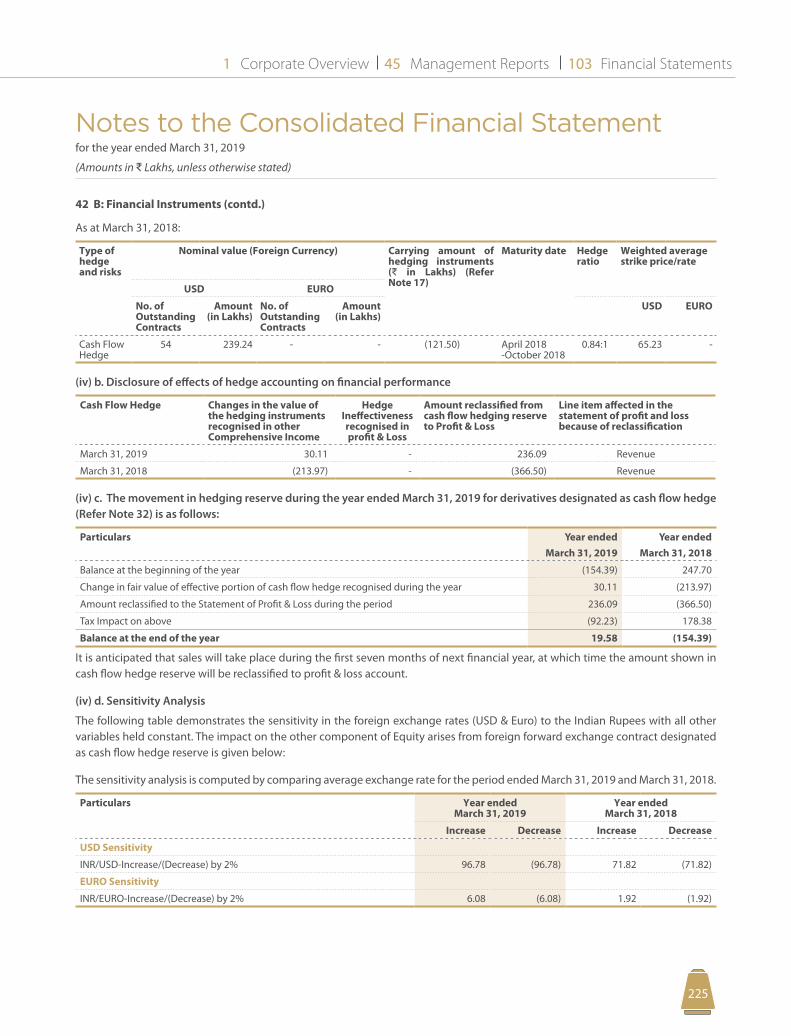
Notes to the Consolidated Financial Statement for the year ended March 31, 2019
(Amounts in D Lakhs, unless otherwise stated)
Corporate Overview Management Reports Financial Statements1 45 103
225224
42 B: Financial Instruments (contd.)
As at March 31, 2018:
Type of hedge and risks
Nominal value (Foreign Currency) Carrying amount of hedging instruments (D in Lakhs) (Refer Note 17)
Maturity date Hedge ratio
Weighted average strike price/rate
USD EURO
No. of Outstanding Contracts
Amount (in Lakhs)
No. of Outstanding Contracts
Amount (in Lakhs)
USD EURO
Cash Flow Hedge
54 239.24 - - (121.50) April 2018 -October 2018
0.84:1 65.23 -
(iv) b. Disclosure of effects of hedge accounting on financial performance
Cash Flow Hedge Changes in the value of the hedging instruments recognised in other Comprehensive Income
Hedge Ineffectiveness recognised in profit & Loss
Amount reclassified from cash flow hedging reserve to Profit & Loss
Line item affected in the statement of profit and loss because of reclassification
March 31, 2019 30.11 - 236.09 Revenue
March 31, 2018 (213.97) - (366.50) Revenue
(iv) c. The movement in hedging reserve during the year ended March 31, 2019 for derivatives designated as cash flow hedge (Refer Note 32) is as follows:
Particulars Year ended March 31, 2019
Year ended March 31, 2018
Balance at the beginning of the year (154.39) 247.70
Change in fair value of effective portion of cash flow hedge recognised during the year 30.11 (213.97)
Amount reclassified to the Statement of Profit & Loss during the period 236.09 (366.50)
Tax Impact on above (92.23) 178.38
Balance at the end of the year 19.58 (154.39)
It is anticipated that sales will take place during the first seven months of next financial year, at which time the amount shown in cash flow hedge reserve will be reclassified to profit & loss account.
(iv) d. Sensitivity Analysis
The following table demonstrates the sensitivity in the foreign exchange rates (USD & Euro) to the Indian Rupees with all other variables held constant. The impact on the other component of Equity arises from foreign forward exchange contract designated as cash flow hedge reserve is given below:
The sensitivity analysis is computed by comparing average exchange rate for the period ended March 31, 2019 and March 31, 2018.
Particulars Year ended March 31, 2019
Year ended March 31, 2018
Increase Decrease Increase Decrease
USD Sensitivity
INR/USD-Increase/(Decrease) by 2% 96.78 (96.78) 71.82 (71.82)
EURO Sensitivity
INR/EURO-Increase/(Decrease) by 2% 6.08 (6.08) 1.92 (1.92)
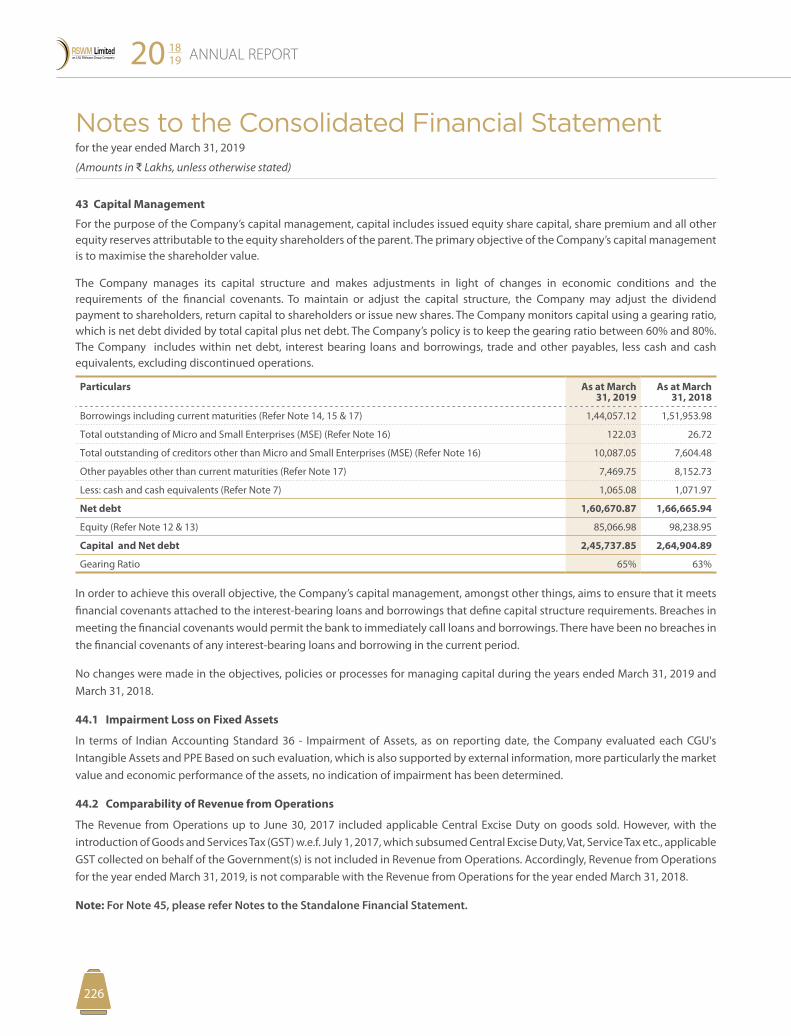
Notes to the Consolidated Financial Statement for the year ended March 31, 2019
(Amounts in D Lakhs, unless otherwise stated)
ANNUAL REPORT20 1819
227226
43 Capital Management
For the purpose of the Company’s capital management, capital includes issued equity share capital, share premium and all other equity reserves attributable to the equity shareholders of the parent. The primary objective of the Company’s capital management is to maximise the shareholder value.
The Company manages its capital structure and makes adjustments in light of changes in economic conditions and the requirements of the financial covenants. To maintain or adjust the capital structure, the Company may adjust the dividend payment to shareholders, return capital to shareholders or issue new shares. The Company monitors capital using a gearing ratio, which is net debt divided by total capital plus net debt. The Company’s policy is to keep the gearing ratio between 60% and 80%. The Company includes within net debt, interest bearing loans and borrowings, trade and other payables, less cash and cash equivalents, excluding discontinued operations.
Particulars As at March 31, 2019
As at March 31, 2018
Borrowings including current maturities (Refer Note 14, 15 & 17) 1,44,057.12 1,51,953.98
Total outstanding of Micro and Small Enterprises (MSE) (Refer Note 16) 122.03 26.72
Total outstanding of creditors other than Micro and Small Enterprises (MSE) (Refer Note 16) 10,087.05 7,604.48
Other payables other than current maturities (Refer Note 17) 7,469.75 8,152.73
Less: cash and cash equivalents (Refer Note 7) 1,065.08 1,071.97
Net debt 1,60,670.87 1,66,665.94
Equity (Refer Note 12 & 13) 85,066.98 98,238.95
Capital and Net debt 2,45,737.85 2,64,904.89
Gearing Ratio 65% 63%
In order to achieve this overall objective, the Company’s capital management, amongst other things, aims to ensure that it meets financial covenants attached to the interest-bearing loans and borrowings that define capital structure requirements. Breaches in meeting the financial covenants would permit the bank to immediately call loans and borrowings. There have been no breaches in the financial covenants of any interest-bearing loans and borrowing in the current period.
No changes were made in the objectives, policies or processes for managing capital during the years ended March 31, 2019 and March 31, 2018.
44.1 Impairment Loss on Fixed Assets
In terms of Indian Accounting Standard 36 - Impairment of Assets, as on reporting date, the Company evaluated each CGU's Intangible Assets and PPE Based on such evaluation, which is also supported by external information, more particularly the market value and economic performance of the assets, no indication of impairment has been determined.
44.2 Comparability of Revenue from Operations
The Revenue from Operations up to June 30, 2017 included applicable Central Excise Duty on goods sold. However, with the introduction of Goods and Services Tax (GST) w.e.f. July 1, 2017, which subsumed Central Excise Duty, Vat, Service Tax etc., applicable GST collected on behalf of the Government(s) is not included in Revenue from Operations. Accordingly, Revenue from Operations for the year ended March 31, 2019, is not comparable with the Revenue from Operations for the year ended March 31, 2018.
Note: For Note 45, please refer Notes to the Standalone Financial Statement.
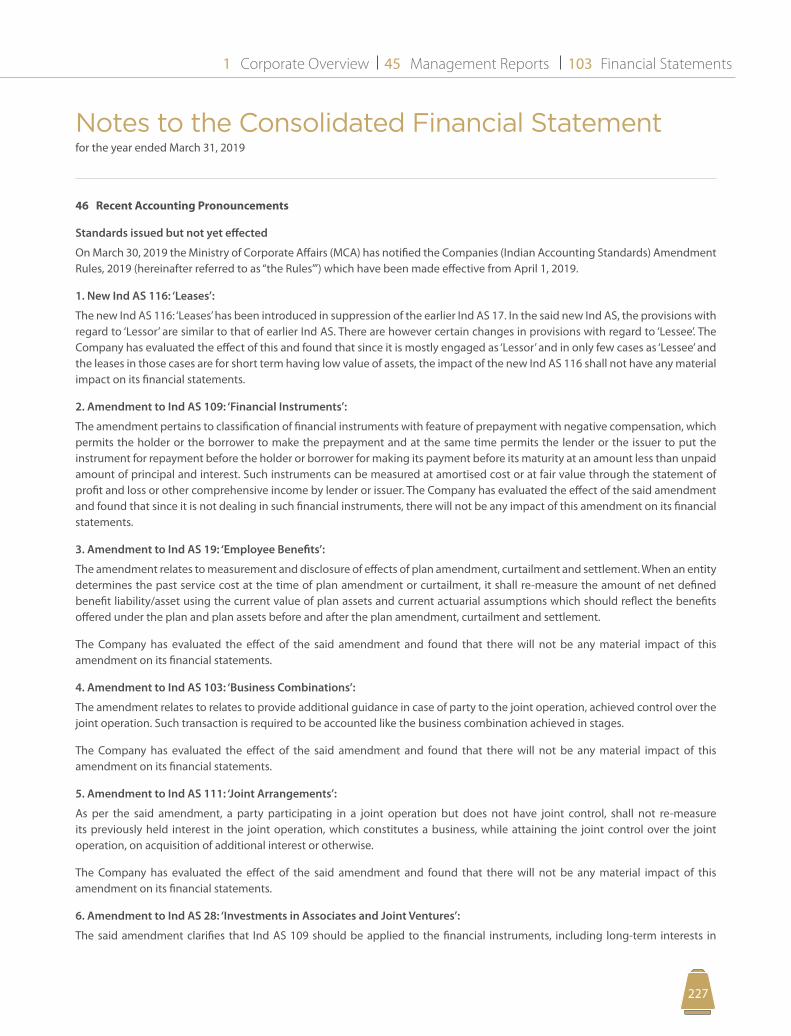
Corporate Overview Management Reports Financial Statements1 45 103
227226
Notes to the Consolidated Financial Statement for the year ended March 31, 2019
(Amounts in D Lakhs, unless otherwise stated)
46 Recent Accounting Pronouncements
Standards issued but not yet effected
On March 30, 2019 the Ministry of Corporate Affairs (MCA) has notified the Companies (Indian Accounting Standards) Amendment Rules, 2019 (hereinafter referred to as “the Rules’”) which have been made effective from April 1, 2019.
1. New Ind AS 116: ‘Leases’:
The new Ind AS 116: ‘Leases’ has been introduced in suppression of the earlier Ind AS 17. In the said new Ind AS, the provisions with regard to ‘Lessor’ are similar to that of earlier Ind AS. There are however certain changes in provisions with regard to ‘Lessee’. The Company has evaluated the effect of this and found that since it is mostly engaged as ‘Lessor’ and in only few cases as ‘Lessee’ and the leases in those cases are for short term having low value of assets, the impact of the new Ind AS 116 shall not have any material impact on its financial statements.
2. Amendment to Ind AS 109: ‘Financial Instruments’:
The amendment pertains to classification of financial instruments with feature of prepayment with negative compensation, which permits the holder or the borrower to make the prepayment and at the same time permits the lender or the issuer to put the instrument for repayment before the holder or borrower for making its payment before its maturity at an amount less than unpaid amount of principal and interest. Such instruments can be measured at amortised cost or at fair value through the statement of profit and loss or other comprehensive income by lender or issuer. The Company has evaluated the effect of the said amendment and found that since it is not dealing in such financial instruments, there will not be any impact of this amendment on its financial statements.
3. Amendment to Ind AS 19: ‘Employee Benefits’:
The amendment relates to measurement and disclosure of effects of plan amendment, curtailment and settlement. When an entity determines the past service cost at the time of plan amendment or curtailment, it shall re-measure the amount of net defined benefit liability/asset using the current value of plan assets and current actuarial assumptions which should reflect the benefits offered under the plan and plan assets before and after the plan amendment, curtailment and settlement.
The Company has evaluated the effect of the said amendment and found that there will not be any material impact of this amendment on its financial statements.
4. Amendment to Ind AS 103: ‘Business Combinations’:
The amendment relates to relates to provide additional guidance in case of party to the joint operation, achieved control over the joint operation. Such transaction is required to be accounted like the business combination achieved in stages.
The Company has evaluated the effect of the said amendment and found that there will not be any material impact of this amendment on its financial statements.
5. Amendment to Ind AS 111: ‘Joint Arrangements’:
As per the said amendment, a party participating in a joint operation but does not have joint control, shall not re-measure its previously held interest in the joint operation, which constitutes a business, while attaining the joint control over the joint operation, on acquisition of additional interest or otherwise.
The Company has evaluated the effect of the said amendment and found that there will not be any material impact of this amendment on its financial statements.
6. Amendment to Ind AS 28: ‘Investments in Associates and Joint Ventures’:
The said amendment clarifies that Ind AS 109 should be applied to the financial instruments, including long-term interests in
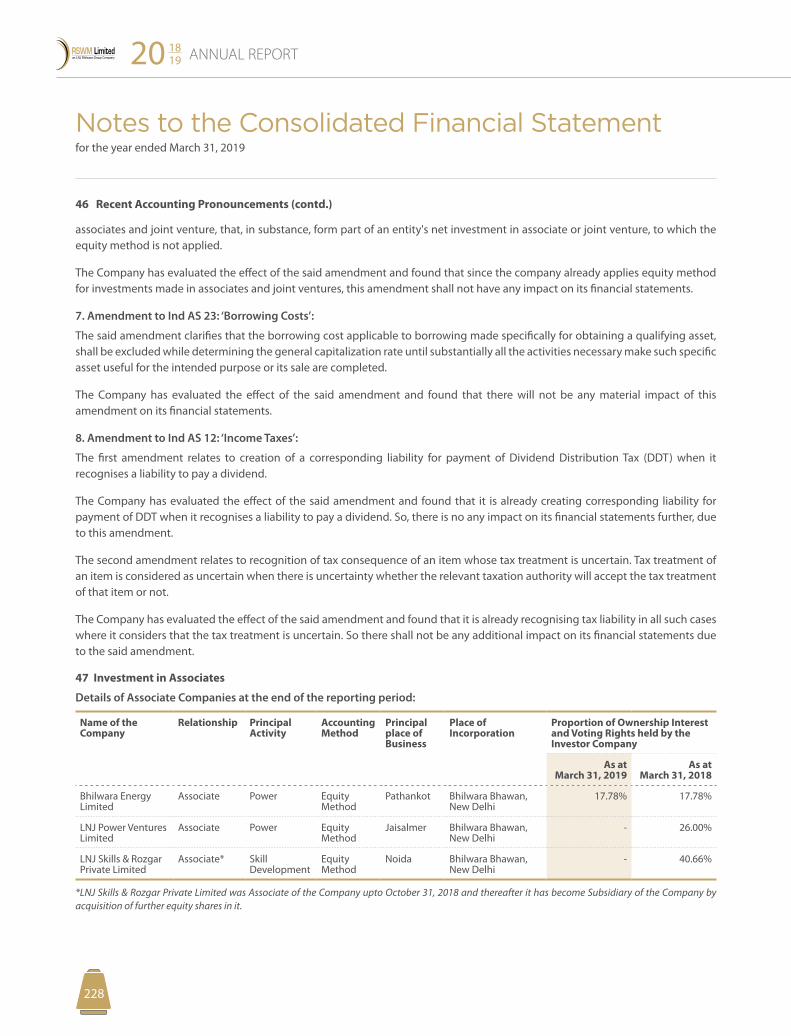
ANNUAL REPORT20 1819
229228
Notes to the Consolidated Financial Statement for the year ended March 31, 2019
(Amounts in D Lakhs, unless otherwise stated)
associates and joint venture, that, in substance, form part of an entity's net investment in associate or joint venture, to which the equity method is not applied.
The Company has evaluated the effect of the said amendment and found that since the company already applies equity method for investments made in associates and joint ventures, this amendment shall not have any impact on its financial statements.
7. Amendment to Ind AS 23: ‘Borrowing Costs’:
The said amendment clarifies that the borrowing cost applicable to borrowing made specifically for obtaining a qualifying asset, shall be excluded while determining the general capitalization rate until substantially all the activities necessary make such specific asset useful for the intended purpose or its sale are completed.
The Company has evaluated the effect of the said amendment and found that there will not be any material impact of this amendment on its financial statements.
8. Amendment to Ind AS 12: ‘Income Taxes’:
The first amendment relates to creation of a corresponding liability for payment of Dividend Distribution Tax (DDT) when it recognises a liability to pay a dividend.
The Company has evaluated the effect of the said amendment and found that it is already creating corresponding liability for payment of DDT when it recognises a liability to pay a dividend. So, there is no any impact on its financial statements further, due to this amendment.
The second amendment relates to recognition of tax consequence of an item whose tax treatment is uncertain. Tax treatment of an item is considered as uncertain when there is uncertainty whether the relevant taxation authority will accept the tax treatment of that item or not.
The Company has evaluated the effect of the said amendment and found that it is already recognising tax liability in all such cases where it considers that the tax treatment is uncertain. So there shall not be any additional impact on its financial statements due to the said amendment.
47 Investment in Associates
Details of Associate Companies at the end of the reporting period:
Name of the Company
Relationship Principal Activity
Accounting Method
Principal place of Business
Place of Incorporation
Proportion of Ownership Interest and Voting Rights held by the Investor Company
As at March 31, 2019
As at March 31, 2018
Bhilwara Energy Limited
Associate Power Equity Method
Pathankot Bhilwara Bhawan, New Delhi
17.78% 17.78%
LNJ Power Ventures Limited
Associate Power Equity Method
Jaisalmer Bhilwara Bhawan, New Delhi
- 26.00%
LNJ Skills & Rozgar Private Limited
Associate* Skill Development
Equity Method
Noida Bhilwara Bhawan, New Delhi
- 40.66%
*LNJ Skills & Rozgar Private Limited was Associate of the Company upto October 31, 2018 and thereafter it has become Subsidiary of the Company by acquisition of further equity shares in it.
46 Recent Accounting Pronouncements (contd.)
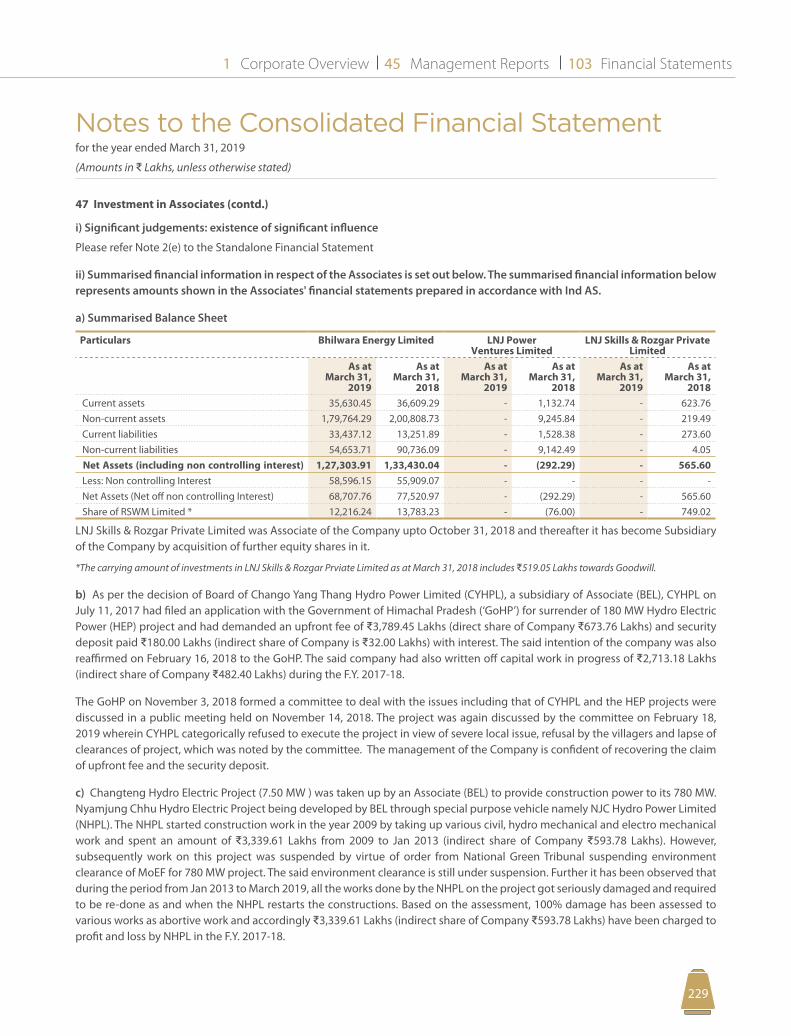
Notes to the Consolidated Financial Statement for the year ended March 31, 2019
(Amounts in D Lakhs, unless otherwise stated)
Corporate Overview Management Reports Financial Statements1 45 103
229228
47 Investment in Associates (contd.)
i) Significant judgements: existence of significant influence
Please refer Note 2(e) to the Standalone Financial Statement
ii) Summarised financial information in respect of the Associates is set out below. The summarised financial information below represents amounts shown in the Associates' financial statements prepared in accordance with Ind AS.
a) Summarised Balance Sheet
Particulars Bhilwara Energy Limited LNJ Power Ventures Limited
LNJ Skills & Rozgar Private Limited
As at March 31,
2019
As at March 31,
2018
As at March 31,
2019
As at March 31,
2018
As at March 31,
2019
As at March 31,
2018 Current assets 35,630.45 36,609.29 - 1,132.74 - 623.76 Non-current assets 1,79,764.29 2,00,808.73 - 9,245.84 - 219.49 Current liabilities 33,437.12 13,251.89 - 1,528.38 - 273.60 Non-current liabilities 54,653.71 90,736.09 - 9,142.49 - 4.05 Net Assets (including non controlling interest) 1,27,303.91 1,33,430.04 - (292.29) - 565.60 Less: Non controlling Interest 58,596.15 55,909.07 - - - - Net Assets (Net off non controlling Interest) 68,707.76 77,520.97 - (292.29) - 565.60 Share of RSWM Limited * 12,216.24 13,783.23 - (76.00) - 749.02
LNJ Skills & Rozgar Private Limited was Associate of the Company upto October 31, 2018 and thereafter it has become Subsidiary of the Company by acquisition of further equity shares in it.
*The carrying amount of investments in LNJ Skills & Rozgar Prviate Limited as at March 31, 2018 includes D519.05 Lakhs towards Goodwill.
b) As per the decision of Board of Chango Yang Thang Hydro Power Limited (CYHPL), a subsidiary of Associate (BEL), CYHPL on July 11, 2017 had filed an application with the Government of Himachal Pradesh (‘GoHP’) for surrender of 180 MW Hydro Electric Power (HEP) project and had demanded an upfront fee of D3,789.45 Lakhs (direct share of Company D673.76 Lakhs) and security deposit paid D180.00 Lakhs (indirect share of Company is D32.00 Lakhs) with interest. The said intention of the company was also reaffirmed on February 16, 2018 to the GoHP. The said company had also written off capital work in progress of D2,713.18 Lakhs (indirect share of Company D482.40 Lakhs) during the F.Y. 2017-18.
The GoHP on November 3, 2018 formed a committee to deal with the issues including that of CYHPL and the HEP projects were discussed in a public meeting held on November 14, 2018. The project was again discussed by the committee on February 18, 2019 wherein CYHPL categorically refused to execute the project in view of severe local issue, refusal by the villagers and lapse of clearances of project, which was noted by the committee. The management of the Company is confident of recovering the claim of upfront fee and the security deposit.
c) Changteng Hydro Electric Project (7.50 MW ) was taken up by an Associate (BEL) to provide construction power to its 780 MW. Nyamjung Chhu Hydro Electric Project being developed by BEL through special purpose vehicle namely NJC Hydro Power Limited (NHPL). The NHPL started construction work in the year 2009 by taking up various civil, hydro mechanical and electro mechanical work and spent an amount of D3,339.61 Lakhs from 2009 to Jan 2013 (indirect share of Company D593.78 Lakhs). However, subsequently work on this project was suspended by virtue of order from National Green Tribunal suspending environment clearance of MoEF for 780 MW project. The said environment clearance is still under suspension. Further it has been observed that during the period from Jan 2013 to March 2019, all the works done by the NHPL on the project got seriously damaged and required to be re-done as and when the NHPL restarts the constructions. Based on the assessment, 100% damage has been assessed to various works as abortive work and accordingly D3,339.61 Lakhs (indirect share of Company D593.78 Lakhs) have been charged to profit and loss by NHPL in the F.Y. 2017-18.
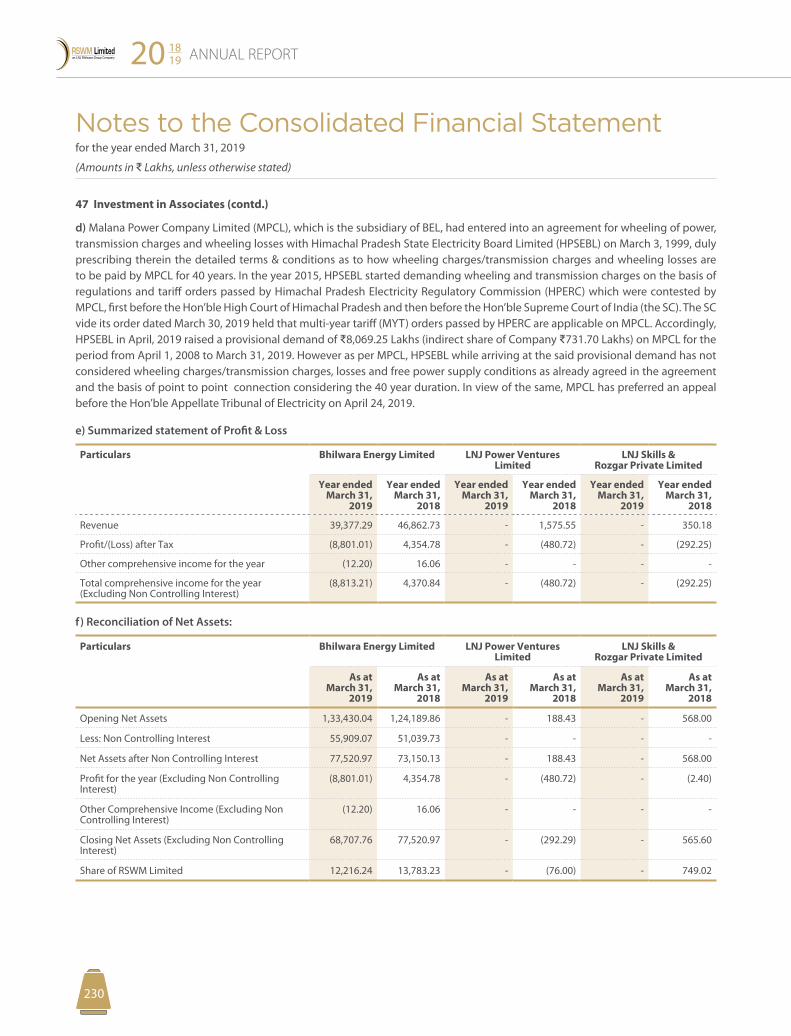
Notes to the Consolidated Financial Statement for the year ended March 31, 2019
(Amounts in D Lakhs, unless otherwise stated)
ANNUAL REPORT20 1819
231230
47 Investment in Associates (contd.)
d) Malana Power Company Limited (MPCL), which is the subsidiary of BEL, had entered into an agreement for wheeling of power, transmission charges and wheeling losses with Himachal Pradesh State Electricity Board Limited (HPSEBL) on March 3, 1999, duly prescribing therein the detailed terms & conditions as to how wheeling charges/transmission charges and wheeling losses are to be paid by MPCL for 40 years. In the year 2015, HPSEBL started demanding wheeling and transmission charges on the basis of regulations and tariff orders passed by Himachal Pradesh Electricity Regulatory Commission (HPERC) which were contested by MPCL, first before the Hon’ble High Court of Himachal Pradesh and then before the Hon’ble Supreme Court of India (the SC). The SC vide its order dated March 30, 2019 held that multi-year tariff (MYT) orders passed by HPERC are applicable on MPCL. Accordingly, HPSEBL in April, 2019 raised a provisional demand of D8,069.25 Lakhs (indirect share of Company D731.70 Lakhs) on MPCL for the period from April 1, 2008 to March 31, 2019. However as per MPCL, HPSEBL while arriving at the said provisional demand has not considered wheeling charges/transmission charges, losses and free power supply conditions as already agreed in the agreement and the basis of point to point connection considering the 40 year duration. In view of the same, MPCL has preferred an appeal before the Hon’ble Appellate Tribunal of Electricity on April 24, 2019.
e) Summarized statement of Profit & Loss
Particulars Bhilwara Energy Limited LNJ Power Ventures Limited
LNJ Skills & Rozgar Private Limited
Year ended March 31,
2019
Year ended March 31,
2018
Year ended March 31,
2019
Year ended March 31,
2018
Year ended March 31,
2019
Year ended March 31,
2018
Revenue 39,377.29 46,862.73 - 1,575.55 - 350.18
Profit/(Loss) after Tax (8,801.01) 4,354.78 - (480.72) - (292.25)
Other comprehensive income for the year (12.20) 16.06 - - - -
Total comprehensive income for the year (Excluding Non Controlling Interest)
(8,813.21) 4,370.84 - (480.72) - (292.25)
f) Reconciliation of Net Assets:
Particulars Bhilwara Energy Limited LNJ Power Ventures Limited
LNJ Skills & Rozgar Private Limited
As at March 31,
2019
As at March 31,
2018
As at March 31,
2019
As at March 31,
2018
As at March 31,
2019
As at March 31,
2018
Opening Net Assets 1,33,430.04 1,24,189.86 - 188.43 - 568.00
Less: Non Controlling Interest 55,909.07 51,039.73 - - - -
Net Assets after Non Controlling Interest 77,520.97 73,150.13 - 188.43 - 568.00
Profit for the year (Excluding Non Controlling Interest)
(8,801.01) 4,354.78 - (480.72) - (2.40)
Other Comprehensive Income (Excluding Non Controlling Interest)
(12.20) 16.06 - - - -
Closing Net Assets (Excluding Non Controlling Interest)
68,707.76 77,520.97 - (292.29) - 565.60
Share of RSWM Limited 12,216.24 13,783.23 - (76.00) - 749.02
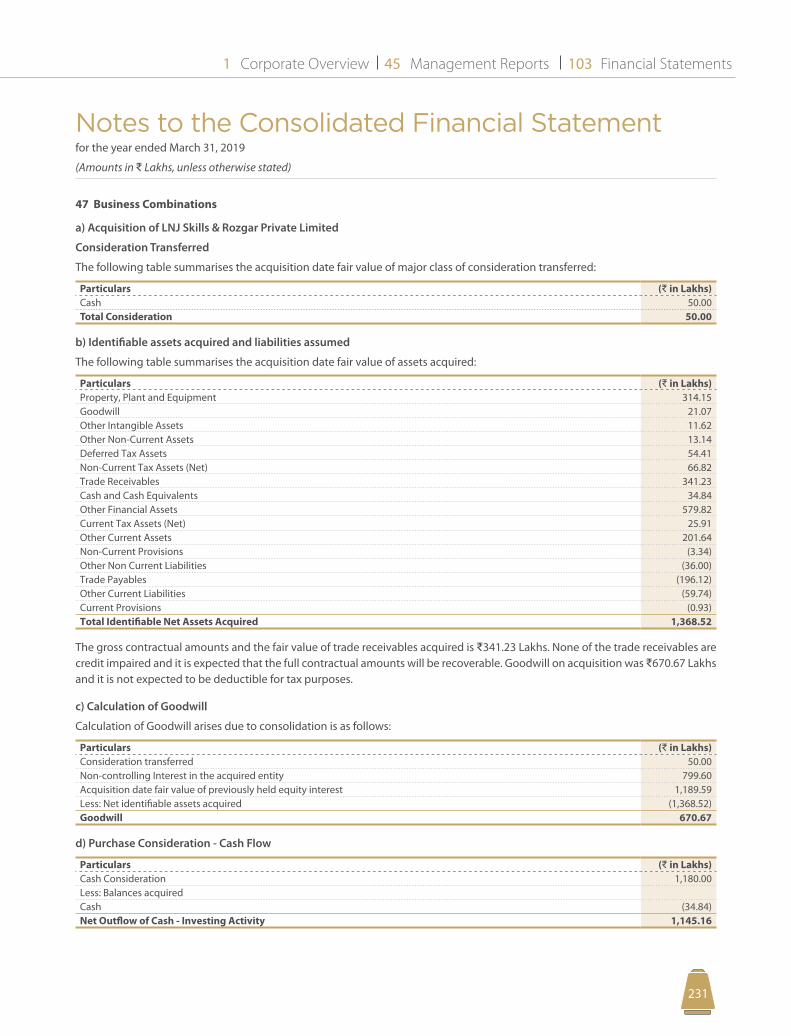
Notes to the Consolidated Financial Statement for the year ended March 31, 2019
(Amounts in D Lakhs, unless otherwise stated)
Corporate Overview Management Reports Financial Statements1 45 103
231230
47 Business Combinations
a) Acquisition of LNJ Skills & Rozgar Private Limited
Consideration Transferred
The following table summarises the acquisition date fair value of major class of consideration transferred:
Particulars (D in Lakhs) Cash 50.00 Total Consideration 50.00
b) Identifiable assets acquired and liabilities assumed
The following table summarises the acquisition date fair value of assets acquired:
Particulars (D in Lakhs) Property, Plant and Equipment 314.15 Goodwill 21.07 Other Intangible Assets 11.62 Other Non-Current Assets 13.14 Deferred Tax Assets 54.41 Non-Current Tax Assets (Net) 66.82 Trade Receivables 341.23 Cash and Cash Equivalents 34.84 Other Financial Assets 579.82 Current Tax Assets (Net) 25.91 Other Current Assets 201.64 Non-Current Provisions (3.34)Other Non Current Liabilities (36.00)Trade Payables (196.12)Other Current Liabilities (59.74)Current Provisions (0.93)Total Identifiable Net Assets Acquired 1,368.52
The gross contractual amounts and the fair value of trade receivables acquired is D341.23 Lakhs. None of the trade receivables are credit impaired and it is expected that the full contractual amounts will be recoverable. Goodwill on acquisition was D670.67 Lakhs and it is not expected to be deductible for tax purposes.
c) Calculation of Goodwill
Calculation of Goodwill arises due to consolidation is as follows:
Particulars (D in Lakhs) Consideration transferred 50.00 Non-controlling Interest in the acquired entity 799.60 Acquisition date fair value of previously held equity interest 1,189.59 Less: Net identifiable assets acquired (1,368.52)Goodwill 670.67
d) Purchase Consideration - Cash Flow
Particulars (D in Lakhs) Cash Consideration 1,180.00 Less: Balances acquiredCash (34.84)Net Outflow of Cash - Investing Activity 1,145.16
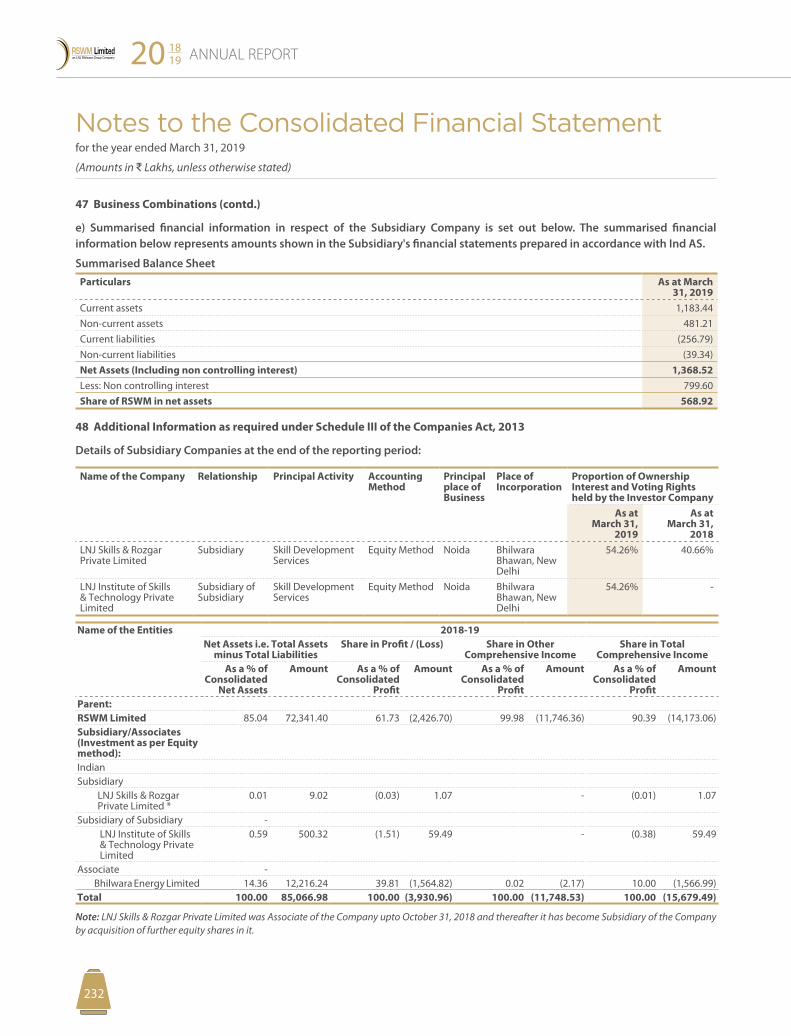
Notes to the Consolidated Financial Statement for the year ended March 31, 2019
(Amounts in D Lakhs, unless otherwise stated)
ANNUAL REPORT20 1819
233232
47 Business Combinations (contd.)
e) Summarised financial information in respect of the Subsidiary Company is set out below. The summarised financial information below represents amounts shown in the Subsidiary's financial statements prepared in accordance with Ind AS.
Summarised Balance SheetParticulars As at March
31, 2019 Current assets 1,183.44 Non-current assets 481.21 Current liabilities (256.79) Non-current liabilities (39.34) Net Assets (Including non controlling interest) 1,368.52 Less: Non controlling interest 799.60 Share of RSWM in net assets 568.92
48 Additional Information as required under Schedule III of the Companies Act, 2013
Details of Subsidiary Companies at the end of the reporting period:
Name of the Company Relationship Principal Activity Accounting Method
Principal place of Business
Place of Incorporation
Proportion of Ownership Interest and Voting Rights held by the Investor Company
As at March 31,
2019
As at March 31,
2018LNJ Skills & Rozgar Private Limited
Subsidiary Skill Development Services
Equity Method Noida Bhilwara Bhawan, New Delhi
54.26% 40.66%
LNJ Institute of Skills & Technology Private Limited
Subsidiary of Subsidiary
Skill Development Services
Equity Method Noida Bhilwara Bhawan, New Delhi
54.26% -
Name of the Entities 2018-19Net Assets i.e. Total Assets
minus Total LiabilitiesShare in Profit / (Loss) Share in Other
Comprehensive IncomeShare in Total
Comprehensive IncomeAs a % of
Consolidated Net Assets
Amount As a % of Consolidated
Profit
Amount As a % of Consolidated
Profit
Amount As a % of Consolidated
Profit
Amount
Parent:RSWM Limited 85.04 72,341.40 61.73 (2,426.70) 99.98 (11,746.36) 90.39 (14,173.06)Subsidiary/Associates (Investment as per Equity method):IndianSubsidiary LNJ Skills & Rozgar Private Limited *
0.01 9.02 (0.03) 1.07 - (0.01) 1.07
Subsidiary of Subsidiary - LNJ Institute of Skills & Technology Private Limited
0.59 500.32 (1.51) 59.49 - (0.38) 59.49
Associate - Bhilwara Energy Limited 14.36 12,216.24 39.81 (1,564.82) 0.02 (2.17) 10.00 (1,566.99)Total 100.00 85,066.98 100.00 (3,930.96) 100.00 (11,748.53) 100.00 (15,679.49)
Note: LNJ Skills & Rozgar Private Limited was Associate of the Company upto October 31, 2018 and thereafter it has become Subsidiary of the Company by acquisition of further equity shares in it.
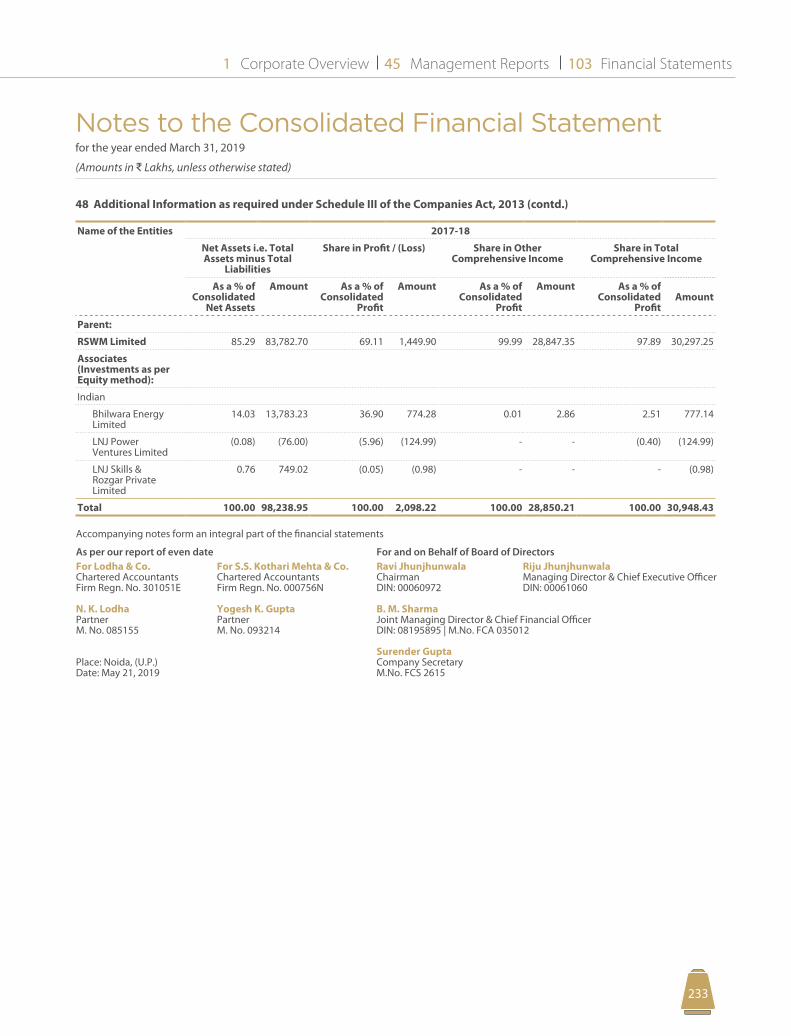
Notes to the Consolidated Financial Statement for the year ended March 31, 2019
(Amounts in D Lakhs, unless otherwise stated)
Corporate Overview Management Reports Financial Statements1 45 103
233232
48 Additional Information as required under Schedule III of the Companies Act, 2013 (contd.)
Name of the Entities 2017-18
Net Assets i.e. Total Assets minus Total
Liabilities
Share in Profit / (Loss) Share in Other Comprehensive Income
Share in Total Comprehensive Income
As a % of Consolidated
Net Assets
Amount As a % of Consolidated
Profit
Amount As a % of Consolidated
Profit
Amount As a % of Consolidated
ProfitAmount
Parent:
RSWM Limited 85.29 83,782.70 69.11 1,449.90 99.99 28,847.35 97.89 30,297.25
Associates (Investments as per Equity method):
Indian
Bhilwara Energy Limited
14.03 13,783.23 36.90 774.28 0.01 2.86 2.51 777.14
LNJ Power Ventures Limited
(0.08) (76.00) (5.96) (124.99) - - (0.40) (124.99)
LNJ Skills & Rozgar Private Limited
0.76 749.02 (0.05) (0.98) - - - (0.98)
Total 100.00 98,238.95 100.00 2,098.22 100.00 28,850.21 100.00 30,948.43
Accompanying notes form an integral part of the financial statements
As per our report of even date For and on Behalf of Board of DirectorsFor Lodha & Co. For S.S. Kothari Mehta & Co. Ravi Jhunjhunwala Riju JhunjhunwalaChartered Accountants Chartered Accountants Chairman Managing Director & Chief Executive OfficerFirm Regn. No. 301051E Firm Regn. No. 000756N DIN: 00060972 DIN: 00061060
N. K. Lodha Yogesh K. Gupta B. M. SharmaPartner Partner Joint Managing Director & Chief Financial OfficerM. No. 085155 M. No. 093214 DIN: 08195895 | M.No. FCA 035012
Surender GuptaPlace: Noida, (U.P.) Company SecretaryDate: May 21, 2019 M.No. FCS 2615

ANNUAL REPORT20 1819
235234
Notes

Corporate Overview Management Reports Financial Statements1 45 103
235234
Notes

ANNUAL REPORT20 1819
PB236
Notes
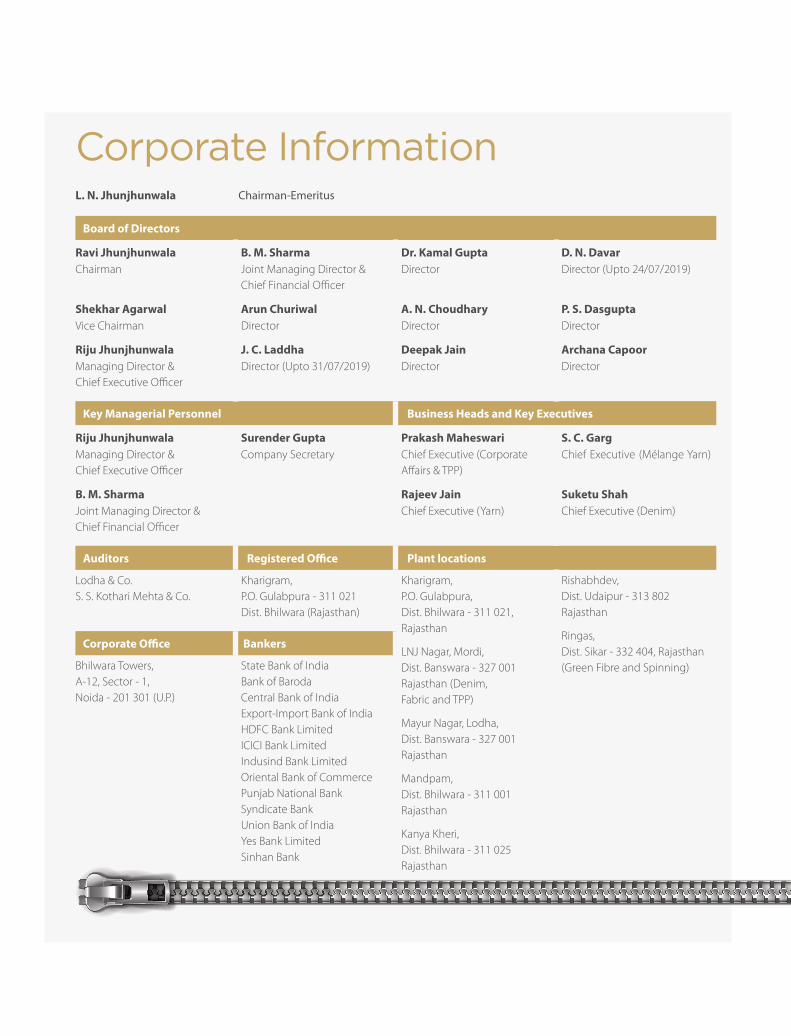
Corporate InformationL. N. Jhunjhunwala Chairman-Emeritus
Board of Directors
Ravi Jhunjhunwala B. M. Sharma Dr. Kamal Gupta D. N. DavarChairman Joint Managing Director &
Chief Financial OfficerDirector Director (Upto 24/07/2019)
Shekhar Agarwal Arun Churiwal A. N. Choudhary P. S. DasguptaVice Chairman Director Director Director
Riju Jhunjhunwala J. C. Laddha Deepak Jain Archana CapoorManaging Director &Chief Executive Officer
Director (Upto 31/07/2019) Director Director
Key Managerial Personnel Business Heads and Key Executives
Riju Jhunjhunwala Surender Gupta Prakash Maheswari S. C. GargManaging Director &Chief Executive Officer
Company Secretary Chief Executive (Corporate Affairs & TPP)
Chief Executive (Mélange Yarn)
B. M. Sharma Rajeev Jain Suketu ShahJoint Managing Director & Chief Financial Officer
Chief Executive (Yarn) Chief Executive (Denim)
Auditors Registered Office Plant locations
Lodha & Co.S. S. Kothari Mehta & Co.
Kharigram,P.O. Gulabpura - 311 021Dist. Bhilwara (Rajasthan)
Kharigram, P.O. Gulabpura, Dist. Bhilwara - 311 021,Rajasthan
LNJ Nagar, Mordi,Dist. Banswara - 327 001 Rajasthan (Denim,Fabric and TPP)
Mayur Nagar, Lodha,Dist. Banswara - 327 001 Rajasthan
Mandpam,Dist. Bhilwara - 311 001 Rajasthan
Kanya Kheri,Dist. Bhilwara - 311 025 Rajasthan
Rishabhdev,Dist. Udaipur - 313 802 Rajasthan
Ringas,Dist. Sikar - 332 404, Rajasthan (Green Fibre and Spinning)
Corporate Office Bankers
Bhilwara Towers, A-12, Sector - 1,Noida - 201 301 (U.P.)
State Bank of IndiaBank of Baroda Central Bank of India Export-Import Bank of India HDFC Bank LimitedICICI Bank LimitedIndusind Bank LimitedOriental Bank of Commerce Punjab National Bank Syndicate Bank Union Bank of India Yes Bank LimitedSinhan Bank

Registered OfficeKharigram, P.O. Gulabpura - 311 021
Dist. Bhilwara (Rajasthan), India
Website: www.rswm.in/www.lnjbhilwara.com
CIN: L17115RJ1960PLC008216
connect | +91 9831016081
Notice
1PB
NOTICE
Notice is hereby given that the Fifty-Eighth Annual General Meeting of the members of the Company will be held on Wednesday, the 11th day of September, 2019 at 11:30 A.M. at the Registered Office of the Company at Kharigram, P.O. Gulabpura -311 021, District Bhilwara, Rajasthan to transact the following businesses:
ORDINARY BUSINESS
1. To receive, consider and adopt the Audited Financial Statements (including Audited Consolidated Financial Statements) for the financial year ended the 31st March, 2019 and the Report of Directors and Auditors thereon.
2. To appoint a Director in place of Shri Riju Jhunjhunwala (DIN: 00061060), who retires by rotation and being eligible, offers himself for reappointment.
3. To appoint a Director in place of Shri Shekhar Agarwal Laddha (DIN: 00066113), who retires by rotation and being eligible, offers himself for reappointment.
4. To Re-appoint M/s. S. S. Kothari Mehta & Co. Chartered Accountants (Firm Registration No. 000756N) as the Joint Statutory Auditors of the Company, and in this connection, to pass, with or without modification(s), the following resolution as an ORDINARY RESOLUTION:
“RESOLVED THAT pursuant to the provisions of Section 139, 141, 142 and all other applicable provisions of the Companies Act, 2013 and The Companies (Audit and Auditors) Rules, 2014, (including any statutory modification(s) or
RSWM LIMITEDCIN:L17115RJ1960PLC008216
Registered Office: Kharigram, P.O. Gulabpura – 311 021, Distt. Bhilwara, Rajasthan
Phone:+91-1483-223144 to 223150, 223478, Fax:+91-1483-223361, 223479
Corporate Office: Bhilwara Towers, A-12, Sector – 1, Noida – 201 301 (U.P)
Phone:+91-120-4390300 (EPABX), Fax:+91-120-4277841
E-mail:[email protected]
Website:http://www.rswm.in
re-enactment thereof for the time being in force), M/s S. S. Kothari Mehta & Co. Chartered Accountants (Firm Registration No. 000756N), be and is hereby re-appointed as Joint Statutory Auditors of the Company for a period of consecutive five years commencing from the conclusion of this meeting until the conclusion of the 63rd Annual General Meeting and to fix their remuneration.”
SPECIAL BUSINESS
5. To consider and if thought fit, to pass, with or without modifications, the following resolution as a SPECIAL RESOLUTION:
“RESOLVED THAT pursuant to the provisions of Sections 149, 152 and other applicable provisions, if any, of the Companies Act, 2013 (the Act) and the Rules made thereunder, read with Schedule IV of the Companies Act, 2013, as amended from time to time and pursuant to the provisions of Regulation 17(1A) and other applicable provisions of SEBI (Listing Obligation and Disclosure Requirements), Regulation 2015 as amended from time to time, consent of members be and is hereby accorded for re-appointment of Dr. Kamal Gupta (DIN:00038490), who was appointed as an Independent Director of the Company for first term of 5 consecutive years at the 53rd Annual General Meeting of the Company held on September 16, 2014 and who is eligible for re-appointment for second term and who will be attaining the age of seventy five years in the year 2021 and in respect of whom the Company has received notice in writing from a member of the Company under Section 160 of the Act proposing his candidature for the office of
ANNUAL REPORT20 1819
32
Director, be and is hereby re-appointed as an Independent Director of the Company to hold office for a second term of five consecutive years commencing from September 16, 2019 up to September 15, 2024”.
6. To consider and if thought fit, to pass, with or without modifications, the following resolution as a SPECIAL RESOLUTION:
“RESOLVED THAT pursuant to the provisions of Sections 149, 152 and other applicable provisions, if any, of the Companies Act, 2013 (the Act) and the Rules made thereunder, read with Schedule IV of the Companies Act, 2013, as amended from time to time and pursuant to the provisions of Regulation 17(1A) and other applicable provisions of SEBI (Listing Obligation and Disclosure Requirements), Regulation 2015 as amended from time to time, Shri Amar Nath Choudhary (DIN:00587814), who was appointed as an Independent Director of the Company for first term of 5 consecutive years at the 53rd Annual General Meeting of the Company held on September 16, 2014 and who is eligible for re-appointment for second term and who has attained the age of seventy five years and in respect of whom the Company has received notice in writing from a member of the Company under Section 160 of the Act proposing his candidature for the office of Director, be and is hereby re-appointed as an Independent Director of the Company to hold office for a second term of five consecutive years commencing from September 16, 2019 up to September 15, 2024”.
7. To consider and if thought fit, to pass, with or without modifications, the following resolution as an ORDINARY RESOLUTION:
“RESOLVED THAT pursuant to the provisions of Section 148 and all other applicable provisions of the Companies Act, 2013 and the Companies (Audit and Auditors) Rules, 2014 (including any modification(s) or re-enactment thereof ), M/s N. D. Birla & Co. Cost Accountants (Firm Registration No.000028) appointed by the Board of Directors of the Company, to conduct the audit of the cost records of the Company for the financial year ending March 31, 2020, be paid the remuneration of `6,00,000 (Rupees six lakhs only) plus applicable taxes and out of pocket expenses that may be incurred by them during the course of audit.
For RSWM LIMITED Surender Gupta
Place: Noida Company SecretaryDate: 5th August, 2019 M. No. FCS - 2615
N O T E S
1. The relevant Explanatory Statement pursuant to Section 102 (1) of the Companies Act, 2013, relating to Special Business to be transacted at the Meeting is annexed.
2. The attention of the members is drawn that Shri Dharmendar Nath Davar whose re-appointment for second term as Independent Director for a term of two consecutive years effective from September 16, 2019 was recommended by the Board of Directors, had resigned on July 24, 2019 due to health reasons and accordingly the matter with respect to his re-appointment had been withdrawn.
3. The attention of the members is also drawn that Shri Jagdish Chandra Laddha, who was liable to retire by rotation in the ensuing Annual General Meeting had resigned on 31st July, 2019 due to other commitments and accordingly the matter with respect to his re-appointment had been withdrawn. In view of the above, Shri Shekhar Agarwal, who had been longest in the office, is liable to retire by rotation and being eligible, offered himself for re-appointment.
4. A MEMBER ENTITLED TO ATTEND AND VOTE AT THE MEETING IS ENTITLED TO APPOINT A PROXY TO ATTEND AND VOTE ON POLL INSTEAD OF HIMSELF/HERSELF AND THE PROXY NEED NOT BE A MEMBER OF THE COMPANY. PROXIES IN ORDER TO BE EFFECTIVE, MUST BE RECEIVED BY THE COMPANY NOT LESS THAN FORTY EIGHT HOURS BEFORE THE MEETING. A person can act as a proxy on behalf of Members not exceeding fifty (50) and holding not more than 10% of the total share capital of the Company carrying voting rights. In case a proxy is proposed to be appointed by a member holding more than 10% of the total share capital of the Company carrying voting rights, then such proxy shall not act as a proxy for any other person or shareholder.
5. Corporate Members intending to send their authorized representative(s) to attend the meeting are requested to send to the Company, a duly certified Board Resolution authorizing their said representative(s) to attend and vote on their behalf at the meeting.
6. The Register of Members and Share Transfer Books of the Company will remain closed from Thursday, the September 5, 2019 to Wednesday, the September 11, 2019 (both days inclusive).
7. The relevant documents accompanying the Notice are open for inspection to the members at the Registered Office of the Company during the normal business hours of the Company up to the date of the Meeting.
Notice
32
8. Members are requested to bring their attendance slip with their copy of Annual Report to the meeting.
9. In case of Joint holders attending the meeting, only such joint holder who is higher in the order of names will be entitled to vote.
10. Members are requested to:
(i) Quote their folio number/client ID in all correspondence with the Company.
(ii) Notify immediately to the Company all changes with respect to their bank details, mandate, nomination, Power of Attorney and Change of Address. Members holding shares in electronic form should send their requests regarding the same to their respective Depository Participants.
11. Members who are holding Company’s shares in electronic form are required to bring details of their Depository Account such as Client ID and DP ID Numbers for identification.
12. Members seeking any information/clarification with regard to accounts and audit are requested to write to the Company in advance and their queries should reach the Registered Office of the Company at least seven days prior to the date of meeting, so as to enable the Management to keep the information/clarification ready.
13. Members are requested to note that in accordance with Sections 124 and 125 of Companies Act, 2013 and rules made thereunder dividend remaining unclaimed or unpaid for a period of seven years from the date of transfer to the Companies unpaid dividend account are required to be transferred to the IEPF. Accordingly, the dividend remaining unclaimed or unpaid upto the financial year ended 31st March, 2011 have been transferred to IEPF. The detail of unclaimed dividend is available on the website of the company i.e. www.rswm.in. Members may further note that the final dividend remaining unpaid by the Company for Financial Year 2010-11 had also been transferred to IEPF on 26th November, 2018.
Members may further note that in accordance with Section 124 and 125 of the Companies Act, 2013 and rules made thereunder all shares on which dividend remain unclaimed for seven consecutive years will be transferred to IEPF as per Section 124 of the Act and the applicable rules. The details of the shares on which dividend remain unclaimed for seven consecutive years and which were transferred to IEPF and the details of shares which will be transferred to
IEPF are available on the website of the Company i.e. www.rswm.in. The individual notices had also been sent to the concerned shareholders.
14. Members holding shares in physical form are requested to furnish their email ID through e-mail at [email protected] or [email protected] and/or send letter to MCS Share Transfer Agent Limited, F-65, Okhla Industrial Area, Phase I, New Delhi – 110020 quoting their Folio No. and e-mail ID to enable them to serve any document, notice, communication, annual reports etc. through e-mail. For members who have not registered their email addresses, physical copies of the Annual Report 2019 are being sent by the permitted mode. Members holding shares in demat form may get their email ID updated with their respective Depository Participants. We request the members to continue to support the Green Initiative introduced by MCA and make it a success.
15. The Notice and Annual Report of the Company will also be available on the website of the Company, www.rswm.in.
16. Members holding shares in physical form are requested to dematerialize their holdings in their own interest. Attention of the members holding shares in physical form is also drawn towards the recent amendment by SEBI which stipulates that except in the case of transmission and transposition of shares, requests for effecting transfer of shares shall not be processed after 31st March, 2019 unless the securities are held in dematerialized form.
17. Details under Regulation 36(3) and 26(4) of the SEBI (Listing Obligations and Disclosure Requirements) Regulations, 2015 and in terms of Secretarial Standard-2 in respect of the Directors seeking re-appointment at the 58th Annual General Meeting are annexed hereto as Annexure-I to this Notice which form part of the explanatory statement.
18. Voting through electronic means
I. In compliance with provisions of Section 108 of the Companies Act, 2013, Rule 20 of the Companies (Management and Administration) Rules, 2014, as amended from time to time and Regulation 44 of the SEBI (Listing Obligations and Disclosure Requirements) Regulations, 2015, the Company is pleased to provide members facility to exercise their right to vote on resolutions proposed to be considered at the 58th Annual General Meeting (AGM) by electronic means and the business may be transacted through e-Voting Services. The facility of casting the votes by the
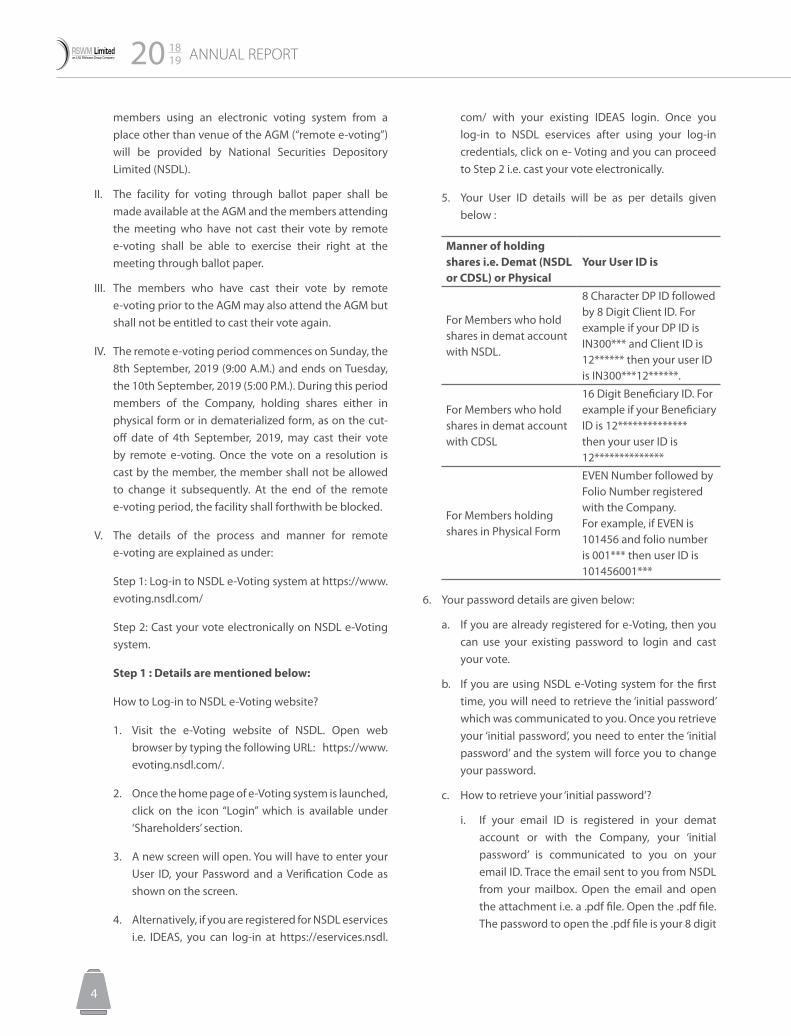
ANNUAL REPORT20 1819
54
members using an electronic voting system from a place other than venue of the AGM (“remote e-voting”) will be provided by National Securities Depository Limited (NSDL).
II. The facility for voting through ballot paper shall be made available at the AGM and the members attending the meeting who have not cast their vote by remote e-voting shall be able to exercise their right at the meeting through ballot paper.
III. The members who have cast their vote by remote e-voting prior to the AGM may also attend the AGM but shall not be entitled to cast their vote again.
IV. The remote e-voting period commences on Sunday, the 8th September, 2019 (9:00 A.M.) and ends on Tuesday, the 10th September, 2019 (5:00 P.M.). During this period members of the Company, holding shares either in physical form or in dematerialized form, as on the cut-off date of 4th September, 2019, may cast their vote by remote e-voting. Once the vote on a resolution is cast by the member, the member shall not be allowed to change it subsequently. At the end of the remote e-voting period, the facility shall forthwith be blocked.
V. The details of the process and manner for remote e-voting are explained as under:
Step 1: Log-in to NSDL e-Voting system at https://www. evoting.nsdl.com/
Step 2: Cast your vote electronically on NSDL e-Voting system.
Step 1 : Details are mentioned below:
How to Log-in to NSDL e-Voting website?
1. Visit the e-Voting website of NSDL. Open web browser by typing the following URL: https://www.evoting.nsdl.com/.
2. Once the home page of e-Voting system is launched, click on the icon “Login” which is available under ‘Shareholders’ section.
3. A new screen will open. You will have to enter your User ID, your Password and a Verification Code as shown on the screen.
4. Alternatively, if you are registered for NSDL eservices i.e. IDEAS, you can log-in at https://eservices.nsdl.
com/ with your existing IDEAS login. Once you log-in to NSDL eservices after using your log-in credentials, click on e- Voting and you can proceed to Step 2 i.e. cast your vote electronically.
5. Your User ID details will be as per details given below :
Manner of holding shares i.e. Demat (NSDL or CDSL) or Physical
Your User ID is
For Members who hold shares in demat account with NSDL.
8 Character DP ID followed by 8 Digit Client ID. For example if your DP ID is IN300*** and Client ID is 12****** then your user ID is IN300***12******.
For Members who hold shares in demat account with CDSL
16 Digit Beneficiary ID. For example if your Beneficiary ID is 12************** then your user ID is 12**************
For Members holding shares in Physical Form
EVEN Number followed by Folio Number registered with the Company. For example, if EVEN is 101456 and folio number is 001*** then user ID is 101456001***
6. Your password details are given below:
a. If you are already registered for e-Voting, then you can use your existing password to login and cast your vote.
b. If you are using NSDL e-Voting system for the first time, you will need to retrieve the ‘initial password’ which was communicated to you. Once you retrieve your ‘initial password’, you need to enter the ‘initial password’ and the system will force you to change your password.
c. How to retrieve your ‘initial password’?
i. If your email ID is registered in your demat account or with the Company, your ‘initial password’ is communicated to you on your email ID. Trace the email sent to you from NSDL from your mailbox. Open the email and open the attachment i.e. a .pdf file. Open the .pdf file. The password to open the .pdf file is your 8 digit
Notice
54
client ID for NSDL account, last 8 digits of client ID for CDSL account or folio number for shares held in physical form. The .pdf file contains your ‘User ID’ and your ‘initial password’.
ii. If your email ID is not registered, your ‘initial password’ is communicated to you on your postal address.
7. If you are unable to retrieve or have not received the “Initial password” or have forgotten your password:
a. Click on “Forgot User Details/Password?”(If you are holding shares in your demat account with NSDL or CDSL) option available on www.evoting.nsdl.com.
b. “Physical User Reset Password?” (If you are holding shares in physical mode) option available on www.evoting.nsdl.com.
c. If you are still unable to get the password by aforesaid two options, you can send a request at [email protected] mentioning your demat account number/folio number, your PAN, your name and your registered address.
d. Members can also use the OTP (One Time Password) based login for casting the votes on the e-Voting system of NSDL.
8. After entering your password, tick on Agree to “Terms and Conditions” by selecting on the check box.
9. Now, you will have to click on “Login” button.
10. After you click on the “Login” button, Home page of e-Voting will open.
Step 2 : Cast your vote electronically on NSDL e-Voting system.
1. After successful login at Step 1, you will be able to see the Home page of e-Voting. Click on e-Voting. Then, click on Active Voting Cycles.
2. After click on Active Voting Cycles, you will be able to see all the companies “EVEN” in which you are holding shares and whose voting cycle is in active status.
3. Select “EVEN” of the Company.
4. Now you are ready for e-Voting as the Voting page opens.
5. Cast your vote by selecting appropriate options i.e. assent or dissent, verify/modify the number of shares for which you wish to cast your vote and click on “Submit” and also “Confirm” when prompted.
6. Upon confirmation, the message “Vote cast successfully” will be displayed.
7. You can also take the printout of the votes cast by you by clicking on the print option on the confirmation page.
8. Once you confirm your vote on the resolution, you will not be allowed to modify your vote.
General Guidelines for shareholders:
(i) Institutional shareholders (i.e. other than individuals, HUF, NRI etc.) are required to send scanned copy (PDF/JPG format) of the relevant Board Resolution/ Authority Letter, etc., together with attested specimen signature of the duly authorized signatory(ies) who are authorized to vote, to the Scrutinizer through e-mail at [email protected], with a copy marked to [email protected].
(ii) It is strongly recommended not to share your password with any other person and take utmost care to keep it confidential. Login to the e-voting website will be disabled upon five unsuccessful attempts to key in the correct password. In such an event, you will need to go through the “Forgot User Details/ Password?” or “Physical User Reset Password? Option available on www.evoting.nsdl.com to reset the password.
(iii) In case of any queries, you may refer the Frequently Asked Questions (FAQs) for members and remote e-voting user manual for Shareholders available at the Downloads Section of www.evoting.nsdl.com or call on toll free No.: 1800-222-990 or send a request at [email protected].
VI. The voting rights of members shall be in proportion to their shares of the paid up equity share capital of the Company as on the cut-off date of 4th September, 2019. Members are eligible to cast vote only if they are holding shares as on the cut-off date and a person who is not a member as on the cut-off date should treat this notice for information purposes only.
VII. Members, who acquire shares of the Company after dispatch of the notice and hold shares as on the cut-off date i.e. 4th September, 2019 may obtain the login ID and password by sending a request at [email protected] or [email protected].
VIII. A person whose name is recorded in the Register of Members or in the Register of beneficial owners maintained by the depositories as on the cut-off date i.e. 4th September, 2019 only shall be entitled to avail the facility of remote e-voting as well as voting at the Annual General Meeting through ballot paper.
ANNUAL REPORT20 1819
76
IX. Shri Mahesh Kumar Gupta, Practicing Company Secretary (Membership No. FCS 2870), has been appointed as the Scrutinizer to scrutinize the remote e-voting process in a fair and transparent manner.
X. The Chairman shall, at the AGM, at the end of discussion on the resolutions on which voting is to be held, allow voting with the assistance of scrutinizer, by use of ballot paper for all those members who are present at the AGM but have not cast their votes by availing the remote e-voting facility.
XI. The Scrutinizer shall after the conclusion of voting at the general meeting, will first count the votes cast at the meeting and thereafter unblock the votes cast through remote e-voting in the presence of at least two witnesses not in the employment of the Company and shall make, not later than three days of the conclusion of the AGM, a consolidated scrutinizer’s report of the total votes cast in favour or against, if any, to the Chairman or a person authorized by him in writing, who shall countersign the same and declare the result of the voting forthwith.
XII. The results shall be declared not later than forty-eight hours from conclusion of the meeting. The results declared along with the Scrutinizer’s Report will be placed on the website of the Company at www.rswm.in and the website of NSDL: http://www.evoting.nsdl.com immediately after the results is declared and will simultaneously be forwarded to BSE Limited and National Stock Exchange of India Limited, where Equity Shares of the Company are listed.
XIII. Route map and details of prominent landmark of the venue of meeting is annexed with this notice.
XIV. Subject to receipt of requisite number of votes, the Resolution shall be deemed to be passed on the date of the Meeting i.e. 11th September, 2019.
By Order of the BoardFor RSWM LIMITED
Place: Noida Surender GuptaDate: 5th August, 2019 Company Secretary
M. No. FCS - 2615
EXPLANATORY STATEMENT PURSUANT TO SECTION 102 OF THE COMPANIES ACT, 2013
ITEM NO. 5 & 6
As the members are aware that Dr. Kamal Gupta (DIN:00038490) and Shri Amar Nath Choudhary (DIN:00587814) were appointed as Independent Directors at the 53rd Annual General Meeting held on 16th September, 2014 by Ordinary Resolution for the first term of five years each i.e. upto 15th September, 2019 in accordance with the provisions of Section 149 and 152 of the Companies Act, 2013. Further, in view of the applicability of Regulation 17(1A) of SEBI (Listing Obligations and Disclosure Requirements) Regulations, 2015 effective from 1st April, 2019, the approval of the members was obtained at the last Annual General Meeting of the Company held on 13th September, 2018 by Special Resolution for continuation of the term of Shri Amar Nath Choudhary who was to complete the age of 75 years in March, 2019, after 1st April, 2019 till its completion on 15th September, 2019.
The Board of Directors of your Company now propose the second term for Dr. Kamal Gupta and Shri Amar Nath Choudhary as Independent Directors in accordance with the provisions of Section 149 and 152 of the Companies Act, 2013 and Regulation 17(1A) and other applicable provisions of SEBI (Listing Obligations and Disclosure Requirements) Regulations, 2015 as amended from time to time.
The Board considered the feedback/views of the Nomination and Remuneration Committee and Independent Directors on the performance evaluation of Dr. Kamal Gupta and Shri Amar Nath Choudhary. The Board, thereafter, evaluated the performance of Dr. Kamal Gupta and Shri Amar Nath Choudhary, their professional ethics, integrity and values, practical wisdom, the skills, knowledge and expertise relevant to the Company’s business and found their performance satisfactory. The Board after taking into account the above proposed to recommend their re-appointment for the 2nd (second) term as specified in the respective Resolutions.
Dr. Kamal Gupta, Independent Director of the Company born on 12th February, 1946, would be completing the 75 years of age on 11th February, 2021. Dr. Kamal Gupta is highly qualified and possesses the membership of Institute of Chartered Accountants of India, Institute of Cost and Works Accountant of India and Ph.D as well. Dr. Kamal Gupta is immensely contributing to the Board and the Company by his rich experience of over five decades in business and corporate advisory. Your Directors feel that it will be in the best interest of the Company to re-appoint him for his second term of 5 years commencing from 16th
Notice
76
September, 2019 upto 15th September, 2024. Your Directors are of the view that his re-appointment for the second term is fully justified.
Further, Shri Amar Nath Choudhary, Independent Director of the Company born on 6th March, 1944, is highly qualified and possesses the membership of Institute of Chartered Accountants of India, Institute of Company Secretaries of India and a law degree as well. Shri Amar Nath Choudhary is immensely contributing to the Board and the Company by his rich experience of over five decades in textile industry as well as his expert guidance in the technical, financial and commercial matters. Your Directors feel that it will be in the best interest of the Company to re-appoint him for his second term of 5 years commencing from 16th September, 2019 upto 15th September, 2024. Your Directors are of the view that his re-appointment for the second term is fully justified.
Dr. Kamal Gupta and Shri Amar Nath Choudhary have given their consent to act as an Independent director of the Company for the second term. The Company has also received declaration from Dr. Kamal Gupta and Shri Amar Nath Choudhary that they meet with the criteria of independence as prescribed both under sub-section(6) of Section 149 of the Companies Act, 2013 and under the SEBI(Listing Obligations and Disclosure Requirements) Regulations, 2015. In terms of provisions of Section 149 of the Companies Act, 2013, the re-appointment of Dr. Kamal Gupta and Shri Amar Nath Choudhary as an Independent Director of the Company requires the approval by the Company in General Meeting by Special Resolution.
The relevant details pertaining to Dr. Kamal Gupta and Shri Amar Nath Choudhary are provided in Annexure-I in accordance with the requirement of SEBI (Listing Obligations and Disclosure Requirements) Regulations, 2015 and Secretarial Standards on General Meetings (“SS-2”).
Copy of draft letter of appointment of Dr. Kamal Gupta and Shri Amar Nath Choudhary setting out the terms and conditions of appointment is available for inspection by the members at the Registered Office and Corporate Office of the Company.
Your Directors recommend the Special Resolution set out at Item No. 5 & 6 of the Notice for approval by the members.
Except Dr. Kamal Gupta and Shri Amar Nath Choudhary in their respective items proposing re-appointment, and their relatives, to the extent of their shareholding interest, if any, in the Company, none of the other Directors / Key Managerial Personnel of the Company/ their relatives are, in any way, concerned or interested, in the proposed Resolution.
ITEM NO. 7
The Board of Directors of the Company had approved the appointment and remuneration of M/s N. D. Birla & Co., Cost Accountants upon the recommendation of Audit Committee to conduct the Cost Audit of the Cost records of the Company for the financial year ending 31st March, 2020, in terms of rules framed in this regard by the Ministry of Corporate Affairs.
Pursuant to the provisions of Section 148 of the Companies Act, 2013, read with the Companies (Audit and Auditors) Rules, 2014, as amended from time to time, the remuneration payable to the Cost Auditors has to be ratified by the shareholders of the Company.
Your Directors recommend the Ordinary Resolution under Item No.7 of the notice for approval of the members.
None of the Directors & Key Managerial Personnel of the Company including their relatives are concerned or interested, financially or otherwise, in the said Resolution.
By Order of the BoardFor RSWM LIMITED
Place: Noida Surender GuptaDate: 5th August, 2019 Company Secretary
M. No. FCS - 2615
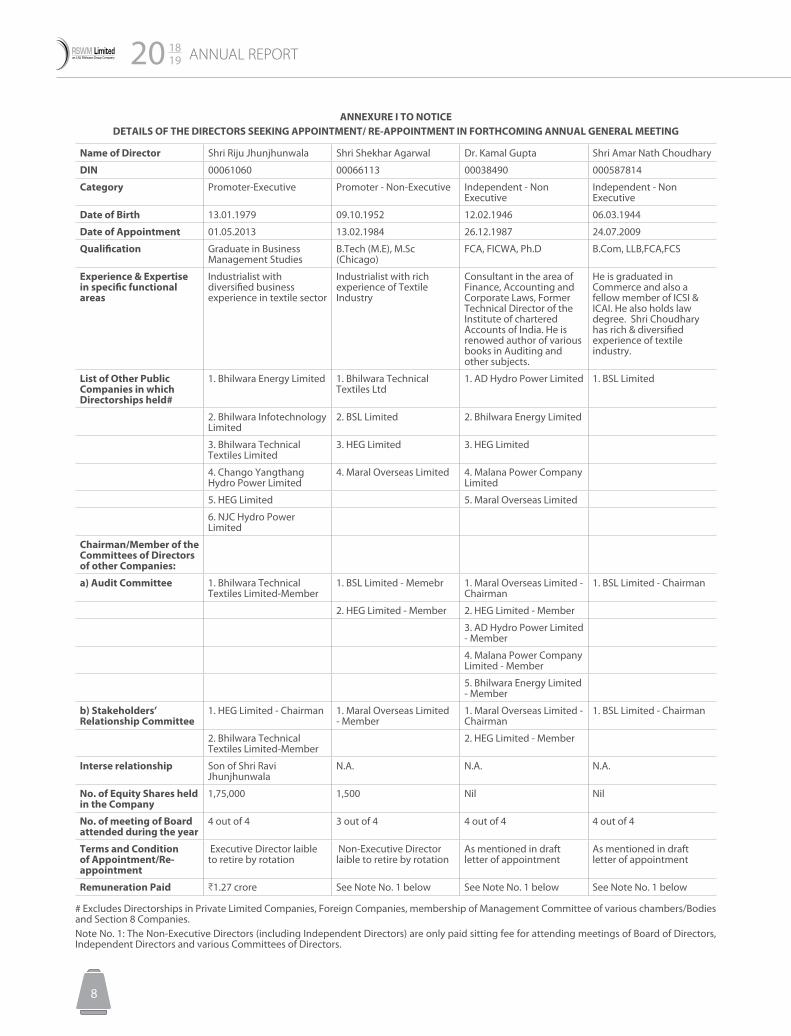
ANNUAL REPORT20 1819
98
ANNEXURE I TO NOTICEDETAILS OF THE DIRECTORS SEEKING APPOINTMENT/ RE-APPOINTMENT IN FORTHCOMING ANNUAL GENERAL MEETING
Name of Director Shri Riju Jhunjhunwala Shri Shekhar Agarwal Dr. Kamal Gupta Shri Amar Nath Choudhary
DIN 00061060 00066113 00038490 000587814
Category Promoter-Executive Promoter - Non-Executive Independent - Non Executive
Independent - Non Executive
Date of Birth 13.01.1979 09.10.1952 12.02.1946 06.03.1944
Date of Appointment 01.05.2013 13.02.1984 26.12.1987 24.07.2009
Qualification Graduate in Business Management Studies
B.Tech (M.E), M.Sc (Chicago)
FCA, FICWA, Ph.D B.Com, LLB,FCA,FCS
Experience & Expertise in specific functional areas
Industrialist with diversified business experience in textile sector
Industrialist with rich experience of Textile Industry
Consultant in the area of Finance, Accounting and Corporate Laws, Former Technical Director of the Institute of chartered Accounts of India. He is renowed author of various books in Auditing and other subjects.
He is graduated in Commerce and also a fellow member of ICSI & ICAI. He also holds law degree. Shri Choudhary has rich & diversified experience of textile industry.
List of Other Public Companies in which Directorships held#
1. Bhilwara Energy Limited 1. Bhilwara Technical Textiles Ltd
1. AD Hydro Power Limited 1. BSL Limited
2. Bhilwara Infotechnology Limited
2. BSL Limited 2. Bhilwara Energy Limited
3. Bhilwara Technical Textiles Limited
3. HEG Limited 3. HEG Limited
4. Chango Yangthang Hydro Power Limited
4. Maral Overseas Limited 4. Malana Power Company Limited
5. HEG Limited 5. Maral Overseas Limited
6. NJC Hydro Power Limited
Chairman/Member of the Committees of Directors of other Companies:
a) Audit Committee 1. Bhilwara Technical Textiles Limited-Member
1. BSL Limited - Memebr 1. Maral Overseas Limited - Chairman
1. BSL Limited - Chairman
2. HEG Limited - Member 2. HEG Limited - Member
3. AD Hydro Power Limited - Member
4. Malana Power Company Limited - Member
5. Bhilwara Energy Limited - Member
b) Stakeholders’ Relationship Committee
1. HEG Limited - Chairman 1. Maral Overseas Limited - Member
1. Maral Overseas Limited - Chairman
1. BSL Limited - Chairman
2. Bhilwara Technical Textiles Limited-Member
2. HEG Limited - Member
Interse relationship Son of Shri Ravi Jhunjhunwala
N.A. N.A. N.A.
No. of Equity Shares held in the Company
1,75,000 1,500 Nil Nil
No. of meeting of Board attended during the year
4 out of 4 3 out of 4 4 out of 4 4 out of 4
Terms and Condition of Appointment/Re-appointment
Executive Director laible to retire by rotation
Non-Executive Director laible to retire by rotation
As mentioned in draft letter of appointment
As mentioned in draft letter of appointment
Remuneration Paid C1.27 crore See Note No. 1 below See Note No. 1 below See Note No. 1 below
# Excludes Directorships in Private Limited Companies, Foreign Companies, membership of Management Committee of various chambers/Bodies and Section 8 Companies.Note No. 1: The Non-Executive Directors (including Independent Directors) are only paid sitting fee for attending meetings of Board of Directors, Independent Directors and various Committees of Directors.
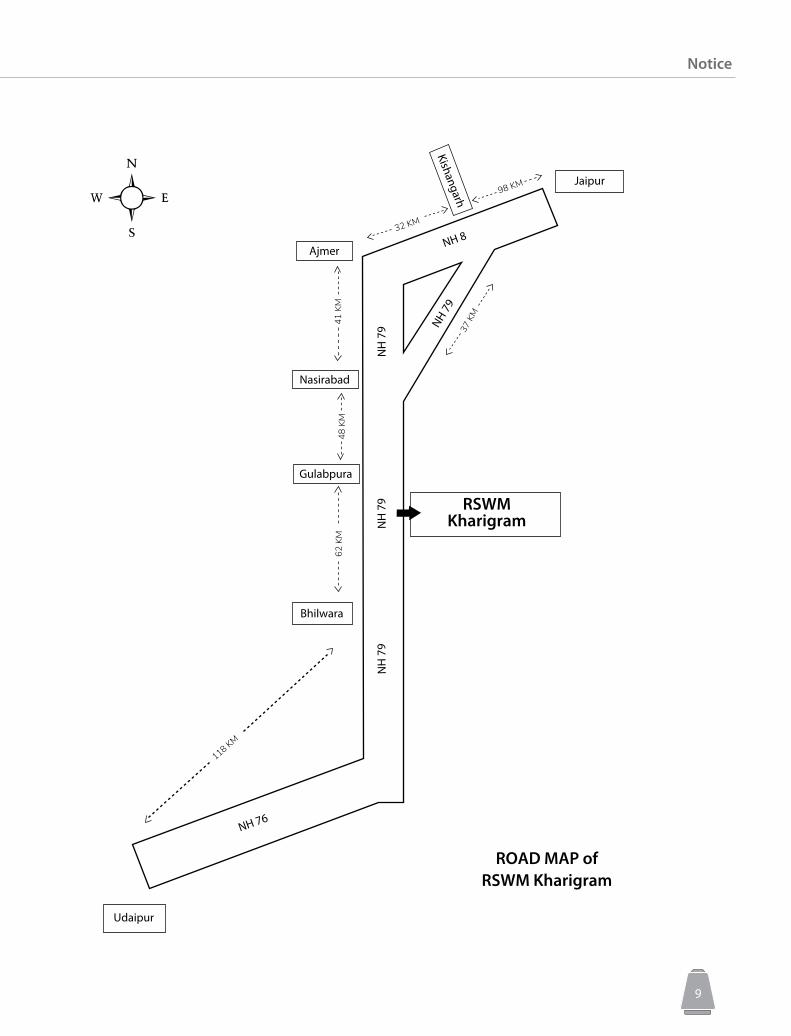
Notice
98
Jaipur
Ajmer
Nasirabad
Gulabpura
Bhilwara
Udaipur
NH 76
NH
79
NH
79
NH
79
NH 8
NH 79
ROAD MAP ofRSWM Kharigram
RSWM Kharigram
Kishangarh

ANNUAL REPORT20 1819
1110
This page is
intentionally blank.
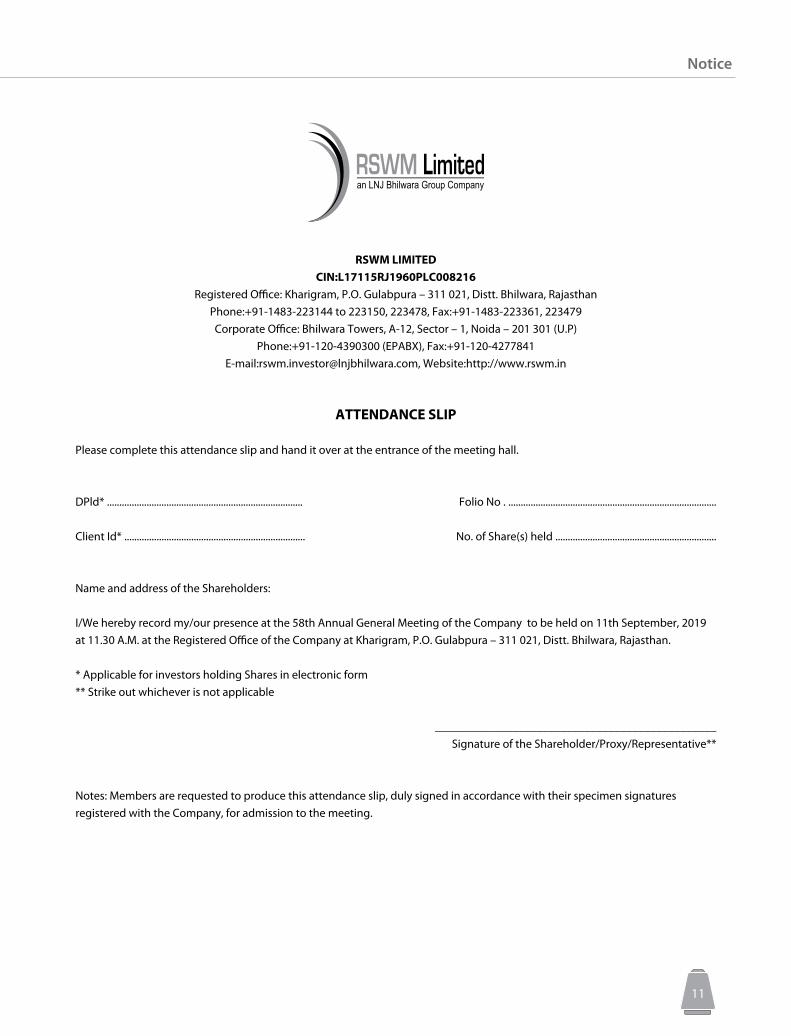
Notice
1110
RSWM LIMITEDCIN:L17115RJ1960PLC008216
Registered Office: Kharigram, P.O. Gulabpura – 311 021, Distt. Bhilwara, RajasthanPhone:+91-1483-223144 to 223150, 223478, Fax:+91-1483-223361, 223479Corporate Office: Bhilwara Towers, A-12, Sector – 1, Noida – 201 301 (U.P)
Phone:+91-120-4390300 (EPABX), Fax:+91-120-4277841E-mail:[email protected], Website:http://www.rswm.in
ATTENDANCE SLIP
Please complete this attendance slip and hand it over at the entrance of the meeting hall.
DPld* ............................................................................... Folio No . ....................................................................................
Client Id* ......................................................................... No. of Share(s) held .................................................................
Name and address of the Shareholders:
I/We hereby record my/our presence at the 58th Annual General Meeting of the Company to be held on 11th September, 2019 at 11.30 A.M. at the Registered Office of the Company at Kharigram, P.O. Gulabpura – 311 021, Distt. Bhilwara, Rajasthan.
* Applicable for investors holding Shares in electronic form ** Strike out whichever is not applicable
_______________________________________________Signature of the Shareholder/Proxy/Representative**
Notes: Members are requested to produce this attendance slip, duly signed in accordance with their specimen signatures registered with the Company, for admission to the meeting.

ANNUAL REPORT20 1819
1312
This page is
intentionally blank.
Notice
1312
RSWM LIMITEDCIN:L17115RJ1960PLC008216
Registered Office: Kharigram, P.O. Gulabpura – 311 021, Distt. Bhilwara, RajasthanPhone:+91-1483-223144 to 223150, 223478, Fax:+91-1483-223361, 223479Corporate Office: Bhilwara Towers, A-12, Sector – 1, Noida – 201 301 (U.P)
Phone:+91-120-4390300 (EPABX), Fax:+91-120-4277841E-mail:[email protected], Website:http://www.rswm.in
PROXY FORM
[Pursuant to Section 105(6) of the Companies Act, 2013 and rule 19(3) of the Companies {Management and Administration} Rules, 2014]
Name of Member(s) : Email ID :
Registered Address : Folio No. /Client ID :
DP ID :
I/We being the member(s) of ____________ shares of the above named Company hereby appoint:
(1) Name:............................................................................................................... Address: ...........................................................................................................
E-mail ID:......................................................................................................... Signature:............................................................................, or failing him;
(2) Name:............................................................................................................... Address: ...........................................................................................................
E-mail ID:......................................................................................................... Signature:............................................................................, or failing him;
(3) Name:............................................................................................................... Address: ...........................................................................................................
E-mail ID:......................................................................................................... Signature:..........................................................................................................
as my/our proxy to attend and vote (on a poll) for me/us and on my/our behalf at the 58th Annual General Meeting of the Company, to be held on Wednesday, 11th September, 2019, at 11.30 A.M. at the Registered Office of the Company at Kharigram, P.O. Gulabpura – 311 021, Distt. Bhilwara, Rajasthan and at any adjournment thereof in respect of such resolutions as are indicated below:
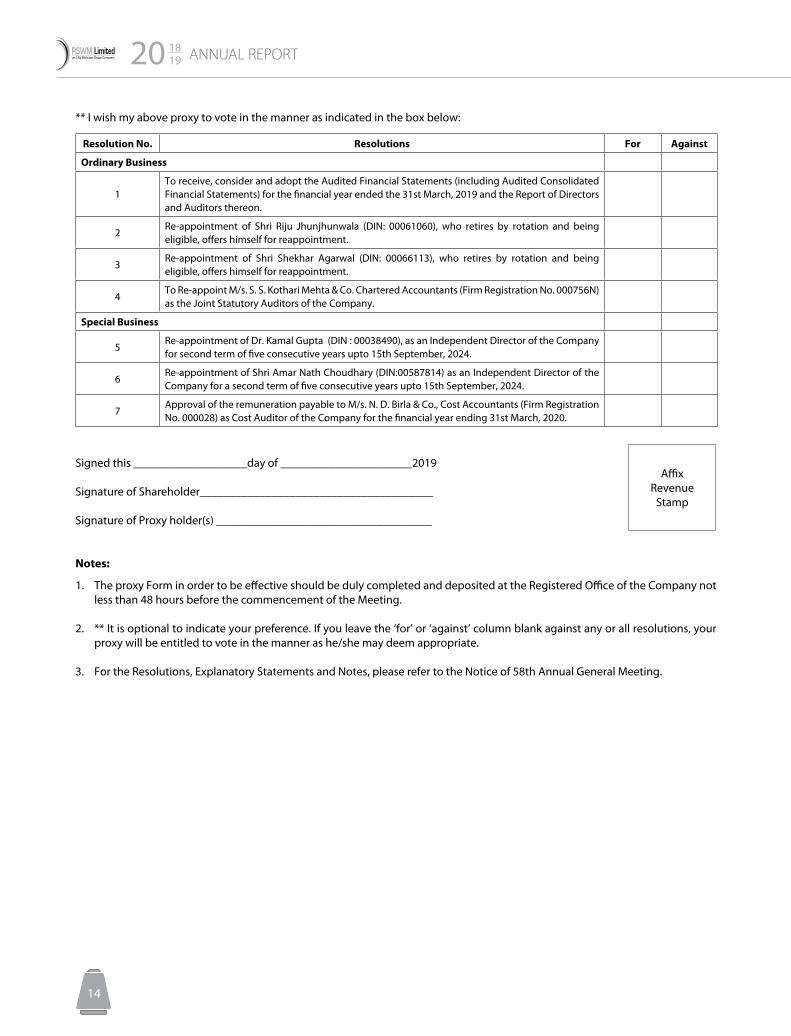
ANNUAL REPORT20 1819
PB14
Resolution No. Resolutions For Against
Ordinary Business
1To receive, consider and adopt the Audited Financial Statements (including Audited Consolidated Financial Statements) for the financial year ended the 31st March, 2019 and the Report of Directors and Auditors thereon.
2Re-appointment of Shri Riju Jhunjhunwala (DIN: 00061060), who retires by rotation and being eligible, offers himself for reappointment.
3Re-appointment of Shri Shekhar Agarwal (DIN: 00066113), who retires by rotation and being eligible, offers himself for reappointment.
4To Re-appoint M/s. S. S. Kothari Mehta & Co. Chartered Accountants (Firm Registration No. 000756N) as the Joint Statutory Auditors of the Company.
Special Business
5Re-appointment of Dr. Kamal Gupta (DIN : 00038490), as an Independent Director of the Company for second term of five consecutive years upto 15th September, 2024.
6Re-appointment of Shri Amar Nath Choudhary (DIN:00587814) as an Independent Director of the Company for a second term of five consecutive years upto 15th September, 2024.
7Approval of the remuneration payable to M/s. N. D. Birla & Co., Cost Accountants (Firm Registration No. 000028) as Cost Auditor of the Company for the financial year ending 31st March, 2020.
** I wish my above proxy to vote in the manner as indicated in the box below:
Signed this ___________________day of ______________________2019
Signature of Shareholder_______________________________________
Signature of Proxy holder(s) ____________________________________
Notes:
1. The proxy Form in order to be effective should be duly completed and deposited at the Registered Office of the Company not less than 48 hours before the commencement of the Meeting.
2. ** It is optional to indicate your preference. If you leave the ‘for’ or ‘against’ column blank against any or all resolutions, your proxy will be entitled to vote in the manner as he/she may deem appropriate.
3. For the Resolutions, Explanatory Statements and Notes, please refer to the Notice of 58th Annual General Meeting.
AffixRevenue
Stamp