care equity research rswm limited · rswm (earlier rajasthan spinning and weaving mills), was...
TRANSCRIPT
RSWM LIMITED
1 www.careratings.com
CARE
EQUITY
RESEARCH
Independent Equity Research
RSWM LIMITED TEXTILES
BSE Scrip Code: 500350
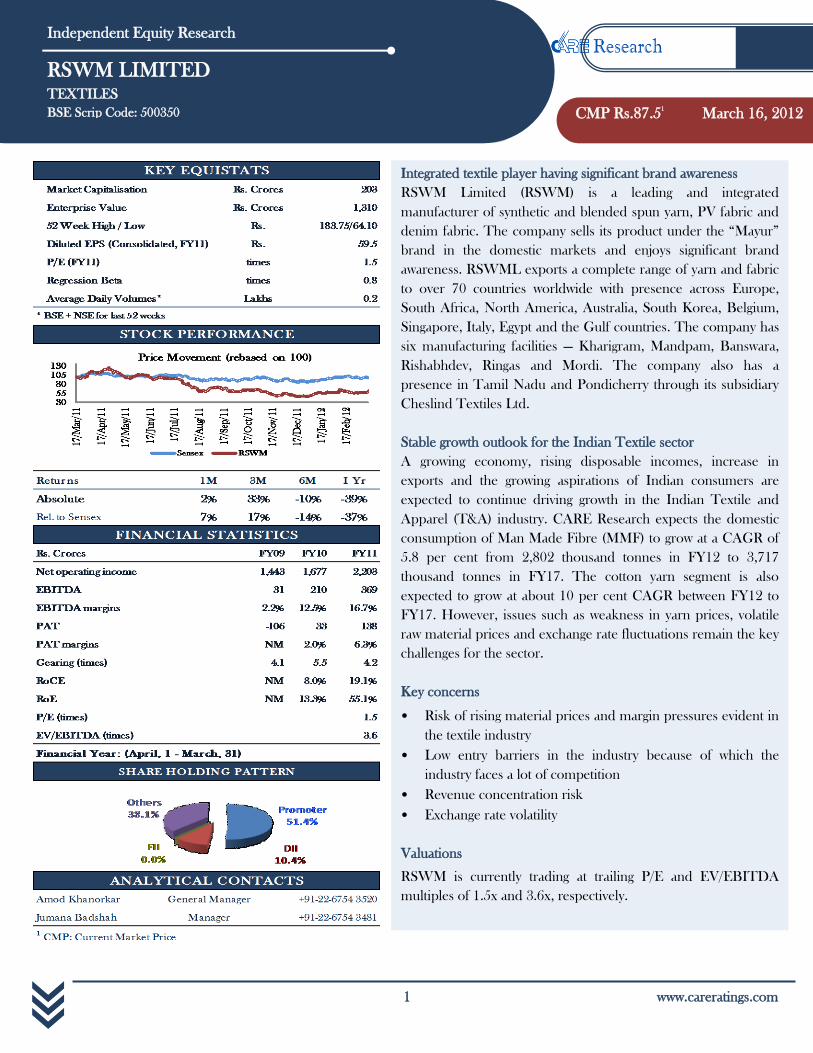
Integrated textile player having significant brand awareness
RSWM Limited (RSWM) is a leading and integrated
manufacturer of synthetic and blended spun yarn, PV fabric and
denim fabric. The company sells its product under the “Mayur”
brand in the domestic markets and enjoys significant brand
awareness. RSWML exports a complete range of yarn and fabric
to over 70 countries worldwide with presence across Europe,
South Africa, North America, Australia, South Korea, Belgium,
Singapore, Italy, Egypt and the Gulf countries. The company has
six manufacturing facilities — Kharigram, Mandpam, Banswara,
Rishabhdev, Ringas and Mordi. The company also has a
presence in Tamil Nadu and Pondicherry through its subsidiary
Cheslind Textiles Ltd.
Stable growth outlook for the Indian Textile sector
A growing economy, rising disposable incomes, increase in
exports and the growing aspirations of Indian consumers are
expected to continue driving growth in the Indian Textile and
Apparel (T&A) industry. CARE Research expects the domestic
consumption of Man Made Fibre (MMF) to grow at a CAGR of
5.8 per cent from 2,802 thousand tonnes in FY12 to 3,717
thousand tonnes in FY17. The cotton yarn segment is also
expected to grow at about 10 per cent CAGR between FY12 to
FY17. However, issues such as weakness in yarn prices, volatile
raw material prices and exchange rate fluctuations remain the key
challenges for the sector.
Key concerns
• Risk of rising material prices and margin pressures evident in
the textile industry
• Low entry barriers in the industry because of which the
industry faces a lot of competition
• Revenue concentration risk
• Exchange rate volatility
Valuations
RSWM is currently trading at trailing P/E and EV/EBITDA
multiples of 1.5x and 3.6x, respectively.
CMP Rs.87.51
March 16, 2012
RSWM LIMITED
www.careratings.com 2
CARE
EQUITY
RESEARCH
Background
RSWM (earlier Rajasthan Spinning and Weaving Mills), was incorporated in 1960 and is the flagship company of
the Bhilwara group. The company is one of the leading and integrated manufacturers of synthetic and blended spun
yarn, PV fabric and denim fabrics. The product-mix of the company includes blends such as polyester, viscose,
polyester sewing threads, acrylic, silk blends, viscose/ flax, and cotton melange yarn. The product range for the
company includes specialty, functional, technical and eco-friendly yarn and fabric along-with basic and commodity
products. The company is focusing to produce more natural textiles in order to meet the emerging needs of the
market. RSWML exports a complete range of yarn and fabric to over 70 countries worldwide, giving it presence
across Europe, South Africa, North America, Australia, South Korea, Belgium, Singapore, Italy, Egypt and the Gulf
countries. It also holds the prestigious ‘Three Star Export House’ status.
Operations
RSWML currently has six manufacturing facilities — Kharigram, Mandpam, Banswara, Rishabhdev, Ringas and
Mordi. All of these locations are in Rajasthan and are self-sustainable units with manufacturing facilities and captive
power generation utilities. The company also has a presence in Tamil Nadu and Puducherry through its subsidiary
Cheslind Textiles Ltd. RSWM is self-reliant in captive power generation of 46 MW that feeds all its integrated units
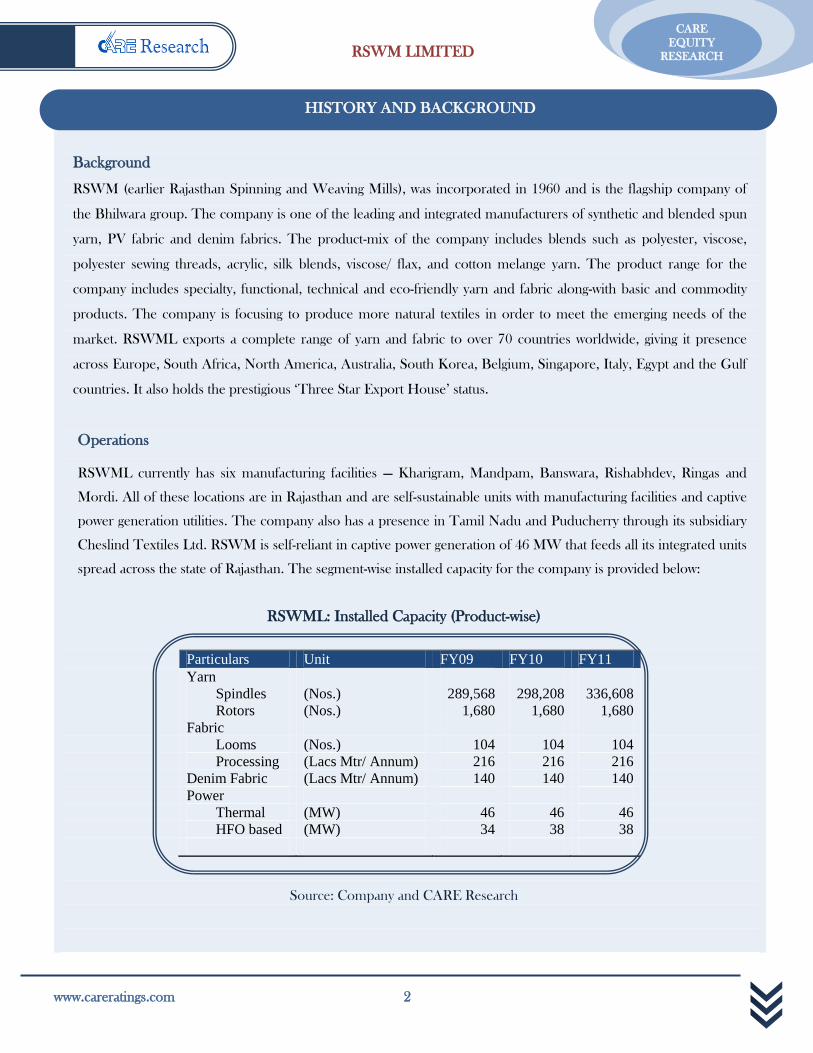
spread across the state of Rajasthan. The segment-wise installed capacity for the company is provided below:
RSWML: Installed Capacity (Product-wise)
Particulars Unit FY09 FY10 FY11
Yarn
Spindles (Nos.) 289,568 298,208 336,608
Rotors (Nos.) 1,680 1,680 1,680
Fabric
Looms (Nos.) 104 104 104
Processing (Lacs Mtr/ Annum) 216 216 216
Denim Fabric (Lacs Mtr/ Annum) 140 140 140
Power
Thermal (MW) 46 46 46
HFO based (MW) 34 38 38
Source: Company and CARE Research
HISTORY AND BACKGROUND
RSWM LIMITED
3 www.careratings.com
CARE
EQUITY
RESEARCH
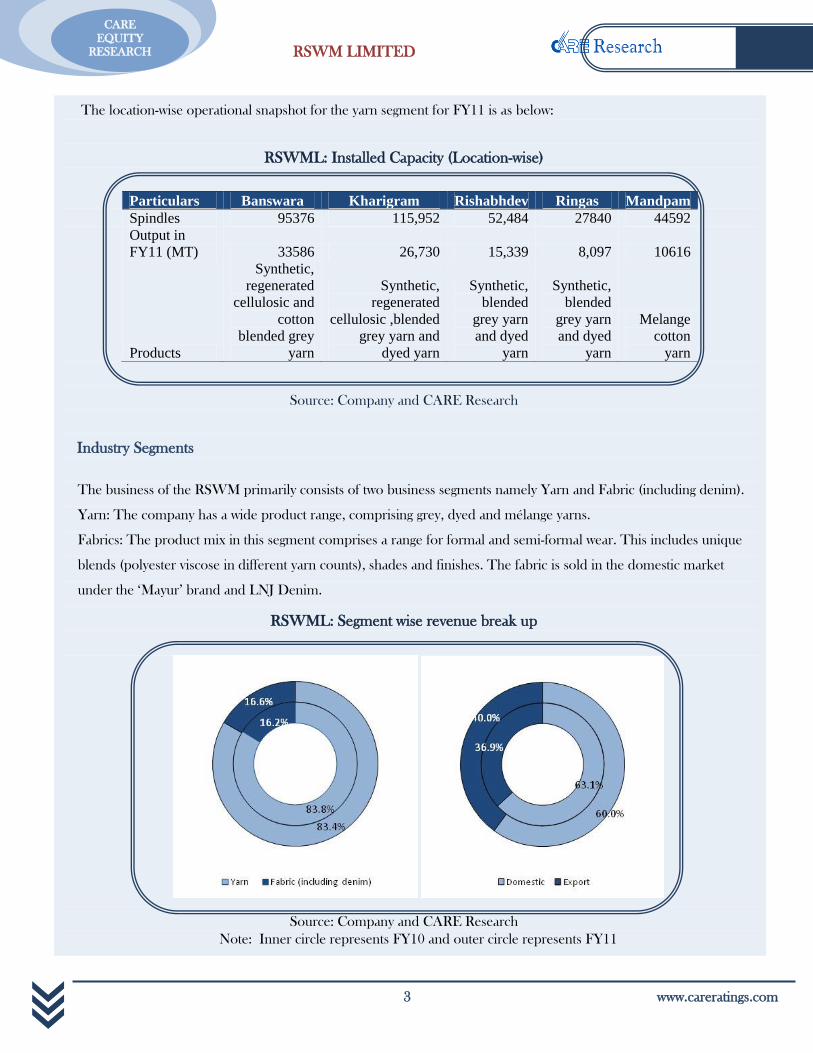
The location-wise operational snapshot for the yarn segment for FY11 is as below:
RSWML: Installed Capacity (Location-wise)
Particulars Banswara Kharigram Rishabhdev Ringas Mandpam
Spindles 95376 115,952 52,484 27840 44592
Output in
FY11 (MT) 33586 26,730 15,339 8,097 10616
Products
Synthetic,
regenerated
cellulosic and
cotton
blended grey
yarn
Synthetic,
regenerated
cellulosic ,blended
grey yarn and
dyed yarn
Synthetic,
blended
grey yarn
and dyed
yarn
Synthetic,
blended
grey yarn
and dyed
yarn
Melange
cotton
yarn
Source: Company and CARE Research
Industry Segments
The business of the RSWM primarily consists of two business segments namely Yarn and Fabric (including denim).
Yarn: The company has a wide product range, comprising grey, dyed and mélange yarns.
Fabrics: The product mix in this segment comprises a range for formal and semi-formal wear. This includes unique
blends (polyester viscose in different yarn counts), shades and finishes. The fabric is sold in the domestic market
under the ‘Mayur’ brand and LNJ Denim.
RSWML: Segment wise revenue break up
Source: Company and CARE Research
Note: Inner circle represents FY10 and outer circle represents FY11
RSWM LIMITED
www.careratings.com 4
CARE
EQUITY
RESEARCH
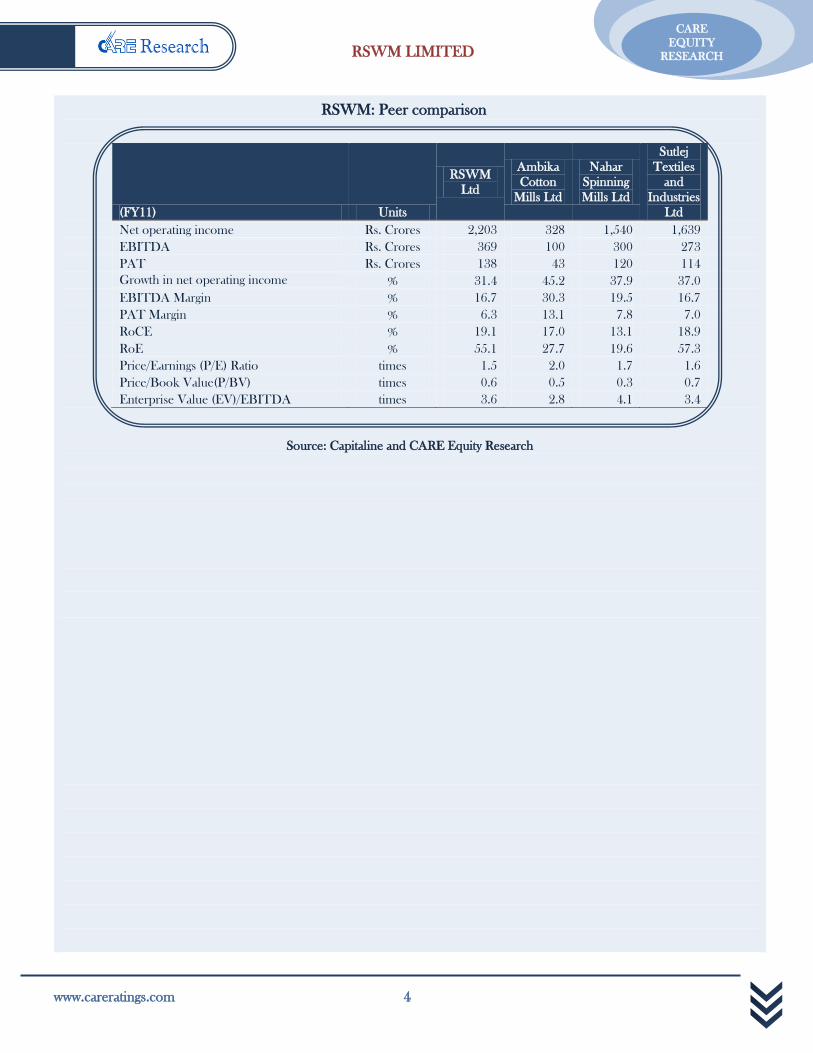
RSWM: Peer comparison
(FY11) Units
RSWM
Ltd
Ambika
Cotton
Mills Ltd
Nahar
Spinning
Mills Ltd
Sutlej
Textiles
and
Industries
Ltd
Net operating income Rs. Crores 2,203 328 1,540 1,639
EBITDA Rs. Crores 369 100 300 273
PAT Rs. Crores 138 43 120 114
Growth in net operating income % 31.4 45.2 37.9 37.0
EBITDA Margin % 16.7 30.3 19.5 16.7
PAT Margin % 6.3 13.1 7.8 7.0
RoCE % 19.1 17.0 13.1 18.9
RoE % 55.1 27.7 19.6 57.3
Price/Earnings (P/E) Ratio times 1.5 2.0 1.7 1.6
Price/Book Value(P/BV) times 0.6 0.5 0.3 0.7
Enterprise Value (EV)/EBITDA times 3.6 2.8 4.1 3.4
Source: Capitaline and CARE Equity Research
RSWM LIMITED
5 www.careratings.com
CARE
EQUITY
RESEARCH
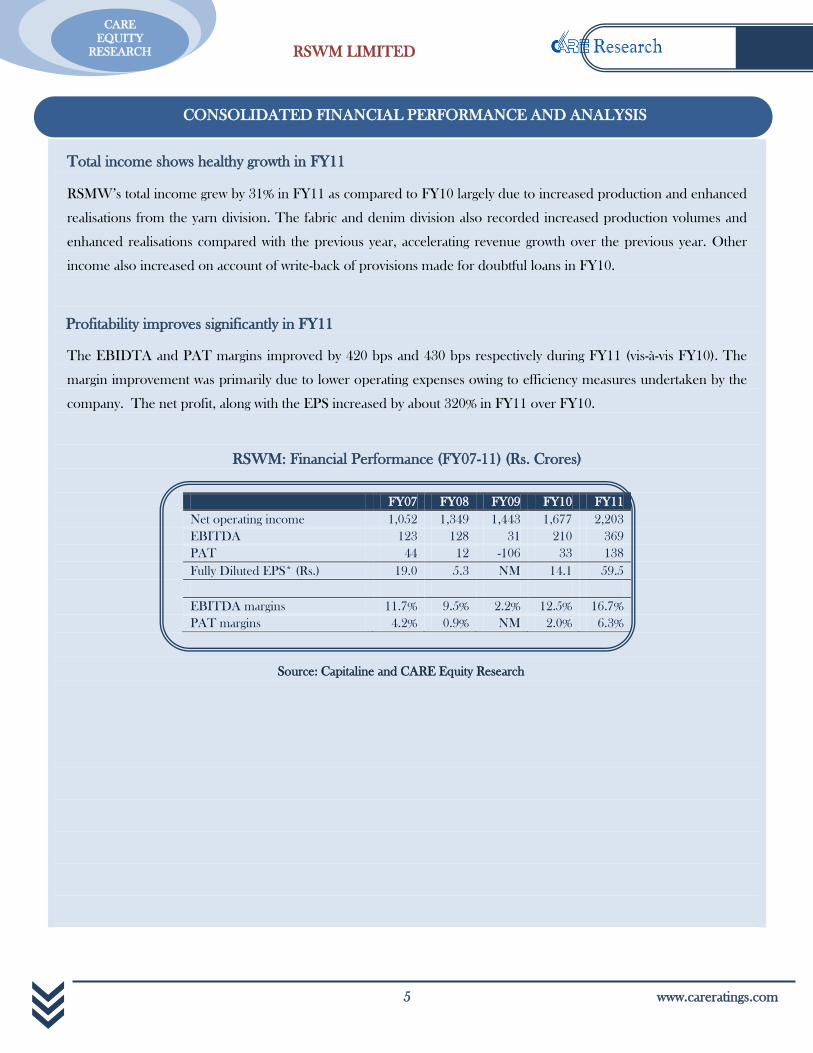
Total income shows healthy growth in FY11
RSMW’s total income grew by 31% in FY11 as compared to FY10 largely due to increased production and enhanced
realisations from the yarn division. The fabric and denim division also recorded increased production volumes and
enhanced realisations compared with the previous year, accelerating revenue growth over the previous year. Other
income also increased on account of write-back of provisions made for doubtful loans in FY10.
Profitability improves significantly in FY11
The EBIDTA and PAT margins improved by 420 bps and 430 bps respectively during FY11 (vis-à-vis FY10). The
margin improvement was primarily due to lower operating expenses owing to efficiency measures undertaken by the
company. The net profit, along with the EPS increased by about 320% in FY11 over FY10.
RSWM: Financial Performance (FY07-11) (Rs. Crores)
FY07 FY08 FY09 FY10 FY11
Net operating income 1,052 1,349 1,443 1,677 2,203
EBITDA 123 128 31 210 369
PAT 44 12 -106 33 138
Fully Diluted EPS* (Rs.) 19.0 5.3 NM 14.1 59.5
EBITDA margins 11.7% 9.5% 2.2% 12.5% 16.7%
PAT margins 4.2% 0.9% NM 2.0% 6.3%
Source: Capitaline and CARE Equity Research
CONSOLIDATED FINANCIAL PERFORMANCE AND ANALYSIS
RSWM LIMITED
www.careratings.com 6
CARE
EQUITY
RESEARCH
Expansion plans and initiatives
RSWM increased production capacity in the yarn segment through the addition of 36,128 spindles for an
investment of Rs.72 crore in FY11.
The company has also planned a Rs.150 crore brown-field expansion to be commissioned by the end of FY12 to
increase the annual manufacturing capacity of yarn by 900 tonnes and denim fabric by 40 lac metres.
The company expects to increase its yarn making capacity to 7,00,000 spindles by the year 2016, thereby
generating economies of scale.
The company plans to strengthen presence in established export destinations and capitalise on opportunities in
Turkey and Columbia.
Key concerns
Risk of rising material prices and margin pressures evident in the textile industry.
Low entry barriers in the industry because of which the industry faces a lot of competition.
With exports forming around 40% of the total revenue in FY11 coupled with the volatility seen in the currency
movements, RSWM is exposed to the foreign currency fluctuation risk. However, the company currently has
policy to hedge majority of its foreign exchange exposure through forward contracts; therefore this risk to that
extent is mitigated.
EXPANSIONS, NEW INITIATIVES AND CONCERNS
RSWM LIMITED
7 www.careratings.com
CARE
EQUITY
RESEARCH
The Indian Textile and Apparel (T&A) industry was estimated to be worth USD 55 billion in 2009-10 as per the
Office of the Textiles Commissioner. It has witnessed robust growth over the last two decades, especially in the period
after the abolition of the Quota regime on January 1, 2005, which led to free cross-border textile trade. India is
positioned as a key manufacturing destination with inexpensive labor, abundant cotton supplies and good designing
skills. Approximately 60% of the total T&A production is consumed domestically. India’s T&A exports grew from
USD 17.7 billion in FY06 to USD 22.4 billion in FY10, registering a CAGR of 6 per cent. T&A is one of the largest
and the most important sectors for the Indian economy in terms of output, foreign exchange earnings and
employment. It contributes approximately 14% to India’s industrial production, 4% to the country's GDP and 17% to
the country’s export earnings. It provides direct employment to over 35 million people and is the second-largest
employment provider after agriculture. The development of this sector has had a significant overall impact on the
economy. Indian T&A makes up approximately 4% of the global T&A market.
As an industry with economic importance, the textile industry has always been an important sector for the
government. The government has therefore introduced policies such as Technology Upgradation Fund Scheme,
Scheme for Integrated Textile Parks, National Textile Policy, with low excise duty and high import duty (to
discourage imports) to benefit the development of the textile sector. The largest sector within the textile industry is the
decentralized power-loom and knitting sector. The major sub-sectors that comprise the textile sector include the
cotton/Man-Made Fiber (MMF) textile mill industry, the MMF/filament yarn industry, the wool & woollen textile
industry, the sericulture and silk textile industry, handlooms, the jute & jute textiles industry and textiles exports. A
growing economy, rising disposable incomes and the growing aspirations of Indian consumers are expected to
continue driving growth in the Indian T&A industry.
Classification of the Indian Textile Industry based on fibres
Cotton: Cotton is a natural fibre that is harvested from a cotton plant and is one of the oldest forms of fibres under
cultivation as its history dates back over 7,000 years. It is a soft, fluffy staple fibre that grows in a protective capsule of a
cotton plant. Cotton is used to make a number of textile products like terrycloth for bath towels & robes that require
high absorbent qualities, denim jeans, corduroy and t-shirts. Cotton is also used in manufacturing bed linen. Cotton
may also be used by blending it with other fibres like rayon & synthetic products like polyester. World cotton
production in the cotton season 2010-11 has increased by 13% to 24.8 million tonnes on yoy basis. This rise in
production was driven by USA & India whereas China & Pakistan witnessed a decline in production. BT Cotton that
constitutes almost 88% of the total acreage under cotton saw harvests touching to 5.30 million tonnes in 2010-11 v/s
5.02 million tonnes in 2009-10, witnessing a growth of 6%.
SECTOR OUTLOOK
RSWM LIMITED
www.careratings.com 8
CARE
EQUITY
RESEARCH
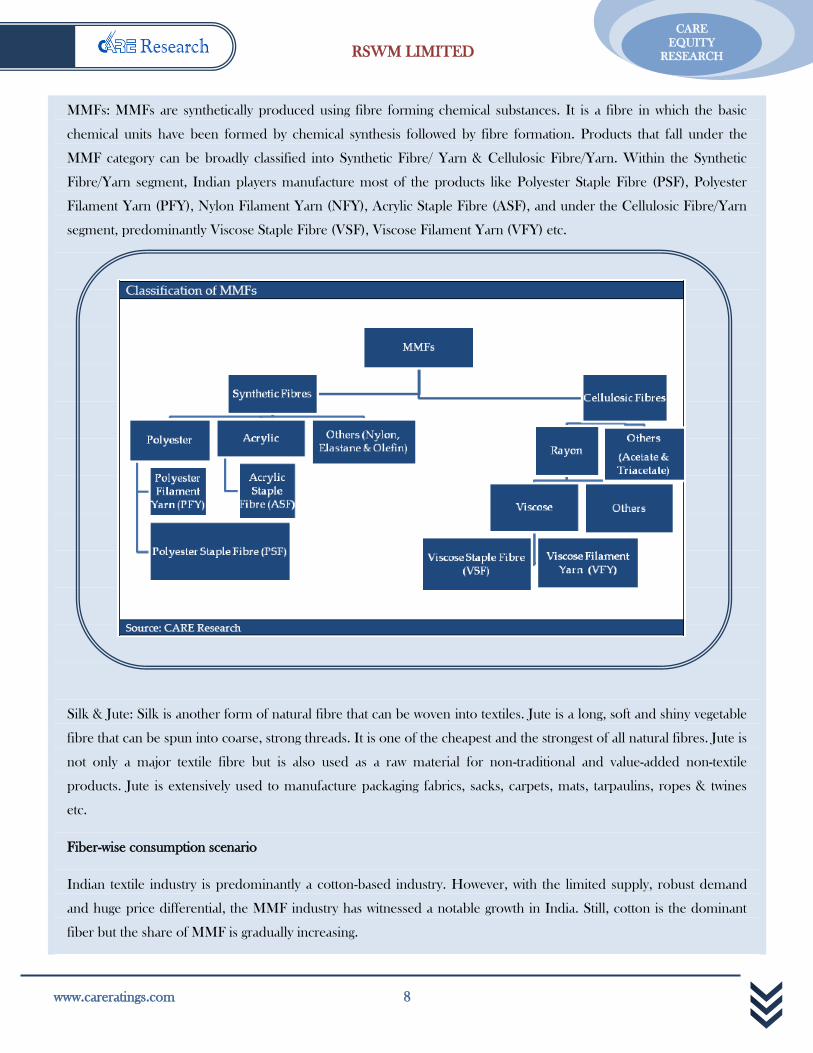
MMFs: MMFs are synthetically produced using fibre forming chemical substances. It is a fibre in which the basic
chemical units have been formed by chemical synthesis followed by fibre formation. Products that fall under the
MMF category can be broadly classified into Synthetic Fibre/ Yarn & Cellulosic Fibre/Yarn. Within the Synthetic
Fibre/Yarn segment, Indian players manufacture most of the products like Polyester Staple Fibre (PSF), Polyester
Filament Yarn (PFY), Nylon Filament Yarn (NFY), Acrylic Staple Fibre (ASF), and under the Cellulosic Fibre/Yarn
segment, predominantly Viscose Staple Fibre (VSF), Viscose Filament Yarn (VFY) etc.
Silk & Jute: Silk is another form of natural fibre that can be woven into textiles. Jute is a long, soft and shiny vegetable
fibre that can be spun into coarse, strong threads. It is one of the cheapest and the strongest of all natural fibres. Jute is
not only a major textile fibre but is also used as a raw material for non-traditional and value-added non-textile
products. Jute is extensively used to manufacture packaging fabrics, sacks, carpets, mats, tarpaulins, ropes & twines
etc.
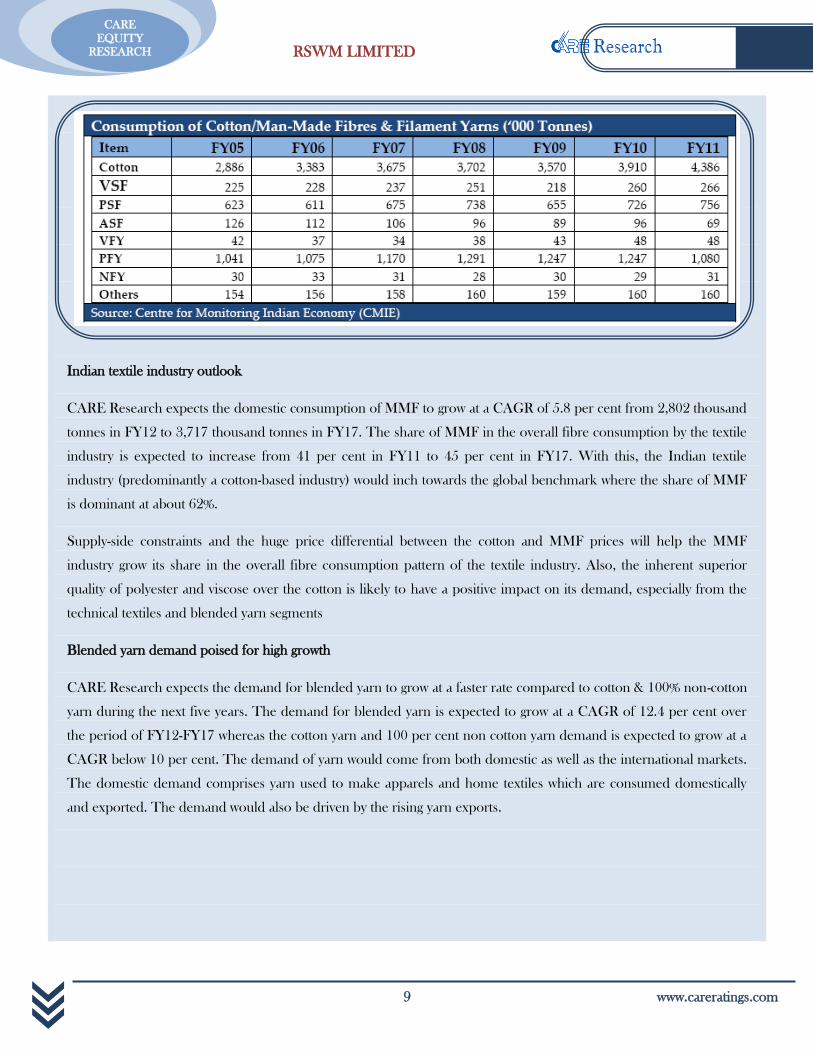
Fiber-wise consumption scenario
Indian textile industry is predominantly a cotton-based industry. However, with the limited supply, robust demand
and huge price differential, the MMF industry has witnessed a notable growth in India. Still, cotton is the dominant
fiber but the share of MMF is gradually increasing.
RSWM LIMITED
9 www.careratings.com
CARE
EQUITY
RESEARCH
Indian textile industry outlook
CARE Research expects the domestic consumption of MMF to grow at a CAGR of 5.8 per cent from 2,802 thousand
tonnes in FY12 to 3,717 thousand tonnes in FY17. The share of MMF in the overall fibre consumption by the textile
industry is expected to increase from 41 per cent in FY11 to 45 per cent in FY17. With this, the Indian textile
industry (predominantly a cotton-based industry) would inch towards the global benchmark where the share of MMF
is dominant at about 62%.
Supply-side constraints and the huge price differential between the cotton and MMF prices will help the MMF
industry grow its share in the overall fibre consumption pattern of the textile industry. Also, the inherent superior
quality of polyester and viscose over the cotton is likely to have a positive impact on its demand, especially from the
technical textiles and blended yarn segments
Blended yarn demand poised for high growth
CARE Research expects the demand for blended yarn to grow at a faster rate compared to cotton & 100% non-cotton
yarn during the next five years. The demand for blended yarn is expected to grow at a CAGR of 12.4 per cent over
the period of FY12-FY17 whereas the cotton yarn and 100 per cent non cotton yarn demand is expected to grow at a
CAGR below 10 per cent. The demand of yarn would come from both domestic as well as the international markets.
The domestic demand comprises yarn used to make apparels and home textiles which are consumed domestically
and exported. The demand would also be driven by the rising yarn exports.
RSWM LIMITED
www.careratings.com 10
CARE
EQUITY
RESEARCH
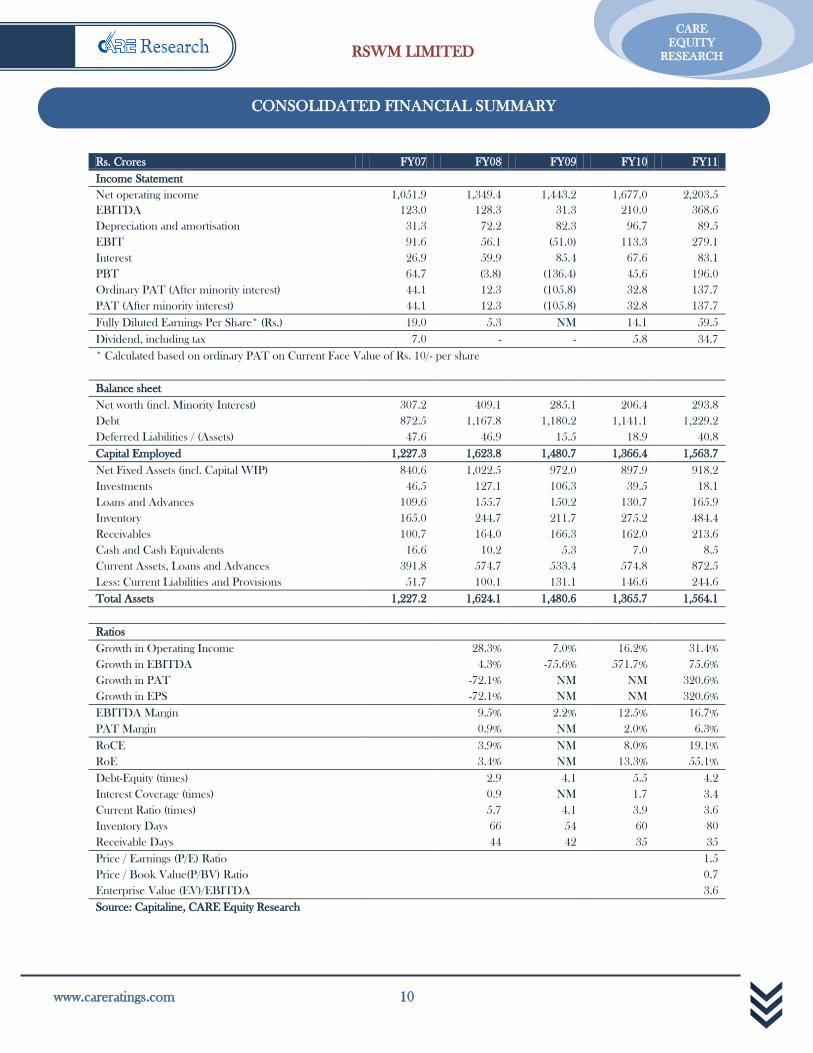
Rs. Crores FY07 FY08 FY09 FY10 FY11
Income Statement
Net operating income 1,051.9 1,349.4 1,443.2 1,677.0 2,203.5
EBITDA 123.0 128.3 31.3 210.0 368.6
Depreciation and amortisation 31.3 72.2 82.3 96.7 89.5
EBIT 91.6 56.1 (51.0) 113.3 279.1
Interest 26.9 59.9 85.4 67.6 83.1
PBT 64.7 (3.8) (136.4) 45.6 196.0
Ordinary PAT (After minority interest) 44.1 12.3 (105.8) 32.8 137.7
PAT (After minority interest) 44.1 12.3 (105.8) 32.8 137.7
Fully Diluted Earnings Per Share* (Rs.) 19.0 5.3 NM 14.1 59.5
Dividend, including tax 7.0 - - 5.8 34.7
* Calculated based on ordinary PAT on Current Face Value of Rs. 10/- per share
Balance sheet
Net worth (incl. Minority Interest) 307.2 409.1 285.1 206.4 293.8
Debt 872.5 1,167.8 1,180.2 1,141.1 1,229.2
Deferred Liabilities / (Assets) 47.6 46.9 15.5 18.9 40.8
Capital Employed 1,227.3 1,623.8 1,480.7 1,366.4 1,563.7
Net Fixed Assets (incl. Capital WIP) 840.6 1,022.5 972.0 897.9 918.2
Investments 46.5 127.1 106.3 39.5 18.1
Loans and Advances 109.6 155.7 150.2 130.7 165.9
Inventory 165.0 244.7 211.7 275.2 484.4
Receivables 100.7 164.0 166.3 162.0 213.6
Cash and Cash Equivalents 16.6 10.2 5.3 7.0 8.5
Current Assets, Loans and Advances 391.8 574.7 533.4 574.8 872.5
Less: Current Liabilities and Provisions 51.7 100.1 131.1 146.6 244.6
Total Assets 1,227.2 1,624.1 1,480.6 1,365.7 1,564.1
Ratios
Growth in Operating Income 28.3% 7.0% 16.2% 31.4%
Growth in EBITDA
4.3% -75.6% 571.7% 75.6%
Growth in PAT
-72.1% NM NM 320.6%
Growth in EPS -72.1% NM NM 320.6%
EBITDA Margin
9.5% 2.2% 12.5% 16.7%
PAT Margin 0.9% NM 2.0% 6.3%
RoCE 3.9% NM 8.0% 19.1%
RoE 3.4% NM 13.3% 55.1%
Debt-Equity (times) 2.9 4.1 5.5 4.2
Interest Coverage (times)
0.9 NM 1.7 3.4
Current Ratio (times)
5.7 4.1 3.9 3.6
Inventory Days
66 54 60 80
Receivable Days
44 42 35 35
Price / Earnings (P/E) Ratio 1.5
Price / Book Value(P/BV) Ratio
0.7
Enterprise Value (EV)/EBITDA 3.6
Source: Capitaline, CARE Equity Research
CONSOLIDATED FINANCIAL SUMMARY
RSWM LIMITED
11 www.careratings.com
CARE
EQUITY
RESEARCH
DISCLOSURES
Each member of the team involved in the preparation of this grading report, hereby affirms that there
exists no conflict of interest that can bias the grading recommendation of the company.
This report has been sponsored by the Bombay Stock Exchange (BSE).
DISCLAIMER
This BSE sponsored report is prepared by CARE Research, a division of Credit Analysis & REsearch
Limited [CARE]. CARE Research has taken utmost care to ensure accuracy and objectivity while developing
this report based on information available in public domain or from sources considered reliable. However,
neither the accuracy nor completeness of information contained in this report is guaranteed. Opinions
expressed herein are our current opinions as on the date of this report. Nothing in this report can be
construed as either investment or any other advice or any solicitation, whatsoever. The subscriber / user
assumes the entire risk of any use made of this report or data herein. CARE specifically states that it or any
of its divisions or employees do not have any financial liabilities whatsoever to the subscribers / users of this
report. This report is for personal information only of the authorised recipient in India only. This report or
part of it should not be reproduced or redistributed or communicated directly or indirectly in any form to
any other person or published or copied for any purpose.
“Credit Analysis and Research Limited proposes, subject to receipt of requisite approvals, market conditions
and other considerations, to make an initial public offer of its equity shares and has filed a draft red herring
prospectus (“DRHP”) with the Securities and Exchange Board of India (the “SEBI”). The DRHP is
available on the website of SEBI at www.sebi.gov.in as well as on the websites of the Book Running Lead
Managers at www.investmentbank.kotak.com, www.dspml.com, www.edelcap.com, www.icicisecurities.com,
www.idbicapital.com, and www.sbicaps.com. Investors should note that investment in equity shares involves a
high degree of risk and for details relating to the same, see the section titled “Risk Factors” of the DRHP.”
[“This press release is not for publication or distribution to persons in the United States, and is not an offer
for sale within the United States of any equity shares or any other security of Credit Analysis and Research
Limited. Securities of Credit Analysis and Research Limited, including its equity shares, may not be offered
or sold in the United States absent registration under U.S. securities laws or unless exempt from registration
under such laws.”]
Published by Credit Analysis & REsearch Ltd., 4th Floor Godrej Coliseum, Off Eastern Express Highway,
Somaiya Hospital Road, Sion East, Mumbai – 400 022.
CARE Research is not responsible for any errors or omissions in analysis/inferences/views or for results
obtained from the use of information contained in this report and especially states that CARE (including all
divisions) has no financial liability whatsoever to the user of this product. This report is for the information of
the intended recipients only and no part of this report may be published or reproduced in any form or
manner without prior written permission of CARE Research.
DISCLAIMER
RSWM LIMITED
www.careratings.com 12
CARE
EQUITY
RESEARCH
Credit Analysis & REsearch Ltd. (CARE) is a full service rating company that offers a wide range of rating and grading services
across sectors. CARE has an unparallel depth of expertise. CARE Ratings methodologies are in line with the best international
practices.
CARE Research
CARE Research is an independent research division of CARE Ratings, a full-service rating company. CARE Research is involved
in preparing detailed industry research reports with 5-year demand and 2-year profitability outlook on the industry besides
providing comprehensive trend analysis and the current state of the industry. CARE Research currently offers reports on more
than 26 industries which are updated on a monthly/quarterly basis. Subscribers can access CARE Research reports online. CARE
Research also offers research that is customized to client requirements. Customized Research involves business analysis and
position in the market, financial analysis and market sizing etc.
HEAD OFFICE
Godrej Coliseum, Somaiya Hospital Road, Off Eastern Express Highway, Sion (East), Mumbai – 400 022
Tel: +91-22-67543456, Fax: +91-22-67543457.
NEW DELHI
3rd Floor, B -47, Inner Circle, Near Plaza Cinema, Connaught
Place, New Delhi - 110 001.
Tel: +91-11-23318701 / 23716199 / 23328524.
KOLKATA
3rd Floor, Prasad Chambers (Shagun Mall Building), 10A,
Shakespeare Sarani, Kolkata - 700 0717
Tel: +91-33-22831800 / 22831803 / 22808472.
CHENNAI
Unit No. O-509/C, Spencer Plaza, 5th Floor, No. 769,
Anna Salai, Chennai 600 002
Tel: +91-44-28497812/28490811
AHMEDABAD
32, Titanium, Prahaladnagar Corporate Road, Satellite,
Ahmedabad - 380 015
Tel: +91-79-40265656.
HYDERABAD
401, Ashoka Scintilla, 3-6-520, Himayat Nagar,
Hyderabad - 500 029
Tel: +91-040 40102030
BENGALURU
Unit No. 8, I floor, Commander's Place,
No. 6, Raja Ram Mohan Roy Road, (Opp. P F Office),
Richmond Circle, Bangalore - 560 025
Tel: +91-80-22117140
ABOUT US
Published on behalf of The Stock Exchange Investors' Protection Fund
Bombay Stock Exchange Ltd.
P J Towers, Dalal Street, Mumbai. Tel: 22721233/34 www.bseindia.com