liftoff-2016-mobile-index
TRANSCRIPT

Index User acquisition
trends & benchmarks
Mobile App Engagement
JAN U A R Y- JUNE 2016

2
Table of Contents
Getting Started4 Introduction
5 First Half 2016 Highlights
Mobile Engagement Benchmarks7 Mobile Engagement Benchmarks
Mobile Indexes9 Average Cost per Registration
10 Average Cost per Reservation
11 Average Cost per Purchase
12 Average Cost per In-App Purchase
13 Average Cost per Subscription
Engagement by Platform14 Engagement by Platform
Engagement by Gender17 Engagement by Gender
Engagement by Category18 Shopping
19 Finance
20 Gaming
21 Travel
22 Utility
Conclusion

3
GettingStarted

4
The Liftoff 2016 Mobile App Engagement Index measures the costs associated with the actions marketers want their users to take on mobile apps.
Introduction
The Index tracks the costs of App Installs,
Registrations, Purchases, Subscriptions,
Reservations, and In-App Purchases and
further breaks down those costs per
action (CPA) across gender and operating
systems. It’s focused on five major app
categories: Shopping, Finance, Gaming,
Travel, and Utility.
The purpose of this Index is to give
mobile marketers a way to benchmark
the performance they saw with their user
acquisition channels against what others in
their app category experienced.
In the first six months of 2016, we saw
the average cost to acquire a user who
completed a purchase or subscribed to
a service rise and fall. It’s not unusual for
CPAs to rise in the beginning of the year,
as consumers are typically less likely to
spend right after the holidays. But as spring
comes around, users are more likely to pull
out their wallets.
Gaming and travel apps also saw their costs
for acquiring new, engaged users decrease
over the first half of the year, especially
as summer drew near. With consumers
planning summer vacations and having
more time to play games, engagement rates
picked up considerably.
The Liftoff 2016 Mobile App Engagement
Index is based on an analysis from January
1 through June 30 of more than 7.3 million
app installs, 65 million post install events,
67% of which took place in North America,
while 33% occurred in Asia, Europe, South
America, and the Middle East.
Getting Started

5
First Half 2016 Highlights
The average cost per install was $4.37. Utility apps
were lowest at $2.91, while Finance apps were the most
expensive, costing $6.63
The cost to acquire a travel app user who made a
reservation was $38.66, down 14.6% from a year ago
Gaming in-app purchase rates decreased 47% for the
first half of 2016
Women who complete a purchase cost 40% less to
acquire than men
Acquiring a male who subscribed to a mobile service
cost 13% less than a female
Acquiring a user who completed a reservation cost 25%
less on iOS than on Android
1
2
3
4
5
6
Getting Started

6
Mobile Engagement Benchmarks

7
INSTALL
The Mobile App Engagement Index benchmarks the average cost to acquire a new user from a paid app install campaign who engages in a post-install event for the first time.
Mobile Engagement Benchmarks
Mobile Engagement Benchmarks
2016 CPA CHART
The events measured are registering, making a reservation, completing a purchase,
subscribing to a paid service, and making an in-app purchase in a game.
As in previous index reports, subscription and purchase events carried the highest
user acquisition costs, while registrations - a non-transactional event - were the least
expensive.
SUBSCRIPTIONPURCHASEREGISTER RESERVEIN-APP
PURCHASE
$4.37
Subscription apps cost 26.5x
more than registration apps.!
8
Mobile Indexes

9
Average Cost per Registration
The Registration Index measures the cost to acquire a mobile user from a paid app install
campaign who creates an account in an app. Registration costs increased over the first few
months after the holiday season came to a close, but decreased to a low of $6.88 by the end of
June. In 2015, registration costs peaked during the summer, but it does not appear that will be the
case in 2016 based on the current trend.
7/15 8/15 9/15 10/15 11/15 12/15 1/16 2/16 3/16 4/16 5/16 6/16
$11.27
$9.46
$8.72
$8.68
$8.53
$7.69
$8.76
$9.79
$10.75
$7.83$8.53
$6.88
$6
$8
$10
$12
Mobile Indexes
Registration costs peaked in March for the
first half of 2016, then drop dramatically
leading up to summer. It’s safe to say people start
to register for more things in the spring.
!

10
Average Cost per Reservation
The Reservation Index measures the cost to acquire a mobile user who makes a travel reservation,
such as a flight or hotel room, or makes a restaurant reservation. Reservation costs peaked in Q3
2015, but have steadily decreased since then - besides a brief increase in February and March.
Last year, reservation costs were on the rise in Q2, but we saw the opposite this year - a sign that
planning trips and dinner reservations on mobile devices has become more mainstream.
Mobile Indexes
7/15 8/15 9/15 10/15 11/15 12/15 1/16 2/16 3/16 4/16 5/16 6/16
$61.09
$56.42
$51.09
$48.18
$43.40
$38.36
$35.92
$41.12$47.62
$38.76
$35.80
$28.76
$20
$30
$40
$50
$60
$70
$80Overall, reservation CPAs are on the
decline. This would indicate that booking
travel on mobile is hitting critical mass adoption.
!

11
Average Cost per Purchase
The Purchase Index measures the cost to acquire a mobile user who completes a first purchase.
Following the 2015 holiday shopping season, the average cost per first purchase remained high
through March, likely due to the fact that mobile retail shopping slows down tremendously in the
first half of the year.
Mobile Indexes
7/15 8/15 9/15 10/15 11/15 12/15 1/16 2/16 3/16 4/16 5/16 6/16
$67.16
$76.40
$62.00
$71.06
$81.92
$74.02
$78.47
$71.57
$79.29
$61.46
$49.30 $43.80
$40
$60
$80
$100
June represented the lowest cost per
purchase month. In fact, it was nearly half !
of what it was in March - the most expensive
month in 2016.
12
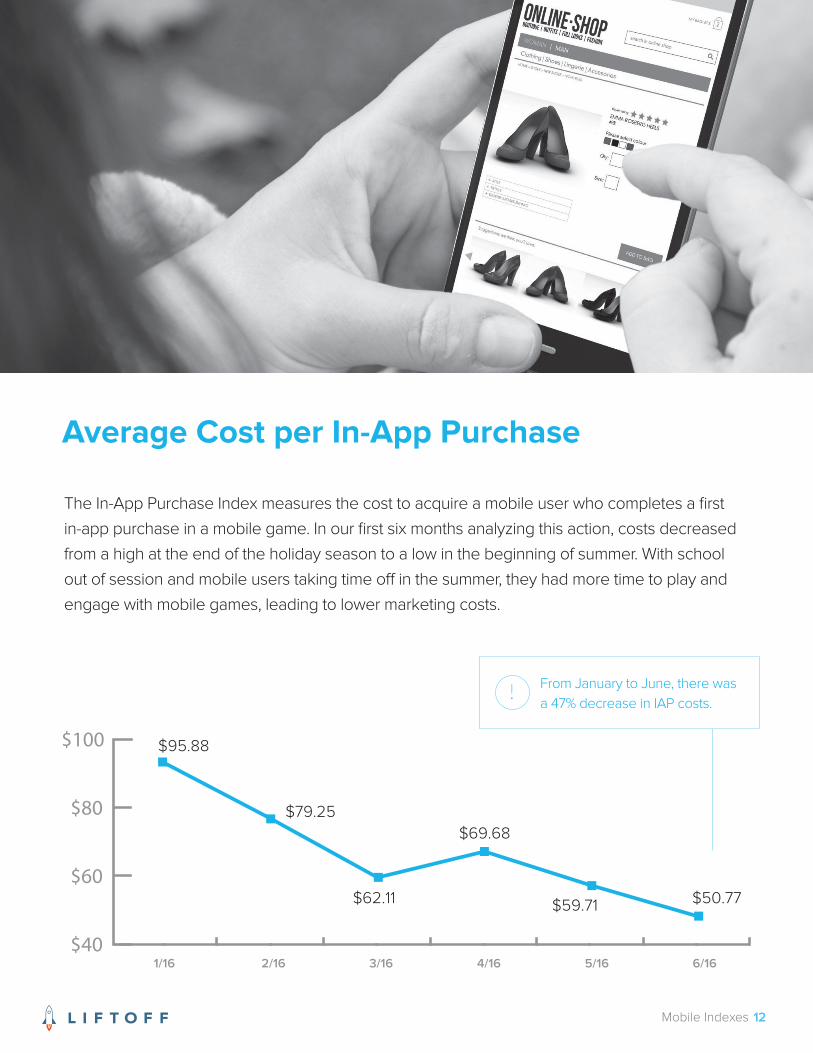
Average Cost per In-App Purchase
Mobile Indexes
1/16 2/16 3/16 4/16 5/16 6/16
$40
$60
$80
$100
$79.25
$95.88
$62.11
$69.68
$59.71 $50.77
The In-App Purchase Index measures the cost to acquire a mobile user who completes a first
in-app purchase in a mobile game. In our first six months analyzing this action, costs decreased
from a high at the end of the holiday season to a low in the beginning of summer. With school
out of session and mobile users taking time off in the summer, they had more time to play and
engage with mobile games, leading to lower marketing costs.
From January to June, there was
a 47% decrease in IAP costs.!
13
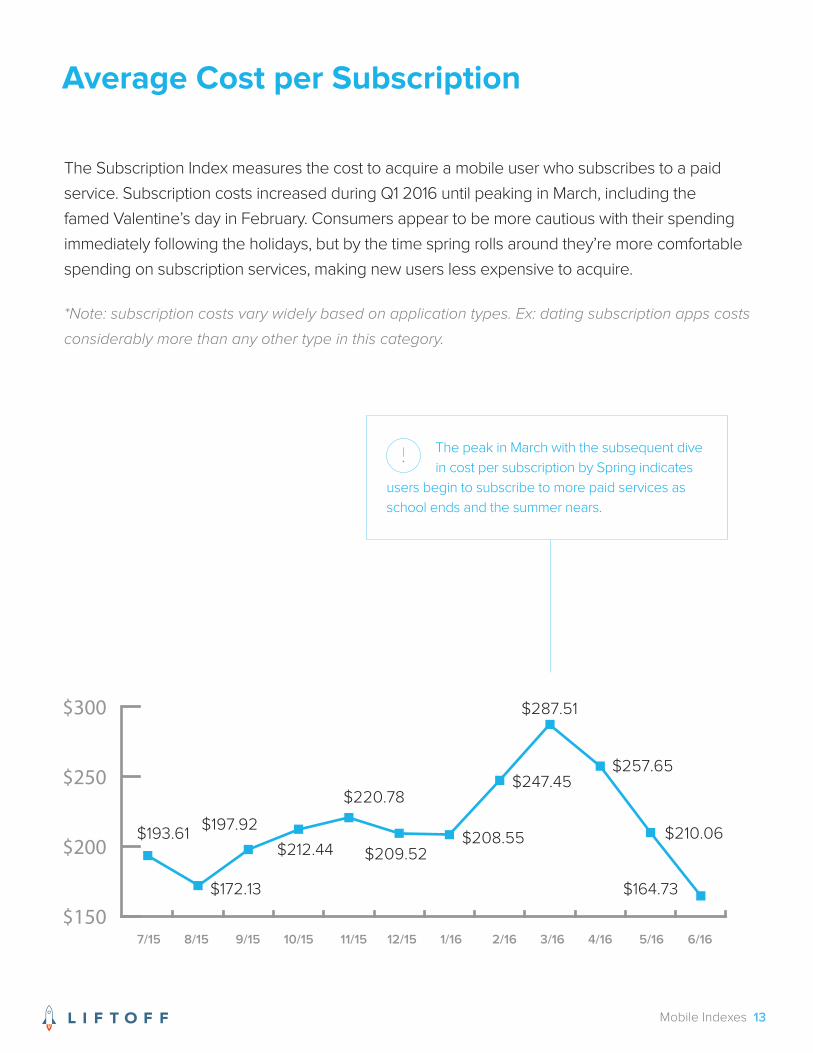
Average Cost per Subscription
The Subscription Index measures the cost to acquire a mobile user who subscribes to a paid
service. Subscription costs increased during Q1 2016 until peaking in March, including the
famed Valentine’s day in February. Consumers appear to be more cautious with their spending
immediately following the holidays, but by the time spring rolls around they’re more comfortable
spending on subscription services, making new users less expensive to acquire.
*Note: subscription costs vary widely based on application types. Ex: dating subscription apps costs
considerably more than any other type in this category.
The peak in March with the subsequent dive
in cost per subscription by Spring indicates
users begin to subscribe to more paid services as
school ends and the summer nears.
!
Mobile Indexes
7/15 8/15 9/15 10/15 11/15 12/15 1/16 2/16 3/16 4/16 5/16 6/16
$172.13
$193.61$197.92
$212.44
$220.78
$209.52$208.55
$247.45
$287.51
$257.65
$210.06
$164.73
$150
$200
$250
$300

14
$6.72 $11.57
$49.96$37.69
$60.80
$72.23
$226.31
$57.21
$231.20
$74.85- 42%
- 25%
- 16%
- 24%
- 2%
In the first half of 2016, we saw notable differences between the acquisition costs associated with iOS and Android users.
Android delivered lower CPAs for both
purchase events, while iOS came in
with lower CPAs for reservations and
subscriptions, however the gap between
subscriptions was quite narrow.
Paid subscriptions were only 2.2% more
expensive on Android than iOS, compared
to 11% more expensive in Q4 2015. The CPA
gap between platforms in purchase activity
has continued to widen - Android users
cost 16% less than iOS. One year ago, it was
iOS users who were 4% less expensive, but
Android closed the gap and has distanced
itself considerably.
iOS truly outperforms Android in reservations.
In 2016, acquiring a user who completed a
reservation cost $37.69 on iOS, 24.6% less
than on Android.
PURCHASEREGISTER RESERVE IN-APP PURCHASE
Engagement by Platform iOS vs. Android
Engagement by Platform
SUBSCRIPTION

15
iOS clearly outperforms Android with regards to post-install engagement activity.
iOS especially outperformed Android in
travel reservations, with 15.5% of users who
installed going on to make a reservation,
compared to 7% for Android. iOS also
soundly outperformed Android in both
purchase events and subscriptions.
Engagement by Platform iOS vs. Android
Engagement by Platform
50.7%
51.7%
15.5%
7.0%
8.1%
5.7%
7.8%
6.1%
2.6%
1.5%
POST-INSTALL ACTIVITY ENGAGEMENT RATES
Android users narrowly outperformed iOS
users in registrations, a non-transactional
event such as creating an account or user
profile within an app.
SUBSCRIPTION
PURCHASE
REGISTER
RESERVE
IN-APP
PURCHASE

16
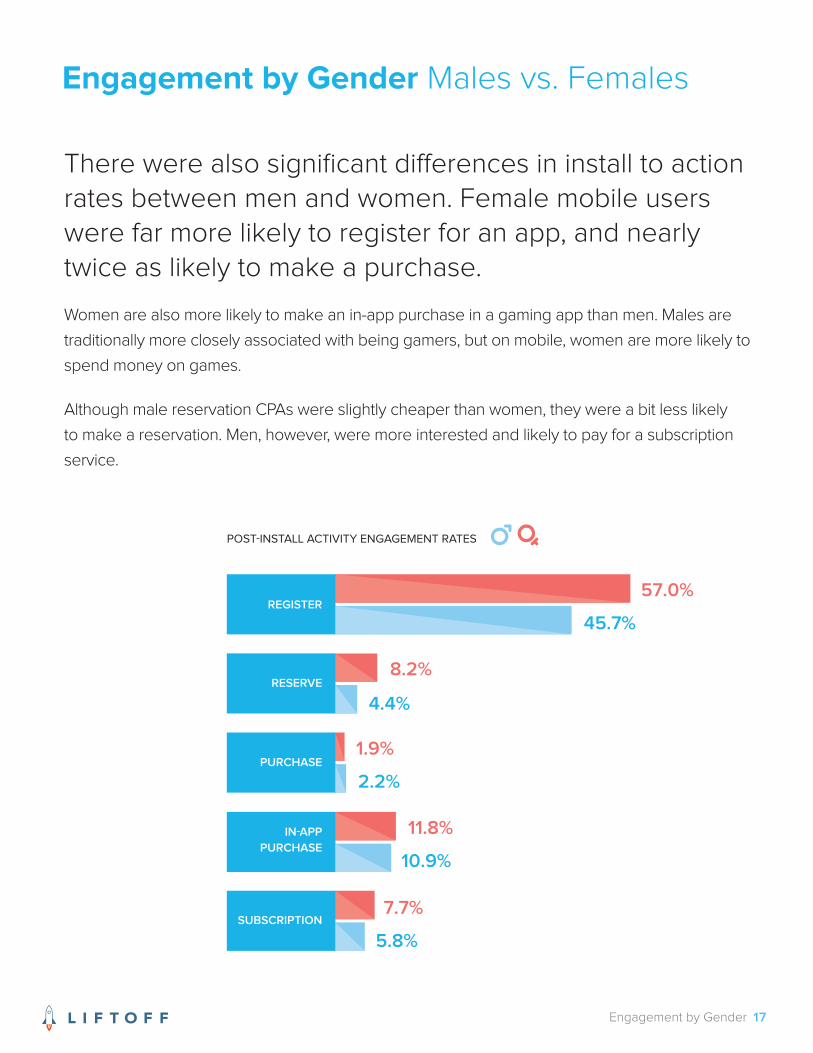
Engagement by Gender Males vs. Females
In 2016, we saw noteworthy differences
in mobile engagement CPAs by gender.
Consistent with prior index reports, the cost
per first purchase was substantially lower
for women, suggesting that men are still
far less inclined to buy on mobile devices.
Women also had lower gaming in-app
purchase CPAs, coming in at 13% less than
male gamers.
Female users who completed a purchase
cost 40% less to acquire than male users.!
Engagement by Gender
$8.17 $8.92
$39.68$56.58
$93.64
$213.34
$37.64
$61.29
$244.17
$70.50- 8%
- 5%
- 13%
- 13%- 40%
Men, as in previous reports, had lower
CPAs for subscription services than women.
The cost to acquire a male subscriber was
13% less than women, further widening the
gap compared to Q4 2015. The cost per
reservation was also less expensive for
men, by the slim margin of 5%.
SUBSCRIPTIONPURCHASEREGISTER RESERVE IN-APP PURCHASE
17
57.0%
45.7%
8.2%
4.4%
1.9%
2.2%
11.8%
10.9%
7.7%
5.8%
Engagement by Gender Males vs. Females
There were also significant differences in install to action rates between men and women. Female mobile users were far more likely to register for an app, and nearly twice as likely to make a purchase.
Women are also more likely to make an in-app purchase in a gaming app than men. Males are
traditionally more closely associated with being gamers, but on mobile, women are more likely to
spend money on games.
Although male reservation CPAs were slightly cheaper than women, they were a bit less likely
to make a reservation. Men, however, were more interested and likely to pay for a subscription
service.
Engagement by Gender
POST-INSTALL ACTIVITY ENGAGEMENT RATES
SUBSCRIPTION
PURCHASE
REGISTER
RESERVE
IN-APP
PURCHASE

18
SHOPPING APP ENGAGEMENT FUNNEL BY GENDER
SHOPPING APP ENGAGEMENT FUNNEL
Engagement by Category Shopping
The install-to-purchase rate for shopping app users (e.g. retail apps, coupon apps, ticket
purchasing apps, etc.) was 3.7%. A year ago, the average install-to-purchase rate was
significantly lower, suggesting that mobile users have grown more comfortable buying
on mobile. This is backed up by recent reports finding that mobile accounted for 30% of
eCommerce sales in 2015, and by 2020 will account for 45% of all eCommerce sales,
according to Business Insider.
Engagement by Category
As in previous Index Reports, women led the way in transactional Shopping app
engagement. They were both more likely to install and make a purchase, and 42% less
expensive to acquire than men.
The average cost to acquire a
first time purchaser was $95.94,
a 54.5% decrease from Q2
2015, further suggesting that
consumers are open to using
mobile apps for their shopping.
INSTALL
REGISTER
PURCHASE
$3.58
$6.41
$95.94
Install-to-Register
Install-to-Purchase
55.8%
3.7%
Install-to-Register
Install-to-Purchase
52.3%
6.1%
$3.91
$6.28
$97.46
$3.42
$6.55
$56.58
INSTALL
REGISTER
PURCHASE
Install-to-Register
Install-to-Purchase
62.2%
4.0%
Men vs. Women

19
Engagement by Category Finance
In 2016, finance apps (eg. financial protection, investment assistance, credit score monitoring, etc.) paid $6.63 per install, the most of any app category analyzed.
Finance apps are defined as subscription
based products. The cost to acquire a
user who registered for an account was
$17.56, a slight increase over last year’s
mark of $16.16.
FINANCE APP ENGAGEMENT FUNNEL
FINANCE APP ENGAGEMENT FUNNEL BY GENDER
Engagement by Category 19
INSTALL
REGISTER
PURCHASE
$6.63
$17.56
$90.72
Install-to-Register
Install-to-Purchase
37.8%
7.3%
Install-to-Register
Install-to-Purchase
40.0%
4.7%
$5.72
$16.36
$44.98
$7.50
$18.76
$159.87
INSTALL
REGISTER
PURCHASE
Install-to-Register
Install-to-Purchase
35.0%
12.7%
Men vs. Women
The purchase CPA for finance apps was $90.72, an 8.6% increase over last year. There are
stark gender differences in the use of financial apps. Looking at install-to-purchase, it costs
255% less to purchase male users than females in this category.

20
Engagement by Category Gaming
Gaming app engagement is new to this
edition of the index report. In 2016, it cost
$65.90 to acquire a user who made an
in-app purchase (eg. extra lives, in-game
currency, etc.). There was a sizeable
difference in CPAs for Q1 and Q2. In Q2,
the cost to drive an in-app purchase
decreased 24%, indicating that mobile
users are more likely to spend on games
when it gets closer to summer.
The variety of game types, attracting different sexes, is a factor in the gender data provided.
Men were less likely to make in-app purchases and more expensive to acquire than women.
Female in-app purchase CPAs were 13% less than those for men. Contrary to popular belief,
men were more expensive to acquire than women regarding in-app purchases.
GAMING APP ENGAGEMENT FUNNEL
GAMING APP ENGAGEMENT FUNNEL BY GENDER
Engagement by Category 20
INSTALL
REGISTER
PURCHASE
$4.12
$9.35
$65.90
Install-to-Register
Install-to-Purchase
44.1%
6.3%
Install-to-Register
Install-to-Purchase
45.54%
6.7%
$4.15
$9.73
$70.50
$4.08
$8.96
$61.29
INSTALL
REGISTER
PURCHASE
Install-to-Register
Install-to-Purchase
42.7%
5.9%
Men vs. Women

21
Engagement by Category Travel
Travel apps (e.g. ride sharing, hotel and flight booking, etc.) saw a decrease in acquisition costs over the last year. The average reservation CPA in 2016 was $38.66, down 14.6% from this period in 2015.
Install to reservation rates have also
decreased since last year, from 12.9%
in Q2 2015 to 11.5% in 2016. It would not
be surprising if reservation rates rise in
the second half of the year, as Nielsen
recently reported that travel app usage
has increased by 40% in the last year,
making it the fastest growing mobile app
category.
When it comes to gender, men are slightly more engaged with travel apps than women. 12.9%
of men who install a travel app go on to make a reservation compared to 10.3% of women.
Reservation CPAs are close between genders with only a 5.4% difference.
TRAVEL APP ENGAGEMENT FUNNEL BY GENDER
TRAVEL APP ENGAGEMENT FUNNEL
Engagement by Category 21
INSTALL
REGISTER
PURCHASE
$4.46
$12.90
$38.66
Install-to-Register
Install-to-Purchase
34.6%
11.5%
Install-to-Register
Install-to-Reserve
33.2%
10.3%
$4.84
$13.48
$37.64
$4.08
$12.31
$39.68
INSTALL
REGISTER
RESERVE
Install-to-Register
Install-to-Reserve
35.9%
12.9%
Men vs. Women

22Engagement by Category 22
Engagement by Category Utility
Acquisition costs for utility apps (e.g. free calling apps, survey apps, weather apps, etc.) have
increased considerably in the last year. The cost to acquire a new user who makes a utility
app purchase was $52.48 in 2016, a 46% year-over-year increase. It must be noted that utility
apps is a wide-ranging category with many various uses and prices. The increase in purchase
CPAs is likely a reflection of the apps being marketed rather than a shift in user behavior.
At the same time, the install-to-purchase
rate decrease from 8.1% in Q2 2015 to
5.5% in 2016. Because utility apps have
wide-ranging uses and prices, the CPA
increase and engagement rate decrease
likely has more to do with the apps on
the market than a drastic change in user
behavior.
Utility app registration rates are the lowest of all app categories at 19.6%, but given that these
types of apps don’t typically require a registration to be useful, this is expected.
Men and women shared similar Utility app engagement costs and purchase rates. Female
users who made a purchase cost $50.89, compared to $54.08 for men. Women slightly
outperformed men in purchase rate at 5.7% compared to 5.4%.
UTILITY APP ENGAGEMENT FUNNEL BY GENDER
UTILITY APP ENGAGEMENT FUNNEL
INSTALL
REGISTER
PURCHASE
$2.91
$14.72
$52.48
Install-to-Register
Install-to-Purchase
19.8%
5.5%
Install-to-Register
Install-to-Purchase
23.6%
5.7%
$2.93
$17.20
$54.08
$2.89
$12.24
$50.89
INSTALL
REGISTER
PURCHASE
Install-to-Register
Install-to-Purchase
17.0%
5.4%
Men vs. Women

23
Conclusion
Most CPA benchmarks increased over the first half of 2016, but that will soon change. Our research has shown that Finance and Shopping apps typically perform well in the summer, so we expect engagement to increase in the second half of the year.
Gender differences will always be a factor in mobile app
engagement, but the effects have remained consistent over
time. Women are still more comfortable and willing to make
mobile shopping purchases, while men are more likely to
subscribe to mobile content or purchase financial services.
Operating systems also continue to influence user behavior.
In the past, Android users were less likely to take transaction
actions within apps, but this is changing. Android users who
make mobile purchases have become far less expensive
to acquire than iOS users, while the subscription CPA gap
is nearly closed. iOS users maintain higher install-to-action
rates, but if Android engagement continues to increase, the
revenue potential for mobile apps that spend on Android user
acquisition is massive.
Fueling Mobile Growth.
[email protected] @liftoffmobilewww.liftoff.io