lifetime analysis of the iter first wall under steady state … · · 2014-02-19lifetime analysis...
TRANSCRIPT
Page 1PFMC-13 - 9-13 May 2011 – Rosenheim – R. Mitteau
Lifetime analysis of the ITER first wall under steady state and off normal
loads
R. Mitteaua, M. Sugiharaa, R. Raffraya, S. Carpentier-Chouchanaa, H. Labidib, M. Merolaa, R. A. Pittsa, P.Stangebyc
aITER Organization, bAssystem France
cUniversity of Toronto Institute for Aerospace Studies

Page 2PFMC-13 - 9-13 May 2011 – Rosenheim – R. Mitteau
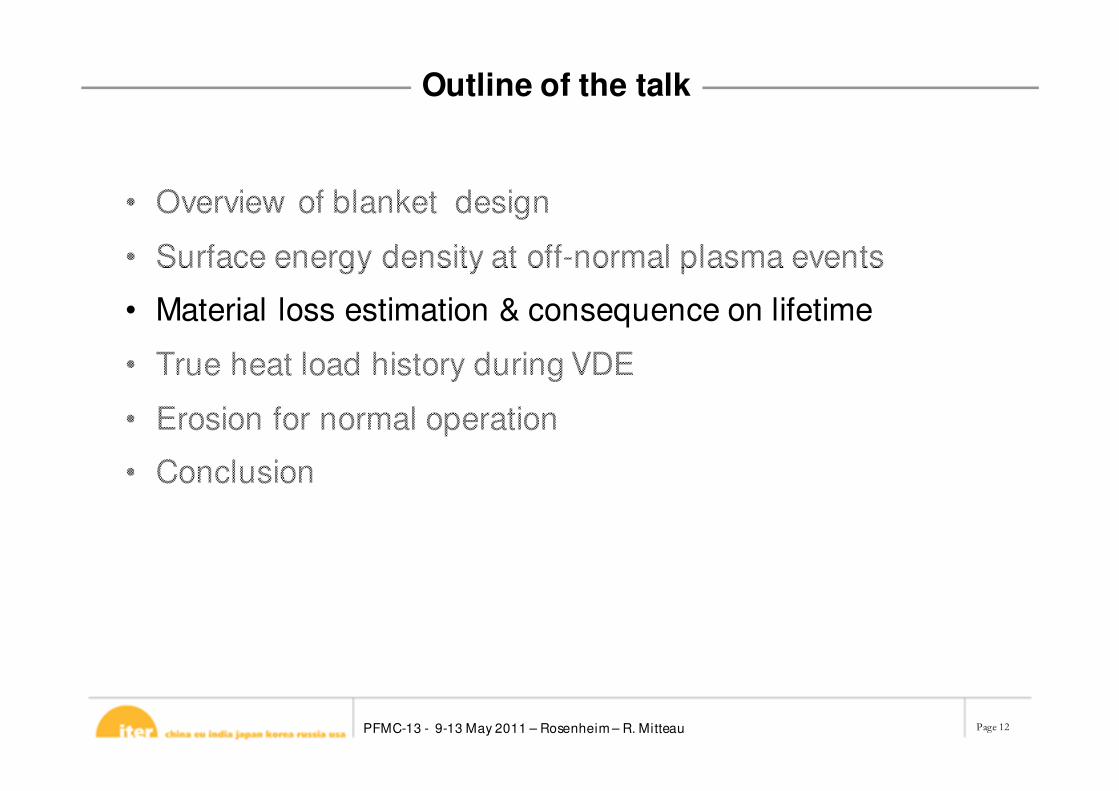
Outline of the talk
• Overview of blanket design
• Surface energy density at off-normal plasma events
• Material loss estimation & consequence on lifetime
• True heat load history during VDE
• Erosion for normal operation
• Conclusion

Page 3PFMC-13 - 9-13 May 2011 – Rosenheim – R. Mitteau
Context of blanket design evolution
• Following PCR-93, Thermal Load Specifications on PFCs, aHeat and nuclear load specification has been annexed to the
project requirement.- Plasma heat load to the main chamber first wall are described
The heat loads is oriented along field lines
• The PCR-77 (Shaped First Wall panels) was aimed at proposing a First Wall design that can accommodate these
loads, by shaping the FW panels.A shaped first wall accepts also direct limiter plasma contact at
lower power, hence problematic start-up limiters are
abandoned
• In parallel, PCR-76 (Improved FW remote handling), and the
inclusion of ELM control coil passing though the blanket shield modules have been a cause for significant redesign
of the blanket system
Concepts2007
PCR = Project Change Request

Page 4PFMC-13 - 9-13 May 2011 – Rosenheim – R. Mitteau
First wall design
Preloaded deep central Bolt
Pads reactingpreload and torques
FixingBoltaccess
Cantilevered fingersToroidal orientationPoloidal support beam
Water manifolds to shield blocks
ElectricalContact (Multilam)
Recess in panel center
Access to water connections
Remote handlinggripping holes
1 m
Recessed edges
Status as of March 2011

Page 5PFMC-13 - 9-13 May 2011 – Rosenheim – R. Mitteau
Start-up:q|| ~ 25 MWm-2, λλλλq|| ~ 5.0 cmSeveral seconds
Confinement transients
q|| ~ 250 MWm-2, ~2-3 secs
Start-up and rampdown:q|| ~ 40 MWm-2,λλλλq|| > 1.2 cmSeveral seconds
VDE (up):q|| ~ 70-270 MJm-2, λq|| > 3.0 cmt = 1.5-3.0 ms
VDE (down):
q|| ~ 90-300 MJm-2, λq|| > 3.0 cm
Steady state:q|| ~ 8 MWm-2, λλλλq|| > 4.0 cmq|| ~ 24 MWm-2, λλλλq|| > 2.5 cm (ELMs)
Disruptionsq|| ~ 45-120 MJm-2, λq|| > 20 cm
t = 3.0-6.0 ms
Radiation:SS: 0.35 MWm-2
(photon+CX)
DisruptionsTQ: ~0.5 MJm-2
t ~ 1 ms
(mitigated)CQ: ~0.9 MJm-2
t ~ 10 ms
Distribution of FW panel design heat load

Page 6PFMC-13 - 9-13 May 2011 – Rosenheim – R. Mitteau
Top
Inboard
Outboard
BM #1-6Central columnHFS start-upToroidal & poloidal shaping
BM #7-10Secondary divertor regionToroidal & poloidal shaping
BM #11-18OutboardLFS start-up/ramp-downToroidal shaping
See R. Mitteau, poster P1-57, Monday
A generic shaping solution

Page 7PFMC-13 - 9-13 May 2011 – Rosenheim – R. Mitteau
Design Heat load
• Group 1 : 1 – 2 MW/m²Normal heat flux panels
• Group 2 : 3.5 – 5 MW/m²
Enhanced heat flux panels
Outboard flat top heat load (550 MW)
Heat flux distribution on FW panel 8 during 15 MA inductive flat top, including penalties
Equilibrium : li=0.7, PF6 Option 3
(limiter type contact),
∆sep = 40 mm qo// = 33 MW/m2
ToroidalPoloidal

Page 8PFMC-13 - 9-13 May 2011 – Rosenheim – R. Mitteau
Normal heat flux finger:concept with Steel Cooling Pipes
Enhanced heat flux finger: concept with rectangular channels
PFC technologies
Copper alloy heat sink
Hot isostatic pressing

Page 9PFMC-13 - 9-13 May 2011 – Rosenheim – R. Mitteau
Outline of the talk
• Overview of blanket design
• Surface energy density for off-normal plasma events
• Material loss estimation & consequence on lifetime
• True heat load history during VDE
• Erosion for normal operation
• Conclusion

Page 10PFMC-13 - 9-13 May 2011 – Rosenheim – R. Mitteau
Surface energy density of row 17 panel at thermal quench
Surface energy density (MJ/m²)
Row 16
Row 17
Row 18
0.5 mx
0.2 m
OW Midplane
Down ward VDE

Page 11PFMC-13 - 9-13 May 2011 – Rosenheim – R. Mitteau
Off normal events and associated energy density
• Disruption Thermal Quench (TQ))
– 10 MJ/m² (top panels)
– For ∆t = 3 ms ⇒ incident heat flux is 3 GW/m²
– For ∆t = 9 ms ⇒ heat flux is 1 GW/m²
– If DMS is successful, heat flux is divided by 10, duration unchanged
– 1500 disruptions, 150 unmitigated, 1350 mitigated
• VDE
– 22 MJ/m² at TQ (upper and lower IW/OW)
– Hot plasma contact to wall during pre-TQ phase
– 40 MW/m², 0.3 s
– For ∆t = 1.5 ms ⇒ heat flux is 14 GW/m²
– If DMS is successful, TQ heat flux is divided by 10, duration unchanged
– 150 VDEs, 15 with DMS failure, 135 with DMS success
• Uncontrolled ELMs
– 2 MJ/m² - 0.375 ms
– 10 GW/m²
• Loss of plasma control (ex. H-L transition)
– 40 MW/m² - 3 s
Beyond design basis events
DMS = Disruption Mitigation System
Page 12PFMC-13 - 9-13 May 2011 – Rosenheim – R. Mitteau
Outline of the talk
• Overview of blanket design
• Surface energy density at off-normal plasma events
• Material loss estimation & consequence on lifetime
• True heat load history during VDE
• Erosion for normal operation
• Conclusion

Page 13PFMC-13 - 9-13 May 2011 – Rosenheim – R. Mitteau
Time behavior
HTC = 40000 W/m²K
q(t)
8 mm
5 mm
1287 C1287 C
UnmitigatedVDE

Page 14PFMC-13 - 9-13 May 2011 – Rosenheim – R. Mitteau
Material loss estimation
• High estimate : melt layer remains in place
Loss = 0.42 mm ⇒ 19 events for 8 mm Be15 unmitigated VDEs over 15000 discharges (1/1000) ⇒ Lifetime is 19000 discharges
• Lower estimate : melt layer is lost
Loss = 0.86 + 0.42 mm = 1.28 mm⇒ 6 events for 8 mm Be ⇒ Lifetime is 6250 discharges
0.86 mm0.42 mm
Melt layer Evaporated thickness
Lifetime is calculated assuming constant frequency of VDEs throughout ITER operational life
UnmitigatedVDE

Page 15PFMC-13 - 9-13 May 2011 – Rosenheim – R. Mitteau
Material loss & associated lifetime

Page 16PFMC-13 - 9-13 May 2011 – Rosenheim – R. Mitteau
Outline of the talk
• Overview of blanket design
• Surface energy density at off-normal plasma events
• Material loss estimation & consequence on lifetime
• True heat load history during VDE
• Erosion for normal operation
• Conclusion

Page 17PFMC-13 - 9-13 May 2011 – Rosenheim – R. Mitteau
Heat Load History During VDE
21 MJ/m²
Thermal quench
• True definition of power flux to the wall
• Step by step calculation
• 34 time slices

Page 18PFMC-13 - 9-13 May 2011 – Rosenheim – R. Mitteau
Movie

Page 19PFMC-13 - 9-13 May 2011 – Rosenheim – R. Mitteau
Material loss for true heat load time sequence
• Partial combination of heat load instead of full combination
• Update lifetime estimate is 8163 to
30,303 discharges
• An improvement of 30/60 % of the calculated lifetime
21 MJ/m²14 MJ/m²
Melt layer
Evaporated thickness

Page 20PFMC-13 - 9-13 May 2011 – Rosenheim – R. Mitteau
Outline of the talk
• Overview of blanket design
• Surface energy density at off-normal plasma events
• Material loss estimation & consequence on lifetime
• Full time history during VDE
• Erosion for normal operation
• Conclusion

Page 21PFMC-13 - 9-13 May 2011 – Rosenheim – R. Mitteau
Beryllium armor erosion during normal operation (1/2)
� Negligible contribution of CX (CX fluxes << ions fluxes) and ELMs (represents only 3.5% of the steady-state duration)
� Primary / Total erosion ~90% � BM wear mainly due to primary sputtering� Peak net erosion rate > 70% of peak gross erosion
� concern for PFC lifetime� Absorbers � influence the local redeposition
“Modeling of beryllium erosion–redeposition on ITER FW panels” S. Carpentier, R.A. Pitts et al.,
J. Nucl. Mater., in press.

Page 22PFMC-13 - 9-13 May 2011 – Rosenheim – R. Mitteau
Armor erosion during normal operation (2/2)
half-shape module
wetted area
• <Yeff> ~ 7%, ~50% particles locally redeposited
• Net peak erosion ~ 0.06 mm/h � PFC lifetime ~ 1500 shots
High density case
• <Yeff> ~ 6%, ~10% particles locally redeposited
• Net peak erosion ~0.0025 mm/h � PFC lifetime ~ 36,000 shots
Low density case

Page 23PFMC-13 - 9-13 May 2011 – Rosenheim – R. Mitteau
Factors with beneficial / detrimental influence on lifetime
• Beneficial
– Power flux to surface before off normal event is less than design heat flux
– Time waveform is triangular, not rectangular
– Melt layer incidents are spread over a certain area, so partial addition
– Progressive plasma power increase are careful approach toward operation
• Detrimental
– Combination of material loss events(normal erosion + VDE/disruptions)

Page 24PFMC-13 - 9-13 May 2011 – Rosenheim – R. Mitteau
Conclusion
• Beryllium armor loss estimates end up with large range of values.
• This is true for both normal operation erosion as well as beryllium loss
during off – normal events
• FW panel lifetime estimates are roughly consistent with the range of
erosion/damage due to the expected thermal loading.
• Meeting expected lifetime will necessitate careful plasma operation and
progressive achievement of the scientific program.
• Good example of the experimental nature of the ITER project
• Current first wall design makes best use of current available technologies
/ design capabilities. The design is progressing toward a timely start of
experiments by 2019.