life cycle assessment of a hybrid biobased panel for
TRANSCRIPT

Life Cycle Assessment of a Hybrid Biobased Panel for Insulated
Concrete Forms Used in Residential Buildings
by
Daniel Francisco Gonzalez Morales
A thesis
presented to the University of Waterloo
in fulfilment of the
thesis requirement for the degree of
Master of Environmental Studies
in
Sustainability Management
Waterloo, Ontario, Canada, 2021
© Daniel Francisco Gonzalez Morales 2021

ii
Author’s Declaration I hereby declare that I am the sole author of this thesis. This is a true copy of the thesis, including any
required final revisions, as accepted by my examiners.
I understand that my thesis may be made electronically available to the public.

iii
Abstract
Buildings are a large contributor to climate change, as they require large amounts of fossil energy to maintain indoor comfort for occupants, either as heating in cold climates or cooling in warmer climates. Insulation materials (IMs) prevent heat transfer and provide energy savings, while achieving comfortable indoor environments. In the last couple of decades, there has been a considerable number of life cycle studies on petrochemical, mineral, biobased or hybrid IMs, to determine their environmental impacts and assess their contribution to life cycle impacts of buildings. These studies show a range of impacts associated with the manufacture and use of these IMs due to activities associated with the production of raw materials and aggregates utilized to create the final product. Dematerialization and circular economy principles are being applied in the design of building materials in an attempt to reduce their impacts. However, each novel hybrid IM needs to be assessed holistically to determine its sustainability. For example, using by-products as raw material might reduce the environmental burdens of IMs, while encouraging efforts towards preserve biodiversity, ecosystems protection and human welfare.
The aim of this research was to evaluate and compare the environmental performance of a new hybrid material produced from biobased residues and by-products, and industrial by-products. Specifically, the analyses consider the use of a biobased (CSB) panel of corn stover, fish waste binder, and cement kiln dust (CKD), to replace conventional extruded polystyrene (XPS) panels in insulated concrete form (ICF) wall systems. The environmental impact assessment was performed using an ISO-compliant Life Cycle Assessment (LCA) methodology and considering system boundaries from cradle-to-wall gate and using a functional unit of one square metre of wall, which was structurally equivalent and had an insulation value of RSI=1 (m2K/W). The impact assessment methodology used was TRACI 2.1.
The CSB panel had lower impacts on a mass basis than the XPS panel; however, the CSB-based wall system had higher impacts in most impact categories than the XPS wall system due to the higher mass of CSB panel required to meet the functional unit. Specifically, the global warming potential was 65.7 KgCO2eq for the CSB wall compared to 49.4 kgCO2eq for the XPS wall. The impacts of the CSB panel were driven by the corn stover production, specifically the energy required to collect the stover, and the use of CKD, because cement production is known for its high impacts. Although the CBS panels were made from residues and by-products, their impacts are higher. Therefore, research is needed to understand how to reduce these impacts, including replacing the CKD, and exploring the use of the CSB panels in other building applications, such as drywall replacement in indoor walls, where insulation is not needed and mechanical strength does not have to be as high.
KEY WORDS: life cycle assessment, carbon footprint, insulated concrete forms, hybrid materials, insulation materials, biobased, extruded polystyrene
iv
Acknowledgments The path of this process has been challenging and full of teachings along this journey. Since I start my
research, I have received constant support, specifically when I most needed to accomplish this special
goal successfully. For this reason, I would like to thank everyone who supported and advised me in this
path.
Firstly, I would like to deeply thank my supervisor Goretty Dias for her encouragement, guidance and
support in each of the stages of this research. Thanks to her experience, knowledge, and patience, it was
possible to move forward and reflect the main objective of this study, not to mention that her
commitment inspired me to continue working throughout my thesis.
I also would like to thank Professor Wood of the Environmental Faculty and Dr. Baaj, director of the
centre for pavement and transportation technology and professor of civil and environmental engineering
at the University of Waterloo, for their expertise to complement and validate my research. Their insights
and comments have contributed to enrich the results and conclusions of this thesis.
I am also grateful with Ryan Thompson, PhD student at the School of Environment, Enterprise and
Development of the University of Waterloo for helping me to better reflect my ideas and communicate
specific concepts with valuable comments throughout my thesis development. My great thanks also go to
all my friends and fellows I meet during this journey, your support and accompaniment made this process
more pleasant and less complicated.
Last but not least, I would like to highlight my absolute gratitude and infinite love to my parents and
sister for their understanding and support from the very first start to the end. Thank you very much for
always been there regardless the moment, situation or day. I know you enjoy this achievement as much
as I do.
v
AUTHOR’S DECLARATION .............................................................................................................. II
ABSTRACT ..................................................................................................................................... III
ACKNOWLEDGMENTS .................................................................................................................. IV
LIST OF FIGURES ......................................................................................................................... VIII
LIST OF TABLES ............................................................................................................................. IX
LIST OF ABBREVIATIONS ............................................................................................................... XI
CHAPTER 1 INTRODUCTION .......................................................................................................... 1
Context: Ontario potential for bio-based building products ....................................................................... 2
The life cycle assessment methodology ..................................................................................................... 5
Study objective and rationale .................................................................................................................... 6
Research Questions and Contributions ...................................................................................................... 7
Thesis Structure ........................................................................................................................................ 7
CHAPTER 2 LITERATURE REVIEW .................................................................................................. 8
Introduction .............................................................................................................................................. 8
Impacts related to life cycle stages of buildings ......................................................................................... 9
Comparing Insulating Materials using Life Cycle Assessment ................................................................... 11
Environmental Impacts Associated with Insulation Materials .................................................................. 12
Impacts Associated with Conventional Insulation Materials .................................................................... 13 2.5.1 Petrochemical Insulation Materials ......................................................................................................... 13

vi
2.5.2 Mineral Insulation Materials .................................................................................................................... 17
Environmental Impacts Associated with Hybrid Insulation Materials ....................................................... 20 2.6.1 Hybrid Petrochemical Insulation Materials .............................................................................................. 20 2.6.2 Hybrid Mineral Insulation Materials ........................................................................................................ 23
Impacts Associated with Pure Biobased Insulation Materials .................................................................. 26 2.7.1 Natural and hybrid woody Insulation Materials ...................................................................................... 26 2.7.2 Pure Natural Insulation Materials ............................................................................................................ 27
Summary of IM Impacts and Research Gaps ............................................................................................ 28
CHAPTER 3 -METHODS ................................................................................................................ 32
Goal of the Study .................................................................................................................................... 32
Function, Functional Unit, and Reference Flows ...................................................................................... 32
Product System Descriptions ................................................................................................................... 33 3.3.1 Biobased Insulated Concrete Forms (BICF) .............................................................................................. 33 3.3.2 Conventional Insulated Concrete Forms System (ICF) ............................................................................. 35
System Boundary .................................................................................................................................... 36
Cut-off-Criteria ........................................................................................................................................ 37
Co-product Treatment ............................................................................................................................. 37
Impact Assessment Methods ................................................................................................................... 38
Life Cycle Inventory ................................................................................................................................. 40 3.8.1 Corn stover collection .............................................................................................................................. 40 3.8.2 Fish binder production ............................................................................................................................. 41 3.8.3 Cement Kiln Dust ..................................................................................................................................... 43 3.8.4 CSB panel ................................................................................................................................................. 43
CHAPTER 4 -RESULTS ................................................................................................................... 44
Environmental impact comparison of the wall Systems ........................................................................... 44

vii
Contribution Analysis of BICF system ....................................................................................................... 46 4.2.1 Contribution analysis of the CSB panel .................................................................................................... 46 4.2.2 Sensitive analysis ..................................................................................................................................... 48
CHAPTER 5 DISCUSSION .............................................................................................................. 50
Comparison of Wall Systems and Hotspots for CSB .................................................................................. 50
Comparison of CSB to other Insulating Materials ..................................................................................... 51
Study limitations ..................................................................................................................................... 52
Conclusions ............................................................................................................................................. 53
REFERENCES ................................................................................................................................ 54
APPENDIX A: RAW DATA FOR FISH BINDER PRODUCTION ......................................................... 63
viii
List of Figures Figure 1-1. Current division of the biomaterial industry by sector. Adapted from Aung Oo et al. (2016)
..................................................................................................................................................................... 3
Figure 2-1. Categorization of insulation materials adapted from Schiavoni et al. (2016) ...................... 9
Figure 2-2 Life Cycle Assessment phases of building materials; adapted from Caruso et al. (2018) .... 10
Figure 2-3 Number of studies reporting where hotspots of GWP and CED occur for all types of IMs,
based on all 42 studies from literature review. ......................................................................................... 11
Figure 2-4 Comparative GWP of IMs reviewed in this literature based on a functional unit of 1 m2 wall
with an RSI of 1. ......................................................................................................................................... 30
Figure 2-5 Comparative CED of IMs reviewed in this literature based on a functional unit of 1 m2 wall
with an RSI of 1. ......................................................................................................................................... 31
Figure 3-1 Layout of CSB (a) and Polystyrene Insulated Concrete Forms (b) ....................................... 35
Figure 3-2 System boundaries and unit processes applied for the is cradle-to- ‘wall installation’ gate
of the CSB panels. ...................................................................................................................................... 36
Figure 3-3System boundaries and unit processes applied for the is cradle-to- ‘wall installation’ gate of
the XPS panels. .......................................................................................................................................... 37
Figure 4-1 Comparison of ICF and BICF systems. The results are relative to the product with the highest
impact for each indicator and impact for 1 m2 of the ICF and the BICF .................................................... 45
Figure 4-2 Cumulative energy demand (CED) for BICF and ICF. Positive values of percent difference
indicate that BICF impacts are higher ........................................................................................................ 45
Figure 4-3Contribution analysis of producing 1kg f the BICF system comprising process and activities
from cradle-to-manufacturing gate. Numbers in the table indicate the percentage of the total impact
associated with each stage. ....................................................................................................................... 47
Figure 4-4 . Sensitive analysis relative indicator impact results correlated to the production of 1 m2 of
the BICF (system A), ICF (reference system) and BIFC (system B) ............................................................. 49

ix
List of Tables Table 2-1. GWP values for different insulation materials. .................................................................... 12
Table 2-2 Summary of GWP and CED reported for PIMs and associated wall systems. Data are reported
from lowest to highest RSIs associated with each IM. ............................................................................... 15
Table 2-3 Summary review of GWP and CED associated with mineral IMs (MIMs) and their respective
wall system. Data are reported from lowest to highest RSIs associated with each IM. ........................... 19
Table 2-4 Summary review of GWP and CED associated with advance IMs ......................................... 20
Table 2-5 GWP and CED values for HPIMs ............................................................................................ 22
Table 2-6 Summary review of GWP and CED associated with MIMs. Data are reported from lowest to
highest RSIs associated with each IM. ....................................................................................................... 25
Table 2-7 Summary review of GWP and CED associated with WIMs. Data are reported from lowest to
highest RSIs associated with each IM. ....................................................................................................... 26
Table 2-8 Summary review of GWP and CED associated with PNIMs. Data are reported from lowest to
highest RSIs associated with each IM. ....................................................................................................... 27
Table 3-1Characteristic properties of the BICF wall system. ................................................................ 33
Table 3-2 Nitrogen, phosphorus, and potassium fertilizer considered for replacing the nutrient value of
the stover removed (200 kg) ..................................................................................................................... 38
Table 3-3. Brief description of the TRACI V2.1 (Tool for the reduction and assessment of chemical and
other environmental impacts) impact assessment method and environmental impact categories. ........ 39
Table 3-4 .LCI for corn stover production and collection. FU for this process is 1000 kg of CS collected.
................................................................................................................................................................... 40
Table 3-5 LCI for the production of salmon fillets and salmon waste coproduct. The FU for the unit
process is 1 kg of salmon fillet. .................................................................................................................. 42
Table 3-6 LCI to produce 1 kg of the fish binder ................................................................................... 42
Table 3-7. Life cycle inventory for the production of 1 kg of the CSB panel. Percent composition of panel
materials do not add up to 100% due to rounding .................................................................................... 43

x
Table 4-1Life cycle stage impact contribution of producing the BICF and ICF systems based on FU.
Positive values of percent difference indicate that BICF impacts are higher ............................................ 44
Table 4-2 Contribution analysis from cradle-to-manufacturing gate to produce 1 kg of the CSB panel in
Ontario, Canada. Bold numbers indicate the highest contribution to each impact category. .................. 48
Table 4-3 CED for making 1 kg of the CSB panel. .................................................................................. 48
Table 5-1 Estimated Kg CO2eq/kg and MJ/kg reference values of different building materials ........... 51

xi
List of Abbreviations CC Coffee Chaff
CED Cumulative Energy Demand
ETICS External Thermal Insulated System
FG Fiberglass
FHL Formulated Hydraulic Binder
GWP Global Warming Potential
ICB Expanded Cork
ICF Rice Husk
IIC Internal Insulated Facade
KFR Kenaf Fiber Reinforcement
LFC Light Foamed Concrete
MHIMs Mineral Hybrid Insulation Materials
MIMs Mineral Insulation Materials
MOC Magnesium Oxychloride Cement
MPa Megapascal Unit
MPC Magnesium Phosphate Cement
NIMs Natural Insulation Materials
NRCan Natural Resources Canada
PHIMs Petrochemical Hybrid Insulation Materials
PIMs Petrochemical Insulation Materials
PUR Polyurethane Rigid Foam
R-PET Recycled polyethylene terephthalate
RSI R-value System International (R-value in metric units) Thermal Resistance (m2 K/W)
RW Rockwool
SIP Structural Insulated Panel
SW1 Standard wall composition 1
SW2 Standard wall composition 2
U value Thermal Transmittance (W/m2K)
VFs Ventilated Facades
WIMs Woody Insulation Materials
WP Wastepaper

1
Chapter 1 Introduction In recent decades, developers of building materials have continuously explored potential new
technologies and life cycle assessment methods to integrate sustainable management building practices
at different physical structure scales based on circular economy (CE) principles. The development of new
building materials could play a vital role in lowering the environmental impacts of commercial and
residential building projects if these materials are designed to reduce the vast amounts of virgin material
extraction, solid waste production, greenhouse gas emissions, and energy consumption of buildings
across their entire life cycle.
At present, despite advances in materials and product development, there are still rising
environmental impacts, representing significant challenges for the protection of ecosystems. For instance,
the construction industry consumes 40% of the world’s resources (Khan et al., 2018). In Canada, the
industry produces more than 50% of total municipal solid waste, including high amounts of wood, asphalt,
drywall, concrete, and masonry debris in landfills (Yeheyis et al., 2013). Furthermore, according to the
United Nations Environment Programme (UNEP, 2013), the building sector consumes up to 40% of the
total global energy use and is responsible for 19% of the energy-related greenhouse gas (GHG) emissions
(IPCC, 2014). Subsequently, different sustainable strategies based on CE principles and cradle to cradle
(C2C) models have been proposed to confront the environmental impacts and challenges associated with
building construction practices (Futas et al., 2019), and the use and extraction of non-renewable
materials, intensive fossil energy consumption and waste creation along buildings' life cycle stages
(Asdrubali et al., 2015).
In order to apply these strategies based on CE and cradle-to-cradle (C2C) models, the inclusion of
different natural fibres and polymers extracted from renewable sources have been proposed as viable
alternatives to conventional construction materials and for the development of new bio composite
materials (Peñaloza et al., 2016). For example, the inclusion of more fast-growing, biobased materials
(such as crop fibers) would decrease the carbon footprint of buildings due to carbon sequestration on
farms (Pittau et al., 2018). Such sustainable building practices could address and reduce the severity of
the impacts that conventional building materials have on climate change, global warming and the
depletion of natural resources; additionally, it would allow for repurposing materials that have already
been manufactured or produced, and potentially enable a paradigm shift of reusing or recycling of
materials instead of disposing of them (Sieffert et al., 2014), by efficiently utilizing local and renewable
resources and energies, while minimizing waste and pollution (Neyestani, 2017). Hence based on these

2
advantages, the development of biobased building materials could play a crucial role in reducing impacts
on human and ecosystems health due to their physical properties and their capabilities to capture other
by-products as raw materials.
Accordingly, the United Nations (UN) Sustainable Development Goals (SDGs) indicate the importance
of developing strategies and practices based on energy and waste reduction, and sustainable
industrialization towards the achievement of sustainable cities. In particular, SDGs 9 and 11 focus on rapid
urbanization challenges, such as the safe removal and management of solid waste, and the use of local
materials within cities; likewise, there are environmental objectives related to resource and energy
efficiency with respect to the reduction of GHG emissions. The future of sustainable construction will
therefore depend on how the construction industry, together with its products and the ‘built
environment’, among many sectors of the economy and human activity, can work to reduce the impacts
of the manufacturing, construction, operation, and disposal phases of building materials on human and
environmental health (Kibert, 2007). However, research is needed for specific materials and contexts to
ensure that these benefits are realized, and any negative impacts are managed.
Context: Ontario potential for bio-based building products
According to Natural Resources Canada (NRCan, 2020), biobased products are made from
renewable biological resources as well as on the commerce of non-timber forest products, based in an
economy that includes a broad range of commodities intended for markets such as energy,
transportation, chemicals, plastics, foods, pharmaceuticals, and nutraceuticals. In the construction
industry, biobased products play a critical role in saving resources and minimizing the use of existing
energy on alternative sustainable solutions for agricultural or recycled waste construction materials
(Wang et al., 2018). Therefore, identifying local opportunities for supplying or procuring available
renewable, biological and industrial waste resources could promote alternative technologies of biobased
building products during the next decades.
A good example of this is Ontario, which has abundant sources of biological and construction by-
products that are attracting investment from bio-product firms seeking to include new materials based
on circular economy business models. In particular, Ontario's agricultural sector can meet the increasing
demand from the biomaterial industry with an estimated annual biomass supply of roughly 6 million tons
of crop residues, which are currently used in five categories of biomaterials from the available biomass
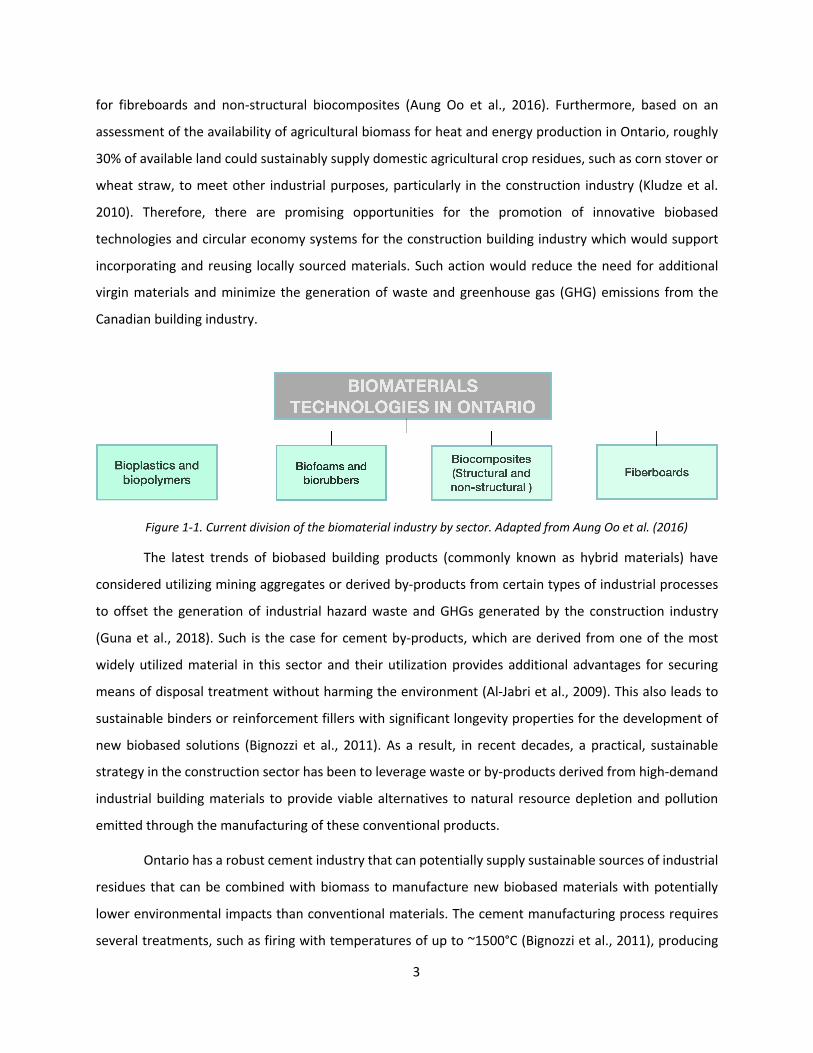
feedstock in Ontario (Figure 1-1), which are being used predominantly by the building sector, with markets
3
for fibreboards and non-structural biocomposites (Aung Oo et al., 2016). Furthermore, based on an
assessment of the availability of agricultural biomass for heat and energy production in Ontario, roughly
30% of available land could sustainably supply domestic agricultural crop residues, such as corn stover or
wheat straw, to meet other industrial purposes, particularly in the construction industry (Kludze et al.
2010). Therefore, there are promising opportunities for the promotion of innovative biobased
technologies and circular economy systems for the construction building industry which would support
incorporating and reusing locally sourced materials. Such action would reduce the need for additional
virgin materials and minimize the generation of waste and greenhouse gas (GHG) emissions from the
Canadian building industry.
Figure 1-1. Current division of the biomaterial industry by sector. Adapted from Aung Oo et al. (2016)
The latest trends of biobased building products (commonly known as hybrid materials) have
considered utilizing mining aggregates or derived by-products from certain types of industrial processes
to offset the generation of industrial hazard waste and GHGs generated by the construction industry
(Guna et al., 2018). Such is the case for cement by-products, which are derived from one of the most
widely utilized material in this sector and their utilization provides additional advantages for securing
means of disposal treatment without harming the environment (Al-Jabri et al., 2009). This also leads to
sustainable binders or reinforcement fillers with significant longevity properties for the development of
new biobased solutions (Bignozzi et al., 2011). As a result, in recent decades, a practical, sustainable
strategy in the construction sector has been to leverage waste or by-products derived from high-demand
industrial building materials to provide viable alternatives to natural resource depletion and pollution
emitted through the manufacturing of these conventional products.
Ontario has a robust cement industry that can potentially supply sustainable sources of industrial
residues that can be combined with biomass to manufacture new biobased materials with potentially
lower environmental impacts than conventional materials. The cement manufacturing process requires
several treatments, such as firing with temperatures of up to ~1500°C (Bignozzi et al., 2011), producing
4
large amounts of secondary raw materials, such as fly ash, silica fume, blast furnace slag, or cement kiln
dust (CKD; a potentially harmful by-product for the environment) as the result of raw materials being
heated in the clinkerization process (Al-Jabri, 2009). According to the Canadian Cement Association,
primary cement production is concentrated in Ontario (50 percent) and Quebec (17 percent), accounting
for more than 65 percent of the industry's national capacity and producing more than 14.3 million tonnes
(t) per year. Therefore, these concentrated sources of cement production could be a major source of by-
products that might enhance the efficiency and effectiveness of industrial waste utilization.
In the particular case of certain types of by-products derived from cement production, such as
CKD, there are several reasons to develop useful technologies based on reusing and reduction practices.
CKD is a hazardous waste product that, according to the EPA (2018) can cause respiratory, skin or eye
health problems. Based on the average rate of CKD production (0.15 tons per 1 ton of cement), there is
a potential to capture 0.06 t CO2eq through the manufacturing of this by-product (Huntzinger et al., 2009),
based on the growth of cement production (by 200% between 2003 and 2015 according to the European
Commission) (Directorate General for Internal Market, Industry, Entrepreneurship and SMEs et al., 2018).
The development of new biobased technologies to stabilize waste and offset GHGs derived from cement
manufacturing processes are crucial to minimizing impacts on human health and ecosystems.
The latest biobased product developments have used cement or synthetic polymers as the matrix
or reinforcement filler (adhesive agent) in their compounds; however, several other fillers or additives can
be used to partially replace conventional adhesives (e.g. cement, lime, or synthetic polymer resins) to
make hybrid materials partially degradable (Guna et al., 2018). There is also the potential to use biobased
adhesives, such as those derived from fish collagen (in this study referred to as fish binders), which can
be used for industrial uses (Stevens et al., 2018), and at the same time sustainably managing the
downstream stage of fish products processing. However, similar to other materials, it is important to
determine whether there are sufficient fish by-products for the desired use, given that they may already
be in use in other products.
Regarding potential new building materials, several key sustainability principles must be
considered to alleviate the environmental burdens the construction industry generates. Specifically,
biobased material solutions should integrate sustainable building practices based on circular economy
(CE) systems, and incorporate and reuse locally sourced materials, such as renewable agricultural
materials and industrial waste, to boost the viability of sustainable construction. Moreover, new product
developments must integrate efforts to minimize the environmental impacts of products from the

5
extraction, manufacturing, construction, operation, to disposal phases, each of which contribute
significantly to global warming and the depletion of natural resources. Subsequently, to understand how
a new building product can positively or negatively affect the environment along its entire life cycle, the
life cycle assessment (LCA) methodology has been developed to identify, quantify, and compare its
environmental impacts. A summary of this methodology and its relevance for developing new building
materials are presented below.
The life cycle assessment methodology
To understand a product's performance in environmental terms during its entire life cycle, the life
cycle assessment (LCA) methodology was established to measure the wide range of environmental
impacts for the provision of goods or services (Rebitzer et al., 2004). This methodology is outlined in the
International Standards Organisation (ISO) 14040 and 14044 standards (2006) and has been
internationally recognized to quantify and compare the environmental impacts of new materials,
assemblies or buildings, and to develop informed choices about which material is preferred for a
predetermined purpose based on the assessment results (Vamsi & SivaRaja, 2014).
According to ISO 14040, the most extensive LCA studies engage systems boundaries from cradle-
to-grave, that is, from raw material extraction through product use and disposal. Conversely, several
studies limit systems boundaries, as for example, from raw material extraction to factory gate commonly
known as cradle-to-gate, or, alternatively, from one determined point to a second determined point along
the life cycle (e.g., when the manufacturing of a product begins to be delivered to an end-user) known as
gate-to gate. The selection of boundaries of a given system can vary depending on the LCA research
objective and the specific product to provide a deep understanding of the environmental impacts of the
raw materials extractions, the manufacturing of products or of finished products along different stages of
their entire life cycle.
The environmental impacts (EI) of each stage along the life cycle of products are determined by
the inputs and outputs in terms of how strongly they affect the environment (Rebitzer et al., 2004). The
inputs can be categorized as being energy (e.g., electricity) or materials (e.g. fuels, ores, fertilizers, and
water), while the outputs are intermediate products, co-products, waste, and emissions to air, land, or
water (Matthews et al., 2013). For LCA of buildings, it is important to consider the location, uses, available
resources, techniques of construction, materials, overall cost, and national standards of minimum
performance (Caruso et al., 2018).

6
At present, different life cycle impact assessment (LCIA) methods have been developed over the
past twenty years to decrease the difficulty of decision-making due to the high number of parameters
resulting from a large set of environmental indicators (Lasvaux et al., 2016). Subsequently, depending also
on the study and material use/purpose several authors have complemented their LCA results with
different supportive quantification methods and modeling softwares, such as the LCCA-e (Echarri-
Iribarren et al., 2019); Building information modeling (BIM) (Ansah et al., 2020); LCA & energy-plus
(Torres-Rivas et al., 2018) to obtain more comprehensive evaluations of the life cycle impacts of buildings.
There are also useful databases, specifically GaBi and Ecoinvent, which facilitate LCA studies due to their
ease of use and dedicated resources which typically include and integrate a large number of construction
material categories (Martínez-Rocamora 2016). In essence, the LCA methodology has been supported
with additional methods to compare the EI of conventional or innovative products and to support
decision-making, depending on the desired targets of each study.
On the whole, the life cycle assessment methodology is a very useful tool to help researchers,
engineers, architects or designers evaluate and compare the environmental impacts of
materials/products during their entire life cycle. The LCA approach is a reliable methodology to support
decision-making by professionals and researchers and can be used to identify environmental and resource
issues, and improve a specific product, assembly, technology or building throughout its life cycle.
Study objective and rationale
Innovative solutions are needed for reducing impacts of the construction sector. This study
considers replacing conventional materials in insulated concrete form (ICF) wall systems with biobased
materials. Biobased construction materials could minimize the intensive use of energy, the extraction of
non-renewable virgin materials, greenhouse gas emissions (GHG), and solid waste generation, and result
in better integration of sustainable management building practices based on circular economy (CE)
systems However, there is variability in the environmental impacts of wall and insulation systems
throughout their lifespans, depending on the type of materials used and geographical locations.
Therefore, this research aims to conduct a comparative Life Cycle Assessment from cradle to installation
gate (C2G) of a biobased wall system made with corn stover biobased panels ((CSB) composed of corn
stover, cement kiln dust, and fish binder), and extruded polystyrene (XPS) panels in insulated concrete
form wall systems (ICF).
7
In this sense, the main objective of this study is to determine and verify if the CSB panels work as
a sustainable replacement for, or alternative to, XPS panels on insulated concrete form (ICF) wall systems.
At present, polystyrene panels have been among the most frequently used building products to contain
concrete, along with wood, steel, aluminum, and other approved products. For this reason, this research
hopes to contribute a deeper understanding of the potential environmental and sustainable advantages
or disadvantages of materials that use locally-sourced agricultural residues and waste materials.
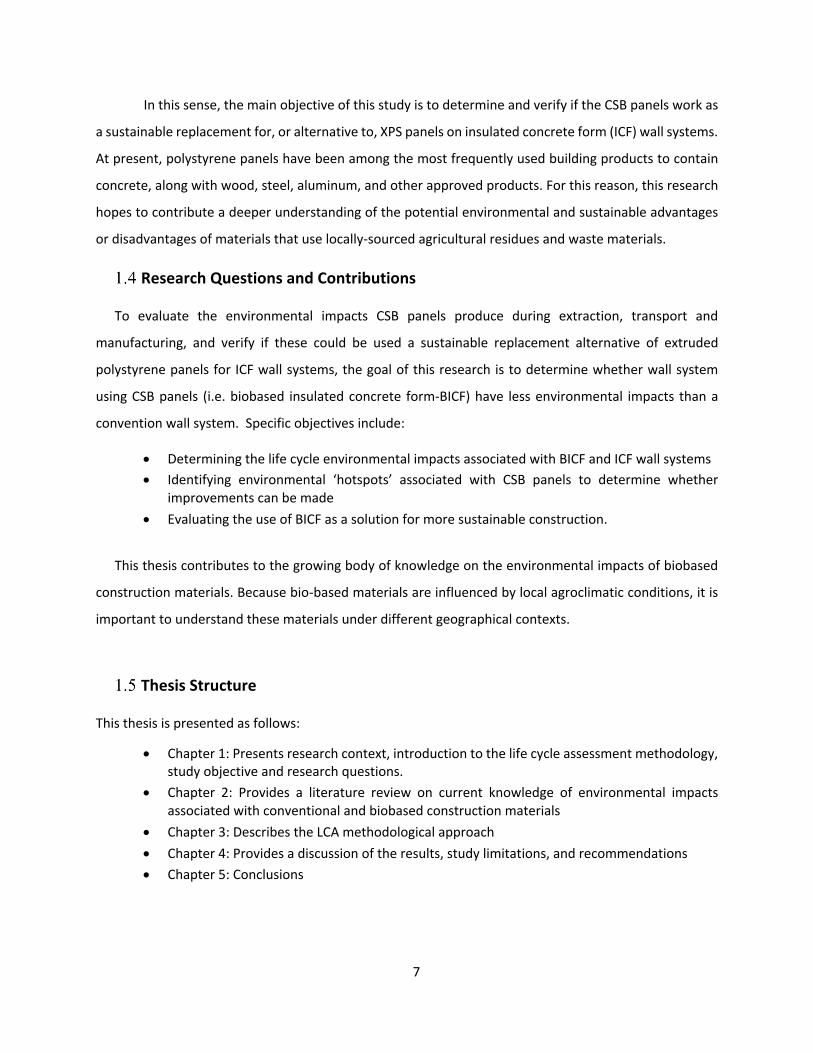
Research Questions and Contributions
To evaluate the environmental impacts CSB panels produce during extraction, transport and
manufacturing, and verify if these could be used a sustainable replacement alternative of extruded
polystyrene panels for ICF wall systems, the goal of this research is to determine whether wall system
using CSB panels (i.e. biobased insulated concrete form-BICF) have less environmental impacts than a
convention wall system. Specific objectives include:
• Determining the life cycle environmental impacts associated with BICF and ICF wall systems • Identifying environmental ‘hotspots’ associated with CSB panels to determine whether
improvements can be made • Evaluating the use of BICF as a solution for more sustainable construction.
This thesis contributes to the growing body of knowledge on the environmental impacts of biobased
construction materials. Because bio-based materials are influenced by local agroclimatic conditions, it is
important to understand these materials under different geographical contexts.
Thesis Structure
This thesis is presented as follows:
• Chapter 1: Presents research context, introduction to the life cycle assessment methodology, study objective and research questions.
• Chapter 2: Provides a literature review on current knowledge of environmental impacts associated with conventional and biobased construction materials
• Chapter 3: Describes the LCA methodological approach • Chapter 4: Provides a discussion of the results, study limitations, and recommendations • Chapter 5: Conclusions

8
Chapter 2 Literature Review The literature review first provides a general overview of building materials. It then synthesizes the
literature on the environmental impacts of petroleum, mineral, and biobased construction materials for
insulation and structural purposes.
Introduction
There is a range of insulation materials (IM) currently used in the building industry that can be classified
into four main categories (Figure 2-1).These include conventional IM (often derived from minerals or
petrochemical sources), hybrid IM (obtained from mixtures of mineral or petrochemical aggregates and
plant fibers or sheep wool), pure biobased IM (composed only from biobased sources), and advanced IM
(developed by manufacturers and researchers to achieve extremely low values of thermal conductivity,
and with considerable weight and thickness reductions). According to a survey on "World Green Building
Trends” (Dodge Data Analytic, 2016), biobased IMs represent only 5% of the building insulation market,
while petrochemical and mineral IM make up 55% and 40%, respectively. This prevailing market share is
historical, since petrochemical and mineral insulation materials remain among the most inexpensive
insulation materials with relatively good thermal efficiency. However, due to the variety of IMs and the
progress made towards low- or near-zero energy buildings (Peuportier et al., 2013), measures to regulate
and decrease environmental impacts along the entire life cycle of buildings have now become a priority
(Pargana et al., 2014) to stimulate a sustainability transition that requires ambitious carbon neutral and
energy efficiency goals for the residential and commercial building industry.
Therefore, to understand how IMs contribute to the life cycle environmental impact of buildings,
this literature review, which covers 42 LCAs of IMs, synthesizes research on the environmental impacts of
a wide range of IMs (Figure 2-1) and identifies challenges to reducing impacts. Furthermore, an overview
is provided on which part of the life cycle contributes to the biggest impacts, as well as the effect of key
characteristics of the material, such as RSIs (a measure of the thermal resistance of the materials). Finally,
gaps in methodological and material science are explored in terms of improving the understanding of
environmental and technical performance of IMs.

9
Figure 2-1. Categorization of insulation materials adapted from Schiavoni et al. (2016)
Impacts related to life cycle stages of buildings
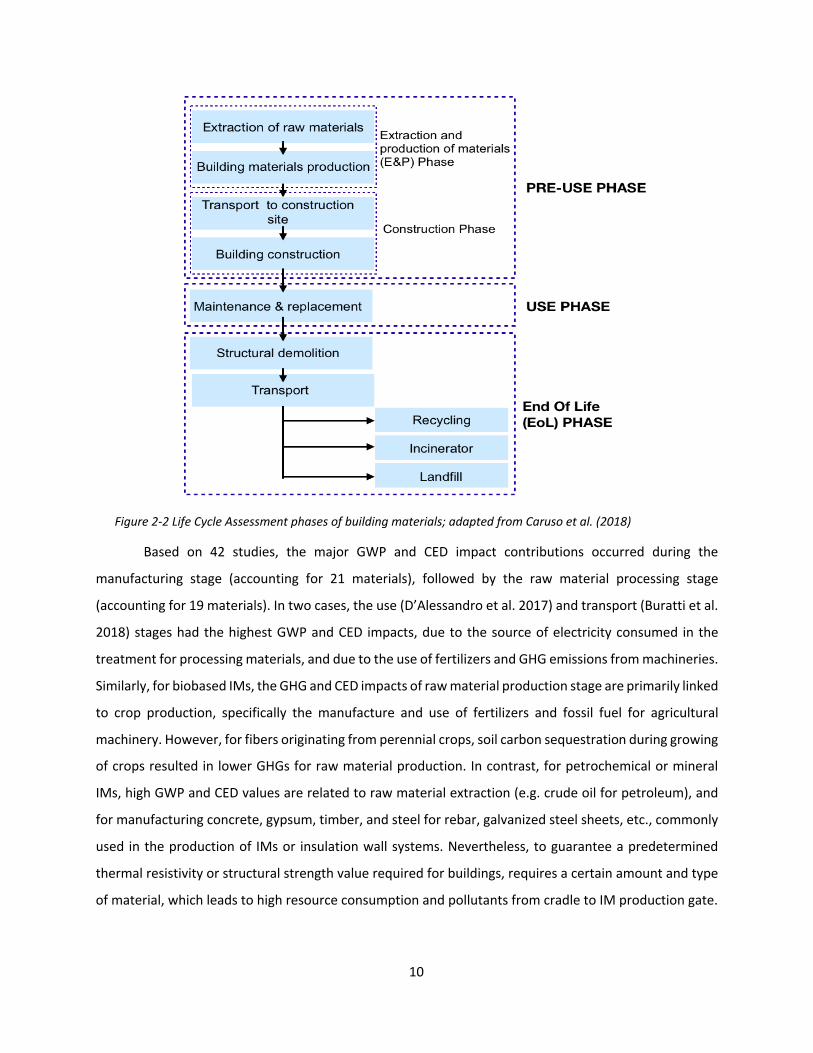
The life cycle stages of buildings can be classified into three main phases (Figure 2-2): 1) the pre-
use phase (extraction, production of materials, and construction-related activities); 2) the use phase
(operation, maintenance and replacement of structural and insulation elements); and 3) the End-of-Life
(EoL) phase (building demolition, and material disposal-related activities (Caruso et al., 2018)). Among
these phases, a considerable amount of energy use is strongly associated with the use or building
operation stage. For example, during the winters in Canada, roughly 60% of a building’s total life cycle
energy consumption is related to a building’s heating needs (NRCan, 2016). In contrast, when buildings
require little energy during operation, the main energy use is associated with building materials,
specifically for manufacturing and EOL phases (Uniben et al., 2014), and can account for 20 to 50% of the
total life cycle energy, commonly known as embodied energy (Ramesh et al., 2010). This energy use is
associated with many different types of impacts, as it is mostly from fossil fuel sources.
10
Figure 2-2 Life Cycle Assessment phases of building materials; adapted from Caruso et al. (2018)
Based on 42 studies, the major GWP and CED impact contributions occurred during the
manufacturing stage (accounting for 21 materials), followed by the raw material processing stage
(accounting for 19 materials). In two cases, the use (D’Alessandro et al. 2017) and transport (Buratti et al.
2018) stages had the highest GWP and CED impacts, due to the source of electricity consumed in the
treatment for processing materials, and due to the use of fertilizers and GHG emissions from machineries.
Similarly, for biobased IMs, the GHG and CED impacts of raw material production stage are primarily linked
to crop production, specifically the manufacture and use of fertilizers and fossil fuel for agricultural
machinery. However, for fibers originating from perennial crops, soil carbon sequestration during growing
of crops resulted in lower GHGs for raw material production. In contrast, for petrochemical or mineral
IMs, high GWP and CED values are related to raw material extraction (e.g. crude oil for petroleum), and
for manufacturing concrete, gypsum, timber, and steel for rebar, galvanized steel sheets, etc., commonly
used in the production of IMs or insulation wall systems. Nevertheless, to guarantee a predetermined
thermal resistivity or structural strength value required for buildings, requires a certain amount and type
of material, which leads to high resource consumption and pollutants from cradle to IM production gate.

11
Figure 2-3 Number of studies reporting where hotspots of GWP and CED occur for all types of IMs, based on all 42 studies from literature review.
Comparing Insulating Materials using Life Cycle Assessment
In life cycle assessment (LCA), it is important to determine the main function of the product
system, so that a functional unit (FU) can be identified. The FU is a quantitative description of the product
or service performance (Rebitzer et al., 2004), and is the basis for the environmental analysis and
comparison between different goods in all of their life cycle stages (Matthews, Hendrickson & Matthews,
2015). Ambient temperature is one of the most critical factors for determining human comfort according
to the European Parliament and the Council on the Energy Performance of Buildings (EPBDr 2010).
Therefore, the main function of insulating materials is to retard heat flow, thereby reducing the degree of
discomfort experienced by the building occupants, and the consumption of energy required to heat or
cool a building (Sfakianaki et al., 2011). The unit commonly used to define the thermal resistance of
materials is R (m2K/W), which is a heat property and a measurement of the temperature difference by
which between materials resist heat flow (Sierra-Pérez et al., 2016)
There are key parameters or characteristics of the product system which need to be considered
in defining the FU, as well as the reference flows. When the function of a product results in an abstract
FU (e.g., for hand drying systems, a FU could be two dried hands), a reference flow is needed, refers to
the amount of product flows for each system or product under assessment which is required to meet the
function and FU (e.g. two paper towels, electricity consumed by air dryers). Consequently, an appropriate
FU that has been commonly used in several LCAs is an area of 1 m2, which is linked to key parameters such

12
as thermal resistance or conductivity indicators (RSI, or its inverse, the U value, respectively) (Sinka et al.
2018; Zhou et al. 2018), or structural support (in pressure units0. To meet a specific RSI for a wall with an
area of one meter will require different amounts of materials (i.e., reference flows) depending on the
structure of the wall.
The key parameters are based on the IMs thermal properties, which will affect the thickness required
to meet a specified RSI, and therefore the amount of material needed. Pargana et al. (2014) defined a
mass-based FU by using the relationship of FU=RλrA, where λ represents the thermal conductivity
measured as W/ (m2 K), r is the insulation product's density in kg/m3, and A as the wall area (1 m2). This
provides the mass of IM required to meet a thermal resistance (R) of 1 (m2K/W). However, other studies
use a range of methods to define the FU and the reference flows. Since each study uses different LCA
methodological choices, including FUs, and each wall system is different depending on location and
conditions, it is challenging to compare the environmental performance of different categories of IMs.
Nevertheless, the remainder of the literature review attempts to identify what is the current state of
knowledge on the environmental performance of IMs.
Environmental Impacts Associated with Insulation Materials
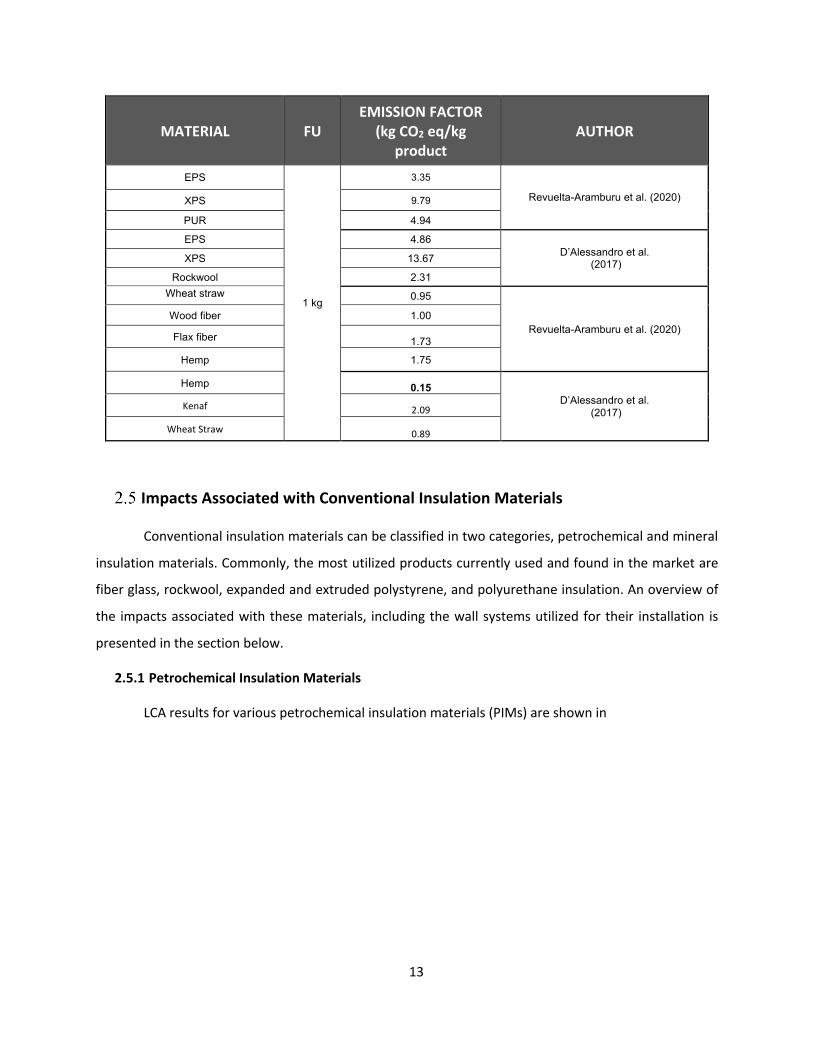
Pure Biobased Insulation Materials (PNIMs), such as wheat straw, cork, or hemp, have low GWP
values on a mass basis, ranging from 0.15 to 2.09 kg CO2eq per 1 kg of material (Table 2-1), from a cradle-
to-gate perspective. This is lower than for petroleum-based IMs, which have GWPs of 3.35 to 13.67 LCAs
kg CO2eq per 1 kg of material, and even rockwool which has a GWP of 2.31 kg CO2eq per 1 kg of material.
In contrast, mineral-based LCAs of thermal insulation materials have shown that when these materials
have low thermal conductivity (U=W/(m K), it is possible to achieve relatively thin building envelopes with
a high thermal resistance RSI (Jelle, 2011) and thereby, reduce building operational energy consumption,
which represents 60 to 80% of total life cycle buildings energy consumption (Sáez de Guinoa et al., 2017).
However, the impacts per 1 m2 may be different for these materials due to different amounts of materials
required to achieve the required RSI. Therefore, to understand the environmental implications and
performance (using a FU of 1 m2 and considering thermal properties) an analysis in GWP and CED terms
of IMs produced from different material origins is presented and described in the following sections.
Table 2-1. GWP values for different insulation materials.
13
MATERIAL FU EMISSION FACTOR
(kg CO2 eq/kg product
AUTHOR
EPS
1 kg
3.35
Revuelta-Aramburu et al. (2020) XPS 9.79
PUR 4.94
EPS 4.86 D’Alessandro et al.
(2017) XPS 13.67
Rockwool 2.31
Wheat straw 0.95
Revuelta-Aramburu et al. (2020)
Wood fiber 1.00
Flax fiber 1.73
Hemp 1.75
Hemp 0.15 D’Alessandro et al.
(2017) Kenaf 2.09
Wheat Straw 0.89
Impacts Associated with Conventional Insulation Materials
Conventional insulation materials can be classified in two categories, petrochemical and mineral
insulation materials. Commonly, the most utilized products currently used and found in the market are
fiber glass, rockwool, expanded and extruded polystyrene, and polyurethane insulation. An overview of
the impacts associated with these materials, including the wall systems utilized for their installation is
presented in the section below.
2.5.1 Petrochemical Insulation Materials
LCA results for various petrochemical insulation materials (PIMs) are shown in

14
Table 2-2. In this literature review, PIMs include EPS (expanded polystyrene), XPS (extruded
polystyrene), PUR (polyurethane), and ELT (end-life granulated tires). Although there are a range of FUs
and wall systems reported, some generalizations can be made. When considering the studies with RSI of
1, EPS and PUR have the lowest GWP (3.25 and 3.33 kg CO2eq/kg IM, respectively), followed by XPS (7.08)
and ELT, which presents the highest GWP (11.6). CED values follow the same trends as GWP and range
from 74 to 235 MJ. As RSIs increase, the impact contribution of GWP and CED also increases due to the
requirement for more insulation material, but the relationship between increasing RSI and impacts is not
linear.

15
Table 2-2 Summary of GWP and CED reported for PIMs and associated wall systems. Data are reported from lowest to highest RSIs associated with each IM.
IM MATERIALS FU RSI
(m2 K/w)
Total IM GWP (GHG)
contribution kg CO2eq
Total IM CED (MJ) INSTALATION SYSTEM USED
Total system GWP
contribution kg CO2eq
Total SYSTEM CED (MJ)
Author
Petrochemical IM
XPS
1 m2
1 7.08 104 N/A Pargana et al. (2014)
3.7
8.00 200 External Thermal Insulation Composite
Systems (ETICS) (1 m2) 55 700
Sierra-Perez et al. (2016) 7.70 200 Ventilated façade (VF) (1 m2) 60 1,150
8.50 220 Internal Insulated Façade 55 850
EPS
1 3.25 73.8 N/A Pargana et al. (2014)
1.55 N/A N/A Full-scale wall prototype (Useful area = of
6.60m × 4.40 m; height of 2.50 m) 10,000 91,400
Revuelta-Aramburu et al. (2020)
2.65 N/A N/A Structural insulated panel (SIP) (195.10 m2) N/A 199,000 Lu et al. (2019)
3.7
13 350 External Thermal Insulation Composite
Systems (ETICS) (1 m2) 63 850
Sierra-Perez et al. (2016) 13 340 Ventilated façade (VF) (1m2) 65 1,250
14 380 Internal Insulated Façade (1m2) 61 1,000
3.92 N/A
N/A
Structural insulated panel 2 (SIP) (195.10
m2) N/A 222,000 Lu et al. (2019)
6.25 N/A N/A Full-scale wall prototype with a useful area of
6.60 × 4.40 m2 and a height of 2.50 m 104,000 149,000
Revuelta-Aramburu et al. (2020)
27 N/A N/A Standard” wall compositions "1" (SW1) (1
m2) 126 1,820
Ingrao et al. (2016) 27.7 N/A N/A Ventilated façade (VF) (R-PET) (1 m2) 110 1,410
30 N/A N/A Standard” wall compositions "2" (SW2) (1
m2) 132 1,870
PUR
1 3.33 86.2 N/A Pargana et al. (2014)
3.7
10 230
External Thermal Insulation Composite
Systems (ETICS) (1 m2) 58 740
Sierra-Perez et al. (2016) 9.7 230 1m2 of Ventilated façade (VF) 61 1100
11 250 1m2 of Internal Insulated Façade 57 850
Granulated rubber ELT
1 11.6 235 N/A Burrati et al. (2018)
EPS
1kg
Not specified
3.35
N/A N/A Revuelta-Aramburu et al. (2020) XPS 9.79
PUR 4.94
EPS 1
4.86 114 N/A D’Alessandro et al. (2017) XPS 13.67 107

16
Depending on the composition of the wall system, the impacts also vary; however, it is difficult to make
comparisons between wall systems reported in the literature, due to the various wall sizes and different
RSIs used, based on local building regulations (Table 2-2). For example, Revuelta-Aramburu et al. (2020)
evaluated a full-scale wall prototype based on a wall with an area of 6.60 m × 4.40 m and a thickness/depth
of 6 cm, using different amounts of extruded polystyrene to achieve RSIs of 1.55 and 6.25, and found
cradle-to-installation gate GWP of 10,000 and 104,000 kg CO2eq/FU, respectively and 91,000 and 149,000
MJ/FU, respectively (Table 2-2). They also note that 60 and 68 % of the total impact for both categories’
contribution were attributed to system elements other than IM, such as perforated ceramic brick, and an
inner sheet of hollow brick in both systems. Ingrao et al. (2016) compared two EPS boards with different
densities (15 and 35 kg/m3) embedded in two standard wall compositions (SW1 and SW2), and one
recycled Polyethylene Terephthalate (R-PET) installed in a ventilated façade (VF), composed of external
cladding, ceramic blocks and inner cladding (Sierra-Pérez et al., 2016) with RSIs ranging from 27 to 30
(m2K)/W) (

17
Table 2-2). Overall, the VF using the R-PET insulation generates lower impacts than the SW1 and SW2
with EPS, due to an uncomplicated disassembly-recycle-reuse design. The impacts were lower by 13% and
17% for GWP and 23% and 24% for CED when compared to the SW1 and SW2 systems, respectively.
However, this study did not report the impact contribution of only the IM.
2.5.2 Mineral Insulation Materials
Mineral insulation materials (MIMs) are produced from several kinds of rocks or natural sources,
including diabase, ballast, dolostone, natural sand or silica, and in some cases, are coupled with extra
additives or membranes to produce panels, batts, rolls or felts (Schiavoni et al., 2016). Previous LCA
studies on these materials are summarized in Table 2-3. None of the studies used the same RSI, so for the
sake of comparison, a linear relationship was assumed between GWP and CED impacts and RSIs as a first
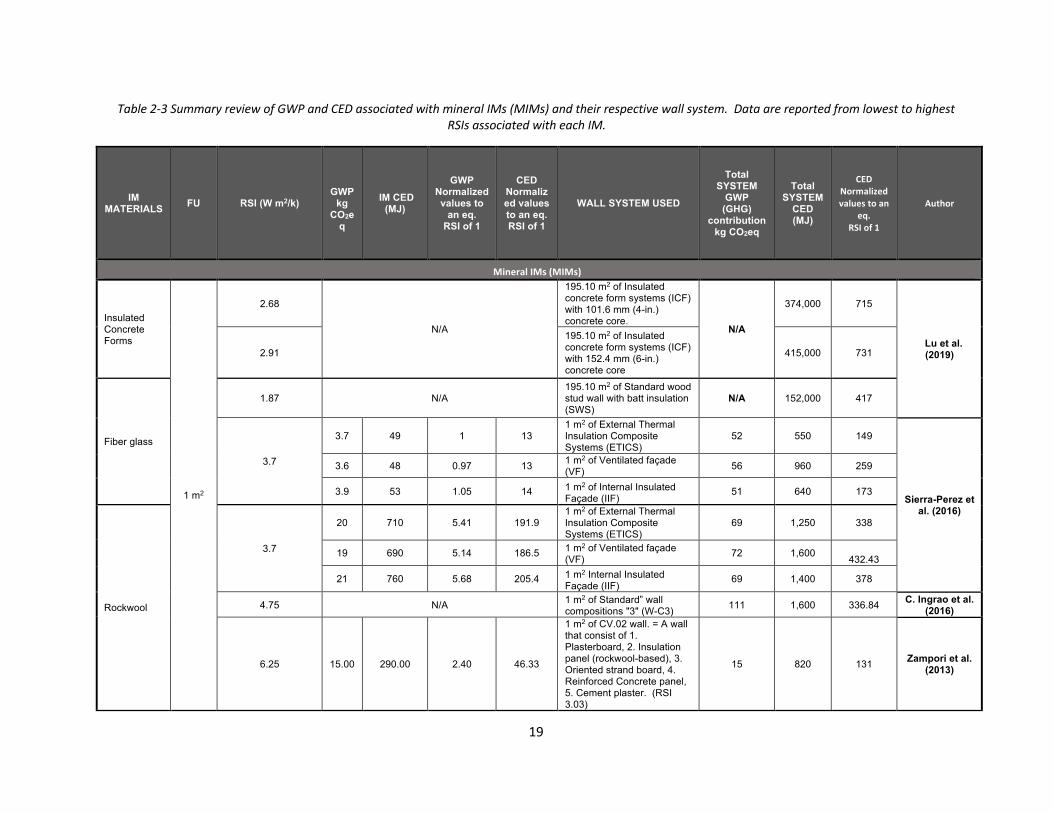
approximation. Based on this, the MIM with the highest impact is rock wool (GWP= 2.40-5.68 kg
CO2eq/FU; CED= 46.33-205.4 MJ/FU ). Zampori et al. found a lower GWP in their rockwool LCA, even with
a higher RSI (R=6.25) than Sierra- Perez et al. (R=3.7). This is likely due to the type of energy used in the
production of the material, which represented the Italian energy mix. Fiberglass had lower GWPs (GWP,
CED). Based on these studies, the environmental impacts of MIMs are comparable to those of PIMs, with
the exception of end-life granulated rubber (Table 2-3).
When considering the impacts of complete wall systems, as in the case of PIMs, the environmental
impacts also differ considerably due to the additional materials used. For example, Sierra-Perez et al.
(2016) found that the GWP and CED contribution for wall systems were correlated with other elements
that composed the systems, such as cladding, frames, or ceramic blocks, which accounted for almost ~70%
of the total impact for these categories relative to the RW. This is similar to the findings for wall systems
using PIMs. Similarly, the GWP and CED contribution of RW-based wall systems considered by Ingrao et
al. (2016) were much higher compared to those found in the Zampori et al. (2013) study, due to the
thickness and the mass of extra elements required for this system.
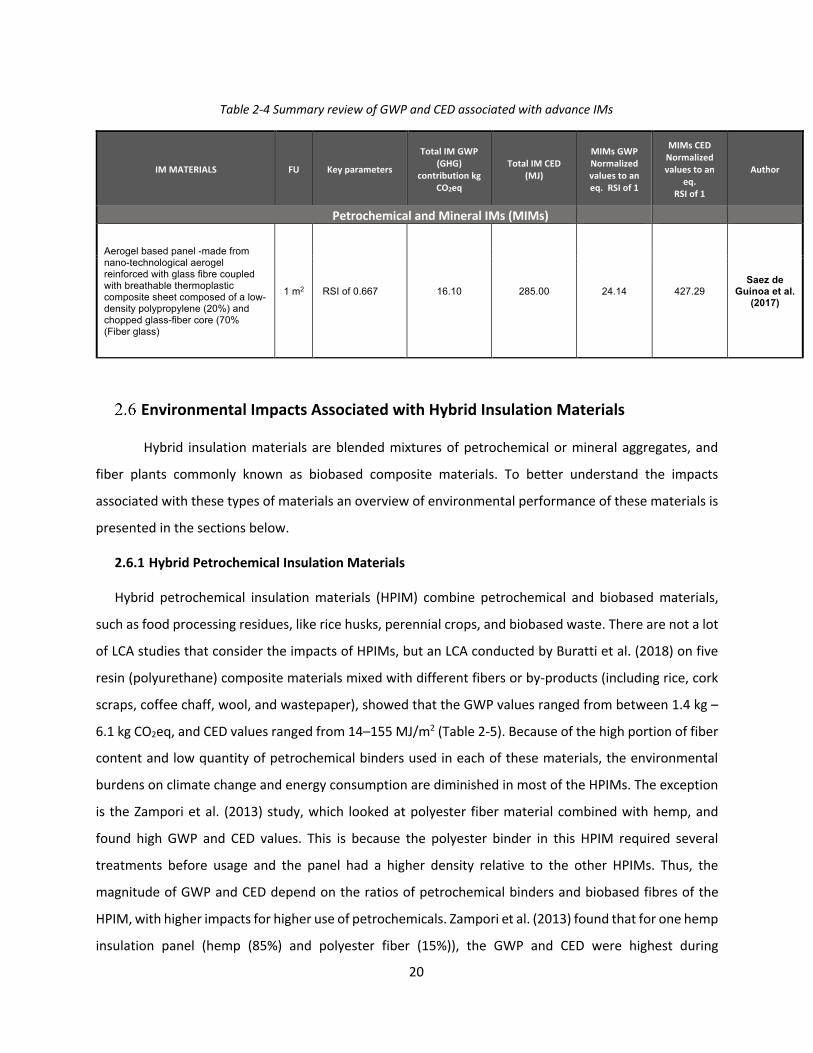
Composite/hybrid materials of PIM and MIM, have the highest GWP and CED impacts compared
to the other IMs (Table 2-4). The impacts of Aerogel-based panels are associated with the production of
glass fibre (Spaceloft®), which is coupled to a breathable membrane (SuperLite®) made of a thermoplastic
composite sheet composed of a low-density polypropylene (20%), chopped glass-fiber core (70%) (Saez
de Guinoa et al., 2017). Notably, a clear benefit of Aerogel panels in the prevention of heat loss could
benefit the energy consumption in the operational phase; however, from a holistic approach considering
a cradle to gate analysis, this material has impacts that are ~ 96% and ~97% (GWP and CED respectively)

18
higher compared to materials such as fibreglass (FG), and 80% and ~78% higher than RW, respectively.
This indicates the intensive burdens associated with this super insulation material mineral IMs during the
production stage (Table 2-4).
19
Table 2-3 Summary review of GWP and CED associated with mineral IMs (MIMs) and their respective wall system. Data are reported from lowest to highest RSIs associated with each IM.
IM
MATERIALS FU RSI (W m2/k)
GWP
kg
CO2eq
IM CED
(MJ)
GWP
Normalized
values to
an eq.
RSI of 1
CED
Normaliz
ed values
to an eq.
RSI of 1
WALL SYSTEM USED
Total
SYSTEM
GWP
(GHG)
contribution
kg CO2eq
Total
SYSTEM
CED
(MJ)
CED Normalized values to an
eq. RSI of 1
Author
Mineral IMs (MIMs)
Insulated Concrete Forms
1 m2
2.68
N/A
195.10 m2 of Insulated concrete form systems (ICF) with 101.6 mm (4-in.) concrete core.
N/A
374,000 715
Lu et al.
(2019) 2.91
195.10 m2 of Insulated concrete form systems (ICF) with 152.4 mm (6-in.) concrete core
415,000 731
Fiber glass
1.87 N/A 195.10 m2 of Standard wood stud wall with batt insulation (SWS)
N/A 152,000 417
3.7
3.7 49 1 13 1 m2 of External Thermal Insulation Composite Systems (ETICS)
52 550 149
Sierra-Perez et
al. (2016)
3.6 48 0.97 13 1 m2 of Ventilated façade (VF) 56 960 259
3.9 53 1.05 14 1 m2 of Internal Insulated Façade (IIF)
51 640 173
Rockwool
3.7
20 710 5.41 191.9 1 m2 of External Thermal Insulation Composite Systems (ETICS)
69 1,250 338
19 690 5.14 186.5 1 m2 of Ventilated façade (VF)
72 1,600 432.43
21 760 5.68 205.4 1 m2 Internal Insulated Façade (IIF)
69 1,400 378
4.75 N/A 1 m2 of Standard” wall compositions "3" (W-C3) 111 1,600 336.84 C. Ingrao et al.
(2016)
6.25 15.00 290.00 2.40 46.33
1 m2 of CV.02 wall. = A wall that consist of 1. Plasterboard, 2. Insulation panel (rockwool-based), 3. Oriented strand board, 4. Reinforced Concrete panel, 5. Cement plaster. (RSI 3.03)
15 820 131 Zampori et al.
(2013)
20
Table 2-4 Summary review of GWP and CED associated with advance IMs
IM MATERIALS FU Key parameters
Total IM GWP (GHG)
contribution kg CO2eq
Total IM CED (MJ)
MIMs GWP Normalized values to an eq. RSI of 1
MIMs CED Normalized values to an
eq. RSI of 1
Author
Petrochemical and Mineral IMs (MIMs)
Aerogel based panel -made from nano-technological aerogel reinforced with glass fibre coupled with breathable thermoplastic composite sheet composed of a low-density polypropylene (20%) and chopped glass-fiber core (70% (Fiber glass)
1 m2 RSI of 0.667 16.10 285.00 24.14 427.29 Saez de
Guinoa et al. (2017)
Environmental Impacts Associated with Hybrid Insulation Materials
Hybrid insulation materials are blended mixtures of petrochemical or mineral aggregates, and
fiber plants commonly known as biobased composite materials. To better understand the impacts
associated with these types of materials an overview of environmental performance of these materials is
presented in the sections below.
2.6.1 Hybrid Petrochemical Insulation Materials
Hybrid petrochemical insulation materials (HPIM) combine petrochemical and biobased materials,
such as food processing residues, like rice husks, perennial crops, and biobased waste. There are not a lot
of LCA studies that consider the impacts of HPIMs, but an LCA conducted by Buratti et al. (2018) on five
resin (polyurethane) composite materials mixed with different fibers or by-products (including rice, cork
scraps, coffee chaff, wool, and wastepaper), showed that the GWP values ranged from between 1.4 kg –
6.1 kg CO2eq, and CED values ranged from 14–155 MJ/m2 (Table 2-5). Because of the high portion of fiber
content and low quantity of petrochemical binders used in each of these materials, the environmental
burdens on climate change and energy consumption are diminished in most of the HPIMs. The exception
is the Zampori et al. (2013) study, which looked at polyester fiber material combined with hemp, and
found high GWP and CED values. This is because the polyester binder in this HPIM required several
treatments before usage and the panel had a higher density relative to the other HPIMs. Thus, the
magnitude of GWP and CED depend on the ratios of petrochemical binders and biobased fibres of the
HPIM, with higher impacts for higher use of petrochemicals. Zampori et al. (2013) found that for one hemp
insulation panel (hemp (85%) and polyester fiber (15%)), the GWP and CED were highest during

21
production of the panel due to the high contribution of polyester fiber. However, carbon uptake during
the hemp plant growth phase, resulted in a negative GWP (-4.5 kg CO2eq). Nevertheless, the CED was still
quite high (670 MJ) because the production of polyester and hemp feedstock represent half of the energy
requirement of the hemp-based panel.

22
Table 2-5 GWP and CED values for HPIMs
IM MATERIALS FU RSI GWP
kg CO2eq IM CED (MJ) WALL SYSTEM USED
Total SYSTEM
GWP
(GHG)
contribution kg
CO2eq
Total SYSTEM
CED (MJ) Author
HYBRID PETROCHEMICAL
Rice husk (RH) panel + Polyurethane glued (16%)
1 m2
1
2 40
N/A C. Buratti et al.
(2018)
Cork scraps -COR + Polyurethane glued (6%) 4 75
Coffee Chaff (CC) + Polyurethane glued (5%) 1.4 32
WP1: wastepaper layer pressed inserted between two panels of polyethylene fibers + Polyurethane Glue (13%)
6.1 155
WP2: wastepaper layer + Polyurethane glued (21%) 5 80
WP3: glued wool fibers + wastepaper pressed + Pol. glue (13%)
3 14
Hemp Insulation Panel (hemp (85%) and polyester fiber (15%))
4.5 -4.28 102.1
CV.01 wall = 1. Plasterboard, 2. Insulation panel (hemp-based), 3. Oriented strand board, 4. Reinforced Concrete panel 5. Cement plaster
-4.50 670 Zampori et al.
(2013)

23
2.6.2 Hybrid Mineral Insulation Materials
Hybrid mineral insulation materials (HMIMs) combine mineral and biobased materials. LCA
studies of HMIMs have reported a large range of GWP from -36.06 to 147.76 kg CO2eq/FU (Table 2-6).
Examples of HMIM with low GWP are provided in the studies carried by Ip et al. (2012), and Arrigoni et al.
(2017), which evaluated the GWP and CED of hemp shives mixed with lime (H1), and a mixture of 80%
dolomite lime and 20% cement (H2), respectively (Table 2-6). In general, due to the high content of hemp
fiber and the soil carbon sequestration occurring during the plant growth phase, these composites are
carbon negative materials (GWP= --36.08kg CO2eq/m2 for H1, -26.01kg CO2eq/m2 for H2). All existing
studies on hempcrete materials (hemp + lime-base binder) show that this is a low carbon or carbon
negative material (Table 2-6) because they offset the fossil energy use associated with the cement or lime
binders. Thus, hemp IMs present promising solutions to reduce carbon footprints in the construction
industry when compared to other IMs.
Nevertheless, GWP tends to increase with the use of alternative binders in hemp composites to
compensate for conventional lime-based binders which have weaker mechanical properties. For instance,
Sinka et al. (2018) demonstrated the role of four different binders on GWP impacts for a set of hempcrete
panels with two different compressive strengths (0.15 MPa and 0.50 MPa) for non-load bearing wall
purposes. The binders were magnesium phosphate cement (MPC), magnesium oxychloride cement
(MOC), formulated hydrated lime (FHL), and hydrated lime to hydraulic lime with pozzolanic additives
(HL). Five of the eight samples present very low or negative GWP values: (a) MOC 0.15MPa: -12.6 kg
CO2eq; (b) FHL (0.15 and 0.50 MPa): -30.9 and -29.3 kg CO2eq; and (c) HL (0.15 and 0.50 MPa): -19.2 kg
CO2eq and 4.8 kg CO2eq (Table 2-6). However, there were higher GWP values for MPC (26.4 kg CO2eq),
MPC2 (147.7kg CO2eq) and MOC2 (54.2 kg CO2eq) panels because in the production process of MPC
binder, a greater amount of phosphate was required, and for the MOC binder no carbonation takes place
during solidification of the MOC biocomposites, which lead to both composites present the higher GWP
impacts compared to the other binders. Thus, these results demonstrate that the amount and type of
binder as well as the proportion of hemp has a direct influence on GWP. In this case, this is related to the
need to have high strength binders to meet the function of both strength and thermal resistance. Further
research is needed on alternative binders that have good mechanical strength, and that can be combined
with biobased materials and processes to achieve high thermal resistance, while reducing costs and
environmental impacts.

24
Although low GWP was achievable for some HMIMs, CED values tend to be high due to the fossil energy
use in binders. For example, Arrigoni et al (2017) show that the high value associated to hempcrete blocks
was associated with the consumption of non-renewable (fossil) energy sources, mainly during the binder
production and the transport phases (Table 2-6).
In general, even though most hybrid IMs show a better environmental performance than conventional
insulation materials, the impacts during the use and pre-use phase can vary and depend on the binder-
fiber ratios in the composites, similar to what was found with HPIMs. For example, Zhou et al. (2018)
conducted an LCA for a kenaf fiber reinforced cement wall pane (KBP) (Table 2-6), and found that using
2% (%w/w) kenaf fibers in the compound reduced the GWP and CED; however, the mineral components
(i.e., cement, sand, silica fume (97.7 %w/w)), were hotspots, representing 97.5 % of total GWP and 96.1%
of CED. Similarly, Tiong et al. (2020) evaluated 1 kg of two lightweight foamed concrete (LFC) blends, using
2.5%, 5%, 7.5% and 10% of eggshell powder content as cement replacement (Table 2-6). Notably,
compared to other HMIMs, all the LFC mixtures had very high CED and GWP contributions (ranging from
2019 to 2169), because of the high proportion of ordinary Portland cement (OPC), which demands high
amounts of fossil fuel energy and results in the significant release of CO2 from the calcination process (as
occurred with hempcrete due to the amount of cement and lime utilized in the compound) (Tiong et al.,
2020). At the same time, the eggshells are minerals, and not carbon based, so they are not true biobased
materials. Although they are a waste, and therefore considered to have no associated environmental
burdens, they do not sequester carbon in the same way as crop products. Thus, impact reductions were
modest, at 6.6% and 9.9% for GWP and CED, respectively, based on the optimal eggshell powder
replacement level of 7.5%.

25
Table 2-6 Summary review of GWP and CED associated with MIMs. Data are reported from lowest to highest RSIs associated with each IM.
IM MATERIALS FU Key parameters GWP
kg CO2eq
CED (MJ) INSTALATION SYSTEM USED
Total SYSTEM GWP
(GHG) contribution kg
CO2eq
Total SYSTEM CED (MJ) Author
HYBRID IM (Biobased + Minetal)
Kenaf fiber reinforced cement wall panels (KFR2)
1m2
R value of 1 (m2 K/W) 238 1293.9 N/A Zhou et al. (2018)
Hempcrete Block C: Hemp shives (31.4 Kg) Binder - dolomite lime and cement (41.1 Kg) and water (53.1 kg) (H2)
R value of 3.7 (m2 K/W) − 26.01 358.73 N/A
A. Arrigoni et al.
(2017)
Hempcrete Block: C: Hemp shives (30kg) lime-binder (50 kg) and water (75 kg) (H1)
R value of 5 (m2 K/W) −36.08 N/A N/A
Ip et al. (2012)
Magnesium Phosphate Cement (MPC) (53.6%) + hemp shives (53.6%). (H3)
RSI of 5.5 (m2 K/W) and a Low compressive strength of 0.15 Mpa (in-situ placement using formwork- non load bearing walls)
26.49
N/A
N/A M. Sinka et al. (2018)
Magnesium Oxychloride Cement (MOP) (65.6%) + hemp shives (34.3%) (H4)
-12.68
Formulated hydrated lime (FHL) (32.6) + hemp shives (67.1%) (H5) -30.91
hydraulic lime binder (HL) (40%) + hemp shives (60%) (H6) -19.28
Magnesium Phosphate Cement (MPC2) (53.6%) + hemp shives (53.6%) (H7)
RSI= 5.5 (m2 K/W) and a High strength of 0.5 Mpa (non-load bearing construction blocks)
147.76
N/A Magnesium Oxychloride Cement (MOP2) (65.6%) + hemp shives (34.3%) (H8)
54.29
Formulated lime binder (FHL2) (32.6) + hemp shives (67.1%) (H9) -29.33
hydraulic lime binder (HL2) (40%) + hemp shives (60%) (H10)) 4.88

26
Impacts Associated with Pure Biobased Insulation Materials
Pure biobased insulation materials usually are developed from fiber plants or renewable resources,
without any extra petrochemical or mineral aggregate in their composition. Previous research related to
the environmental performance of these materials is presented in the sections below.
2.7.1 Natural and hybrid woody Insulation Materials
LCA studies on natural woody and hybrid woody IMs (to guarantee an RSI of 1) show GWPs
ranging from 1.35 to 5.92 kg CO2eq and CED ranges of 16.2 and 72.3 MJ (Table 2-7). Pargana et al. (2014)
evaluated one expanded cork panel (ICB) with a density of 110 kg/m3 and found a low GWP (1.61 kg
CO2eq) when compared to PIMs (EPS, XPS, PUR). For CED, the authors indicate results were higher due to
the forest conservation and maintenance operations needed during the ICB production process. Similarly,
Casas-Ledon (2020), evaluated four types of eucalyptus bark panels (EBP) accounting for different bulk
densities (two under and two above 50 kg/m3), and showed that GWP ranged from between 1.35 – 5.92
kg CO2eq/m2. The higher density (100 kg/m3) EBP panel had a 77% and 53% higher impact contribution
compared to those with densities of 25 and 50 kg/m3, respectively. Similarly, the EBP with density of 70
kg/m3 , had ~69% and ~36% higher impacts than the panels of densities 25 and 50 kg/m3, respectively. For
CED values, the density and, therefore, the weight directly influences the energy required to produce the
EBP panels. The polyethene and polypropylene fibers used to bind the eucalyptus bark fibers have high
contributions to GWP and CED.
Table 2-7 Summary review of GWP and CED associated with WIMs. Data are reported from lowest to highest RSIs associated with each IM.
IM MATERIALS FU Key parameters Total IM GWP
(GHG) contribution kg CO2eq
Total IM CED (MJ)
Author
Biobased woody
Expanded cork (ICB)
1m2
R=1 (m2K/W); density = 101 kg/m3 1.61 32.8 Pargana et al. (2014)
Eucalyptus bark grounded (95%) + biofibers binder (5%) (polyethylene and polypropylene)
R= 1 (m2K/W); density = 25 kg/m3 1.35 16.2
Casas-Ledon (2020) Eucalyptus bark grounded (95%) + biofibers binder (5%) (polyethylene and polypropylene)
R= 1 (m2K/W); density = 50 kg/m3 2.77 33.6

27
IM MATERIALS FU Key parameters Total IM GWP
(GHG) contribution kg CO2eq
Total IM CED (MJ) Author
Eucalyptus bark grounded (95%) + biofibers binder (5%) (polyethylene and polypropylene)
R= 1 (m2K/W); density = 75 kg/m3 4.32 52.5
Eucalyptus bark grounded (95%) + biofibers binder (5%) (polyethylene and polypropylene)
R= 1 (m2K/W); density = (100 kg/m3) 5.92 72.3
2.7.2 Pure Natural Insulation Materials
PNIMs present low carbon emission and efficient energy values derived mainly from the
production process of these materials (Table 2-8). For example, D’Alessandro et al. (2018) showed that
compressed fiber straw blocks (WSB) and panels had low GWP (1.08 kg CO2eq/m2) and CED (1.17 MJ/m2),
indicating the potential sustainability of these materials for the construction sector. Revuelta-Aramburu
et al. (2020) found similar results, for a full-scale wall prototype, using wheat straw, which resulted in only
25% of the total impact for GWP and CED. Their analysis of the PFB prototype shows the lowest GWP and
CED and much lower impacts than the comparable EPS wall (model B) (presented in Table 2-3). Generally
speaking, despite lower impacts, the use of fertilizer and diesel combustion in agricultural machinery is
the biggest contributor to the GWP of woody or PNIMs. Improved nitrogen efficiency and beneficial
management practices for crop production to store carbon, could potentially improve the sustainability
performance of the natural IMs and biobased building products.
Table 2-8 Summary review of GWP and CED associated with PNIMs. Data are reported from lowest to highest RSIs associated with each IM.
IM MATERIALS FU Key parameters
GWP kg
CO2eq CED (MJ) INSTALATION
SYSTEM USED
Total SYSTEM
GWP contribution
kg CO2eq
Total SYSTEM
CED (MJ)
Author
Biobased Crop (pure natural)
Straw bale with recycled wool 1m2 R value of 6.25 N/A
Full-scale wall prototype with a useful area of 6.60 × 4.40m2 and a height of 2.50 m
5.32E+04 8.31E+05 M. Revuelta-
Aramburu et al. (2020)

28
IM MATERIALS FU Key parameters
GWP kg
CO2eq CED (MJ) INSTALATION
SYSTEM USED
Total SYSTEM
GWP contribution
kg CO2eq
Total SYSTEM
CED (MJ)
Author
Wheat Straw RSI of 1 1.08 1.17 N/A D’Alessandro
et al. (2017)
Summary of IM Impacts and Research Gaps
When complete insulation wall systems are evaluated, the environmental burdens related to
GWP and CED, vary and tend to depend more on the materials used in the various layers of a wall (changes
in the relative order and proportion of the elements in the wall system) rather than on the type of IMs
(Table 2-4). However, when only IMs are considered (without considering other system elements), the
IMs with the highest GWP and CED were associated with hybrid mineral IMs (KRF, KRF2, MPC2 and MOP2).
Although these walls had some insulation value, their main function was to provide mechanical strength,
and therefore required the use of cement binders, which have high GWP and CED.
The petrochemical IMs category had the second highest GWP and CED, followed by hybrid
petrochemical and natural IMs (Figure 6). The amount and the type of binder directly influences the GWP
and CED performance in order to meet the function of the system. Most of the impacts associated with
the petrochemical or hybrid IMs are related to the use of synthetic or mineral binder use, with most of
the contribution occurring from cradle to manufacturing stage.
Interestingly, although there are significant environmental impacts associated with synthetic and
mineral binders represents, only two studies specifically explore the application and the environmental
implication of alternatives binders (Buratti et al., 2018, and Sinka et al., 2018), or consider less than 5%
(%w/w) of alternatives binders in the materials composition (Casas-Ledón et al., 2020). Therefore, the
absence of these type of studies, is a gap in LCA studies. These alternative mineral, synthetic, hybrid or
natural adhesive agents could be used to address the most relevant environmental challenges associated
with building materials, such as the reduction in the intensive use of energy and generation of GHG
emissions, the extraction of non-renewable materials, or the amount of waste creation from a cradle to
gate analysis approach.

29
Furthermore, it is clear that more research is needed to understand the life cycle environmental
impacts associated with different composition of IMs, and made with different local material. A major
barrier to understanding the life cycle impacts is the inconsistent application of LCA methodologies
(boundaries, functional units), which makes it difficult to compare different studies.

30
Figure 2-4 Comparative GWP of IMs reviewed in this literature based on a functional unit of 1 m2 wall with an RSI of 1.

31
Figure 2-5 Comparative CED of IMs reviewed in this literature based on a functional unit of 1 m2 wall with an RSI of 1.

32
Chapter 3-Methods This study is an ISO-compliant comparative LCA (ISO 14040/14044, 2006) of the environmental
performance of a biobased and conventional (extruded polystyrene-XPS) insulated core form (ICF) wall
system, and involves the following steps:
I) Goal and Scope: functional unit selection, product systems description, and system boundaries
definition.
II) Life Cycle Inventory (LCI): material and energy inputs, emission and waste outputs for all activities
in the life cycle of the product; assumptions and calculations.
III) Life Cycle Impact Assessment (LCIA): evaluation of impacts and resource use and sensitivity
analysis.
IV) Life Cycle Interpretation: Discussion, interpretation of results, limitations, and recommendations,
based on the goal.
Goal of the Study
The primary goal of this study is to compare and quantify the environmental performance of corn
stover biobased (CSB) panel and conventional wall system, and to identify hotspots related to the CSB
panel. The study of a CSB based insulated concrete form (ICF) wall system was motivated by conversations
with an Ontario-based construction company that develops green buildings construction projects and
marked the environmental problems associated with XPS panels utilized in conventional ICF walls and the
lack of biobased alternatives for these systems. The study can be used to understand whether the CSB
wall system is a less environmentally damaging building material.
Function, Functional Unit, and Reference Flows
The functional unit (FU) is defined by the primary purpose or function of the product under
assessment (Rebitzer et al., 2004), and is used to enable an equivalent comparison of the environmental
impacts of different products that provide similar end-uses (Matthews, Hendrickson & Matthews, 2015).
In this case LCA study, the function of the system is to provide mechanical strength and insulation value
for an exterior wall system used specifically in cold weathers. Therefore, the FU is 1 m2 of wall, that
provides equivalent mechanical strength as the XPS wall system (ICF), with a thermal resistance of 1 (m2
K/W). The thermal conductivity (U) and resistance (RSI-value in metric units) of the CSB panel (dimensions
of 0.4 x 0.4 x 0.05 m) were determined in a testing laboratory center (Table 3-1).

33
Since RSI= 1/C, where C is the conductivity of the material for a specified thickness, and C= λ /L,
where λ is the material’s conductivity, and L is the thickness of the material, then the thickness needed to
provide an RSI of 1 is:
L=RSI * λ
The reference flows for the wall system (the amount of materials required to meet the FU of 1 m2 with
requisite strength and thermal resistance) were calculated based on the volume of the panel, and its
density, and are 50.1 and 1.44 kg for the BICF and ICF wall system, respectively (Table 3-1).
Table 3-1Characteristic properties of the BICF wall system.
Wall System parameters Core Reinforcement Panel Panel Characteristic properties Units Concrete Rebar CSB XPS Dimensions (Length x Width)
m 1 x 0.10 1 ma 1 x 1 1 x 1
Thickness m 0.1 0.0113 (diameter)
0.085 0.034
Volume m3 0.01 N/A 0.085 0.034 Density (kg/m3) 2,309b 0.785c 611.1 36 Thermal Conductivity of CSB panel
λ (W/m/K) N/A N/A 0.085 0.0325d
Thermal Conductivity per thickness
C (W/m/m/k) N/A N/A 1.0 0.96
Thermal resistance per given thickness
m (K/W) N/A N/A 1.0 1
Reference flows kg 23.09 0.785 50.1 1.44 a Wikipedia. (2021). Length only. Rebar. Retrieved from https://en.wikipedia.org/w/index.php?title=Rebar&oldid=1014010032 b Quora. (2018). What is the density of concrete? Retrieved from https://quora.com/What-is-the-density-of-concrete? C Density is in kg per m of rebar at a nominal diameter of 0.0113 m. d Average of XPS densities. (2019) Retrieved from https://frolleindanz.com/thermal-conductivity-of-polystyrene-foam-what-it-is-and-what-it-depends-on
Product System Descriptions
3.3.1 Biobased Insulated Concrete Forms (BICF)
The product system considered under this LCA is called biobased insulated concrete forms (BICF) and
consists of one core layer of cement (with dimensions 1m L x 1m W x 0.1 m H) sandwiched between two
external CSB rigid panels (1m L x 1m W x 0.5 m H), composed of corn stover, fish binder, and cement kiln
dust. Generally speaking, the rigid CSB panels are developed with the intention of replacing the outer

34
layers of rigid XPS foam utilized in conventional ICF systems while the core concrete layer with rebar is
kept the same.
The development of the BICFs begins with the procurement of raw materials required to produce
the CSB panels. The CSB panels are made of corn stover, fish binder, and cement kiln dust (CKD) at a mass
ratio of 24: 62:13, respectively. The fish binder is collagen-based and is obtained from fish skins and bones
from salmon by-products, assumed to come from local fish processing plants. It replaces up to 70% of any
synthetic or mineral aggregate additives commonly used in materials to develop wall partitions. The fish
by-products are collected, and then boiled until the desired viscosity of the fish binder solution is
obtained.
The corn stover is a natural residue obtained from the corn plant after the grain harvesting process
occurs. The stover, made up of stalks, leaves, and cobs, is chopped, raked, and baled in the field. Then the
bales are collected from the field and transported by freight transport truck (16 metric tonnes) a distance
of 50 km to the CSB panel production plant. At the CSB plant, the corn stover is milled into a powder, in
preparation for blending.
CKD is a by-product or industrial waste obtained from the production of Portland cement when
the raw materials are heated in the kiln (Al Jabri et al., 2009), and captured by exhaust gases that are
collected in particulate matter control devices, such as cyclones (Adaska et al., 2008). As a result, this by-
product is composed of the residual dusts of lime, sand, clay and iron, and comes in a fine powder form
that is transported to the panel manufacturing facility.
At the CSB plant, all the materials are blended in a drive cement mixer until the compound is well
mixed. The compound is poured into square molds (42 cm L x 42 cm W x 10 cm D), and pressed for 10
minutes, before being unmolded and left to dry in a controlled temperature drying room at 25°C. High
temperature infrared panel heaters are used to accelerate the drying process, which takes between 20 to
30 days. Once dried, the panels are passed through an industrial polishing belt to smooth and flatten the
panel surfaces. The final panel has dimensions of 40 cm L x 40 cm W x 4.2 cm D, due to shrinkage. These
panels are then transported to the construction site, which is assumed to be 100 km away. At the
construction site, 10.1 CSB panels are needed to cover 1 m2 area of a BICF wall to a depth of 10 cm required
to provide the functional requirements; the panels are assembled manually using an interlocking system.
Cement is poured between the interior and exterior wall layers, which are spaced at 10 cm (Figure 3-1 a
and b). Lastly, reinforcement bars, with a nominal diameter of 11.3 mm and a length of 1 m are embedded
into the cement core to give more structural stability to the BICF system.
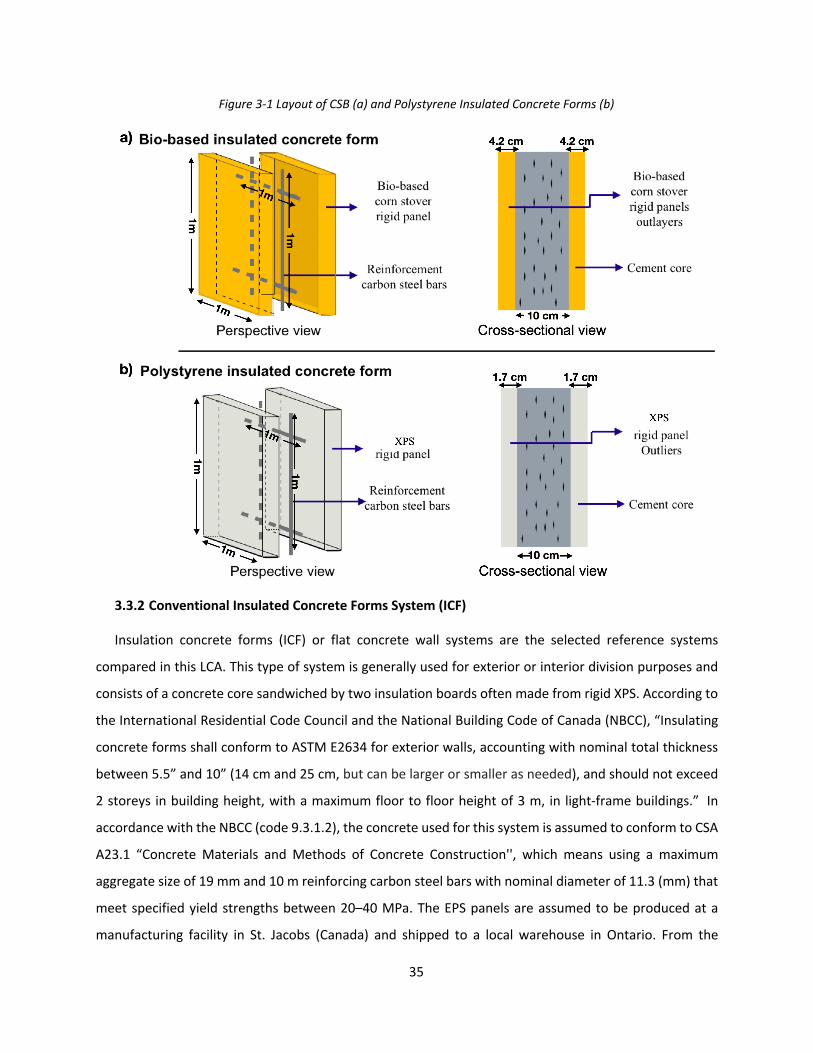
35
Figure 3-1 Layout of CSB (a) and Polystyrene Insulated Concrete Forms (b)
3.3.2 Conventional Insulated Concrete Forms System (ICF)
Insulation concrete forms (ICF) or flat concrete wall systems are the selected reference systems
compared in this LCA. This type of system is generally used for exterior or interior division purposes and
consists of a concrete core sandwiched by two insulation boards often made from rigid XPS. According to
the International Residential Code Council and the National Building Code of Canada (NBCC), “Insulating
concrete forms shall conform to ASTM E2634 for exterior walls, accounting with nominal total thickness
between 5.5” and 10” (14 cm and 25 cm, but can be larger or smaller as needed), and should not exceed
2 storeys in building height, with a maximum floor to floor height of 3 m, in light-frame buildings.” In
accordance with the NBCC (code 9.3.1.2), the concrete used for this system is assumed to conform to CSA
A23.1 “Concrete Materials and Methods of Concrete Construction'', which means using a maximum
aggregate size of 19 mm and 10 m reinforcing carbon steel bars with nominal diameter of 11.3 (mm) that
meet specified yield strengths between 20–40 MPa. The EPS panels are assumed to be produced at a
manufacturing facility in St. Jacobs (Canada) and shipped to a local warehouse in Ontario. From the

36
warehouse, it is assumed that the panels are transported 100 km by truck to the construction site. At the
construction site, the 1m L x 1m W x 0.4 m D panels are manually assembled using an interlocking system,
with the exterior and interior panel being 10 cm apart. The concrete is poured between the panels, and
rebars are embedded in the cement (Figure 3-1 b), similar to the BICF system.
System Boundary
The system boundary in this study is cradle-to- ‘wall installation’ gate. The unit process stages, and
their corresponding locations are presented in Figure 3-2 and Figure 3-3, including raw material extraction
and refining, component manufacturing (CSB and XPS panels, rebar and concrete), and transportation
among all these stages. It is assumed that the ICF installation process is the same for both systems and so
it is not taken into account in this LCA. Since the CSB panel is currently in a prototype stage, the use and
end-of-life stages are excluded in the study because there are no data available. The geography selected
for both systems, including the delivery to the final construction site, is Canada, including all life cycle
activities occurring in Ontario. For the CSB and XPS panels, the temporal boundaries are 2015 to 2020,
which affects Ontario grid electricity generation mix and conventional treatment for production tap water.
Figure 3-2 System boundaries and unit processes applied for the is cradle-to- ‘wall installation’ gate of the CSB panels.
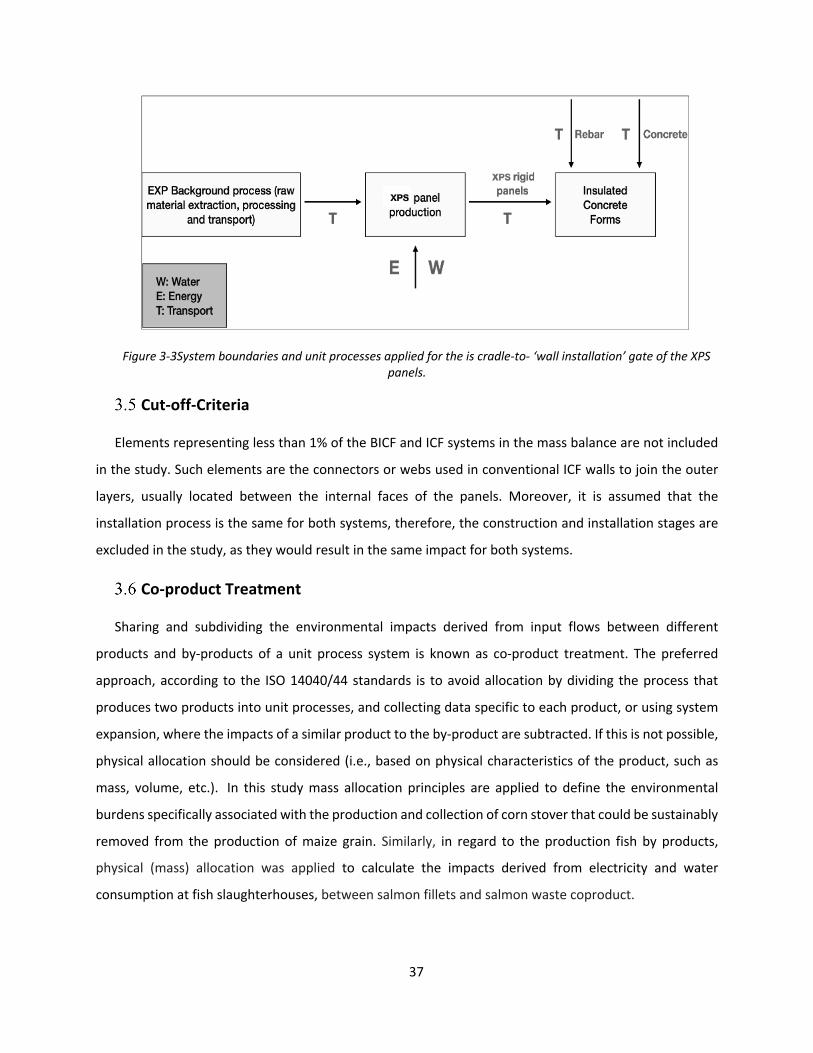
37
Figure 3-3System boundaries and unit processes applied for the is cradle-to- ‘wall installation’ gate of the XPS panels.
Cut-off-Criteria
Elements representing less than 1% of the BICF and ICF systems in the mass balance are not included
in the study. Such elements are the connectors or webs used in conventional ICF walls to join the outer
layers, usually located between the internal faces of the panels. Moreover, it is assumed that the
installation process is the same for both systems, therefore, the construction and installation stages are
excluded in the study, as they would result in the same impact for both systems.
Co-product Treatment
Sharing and subdividing the environmental impacts derived from input flows between different
products and by-products of a unit process system is known as co-product treatment. The preferred
approach, according to the ISO 14040/44 standards is to avoid allocation by dividing the process that
produces two products into unit processes, and collecting data specific to each product, or using system
expansion, where the impacts of a similar product to the by-product are subtracted. If this is not possible,
physical allocation should be considered (i.e., based on physical characteristics of the product, such as
mass, volume, etc.). In this study mass allocation principles are applied to define the environmental
burdens specifically associated with the production and collection of corn stover that could be sustainably
removed from the production of maize grain. Similarly, in regard to the production fish by products,
physical (mass) allocation was applied to calculate the impacts derived from electricity and water
consumption at fish slaughterhouses, between salmon fillets and salmon waste coproduct.

38
The sensitivity analysis focused on how impacts were allocated between corn grain and corn stover. In
the original analysis, the impacts of producing corn grain and corn stover were divided based on the mass
of each product, using mass allocation. As a sensitivity analysis, the preferred method of dividing impacts
was by dividing out the activities between the grain and the stover. This means not including the materials
and energy used for grain growing activities and their associated impacts. Instead, only the additional
activities to collect the stover, and accounting for the fertilizer value of the stover are considered. The
nutrient content per 1000 kg of corn stover is: 3.1 kg of Nitrogen, 0.7 kg of phosphorous (as P2O5), and
5.8 kg potassium (as K2O). Equivalent amounts of nitrogen, phosphorus, and potassium fertilizer were
considered as inputs to replace the nutrient value of the stover removed (200 kg), as shown in Table 3-2.
Table 3-2 Nitrogen, phosphorus, and potassium fertilizer considered for replacing the nutrient value of the stover removed (200 kg)
Nutrient Value per 1000 kg Corn Stover
Equivalent Fertilizer Needed per 200 kg Corn Stover
3.1 kg N 0.62 kg 0.7 kg P as P2O5 0.14 kg 5.8 kg K as K2O 1.16 kg
Impact Assessment Methods
The comparison of the BICF and conventional ICF product systems were evaluated on the basis of
global warming potential (GWP, measured in carbon dioxide equivalent emissions (CO2eq)), cumulative
energy demand (CED, in megajoules (MJ)), respiratory organics (ozone depletion potential (ODP, (CFC-
11e)), acidification potential (AP, in sulfur dioxide equivalent emissions [SO2e]), eutrophication potential
(EP, in phosphate equivalent emissions (PO4e)), carcinogens and non-carcinogens (in kg of benzene and
toluene equivalent emissions [C6H6e and C7H8e]) ecotoxicity (TETP, measured in kg of 14-dichlorobenzene
equivalents [kg 1,4-DB-eq]), and smog formation depletion (PCOP), measured in kg of ethylene
equivalents (C2H4e).
To model the life cycle of the insulation systems and BSC panels presented in this study, the
Ecoinvent database was selected using the openLCA software (V1.8.0) to interpret and translate the
inventory data into quantified results. The LCIA method used to define and calculate impact contribution
values is TRACI V2.1, a method specifically developed for the United States that utilizes a midpoint-
oriented approach and most input parameters consistent with US locations (Wu and ZU, 2020). The

39
midpoint-oriented approach comprises and is mainly focussed on ten environmental impact categories as
presented in (Table 3-3). Compatible for the assignment of factors to the elementary flows developed in
the Ecoinvent database (Hischier et al., 2010). Furthermore, according to an assessment of the availability
of agricultural biomass for heat production in Ontario (Kludze et al., 2010) and the 'Grain Corn: Area and
Production, by County crops statistic index reports compiled by the Ontario Ministry of Agriculture, Food
and Rural Affairs (OMAFRA 2004 to 2020) it was possible to calculate and identify the production ratio of
corn stover from an average maize yield production ranging from 5–10 years in Ontario, Canada; to model
the collection of CS and determine the environmental impacts of 1 ton of this by product in the openLCA.
Furthermore, during the binder production, the energy consumption was estimated to be 8.74E-5 Kwh
per 1 kg of binder, derived from the boiling process applied to extract the fish collagen (binder).
Ultimately, sensitive analysis is conducted to make up the nutrient loss nutrients of Nitrogen (N),
Phosphorous (P2O5), and Potassium (K2O) from the CS removal (Kludze et al., 2013) used for the
production of corn stover, and thereby, determine the environmental impact of the of the CSB panel and
the BICF system based on this approach.
Table 3-3. Brief description of the TRACI V2.1 (Tool for the reduction and assessment of chemical and other environmental impacts) impact assessment method and environmental impact categories.
MIDPOINT IMPACT CATEGORIES UNIT
Global Warming Potential (GWP)
kg CO2-Eq
Acidification Potential (AP)
moles of H+-Eq
Carcinogens (CGP)
kg benzene-Eq
Non-Carcinogens (NCGP)
kg toluene-Eq
Respiratory Effects (RE)
kg PM2.5-Eq
Eutrophication Potential (EP)
kg N -Eq
Ozone Depletion Potential (ODP) kg CFC-11-Eq
Ecotoxicity Potential (ETP)
kg 2,4-D-Eq
Smog Formation Potential (SFP) kg NOx-Eq
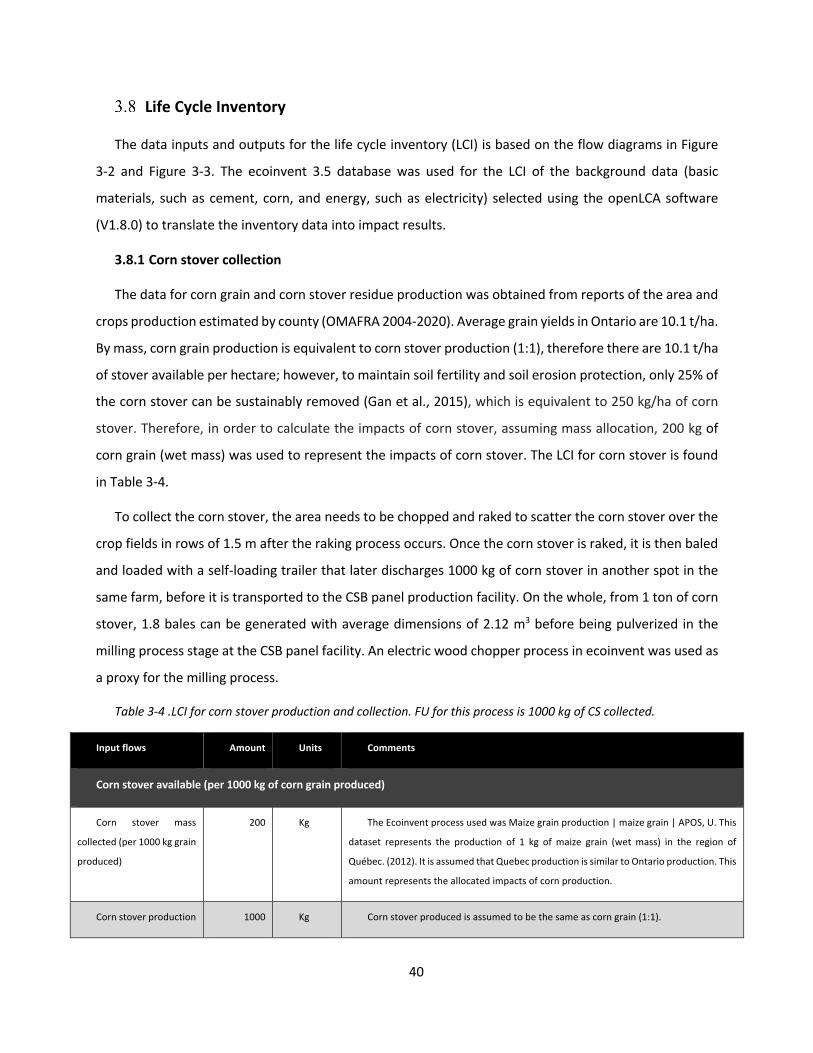
40
Life Cycle Inventory
The data inputs and outputs for the life cycle inventory (LCI) is based on the flow diagrams in Figure
3-2 and Figure 3-3. The ecoinvent 3.5 database was used for the LCI of the background data (basic
materials, such as cement, corn, and energy, such as electricity) selected using the openLCA software
(V1.8.0) to translate the inventory data into impact results.
3.8.1 Corn stover collection
The data for corn grain and corn stover residue production was obtained from reports of the area and
crops production estimated by county (OMAFRA 2004-2020). Average grain yields in Ontario are 10.1 t/ha.
By mass, corn grain production is equivalent to corn stover production (1:1), therefore there are 10.1 t/ha
of stover available per hectare; however, to maintain soil fertility and soil erosion protection, only 25% of
the corn stover can be sustainably removed (Gan et al., 2015), which is equivalent to 250 kg/ha of corn
stover. Therefore, in order to calculate the impacts of corn stover, assuming mass allocation, 200 kg of
corn grain (wet mass) was used to represent the impacts of corn stover. The LCI for corn stover is found
in Table 3-4.
To collect the corn stover, the area needs to be chopped and raked to scatter the corn stover over the
crop fields in rows of 1.5 m after the raking process occurs. Once the corn stover is raked, it is then baled
and loaded with a self-loading trailer that later discharges 1000 kg of corn stover in another spot in the
same farm, before it is transported to the CSB panel production facility. On the whole, from 1 ton of corn
stover, 1.8 bales can be generated with average dimensions of 2.12 m3 before being pulverized in the
milling process stage at the CSB panel facility. An electric wood chopper process in ecoinvent was used as
a proxy for the milling process.
Table 3-4 .LCI for corn stover production and collection. FU for this process is 1000 kg of CS collected.
Input flows Amount Units Comments
Corn stover available (per 1000 kg of corn grain produced)
Corn stover mass
collected (per 1000 kg grain
produced)
200 Kg The Ecoinvent process used was Maize grain production | maize grain | APOS, U. This
dataset represents the production of 1 kg of maize grain (wet mass) in the region of
Québec. (2012). It is assumed that Quebec production is similar to Ontario production. This
amount represents the allocated impacts of corn production.
Corn stover production 1000 Kg Corn stover produced is assumed to be the same as corn grain (1:1).

41
Input flows Amount Units Comments
Amount of corn stover
removed
250 Kg Corn stover sustainable removal is 25% of available stover.
Mass of Product and
Co-product
1250 Kg Total mass (Sustainable corn stover removal (25%) + 1000 kg of corn grain production)
Mass allocation ratio of
corn stover.
0.20 % Mass allocation. From 1 ton of grain production, just 25% of Corn stover could be
sustainable removed, therefore 20 % of impacts goes to the corn stover. Obtained from
the equation: (250 kg / 1250 kg)
Shredding, collection of corn stover (per 1000 kg of corn stover collected)
Area of land from
which stover is collected
0.0984 Ha Average Ontario corn yield is 10.1 t/ha. The area is of 0.0984 ha/FU. There is one pass
with a forage chopper truck.
Raking, collection of corn stover (per 1000 kg of corn stover collected)
Area of land from
which stover is collected
0.0984 ha Average Ontario corn yield is 10.1 t/ha. The area is of 0.0984 ha/FU. There is one pass
with a V raking machine.
Baling, Collection of corn stover (per 1000 kg of corn stover collected)
Number of bales of CS 1.84 Number
of bales Number of bales (each of 540 kg) equivalent to 1 ton of bale stover transport in farm by a
truck with self-loading trailer
Loading, Collection of corn stover (per 1000 kg of corn stover collected)
Forage cut material for
1 m3 of corn stover fodder
based
2.12 m3 Average bale dimensions of 5 ft diameter and 6 ft length. representstheserviceofself-loadingtrailerwithafoddercutter,transportbacktofarmandfastdischarge.
3.8.2 Fish binder production
The raw data from the production of fish binder was collected from Enova Ziegler et al. (2009),
and Atesa et al. (2017). These data are based on energy and water consumption data at salmon
slaughterhouses in Norway. The rates of energy consumption vary considerably depending on the plant's
scale and age, the type of processing plant, the level of automation, the efficiency with which equipment
can be cleaned, and operator practices (UNEP, 2000). Accordingly, based on energy and water calculations
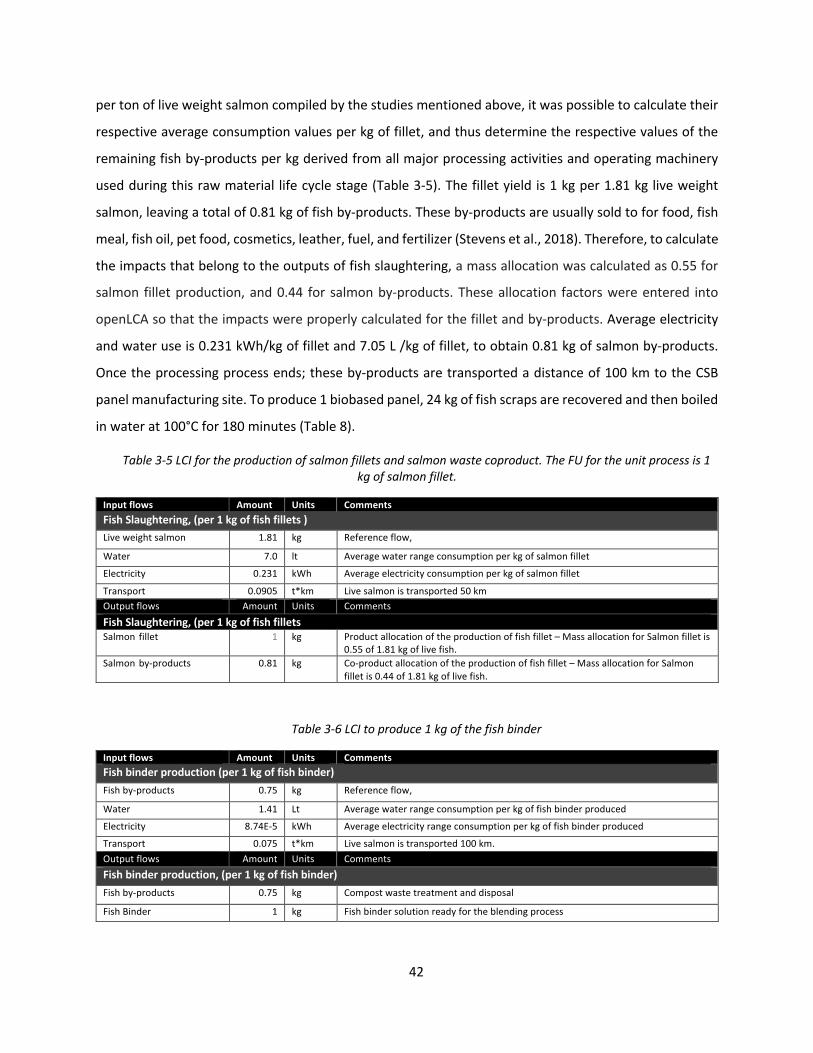
42
per ton of live weight salmon compiled by the studies mentioned above, it was possible to calculate their
respective average consumption values per kg of fillet, and thus determine the respective values of the
remaining fish by-products per kg derived from all major processing activities and operating machinery
used during this raw material life cycle stage (Table 3-5). The fillet yield is 1 kg per 1.81 kg live weight
salmon, leaving a total of 0.81 kg of fish by-products. These by-products are usually sold to for food, fish
meal, fish oil, pet food, cosmetics, leather, fuel, and fertilizer (Stevens et al., 2018). Therefore, to calculate
the impacts that belong to the outputs of fish slaughtering, a mass allocation was calculated as 0.55 for
salmon fillet production, and 0.44 for salmon by-products. These allocation factors were entered into
openLCA so that the impacts were properly calculated for the fillet and by-products. Average electricity
and water use is 0.231 kWh/kg of fillet and 7.05 L /kg of fillet, to obtain 0.81 kg of salmon by-products.
Once the processing process ends; these by-products are transported a distance of 100 km to the CSB
panel manufacturing site. To produce 1 biobased panel, 24 kg of fish scraps are recovered and then boiled
in water at 100°C for 180 minutes (Table 8).
Table 3-5 LCI for the production of salmon fillets and salmon waste coproduct. The FU for the unit process is 1 kg of salmon fillet.
Input flows Amount Units Comments Fish Slaughtering, (per 1 kg of fish fillets ) Live weight salmon 1.81 kg Reference flow,
Water 7.0 lt Average water range consumption per kg of salmon fillet Electricity 0.231 kWh Average electricity consumption per kg of salmon fillet Transport 0.0905 t*km Live salmon is transported 50 km Output flows Amount Units Comments Fish Slaughtering, (per 1 kg of fish fillets Salmon fillet 1 kg Product allocation of the production of fish fillet – Mass allocation for Salmon fillet is
0.55 of 1.81 kg of live fish. Salmon by-products 0.81 kg Co-product allocation of the production of fish fillet – Mass allocation for Salmon
fillet is 0.44 of 1.81 kg of live fish.
Table 3-6 LCI to produce 1 kg of the fish binder
Input flows Amount Units Comments Fish binder production (per 1 kg of fish binder) Fish by-products 0.75 kg Reference flow,
Water 1.41 Lt Average water range consumption per kg of fish binder produced Electricity 8.74E-5 kWh Average electricity range consumption per kg of fish binder produced Transport 0.075 t*km Live salmon is transported 100 km. Output flows Amount Units Comments Fish binder production, (per 1 kg of fish binder) Fish by-products 0.75 kg Compost waste treatment and disposal
Fish Binder 1 kg Fish binder solution ready for the blending process

43
3.8.3 Cement Kiln Dust
Clinker production in Quebec from the ecoinvent database was used as a proxy for the impacts of
producing CKD. These data include the whole manufacturing process from quarrying, crushing, grinding,
drying, blending, heating, and cooling of raw materials (in the kiln), and the transportation along the
supply chain. In particular, when the clinker production is completed, 0.45kg of CKD (13%w/w of the total
CSB compound) is recovered and transported 100 km to the CSB panel facility in order to be blended with
the fish binder and pulverized corn stover.
3.8.4 CSB panel
For the CSB panel manufacturing process, data was collected on the CSB prototype. The CSB panel
manufacturing begins with blending 2.18 kg of fish binder, 0.859kg of corn stover, and 0.45kg of CKD to
obtain a viscous compound ready to be pressed in molds and shaped into a panel. The blending requires
0.0011 kWh of electricity. Transportation of corn stover (0.042 t*km) and CKD (0.0456 t*km) from the
farm and cement facilities to the CSB manufacturing plant are included. The electricity requirements for
pressing, drying and polishing of 1 kg of CSB panel are 0.0011 kWh, 1.57 E-04 kWh, and 0.178 kWh,
respectively (Table 3-7).
Table 3-7. Life cycle inventory for the production of 1 kg of the CSB panel. Percent composition of panel materials do not add up to 100% due to rounding
Input flows Amount Units Comments Blending of the BCS (per 1 kg of finished CSB panel) Pulverized CS (24 %W/W) 0.859 kg The pulverized CS is blended through a conventional construction Cement
Mixer Fish binder (62 %W/W) 2.18 kg 0.75 kg fish by-product boiled in water at 100°C for 180 minutes. Blending
energy is estimated using a conventional construction cement mixer. CKD (13 %W/W) 0.456 Kg CKD blended using a conventional construction cement mixer Electricity 6.25E-4 kWh Electricity required for the Cement mixer Pressing and molding (per 1 kg of CSB panel produced) Panel Compound 3.50 kg CSB blended mixture pressed and molded through a 30-gallon air compressor Electricity 1.574E-4 kWh Electricity required for the Cement mixer Drying (per 1 kg of CSB panel produced) Panel Compound 3.50 kg Drying of the CSB panel though the use of high temperature infrared panel
heaters Electricity 0.00111 kWh Electricity required for the Cement mixer
Polishing (per 1 kg of CSB panel produced) Panel Compound 1 kg Polishing of the dried BCS panel compound using a industrial belt polishing
Electricity 0.178 kWh Electricity required for the Cement mixer
Transport (per 1 kg of CSB panel produced)
Transport of the CSB compound to retailer
2.50 t.km Transport of final product to construction site (considering the quantity of CSB panels covering 1 m2)
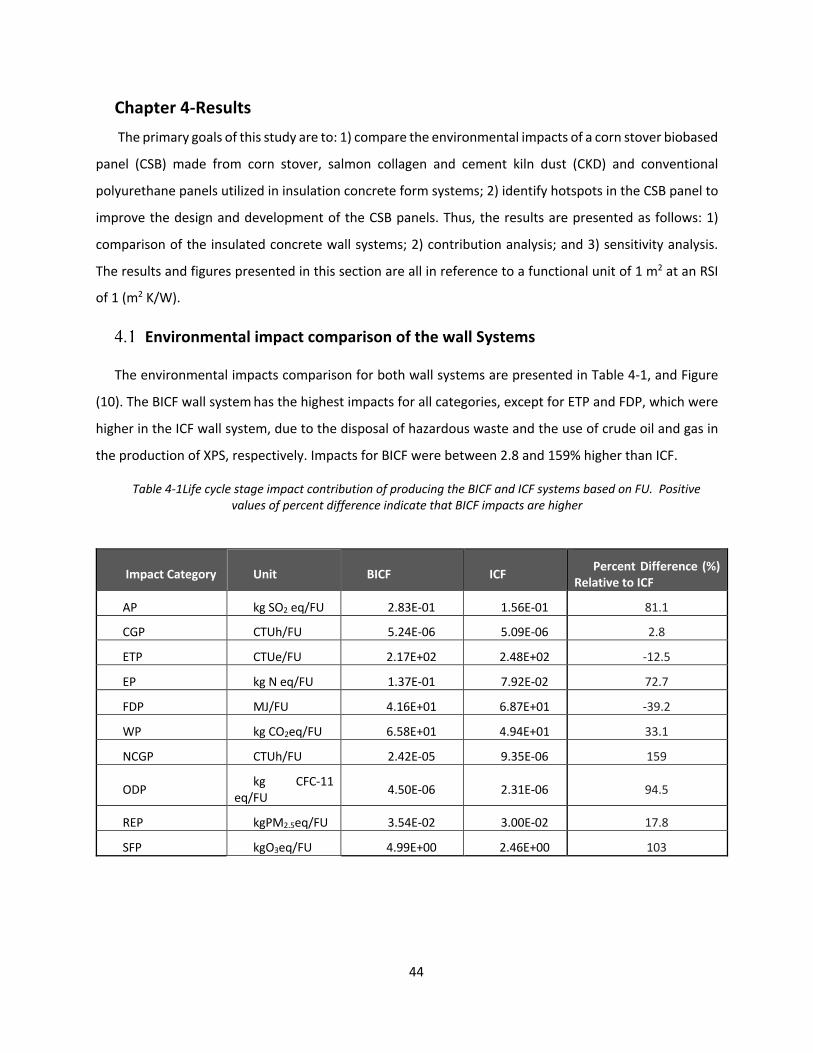
44
Chapter 4-Results The primary goals of this study are to: 1) compare the environmental impacts of a corn stover biobased
panel (CSB) made from corn stover, salmon collagen and cement kiln dust (CKD) and conventional
polyurethane panels utilized in insulation concrete form systems; 2) identify hotspots in the CSB panel to
improve the design and development of the CSB panels. Thus, the results are presented as follows: 1)
comparison of the insulated concrete wall systems; 2) contribution analysis; and 3) sensitivity analysis.
The results and figures presented in this section are all in reference to a functional unit of 1 m2 at an RSI
of 1 (m2 K/W).
Environmental impact comparison of the wall Systems
The environmental impacts comparison for both wall systems are presented in Table 4-1, and Figure
(10). The BICF wall system has the highest impacts for all categories, except for ETP and FDP, which were
higher in the ICF wall system, due to the disposal of hazardous waste and the use of crude oil and gas in
the production of XPS, respectively. Impacts for BICF were between 2.8 and 159% higher than ICF.
Table 4-1Life cycle stage impact contribution of producing the BICF and ICF systems based on FU. Positive values of percent difference indicate that BICF impacts are higher
Impact Category Unit BICF ICF Percent Difference (%) Relative to ICF
AP kg SO2 eq/FU 2.83E-01 1.56E-01 81.1
CGP CTUh/FU 5.24E-06 5.09E-06 2.8
ETP CTUe/FU 2.17E+02 2.48E+02 -12.5
EP kg N eq/FU 1.37E-01 7.92E-02 72.7
FDP MJ/FU 4.16E+01 6.87E+01 -39.2
WP kg CO2eq/FU 6.58E+01 4.94E+01 33.1
NCGP CTUh/FU 2.42E-05 9.35E-06 159
ODP kg CFC-11
eq/FU 4.50E-06 2.31E-06 94.5
REP kgPM2.5eq/FU 3.54E-02 3.00E-02 17.8
SFP kgO3eq/FU 4.99E+00 2.46E+00 103

45
Figure 4-1 Comparison of ICF and BICF systems. The results are relative to the product with the highest impact for each indicator and impact for 1 m2 of the ICF and the BICF
The BICF system had a cumulative energy demand (CED) of 728 MJ/FU compared to that of ICF, which
was 631 MJ/FU, a percent difference of 15.5% (Table 4-2). In order to understand the drivers of impacts
for each wall system, a contribution analysis is described in the following section.
Figure 4-2 Cumulative energy demand (CED) for BICF and ICF. Positive values of percent difference indicate that BICF impacts are higher
CED INDICATORS (MJ/FU) BICF ICF Percent Difference (%)
Non renewable, fossil 429.0 584.0 -26.5
Non-renewable, biomass -3.4 0.0 -14,627.3
Non-renewable, nuclear 132.8 28.4 368.4
Renewable, biomass 125.8 4.1 2,953.6
Renewable, water 41.5 12.6 229.0
Renewable, wind, solar, geothermal 2.5 1.4 79.0
TOTAL 728.3 630.5 15.5
AP CG ETP EP FFD GWP NCP ODP REP SFPBICF 100 100 88 100 60 100 100 100 100 100ICF 55 97 100 58 100 75 39 51 85 49
0
10
20
30
40
50
60
70
80
90
100
PE
RC
EN
TA
GE
(%
)

46
Contribution Analysis of BICF system
The CSB panel manufacturing stage contributes the highest impact for most of the categories (ranging
from between 41.2 to 67.9% of total impact), except for CGP and ETP impacts (Figure 4-3). This
contribution comes from the production of the corn stover and CKD materials utilized in making the CSB
panel. The concrete form had the second greatest impact contribution ranging from between 24 to 38%
of the total impact contribution in most of the impact categories. The production of cement used in the
concrete core is the main reason for these high impacts. Finally, the reinforcement bars (rebar) used in
the BICF system, accounted for 72.4 and 57.2% of carcinogenic and ecotoxicity impacts, respectively, due
to the impacts of steel production.
4.2.1 Contribution analysis of the CSB panel
Overall, the need for a thicker CSB panel to provide an RSI of 1, means that more mass of this material
is required, which drives the higher impacts. Since the only difference between the BICF and the ICF was
the use of CSB panel compared to an EXP panel, and all other materials were exactly the same in amounts
and composition, it is the CSB panel that drives the impacts; therefore, to suggest improvements, it is
important to understand what drives the impacts of this component.
Even though milled corn stover use was only 24% by mass in the CSB panel, it contributed the highest
impact in all impact categories, except AP, GWP, and SFP, which were the highest for CKD production
(Table 4-2). Corn stover production at the farm was the biggest contributor to the impacts of milled corn
stover, followed by corn stover collection activities associated with the use of fuel in agricultural
machinery at farm to chop and rake the corn stover.
With the exception of ODP and CED, the lowest impacts were associated with the fish binder, even
though it constituted 62% of the mass of the panel. The highest impacts in the life cycle of fish binder
were related to the fish processing plant, and the transport of the fish by-products to the CSB facility.
Nevertheless, the composting of the residues after the production of the binder, resulted in a credit for
the fish binder, due to avoided methane emissions from landfill, and a credit for nutrients in the compost
that could replace fertilizer use, and thus avoid fertilizer manufacture emissions.
The CED associated with making the CSB panel was 9.6 MJ/1 kg of panel (Table 4-3). Most of the energy
required to produce the panel is non-renewable (94%).

47
Figure 4-3Contribution analysis of producing 1kg f the BICF system comprising process and activities from cradle-to-manufacturing gate. Numbers in the table indicate the percentage of the total impact associated with each stage.
AP CG ETP EP FFD GWP NCG ODP REP SFPTransport 1.0 0.27 0.82 0.41 2.41 0.69 0.44 2.49 0.92 1.54Rebar production 9.6 72.4 57.3 22.0 9.4 10.9 18.6 9.3 30.4 7.7Concrete prod. 24.1 10.6 28.0 18.8 32.9 37.9 13.0 30.6 27.4 26.3CSB panel prod. 65.3 16.6 13.9 58.8 55.2 50.4 67.9 57.6 41.2 64.4
0%
10%
20%
30%
40%
50%
60%
70%
80%
90%
100%

48
Table 4-2 Contribution analysis from cradle-to-manufacturing gate to produce 1 kg of the CSB panel in Ontario, Canada. Bold numbers indicate the highest contribution to each impact category.
CSB panel production
Units Corn stover collection
CKD production
Fish binder production
Transport Total
AP kg SO2eq 1.72E-03 2.57E-03 -9.30E-04 1.60E-04 3.52E-03
CGP CTUh 1.46E-08 7.22E-09 -6.52E-09 7.69E-10 1.60E-08 ETP CTUe 1.39E+00 6.18E-01 -1.61E+00 9.84E-02 4.96E-01 EP kg N eq 2.34E-03 5.70E-04 -1.41E-03 3.09E-05 1.53E-03
FDP MJ 2.25E-01 6.39E-02 6.39E-02 5.55E-02 4.08E-01 GWP kg CO2eq 1.74E-01 4.59E-01 -3.38E-02 2.51E-02 6.24E-01
NCGP CTUh 3.89E-07 3.00E-08 -1.14E-07 5.84E-09 3.11E-07 ODP kg CFC-11eq 2.84E-08 6.35E-09 6.71E-09 6.17E-09 4.76E-08 REP kgPM2.5eq 2.00E-04 1.50E-04 -8.65E-05 1.80E-05 2.82E-04
SFP kgO3eq 2.42E-02 3.09E-02 2.04E-03 4.22E-03 6.14E-02
Table 4-3 CED for making 1 kg of the CSB panel.
CSB panel Results (MJ/kg)
Non renewable, fossil 4.27 Non-renewable, biomass 2.39 Non-renewable, nuclear 2.37 Renewable, biomass 0.63 Renewable, water 0.03 Renewable, wind, solar, geothermal -0.06 TOTAL 9.63
4.2.2 Sensitive analysis
The sensitivity analysis was conducted on co-product treatment, as this is a methodological choice in
LCA that can drastically change the results. In the base case for the BICF, the impacts of corn grain
production were divided on a mass basis between the corn grain and the corn stover. As a sensitivity
analysis, only the impacts of collecting the stover and replacing its fertilizer value with equivalent amounts
of manufactured fertilizer was considered as described in methodology. This system is referred to as BICF
(SA). The results for the sensitivity analysis are shown in Figure 4-4. BIFC (SA) had the highest impact in

49
all categories, except for EP, ET, and NCG. Overall, the trends between BICF and ICF remained the same,
and therefore the ICF has lower impacts in most categories.
These results indicate that the results were not very sensitive to coproduct treatment methodologies
considered because the only impact category for which the results were reversed based on the sensitivity
analysis was for EP. In the base case for BICF, the EP impact was higher than for the ICF, but in the
sensitivity analysis, the BICF (SA) had the lowest impact.
Figure 4-4 . Sensitive analysis relative indicator impact results correlated to the production of 1 m2 of the BICF (system A), ICF (reference system) and BIFC (system B)
AP CG ETP EP FFD GWP NCG ODP REP SFPBICF 59.4 92 87.5 100 60.2 56.5 100 62.3 68.5 50BIFC (SA) 100 100 56 -28 100 100 71 100 100 100IFC 32.8 89.5 100 58 99 42.4 38.7 32 58.2 24.7
-40
-20
0
20
40
60
80
100
PERC
ENTA
GE (%
)

50
Chapter 5 Discussion The goal of this thesis was to evaluate the life cycle environmental impacts of CSB panels and
determine if they were a more sustainable alternative to XPS panels for ICF wall systems. The specific
objectives were to: 1) compare the life cycle environmental impacts associated with BICF and ICF wall
systems; 2) identify environmental ‘hotspots’ associated with CSB panels to determine whether
improvements can be made; and 3) to evaluate the use of BICF as a solution for more sustainable
construction.
Comparison of Wall Systems and Hotspots for CSB
The BICF had higher impacts than the conventional ICF for almost all impact categories. This was driven
mostly by the use of corn stover and CKD, both of which are energy and resource intensive systems. There
was very little opportunity to improve the environmental performance, and therefore this particular use
of the CSB panel is not a more sustainable solution for ICF systems.
It is difficult to reduce the CSB impacts, unless other agricultural residues are used. Furthermore, the
use of CKD to provide mechanical strength to the biobased portion resulted in high impacts. Even though
the use of this by-product prevents industrial waste and encourages the circular economy (Liu et al., 2017),
it is a high impact co-product from clinker production. CKD also has low RSI, therefore more material was
needed to meet an RSI of 1. In this respect, the impacts of the CSB panel can be compared to LCA studies
of mineral binders (Table 2-6). It is most similar in function and impacts to the hybrid wall systems that
mostly provided structural support with minimum insulation. For example, a kenaf fiber reinforced
cement wall panel with the same functional unit used in this study had a GWP of 238 and CED of 1,294
(Zhou et al. 2018) (Table 2-6). Similarly, for Magnesium Phosphate Cement and hemp shive walls, the GWP
impacts were high (147.76 kg CO2eq/ 1 m2) as the RSI-value and mechanical strength increased to 5.5 (m2
K/W) and 0.5 Mpa (non-load bearing construction blocks), respectively (Sinka et al. 2018). In contrast, the
BICF had a GWP of 65.8 kg CO2eq/ FU.
The fish binder production had the second highest contribution to CED, mainly related to the transport
of live-weight salmon to fish slaughtering plants. Using alternatively fueled vehicles could reduce these
impacts, but this was not tested due to the high impacts associated with the corn stover and CKD.
Nevertheless, the fish binder used in the CSB panel helped reduce the ecotoxicity, eutrophication,
carcinogenic, and GWP, as the fish residues from the binder production were assumed to be composted,
which gave the system a credit for avoided landfill emissions and for nutrient recovery. Because the
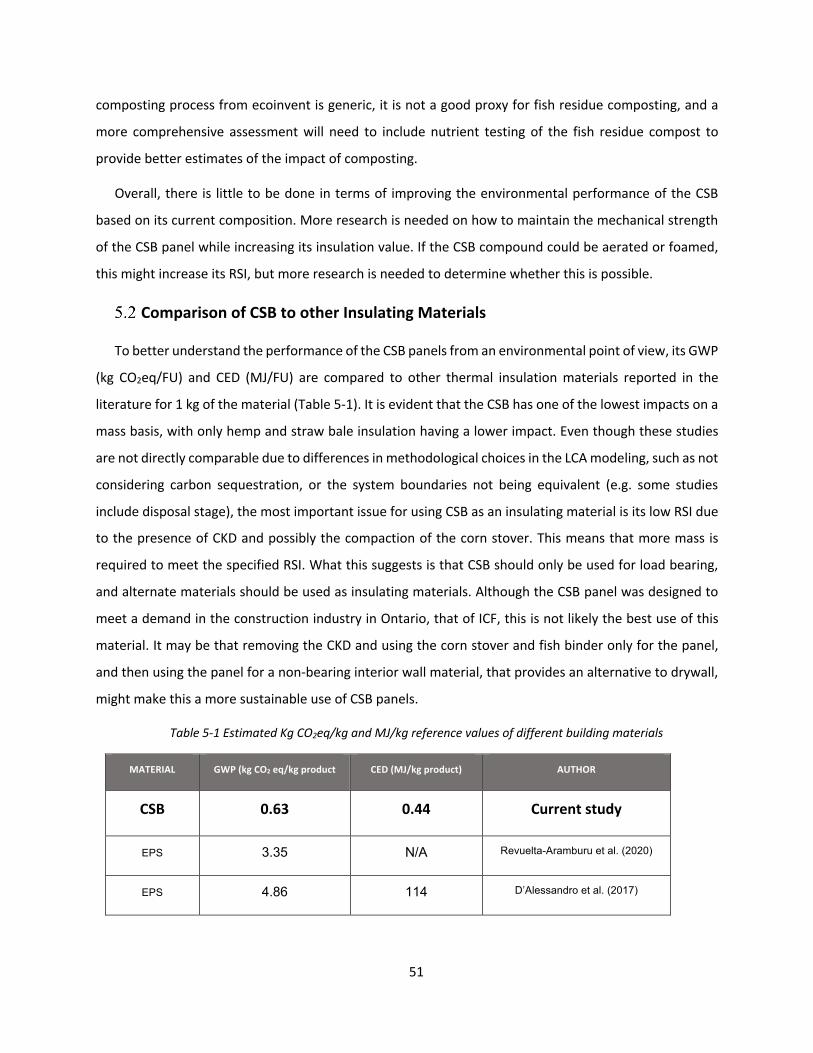
51
composting process from ecoinvent is generic, it is not a good proxy for fish residue composting, and a
more comprehensive assessment will need to include nutrient testing of the fish residue compost to
provide better estimates of the impact of composting.
Overall, there is little to be done in terms of improving the environmental performance of the CSB
based on its current composition. More research is needed on how to maintain the mechanical strength
of the CSB panel while increasing its insulation value. If the CSB compound could be aerated or foamed,
this might increase its RSI, but more research is needed to determine whether this is possible.
Comparison of CSB to other Insulating Materials
To better understand the performance of the CSB panels from an environmental point of view, its GWP
(kg CO2eq/FU) and CED (MJ/FU) are compared to other thermal insulation materials reported in the
literature for 1 kg of the material (Table 5-1). It is evident that the CSB has one of the lowest impacts on a
mass basis, with only hemp and straw bale insulation having a lower impact. Even though these studies
are not directly comparable due to differences in methodological choices in the LCA modeling, such as not
considering carbon sequestration, or the system boundaries not being equivalent (e.g. some studies
include disposal stage), the most important issue for using CSB as an insulating material is its low RSI due
to the presence of CKD and possibly the compaction of the corn stover. This means that more mass is
required to meet the specified RSI. What this suggests is that CSB should only be used for load bearing,
and alternate materials should be used as insulating materials. Although the CSB panel was designed to
meet a demand in the construction industry in Ontario, that of ICF, this is not likely the best use of this
material. It may be that removing the CKD and using the corn stover and fish binder only for the panel,
and then using the panel for a non-bearing interior wall material, that provides an alternative to drywall,
might make this a more sustainable use of CSB panels.
Table 5-1 Estimated Kg CO2eq/kg and MJ/kg reference values of different building materials
MATERIAL GWP (kg CO2 eq/kg product CED (MJ/kg product) AUTHOR
CSB 0.63 0.44 Current study
EPS 3.35 N/A Revuelta-Aramburu et al. (2020)
EPS 4.86 114 D’Alessandro et al. (2017)

52
MATERIAL GWP (kg CO2 eq/kg product CED (MJ/kg product) AUTHOR
Flax fiber 1.73 N/A
Revuelta-Aramburu et al. (2020)
Hemp 1.75 N/A
Hemp 0.15 N. A D’Alessandro et al. (2017)
D’Alessandro et al. (2017)
Kenaf 2.09 39
PUR 4.94 N/A Revuelta-Aramburu et al. (2020)
Rockwool 2.31 44
D’Alessandro et al. (2017)
Straw bale 0.18 0.89
Wheat straw 0.95 N/A
Revuelta-Aramburu et al. (2020)
Wood fiber 1 N/A
XPS 9.79 N/A
XPS 13.67 107 D’Alessandro et al. (2017)
Study limitations
The scope of this study specified data quality requirements for Ontario-specific data in order to meet
the goal. However, much of the data was not specific for Ontario. For example, for the fish binder
production, data from fish processing in Norway was used. In relation to the use of CKD, a clinker proxy
was used to estimate CKD impacts. For the corn stover, the estimates of impacts were based on Quebec
corn production. It is well-known that LCA results of agricultural products can have large variation due to
local management practices, agroclimatic factors, and yields. Furthermore, for the panel manufacturing
(due to the early experimental stage of the CSB panels), assumptions were made on transport along the
production chain. Additionally, estimates of energy use were based on lab or pilot scale data, which tends
to be less efficient than optimized industrial scale production.
53
Nevertheless, the strength of the LCA is in the primary data collection that occurred in Ontario for the
corn stover collection and grinding activities, for the fish binder production and in the CSB panel
production process.
Conclusions
An ISO-compliant LCA was conducted to determine the environmental performance of a hybrid
biobased panel for the use in ICF. The panel was composed of corn stover, CKD and a fish binder, and was
evaluated for its potential to replace XPS panels in conventional ICF walls. However, due to its low
insulation value, the impacts were higher for the BICF relative to the conventional ICF in most impact
categories. Most of the impacts arose from the use of corn stover and CKD. It was concluded that this
panel does not make a more sustainable substitute for XPS in ICF wall systems. More research is needed
on how to increase the insulation value of the CSB panel, while maintaining mechanical strength for load-
bearing walls, and on alternative materials that provide strength but have less impact. Alternatively, the
CSB should be developed for interior wall uses, where mechanical strength requirements are not as high.
This would require product development and another LCA study to compare it to conventional interior
wall systems, such as drywall.
This thesis contributes to the growing body of knowledge on the environmental impacts of hybrid
biobased construction materials. Because bio-based resources are influenced by local agroclimatic
conditions, it is important to understand these materials under different geographical contexts.

54
References
Adaska, P.E., W. S., & Taubert, D. H. (2008). Beneficial Uses of Cement Kiln Dust. 2008 IEEE Cement Industry
Technical Conference Record, 210–228. https://doi.org/10.1109/CITCON.2008.24
Al-Jabri, K. S., Hago, A. W., Taha, R., Alnuaimi, A. S., & Al-Saidy, A. H. (2009). Strength and Insulating
Properties of Building Blocks Made from Waste Materials. Journal of Materials in Civil Engineering,
21(5), 191–197. https://doi.org/10.1061/(ASCE)0899-1561(2009)21:5(191)
Ansah, M. K., Chen, X., Yang, H., Lu, L., & Lam, P. T. I. (2020). An integrated life cycle assessment of different
façade systems for a typical residential building in Ghana. Sustainable Cities and Society, 53, 101974.
https://doi.org/10.1016/j.scs.2019.101974
Arrigoni, A., Pelosato, R., Melià, P., Ruggieri, G., Sabbadini, S., & Dotelli, G. (2017). Life cycle assessment of
natural building materials: The role of carbonation, mixture components and transport in the
environmental impacts of hempcrete blocks. Journal of Cleaner Production, 149, 1051–1061.
https://doi.org/10.1016/j.jclepro.2017.02.161
Asdrubali, F., D’Alessandro, F., & Schiavoni, S. (2015). A review of unconventional sustainable building
insulation materials. Sustainable Materials and Technologies, 4, 1–17.
https://doi.org/10.1016/j.susmat.2015.05.002
ATES, B., WIDELL K., N., NORDTVEDT T., S., & Et Al. (2017). Energy consumption for salmon slaughtering
processes. [Data set]. International Institute of Refrigeration (IIR). https://doi.org/10.18462/IIR.NH3-
CO2.2017.0014
Bignozzi, M. C. (2011). Sustainable Cements for Green Buildings Construction. Procedia Engineering, 21, 915–
921. https://doi.org/10.1016/j.proeng.2011.11.2094

55
Buratti, C., Belloni, E., Lascaro, E., Merli, F., & Ricciardi, P. (2018). Rice husk panels for building applications:
Thermal, acoustic and environmental characterization and comparison with other innovative recycled
waste materials. Construction and Building Materials, 171, 338–349.
https://doi.org/10.1016/j.conbuildmat.2018.03.089
Caruso, M. C., Menna, C., Asprone, D., & Prota, A. (2018). LCA-Based Comparison of the Environmental Impact
of Different Structural Systems. IOP Conference Series: Materials Science and Engineering, 442, 012010.
https://doi.org/10.1088/1757-899X/442/1/012010
Casas-Ledón, Y., Daza Salgado, K., Cea, J., Arteaga-Pérez, L. E., & Fuentealba, C. (2020). Life cycle assessment
of innovative insulation panels based on eucalyptus bark fibers. Journal of Cleaner Production, 249,
119356. https://doi.org/10.1016/j.jclepro.2019.119356
Directive 2010/31/EU of the European Parliament and of the Council of 19 May 2010 on the energy
performance of buildings. (n.d.). 23.
EPA (2018). US Environmental protection agency. EPA enforcement actions required the treatment,
disposal, or elimination of pollutants and waste. Retrieved from
https://www.epa.gov/sites/production/files/2019-
01/documents/epa_2018_yearinreview_0128-4.pdf
Intergovernmental Panel on Climate Change, & Edenhofer, O. (Eds.). (2014). Climate change 2014:
Mitigation of climate change: Working Group III contribution to the Fifth Assessment Report of
the Intergovernmental Panel on Climate Change. Cambridge University Press.
D’Alessandro, F., Bianchi, F., Baldinelli, G., Rotili, A., & Schiavoni, S. (2017). Straw bale constructions:
Laboratory, in field and numerical assessment of energy and environmental performance. Journal of
Building Engineering, 11, 56–68. https://doi.org/10.1016/j.jobe.2017.03.012

56
Echarri-Iribarren, V., Echarri-Iribarren, F., & Rizo-Maestre, C. (2019). Ceramic panels versus aluminium in
buildings: Energy consumption and environmental impact assessment with a new methodology. Applied
Energy, 233–234, 959–974. https://doi.org/10.1016/j.apenergy.2018.08.091
European Commission. Directorate General for Internal Market, Industry, Entrepreneurship and SMEs.,
ECORYS., WIFO., & National Institute of Economic and Social Research. (2018). Competitiveness of the
European cement and lime sectors: Final report. Publications Office.
https://data.europa.eu/doi/10.2873/300170
Futas, N., Rajput, K., & Schiano-Phan, R. (2019). Cradle to Cradle and Whole-Life Carbon assessment – Barriers
and opportunities towards a circular economic building sector. IOP Conference Series: Earth and
Environmental Science, 225, 012036. https://doi.org/10.1088/1755-1315/225/1/012036
Gan, Y., Hamel, C., O’Donovan, J. T., Cutforth, H., Zentner, R. P., Campbell, C. A., Niu, Y., & Poppy, L. (2015).
Diversifying crop rotations with pulses enhances system productivity. Scientific Reports, 5(1), 14625.
https://doi.org/10.1038/srep14625
Guna, V., Ilangovan, M., Ananthaprasad, M. G., & Reddy, N. (2018). Hybrid biocomposites. Polymer
Composites, 39, E30–E54. https://doi.org/10.1002/pc.24641
Hischier, R., Weidema, B., Althaus, H.-J., Bauer, C., Doka, G., Dones, R., Frischknecht, R., Hellweg, S.,
Humbert, S., Jungbluth, N., Köllner, T., Loerincik, Y., Margni, M., & Nemecek, T. (n.d.).
Implementation of Life Cycle Impact Assessment Methods. 176.
Huntzinger, D. N., & Eatmon, T. D. (2009). A life-cycle assessment of Portland cement manufacturing:
Comparing the traditional process with alternative technologies. Journal of Cleaner Production, 17(7),
668–675. https://doi.org/10.1016/j.jclepro.2008.04.007

57
Ingrao, C., Scrucca, F., Tricase, C., & Asdrubali, F. (2016). A comparative Life Cycle Assessment of external wall-
compositions for cleaner construction solutions in buildings. Journal of Cleaner Production, 124, 283–
298. https://doi.org/10.1016/j.jclepro.2016.02.112
Ip, K., & Miller, A. (2012). Life cycle greenhouse gas emissions of hemp–lime wall constructions in the UK.
Resources, Conservation and Recycling, 69, 1–9. https://doi.org/10.1016/j.resconrec.2012.09.001
Jelle, B. P. (2011). Traditional, state-of-the-art and future thermal building insulation materials and solutions –
Properties, requirements and possibilities. Energy and Buildings, 43(10), 2549–2563.
https://doi.org/10.1016/j.enbuild.2011.05.015
Khan, M. W. A., Ting, N. H., Kuang, L. C., Darun, M. R., Mehfooz, U., & Khamidi, M. F. (2018). Green
Procurement in Construction Industry: A Theoretical Perspective of Enablers and Barriers. MATEC Web
of Conferences, 203, 02012. https://doi.org/10.1051/matecconf/201820302012
Kibert, C. J. (2007). The next generation of sustainable construction. Building Research & Information, 35(6),
595–601. https://doi.org/10.1080/09613210701467040
Kludze, H., Deen, B., Weersink, A., van Acker, R., & Janovicek, K. (n.d.). ASSESSMENT OF THE
AVAILABILITY OF AGRICULTURAL BIOMASS FOR HEAT AND ENERGY PRODUCTION IN ONTARIO.
136.
Lasvaux, S., Achim, F., Garat, P., Peuportier, B., Chevalier, J., & Habert, G. (2016). Correlations in Life Cycle
Impact Assessment methods (LCIA) and indicators for construction materials: What matters? Ecological
Indicators, 67, 174–182. https://doi.org/10.1016/j.ecolind.2016.01.056
Liu, Y., & Bai, Y. (2014). An exploration of firms’ awareness and behavior of developing circular economy: An
empirical research in China. Resources, Conservation and Recycling, 87, 145–152.
https://doi.org/10.1016/j.resconrec.2014.04.002

58
Lu, X., & Memari, A. (2019). Comparative Energy Analysis and Life-Cycle Assessment of Innovative Residential
Wall Systems in Cold Regions. Practice Periodical on Structural Design and Construction, 24(3),
04019015. https://doi.org/10.1061/(ASCE)SC.1943-5576.0000432
Martínez-Rocamora, A., Solís-Guzmán, J., & Marrero, M. (2016). LCA databases focused on construction
materials: A review. Renewable and Sustainable Energy Reviews, 58, 565–573.
https://doi.org/10.1016/j.rser.2015.12.243
Neyestani, B. (2017). A Review on Sustainable Building (Green Building). SSRN Electronic Journal.
https://doi.org/10.2139/ssrn.2968885
NRC. (2015). National Building Code of Canada. Ontario (Canada): Canadian Commission and Fire Codes.
Retrieved from https://nrc.canada.ca/en/certifications-evaluations-standards/codes-canada/codes-
canada-publications/national-building-code-canada-2015
Natural Resources Canada, 2016–17 Report on Plans and Priorities. (n.d.). 95. Retrieved from
https://www.nrcan.gc.ca/plans-performance-reports/rpp/2016-17/18001
Oo, A., Muntasir, N., Poon, K., Weersink, A., & Thimmanagari, M. (n.d.). Development of an Agricultural
Biomaterial Industry in Ontario. 72.
OMAFRA. (2004 – 2020). Ontario Ministry of Agriculture, Food and Rural Affairs. Area and production
estimates. Ontario (Canada). Corn stover production. Retrieved from
http://www.omafra.gov.on.ca/english/stats/crops/index.html
Pargana, N., Pinheiro, M. D., Silvestre, J. D., & de Brito, J. (2014). Comparative environmental life cycle
assessment of thermal insulation materials of buildings. Energy and Buildings, 82, 466–481.
https://doi.org/10.1016/j.enbuild.2014.05.057
59
Peñaloza, D., Erlandsson, M., & Falk, A. (2016). Exploring the climate impact effects of increased use of bio-
based materials in buildings. Construction and Building Materials, 125, 219–226.
https://doi.org/10.1016/j.conbuildmat.2016.08.041
Peuportier, B., Thiers, S., & Guiavarch, A. (2013). Eco-design of buildings using thermal simulation and life
cycle assessment. Journal of Cleaner Production, 39, 73–78.
https://doi.org/10.1016/j.jclepro.2012.08.041
Pittau, F., Krause, F., Lumia, G., & Habert, G. (2018). Fast-growing bio-based materials as an opportunity for
storing carbon in exterior walls. Building and Environment, 129, 117–129.
https://doi.org/10.1016/j.buildenv.2017.12.006
Quintana, A., Alba, J., del Rey, R., & Guillén-Guillamón, I. (2018). Comparative Life Cycle Assessment of
gypsum plasterboard and a new kind of bio-based epoxy composite containing different natural fibers.
Journal of Cleaner Production, 185, 408–420. https://doi.org/10.1016/j.jclepro.2018.03.042
Ramesh, T., Prakash, R., & Shukla, K. K. (2010). Life cycle energy analysis of buildings: An overview. Energy and
Buildings, 42(10), 1592–1600. https://doi.org/10.1016/j.enbuild.2010.05.007
Rebitzer, G., Ekvall, T., Frischknecht, R., Hunkeler, D., Norris, G., Rydberg, T., Schmidt, W.-P., Suh, S.,
Weidema, B. P., & Pennington, D. W. (2004). Life cycle assessment. Environment International, 30(5),
701–720. https://doi.org/10.1016/j.envint.2003.11.005
Revuelta-Aramburu, M., Verdú-Vázquez, A., Gil-López, T., & Morales-Polo, C. (2020). Environmental analysis
of the use of plant fiber blocks in building construction. Science of The Total Environment, 725, 138495.
https://doi.org/10.1016/j.scitotenv.2020.138495

60
Sáez de Guinoa, A., Zambrana-Vasquez, D., Alcalde, A., Corradini, M., & Zabalza-Bribián, I. (2017).
Environmental assessment of a nano-technological aerogel-based panel for building insulation. Journal
of Cleaner Production, 161, 1404–1415. https://doi.org/10.1016/j.jclepro.2017.06.102
Schiavoni, S., D׳Alessandro, F., Bianchi, F., & Asdrubali, F. (2016). Insulation materials for the building sector:
A review and comparative analysis. Renewable and Sustainable Energy Reviews, 62, 988–1011.
https://doi.org/10.1016/j.rser.2016.05.045
Sfakianaki, A., Santamouris, M., Hutchins, M., Nichol, F., Wilson, M., Pagliano, L., Pohl, W., Alexandre, J. L., &
Freire, A. (2011). Energy Consumption Variation due to Different Thermal Comfort Categorization
Introduced by European Standard EN 15251 for New Building Design and Major Rehabilitations.
International Journal of Ventilation, 10(2), 195–204. https://doi.org/10.1080/14733315.2011.11683948
Shoulders, M. D., & Raines, R. T. (2009). Collagen Structure and Stability. Annual Review of Biochemistry,
78(1), 929–958. https://doi.org/10.1146/annurev.biochem.77.032207.120833
Sieffert, Y., Huygen, J. M., & Daudon, D. (2014). Sustainable construction with repurposed materials in the
context of a civil engineering–architecture collaboration. Journal of Cleaner Production, 67, 125–138.
https://doi.org/10.1016/j.jclepro.2013.12.018
Sierra-Pérez, J., Boschmonart-Rives, J., & Gabarrell, X. (2016). Environmental assessment of façade-building
systems and thermal insulation materials for different climatic conditions. Journal of Cleaner Production,
113, 102–113. https://doi.org/10.1016/j.jclepro.2015.11.090
Sinka, M., Van den Heede, P., De Belie, N., Bajare, D., Sahmenko, G., & Korjakins, A. (2018). Comparative life
cycle assessment of magnesium binders as an alternative for hemp concrete. Resources, Conservation
and Recycling, 133, 288–299. https://doi.org/10.1016/j.resconrec.2018.02.024

61
Stevens, J. R., Newton, R. W., Tlusty, M., & Little, D. C. (2018). The rise of aquaculture by-products: Increasing
food production, value, and sustainability through strategic utilisation. Marine Policy, 90, 115–124.
https://doi.org/10.1016/j.marpol.2017.12.027
Stevens, J. R., Newton, R. W., Tlusty, M., & Little, D. C. (2018). The rise of aquaculture by-products: Increasing
food production, value, and sustainability through strategic utilisation. Marine Policy, 90, 115–124.
https://doi.org/10.1016/j.marpol.2017.12.027
Tettey, U. Y. A., Dodoo, A., & Gustavsson, L. (2014). Effects of different insulation materials on primary energy
and CO2 emission of a multi-storey residential building. Energy and Buildings, 82, 369–377.
https://doi.org/10.1016/j.enbuild.2014.07.009
Tiong, H. Y., Lim, S. K., Lee, Y. L., Ong, C. F., & Yew, M. K. (2020). Environmental impact and quality assessment
of using eggshell powder incorporated in lightweight foamed concrete. Construction and Building
Materials, 244, 118341. https://doi.org/10.1016/j.conbuildmat.2020.118341
Torres-Rivas, A., Palumbo, M., Haddad, A., Cabeza, L. F., Jiménez, L., & Boer, D. (2018). Multi-objective
optimisation of bio-based thermal insulation materials in building envelopes considering condensation
risk. Applied Energy, 224, 602–614. https://doi.org/10.1016/j.apenergy.2018.04.079UNEP. (2013).
United Nations Environmental Program, UNEP's achievement in the key focus areas of Climate Change
United Nations & Environment Programme. (2014). UNEP annual report 2013. United Nations
Environment Programme (UNEP).
Vamsi, P. S. S., & SivaRaja, N. (2014). Life Cycle Assessment of a Green Building Material – A Review.
International Journal of Emerging Trends in Engineering and Development, 4, 12.
62
Wang, Z., Lei, T., Yan, X., Chen, G., Xin, X., Yang, M., Guan, Q., He, X., & Gupta, A. K. (2019). Common
characteristics of feedstock stage in life cycle assessments of agricultural residue-based biofuels. Fuel,
253, 1256–1263. https://doi.org/10.1016/j.fuel.2019.05.105
Yeheyis, M., Hewage, K., Alam, M. S., Eskicioglu, C., & Sadiq, R. (2013). An overview of construction and
demolition waste management in Canada: A lifecycle analysis approach to sustainability. Clean
Technologies and Environmental Policy, 15(1), 81–91. https://doi.org/10.1007/s10098-012-0481-6
Yılmaz, E., Arslan, H., & Bideci, A. (2019). Environmental performance analysis of insulated composite facade
panels using life cycle assessment (LCA). Construction and Building Materials, 202, 806–813.
https://doi.org/10.1016/j.conbuildmat.2019.01.057
Zampori, L., Dotelli, G., & Vernelli, V. (2013). Life Cycle Assessment of Hemp Cultivation and Use of Hemp-
Based Thermal Insulator Materials in Buildings. Environmental Science & Technology, 47(13), 7413–
7420. https://doi.org/10.1021/es401326a
Zhou, C., Shi, S. Q., Chen, Z., Cai, L., & Smith, L. (2018). Comparative environmental life cycle assessment of
fiber reinforced cement panel between kenaf and glass fibers. Journal of Cleaner Production, 200, 196–
204. https://doi.org/10.1016/j.jclepro.2018.07.200

63
Appendix A: Raw data for fish binder production
(Enova, 2007–2010). Norway 181 Kwh/ live tonne fish
For estimation of the average specific energy consumption (kWh/tonne), obtained values were divided by the hourly production volume at the respective facility.
132 Kwh/tonne Distribution of energy consumption by the remaining operations were ventilation (10 %), pumping (4 %), space heating (3 %), pressurized air (3 %), illumination (2 %), and unspecified (9 %).
112 Kwh/tonne 99 Kwh/tonne Baris Atesa, Kristina N. Widellb, Tom Ståle Nordtvedtb, Andreea-Laura Cojocaruc - Norway (2017)
85.3 Kwh/tonne Lowest power consumption during May and June - South slaughtering plants
83.8 Kwh/tonne Lowest power consumption during May and June - South Norway slaughtering plant 126.8 Kwh/tonne Highest energy during January and October - South Norway slaughtering plant 130.7 Kwh/tonne Highest energy during January and October - South Norway slaughtering plant 90 Kwh/tonne Lowest energy during November and December - Central Norway slaughtering plant 91.8 Kwh/tonne Lowest energy during November and December - Central Norway slaughtering plant 119.3 Kwh/tonne Highest energy during November and December - Central Norway slaughtering plant
136 Kwh/tonne Highest energy during November and December - Central Norway slaughtering plant
Winther and Ziegler et al (2009) 3.5
Lts water / Ton live weight salmon
Amount of water per ton of life weight salmon processed
Bruguera, Limso, Lopez, Resnick, Tadlaoui (N/A) 4.2
Lts water / Ton live weight salmon
Retreived from https://www.google.com/search?q=Bruguera%2C+Limso%2C+Lopez%2C+Resnick%2C+Tadlaoui&rlz=1C5CHFA_enCA935CA935&oq=Bruguera%2C+Limso%2C+Lopez%2C+Resnick%2C+Tadlaoui&aqs=chrome..69i57.587j0j7&sourceid=chrome&ie=UTF-8
Total average Energy consumption 116,91 kwh/tonne of live weigh Calculated
Total average water consumption 3879 Lt/tonne Calculated Total energy consumed Per Fillet produced 0,211 Kwh/ kg of
fillet Calcul;ated
Total water consumed Per Fillet produced 7.0 lts/ kg of fillet
Total energy consumption including fish clean equipment 0.230 Kwh/1 kg of
fillet
Rates of consumption can vary considerably depending on the scale and age of the plant, the type of processing, the level of automation, and the ease with which equipment can be cleaned, as well as operator practices