life cycle assessment of future electric and hybrid ...discovery.ucl.ac.uk/1503806/1/tagliaferri...
TRANSCRIPT
1
Life cycle assessment of future electric and hybrid 1
vehicles: a cradle-to-grave systems engineering approach 2
Carla Tagliaferri1, Sara Evangelisti1, Federica Acconcia2, Teresa Domenech3, Paul Ekins3, Diego Barletta2, 3
Paola Lettieri1* 4
1Chemical Engineering Department, University College London, Torrington Place, London WC1E 7JE, UK 5
2Dipartimento di Ingegneria Industriale, Università di Salerno, Via Giovanni Paolo II, 132, I-84084 Fisciano 6
(SA), Italy 7
3University College London, Institute for Sustainable Resources, Central House, 14 Upper Woburn Place, 8
London WC1H 0NN, UK 9
*corresponding author: Department of Chemical Engineering, UCL, Torrington Place, Roberts Building, Room 10
312, London WC1E 7JE, UK. Tel.: +44 (0) 20 7679 7867; fax: +44 (0) 20 7383 2348. Email: 11
Abstract 13
Electric mobility is playing an important and growing role in the context of sustainable transport sector 14
development. This study presents the life cycle assessment of an electric car based on the technology of 15
Lithium-ion battery (BEV) for Europe and compares it to an internal combustion engine vehicle (ICEV). 16
According to a cradle-to-grave approach, manufacturing, use and disposal phases of both vehicles have been 17
included in the assessment in order to identify the hot spots of the entire life cycles. For electric vehicles two 18
manufacturing inventories have been analysed and different vehicle disposal pathways have also been 19
considered. Furthermore, the environmental performances of hybrid vehicles have been analysed based on the 20
life cycle models of the BEV and ICEV. The results of the hot spot analysis showed that the BEV 21
manufacturing phase determined the highest environmental burdens mainly in the toxicity categories as a result 22
of the use of metals in the battery pack. However, the greenhouse gas emissions associated with the BEV use 23
phase were shown to be half than those recorded for the ICEV use phase. The trend of the results have also been 24
investigated for future energy mixes: the electricity and diesel mixes for the year 2050 have been considered for 25
the modelling of the use phase of BEV and ICEV. 26
Keywords: life cycle assessment of electric vehicles; electric battery disposal; future energy scenarios. 27
1.Introduction 28
The transport sector is one of the most appealing and challenging when tackling the target of emissions 29
reduction: currently, the CO2 emissions in the transport sector are about 23% of the total antropogenic CO2 30
emissions worldwide (UNECE 2015). In addition to this, a study commissioned by the World Business Council 31
for Sustainable Development (World Business Council for Sustainable Development 2004) estimates that the 32
number of light-duty vehicles in operation will rise to about 1.3 billion by 2030 and 2 billion by 2050. Hence, 33

2
there will be a dramatic increase in demand for fuel supplies associated with transport, which raises issues for 34
climate change, urban air quality as well as non-renewable resources depletion. This has pushed towards the 35
development of new technologies in the automotive industry. 36
One possible solution for decreasing the carbon footprint of the transport sector is the use of biogenic carbon 37
content fuels (such as cellulosic ethanol or soy biofuel) in conventional internal combustion engine vehicles, 38
instead of the regular fuel supply (Samaras and Meisterling 2008). However, the production of bio-fuel has well 39
known drawbacks when applied to large scale, mainly associated with pressure on land that would otherwise be 40
used for agricultural purposes. In addition to this, bio-electricity powered electric vehicles can offer higher 41
mileage per unit of biomass than when liquid biofuels such as ethanol are used in a conventional internal 42
combustion engine (IEA Bioenergy 2011) 43
The generic term ‘electric vehicle’ refers to several types of vehicles that differ for the share of electricity used 44
for traction over conventional fuels: purely battery-driven electric vehicles (BEVs), hybrid electric vehicles 45
(HEVs), plug-in hybrid electric vehicles (PHEVs) and extended range electric vehicles (E-REVs). The use of 46
electricity for the transport sector is also promising for having the potential to reduce greenhouse gas emissions 47
compared to ICEVs thanks to the avoided or reduced requirements of diesel or gasoline as fuel supply. 48
According to Zackrisson et al. (2010) the potential savings in GHG range is between 25% for hybrid EVs, up to 49
50-80% for plug-in hybrid EVs and about 90% for battery EVs. Moreover, a very wide range of road vehicles 50
can use electric power for motion: from heavy duty vehicles- such as hybrid buses and tramways to light duty 51
ones, including city cars, forklift trucks etc. Each type of vehicle can use various battery technologies, such as 52
Lithium-ion battery (Li-ion), Nickel Metal Hydride (NiMH), lead acid, nickel cadmium batteries, each 53
characterised by specific properties (specific power, depth of discharge (DoD), memory effect, number of 54
charges per cycle, etc.). 55
However, the use of heavy metals for battery manufacturing, the electricity mix used for charging the battery 56
and the disposal of the used battery are key aspects in the life cycle of an electric vehicle that need to be 57
carefully considered under a life cycle approach to identify possible sources of increased environmental impacts. 58
In Wietschel et al. (2013), electric cars are reported to be increasingly penetrating the future fleet market but 59
they are also facing the most technological challenges today. Because of that, the environmental impacts 60
associated with the manufacturing, use phase and end of life of electric cars need to be analysed. 61
Some environmental assessment studies on EV, differing in scopes and details of analysis, have already been 62
performed. For examples, many (Samaras and Meisterling 2008; Aguirre et al. 2012; Helmers and Marx 2012; 63
Dunn et al. 2012b; Faria et al. 2013) mainly focused on the analysis of the energy requirements and the 64
greenhouse gas emissions throughout the vehicle life cycle. In particular, the latter calculated the energy inputs 65
and CO2 equivalents emissions of a conventional gasoline vehicle, a hybrid vehicle, and a battery electric 66
vehicle for California referring to the aggregated inventory data reported in a model previously developed by the 67
US Argonne National Laboratory (Sullivan et al. 2010; Sullivan and L. 2010); however, a detailed description of 68
the inventory data and model parameters was not available. The same is also true for other two studies (Van den 69
Bossche et al. 2006; Matheys et al. 2008) who reported an aggregated environmental impacts of different 70
electric batteries used for motion, calculated according to the grouping phase of the life cycle assessment (LCA) 71
methodology. Ellingsen et al. (2014) and Bettez et al. (2011a) published the environmental assessment of the 72
manufacturing phase of different types of electric batteries but they did not consider the entire life cycle of the 73

3
vehicles. Conversely, Daimler AG (2009) and Zackrisson et al. (2010) reported the results of LCA studies on 74
batteries used for hybrid vehicles accounting also for the entire life cycle of the vehicles. Finally, the most 75
detailed and complete studies on BEV are those by Notter et al. (2010) and Hawkins et al (2013) that reported 76
the life cycle assessment of the entire life cycle of the vehicle, analysing also different environmental impacts. 77
However, in both studies the results of the disposal phase were entirely based on the Ecoinvent database (Swiss 78
Centre for Life Cycle Inventories 2014). 79
The purpose of this study is to perform an attributional life cycle assessment of the manufacturing, use and 80
disposal phases of BEVs and hybrid vehicles, and compare it to the life cycle of a conventional vehicle, such as 81
diesel ICEVs. All the components of the vehicle, including the battery system, the glider, and the power train 82
are analysed in the hot spot analysis. As shown before, many LCA studies have been conducted on batteries for 83
electric vehicles. However, very few studies have analysed the entire life cycle of vehicles, including both the 84
battery and the rest of the vehicle and have considered the disposal phase based on an industrially developed 85
technology as done in this study. In addition to this, few studies considered the effect of different energy shares 86
on the environmental impacts of the electric vehicle life cycle. Egede et al. (2015) reported that the electricity 87
mix is a crucial parameter for the LCA calculation and this is also supported by the results reported in Faria et 88
al. (2013) where the electricity mix of different countries in 2013 were considered. However, the latter fails to 89
consider the potential development of the electric vehicle fleet within the projected future energy mixes. 90
Conversely, our study considers referenced projections of the future EU electricity share and therefore 91
contextualises the study of the environmental burdens of electric vehicles to more realistic future scenarios. 92
2.Life cycle assessment methodology 93
Life cycle assessment is one of the most developed and widely used environmental assessment tools for 94
comparing alternative technologies (Clift et al. 2000; Clift 2013). LCA quantifies the amount of materials and 95
energy used and the emissions and waste over the complete supply chain (i.e. life cycles) of goods and services 96
(Baumann and Tillman 2004). Moreover, it helps to identify the ‘hot spots’ in the system; i.e. those activities 97
that determine the most significant environmental impact and should be targeted in the first instance, thus 98
enabling identification of more environmentally sustainable options (Clift 2006). 99
In the Impact Assessment phase, the emissions and inputs quantified in the Inventory phase are translated into 100
environmental impacts. This study focuses specifically on three impact categories - showed in Table 1 - which 101
are considered the most significant for the purpose of this work. However, other impact categories as suggested 102
by ILCD handbook have been analysed in this study (ILCD 2011). For a full list of categories see 103
Supplementary Information. 104
The global warming potential (GWP) characterises and calculates the impact of greenhouse gases based on the 105
extent to which they enhance radiative forcing. GWP values for specific gases, developed by the 106
Intergovernmental Panel on Climate Change (IPCC), express the cumulative radiative forcing over a given time 107
period following a pulse emission in terms of the quantity of carbon dioxide giving the same effect (IPCC 108
2007). Following common convention, such as the Kyoto Protocol, the 100-year values have been used here. 109
The abiotic depletion (AD) addresses the environmental problem of the diminishing pool of resources. It focuses 110
on the depletion of non-living resources such as iron ore, crude oil, etc. The measurement unit of abiotic 111
depletion is MJ as the majority of non-renewable resources represent energy sources. The human toxicity 112
4
potential (HTP) reflects the potential harm of chemical species released into the environment, based on both the 113
inherent toxicity of a compound and the potential human exposure. 114
Currently more than thirty software packages exist to perform LCA analysis, with differing scope and capacity: 115
some are specific for certain applications, while others have been directly developed by industrial organisations 116
(Manfredi and Pant 2011). In this study, GaBi 7 has been used (Thinkstep 2015); it contains databases 117
developed by ThinkStep that incorporates industry organisations’ databases (e.g. Plastics Europe, Aluminium 118
producers, etc.) and also regional and national databases (e.g. Ecoinvent, US NREL database, etc.). 119
Table 1 Impact categories and indicators used in this study 120
Impact categories Impact Indicator Acronym Carachterisation model Units
Climate change Global warming
potential GWP
CML 2001 baseline (IPCC
2007) kg CO2eq
Resources depletion
(fossil) Abiotic depletion AD
CML 2001 baseline (Guinée
et al., 2001) MJ
Human toxicity Human toxicity
potential HTP
USEtox model (Rosembaum
et al., 2008)
kg DCB1
eq
Note: 1 DCB: dichlorobenzenes. 121
3. Goal and scope definition and system boundaries 122
The main goal of this paper is to perform an attributional life cycle analysis with a consequential approach of a 123
battery electric vehicle (BEV), and compare it with the life cycle impacts of a more conventional technology, 124
such as an internal combustion engine diesel vehicle (ICEV). Moreover, a hot spot analysis to identify the steps 125
with the highest impacts to the total life cycle is presented. The two models for ICEV and BEV are used to 126
analyse the environmental impacts of different types of hybrid vehicles. Two different scenarios are also 127
considered for the end-of-life phase: a ‘high recycling rate’ scenario – where the total vehicle is assumed to be 128
recovered in EU at its EoL; and a ‘low recycling rate’ scenario, where a fraction of the vehicle is assumed to be 129
landfilled outside EU borders. While the former is more unrealistic, the latter represents the current situation of 130
the vehicle EoL market in Europe where part of the fleet exits the EU borders (Mehlhart et al. 2011). A final 131
scenario analysis considers future EU energy technologies and mixes. 132
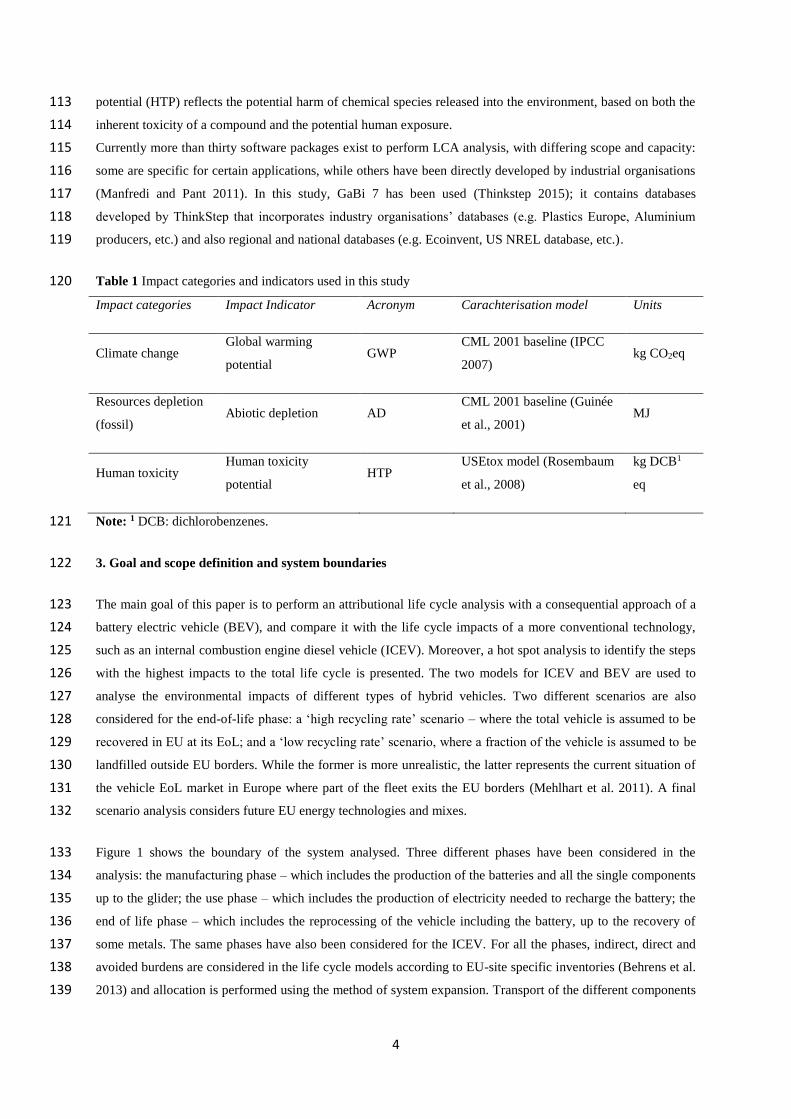
Figure 1 shows the boundary of the system analysed. Three different phases have been considered in the 133
analysis: the manufacturing phase – which includes the production of the batteries and all the single components 134
up to the glider; the use phase – which includes the production of electricity needed to recharge the battery; the 135
end of life phase – which includes the reprocessing of the vehicle including the battery, up to the recovery of 136
some metals. The same phases have also been considered for the ICEV. For all the phases, indirect, direct and 137
avoided burdens are considered in the life cycle models according to EU-site specific inventories (Behrens et al. 138
2013) and allocation is performed using the method of system expansion. Transport of the different components 139
5
to the production and dismantling sites- manufacturing and disposal phases - is considered negligible as already 140
analysed in literature (Hawkins et al. 2013). 141
The functional unit used in this study is the function of 1 km driven by one vehicle (car). To account for the 142
manufacturing and the disposal phase, an assumption of the total km driven in the entire life cycle of the vehicle 143
was made. Based on previous studies (Majeau-Bettez et al. 2011a; Ellingsen et al. 2014), a total life cycle of 144
150,000 km is considered for both BEVs and ICEVs. 145
146
Figure 1 System boundary 147
4. Life cycle inventory 148
In this section, the inventory models built for the BEV and ICEV are presented. The inventory was based on a 149
mix of data coming from several literature studies published in the recent years on BEVs and plug-in vehicles, 150
existing dataset (Swiss Centre for Life Cycle Inventories 2014; Thinkstep 2015), and reports and presentation 151
from private companies (Umicore 2015). 152
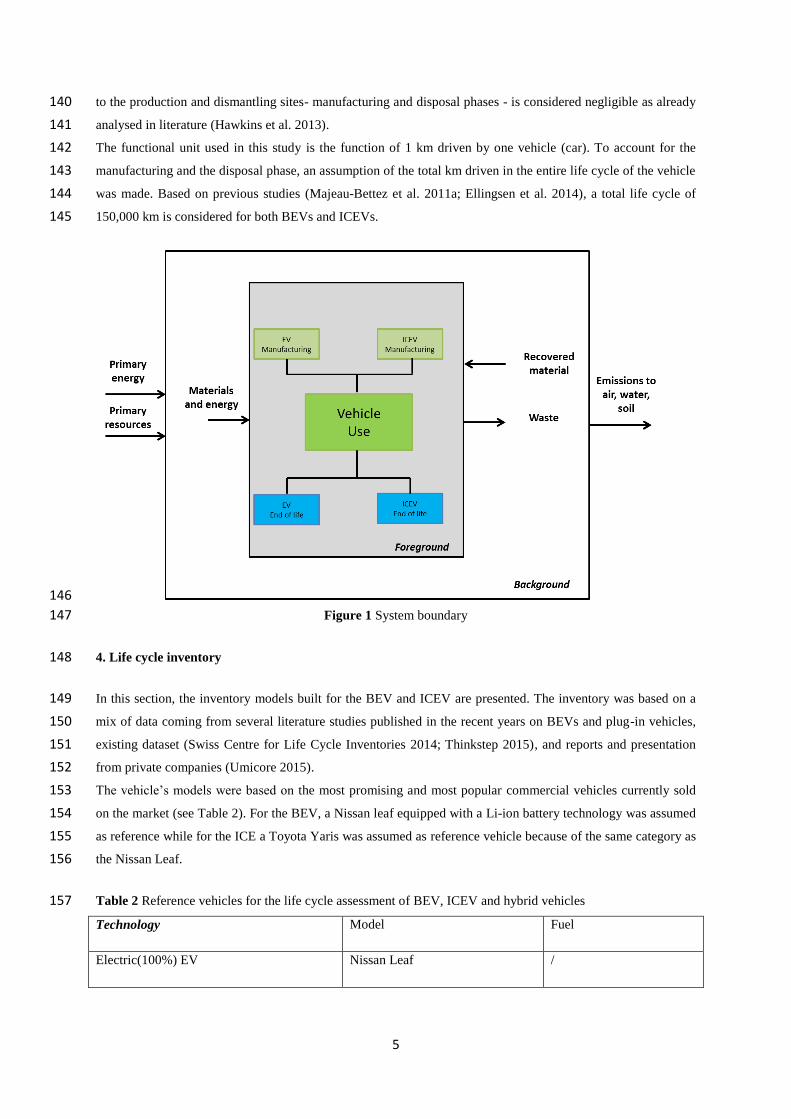
The vehicle’s models were based on the most promising and most popular commercial vehicles currently sold 153
on the market (see Table 2). For the BEV, a Nissan leaf equipped with a Li-ion battery technology was assumed 154
as reference while for the ICE a Toyota Yaris was assumed as reference vehicle because of the same category as 155
the Nissan Leaf. 156
Table 2 Reference vehicles for the life cycle assessment of BEV, ICEV and hybrid vehicles 157
Technology Model Fuel
Electric(100%) EV Nissan Leaf /
6
Hybrid(30%) HEV Yaris Hybrid Diesel
Hybrid(60%) P-HEV Toyota Prius Plug-in Diesel
'Hybrid'(90%) E-REV Toyota Prius Diesel
Internal Combustion Engine ICEV Toyota Yaris Diesel
4.1 Manufacturing 158
The vehicle is composed by several units, which can be divided in sub-units up to the single component. The 159
two main macro units which have been considered in the vehicle models are the powertrain (electric motor and 160
battery system for the BEV and the internal combustion engine for the ICEV) and the glider. For both ICEV and 161
BEV, the model for the glider was based on Ecoinvent 2.1 (Swiss Centre for Life Cycle Inventories 2014). 162
Battery electric vehicle 163
Two different models were considered for the manufacturing of the BEV, in order to test the robustness of the 164
results. The first model (EV I) was based on the study published by Bettez et al. (2011a). In their study, Bettez 165
et al. based the LCA inventory on average literature data for the manufacturing of the battery. The second model 166
(EV II) was based on the study published by Ellingsen et al. (2014). Their inventory was based on an existing 167
battery, and the dataset for this was built using a mix of average and commercial data supplied by the battery 168
manufacturing company (Miljøbil Grenland 2012). 169
The powertrain of the battery electric vehicle includes all the units of the BEV excluding the glider. In total, the 170
weight of the glider and the powertrain excluding the battery was 1307 kg and 1271 kg for EVI and EVII, 171
respectively, in order to match a total weight for the BEV equal to the Nissan leaf. The weight of the Li-Ion 172
battery was 214 and 250 kg for EVI and EVII, corresponding to a specific power of 112 and 106 Wh/kg. Table 3 173
shows the characteristics of the Nissan Leaf assumed in this study. 174
Nissan Leaf
Curb weight kg 1521
Length cm 444.5
Width cm 177
Height cm 155
Body style
5-door
hatchback
Electric
motor kW 80
Battery (Li-
Ion) kWh 24
Range km 117
7
(EPA1)
km
(NEDC2) 175
Energy per
km
Wh
(NEDC) 173
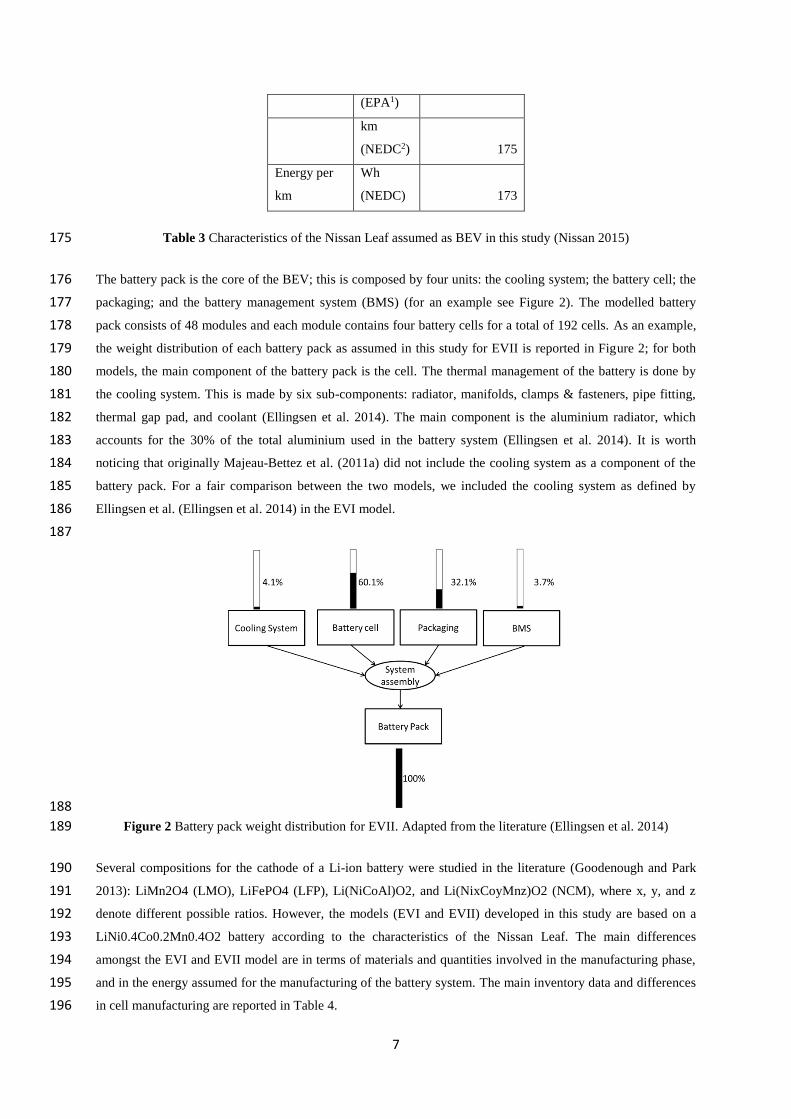
Table 3 Characteristics of the Nissan Leaf assumed as BEV in this study (Nissan 2015) 175
The battery pack is the core of the BEV; this is composed by four units: the cooling system; the battery cell; the 176
packaging; and the battery management system (BMS) (for an example see Figure 2). The modelled battery 177
pack consists of 48 modules and each module contains four battery cells for a total of 192 cells. As an example, 178
the weight distribution of each battery pack as assumed in this study for EVII is reported in Figure 2; for both 179
models, the main component of the battery pack is the cell. The thermal management of the battery is done by 180
the cooling system. This is made by six sub-components: radiator, manifolds, clamps & fasteners, pipe fitting, 181
thermal gap pad, and coolant (Ellingsen et al. 2014). The main component is the aluminium radiator, which 182
accounts for the 30% of the total aluminium used in the battery system (Ellingsen et al. 2014). It is worth 183
noticing that originally Majeau-Bettez et al. (2011a) did not include the cooling system as a component of the 184
battery pack. For a fair comparison between the two models, we included the cooling system as defined by 185
Ellingsen et al. (Ellingsen et al. 2014) in the EVI model. 186
187
188
Figure 2 Battery pack weight distribution for EVII. Adapted from the literature (Ellingsen et al. 2014) 189
Several compositions for the cathode of a Li-ion battery were studied in the literature (Goodenough and Park 190
2013): LiMn2O4 (LMO), LiFePO4 (LFP), Li(NiCoAl)O2, and Li(NixCoyMnz)O2 (NCM), where x, y, and z 191
denote different possible ratios. However, the models (EVI and EVII) developed in this study are based on a 192
LiNi0.4Co0.2Mn0.4O2 battery according to the characteristics of the Nissan Leaf. The main differences 193
amongst the EVI and EVII model are in terms of materials and quantities involved in the manufacturing phase, 194
and in the energy assumed for the manufacturing of the battery system. The main inventory data and differences 195
in cell manufacturing are reported in Table 4. 196

8
EVI Model EVII Model
Material requirements
Active material positive electrode paste
LiNi0.4Co0.2Mn0.4O2 0.20184
Active material positive electrode paste LiNi0.4Co0.2Mn0.4O2 [kg/kg of
battery] 0.218
Carbon black (furnace black) [kg/kg of battery] 0.0116 Carbon black (furnace black) [kg/kg of battery] 0.00464
N-methyl-2-pyrrolidone [kg/kg of battery] 0.064953271 N-methyl-2-pyrrolidone [kg/kg of battery]
0.0952
Tetrafluoroethylene [kg/kg of battery] 0.01856
Polyvinylfluoride [kg/kg of battery] 0.00928
Negative electrode paste Negative electrode paste
Graphite, battery grade [kg/kg of battery] 0.0893
Graphite, battery grade [kg/kg of battery] 0.0964
N-methyl-2-pyrrolidone [kg/kg of battery] 0.02632
N-methyl-2-pyrrolidone [kg/kg of battery] 0.094
Tetrafluoroethylene [kg/kg of battery] 0.0047
Acrylic acid [kg/kg of battery] 0.002
Carboxymethyl cellulose, powder [kg/kg of battery] 0.002
Energy requirements
Electricity for assembly [MJ/kg of battery] 27
Electricity for assembly [MJ/kg of battery] 100.8014
Heat for assebly and electrode pastes [MJ/kg of battery] 30
Heat [MJ/kg of battery] /
Table 4 Main inventory for the two BEV models in terms of materials and energy requirements 197
The EVI and EVII models differ basically in chemicals used (except the active material which is the same) and 198
their quantities and structure complexity. For both Li-ion batteries, the anode is composed primarily of graphite; 199
acrylic acid and carboxymethyl cellulose in EVII substitute tetrafluoroethylene in EVI. The assumed energy 200
required for the manufacturing of the battery system can vary greatly amongst the literature, from 3.1 to 1060 201
MJ/kWh (Ellingsen et al. 2014). In particular, this figure is considerably different for the two battery models 202
analysed. Ellingsen et al. (2014) assumed an energy requirement of 586 MJ/kWh based on industrial data, while 203
Majeau-Bettez et al. (2011a) reported an energy consumption between 371 and 473 MJ/kWh based on industry 204
reports. Moreover, while Ellingsen et al. (2014) refers to the energy required to manufacture the battery cell, the 205
figure proposed by Majeau-Bettez et al. (2011a) included also the energy for the battery system assembling. The 206
electricity assumed for the manufacturing of the cell in EVI includes the coating of the electrode pastes to 207
metallic foils used as current collectors, welding of current collectors to tabs, filling of electrolyte, and initial 208
charging of the finished cell. However, as reported by Ellingsen et al. (2014) the main consumption is due to the 209
operation of various dry rooms that are vital to the quality of the battery cells. This explains also the difference 210
in energy consumption assumed in EVI and EVII. 211
In order to ensure the comparability of the results, the energy accumulated by the battery and then delivered to 212
the powertrain, was fixed to 24 kWh (Genikomsakis et al. 2013; Nissan 2015) for the two BEV models. The two 213
batteries have equal charge capacity but different weight (214 kg for the EVI vs 250 kg for EVII). 214
Internal combustion engine vehicle 215

9
The inventory for the ICEV manufacturing phase is based on Ecoinvent 2.2 database (Swiss Centre for Life 216
Cycle Inventories 2014). The model was built according to a life cycle inventory analysis based on a “Golf A4, 217
1.4 l Otto” (Leuenberger and Frischknecht 2010). The whole life cycle inventory as reported by Ecoinvent was 218
scaled up to match the total weight of the Toyota Yaris, which was 1500 kg. The emissions to air during the 219
manufacturing process are assumed to result from stationary combustion processes at the factory site (Swiss 220
Centre for Life Cycle Inventories 2014). 221
4.2 Use 222
In the use phase we have accounted for the emissions due to the use of the vehicles (direct emissions) and for 223
the emissions due to the production of the fuel (indirect emissions), i.e. electricity for BEV and diesel for ICEV. 224
Battery electric vehicle 225
The energy consumption reported in the literature varies significantly depending on the assumption of battery 226
cycles and lifetime. In this study, we assumed a lifetime of 150,000 km for the BEV, in line with literature 227
(Notter et al. 2010). The electric energy needed to drive 1 km was assumed equal to 0.56 MJ/km, based on 228
Ecoinvent 2.2, with a powertrain efficiency of 80% in a standard driving cycle (New European Driving Cycle, 229
NEDC). This is similar to the consumption reported in the literature (Notter et al. 2010), which shows an 230
electrical consumption of 17 kWh for 100 km, referred to a combination of the urban (12.8 kWh/100km) and 231
extra-urban (16.8 kWh/100km) energy consumption in a NEDC, plus the consumption of heating and air 232
conditioning during one year. A slightly lower electrical consumption was assumed by other authors (Majeau-233
Bettez et al. 2011a; Ellingsen et al. 2014), corresponding at 3,000 cycles for the battery lifetime, and equals to 234
0.5 MJ/km. No battery package replacement was considered during the vehicle life (Notter et al. 2010). 235
In this study we have assumed an electricity production mix for the BEV use phase which is representative of 236
the European electricity grid. The inventory was based on Thinkstep database (Thinkstep 2015) and it is 237
dominated by nuclear energy (mainly from France), hard coal and natural gas which alone constitute around 238
64% of the total primary energy. The sensitivity of the model to the electricity mix is considered in the future 239
energy scenarios analysis. 240
Internal combustion engine vehicle 241
For the ICEV use phase we have assumed the same lifetime of the BEV, which is 150,000 km. The fuel 242
consumption was 50.04 mL/km, based on Ecoinvent 2.2 (Spielmann et al. 2007; Swiss Centre for Life Cycle 243
Inventories 2014). A EURO 5 vehicle was modelled, in accordance to the most recent European regulations on 244
the subject. 245
The model for the diesel production was based on Thinkstep database (Thinkstep 2015). The data set covered 246
the entire supply chain of the refinery products. Country / region specific downstream (refining) technologies, 247
feedstock (crude oil) and product (diesel fuel, etc.) properties, like sulphur contents, were considered. The 248
sensitivity of the model to the diesel mix is considered in the future energy scenarios. 249

10
4.3 Disposal 250
In the disposal phase models of the ICEV and BEV, the valuable outputs considered by system expansion are 251
the metals: mainly nickel, cobalt, manganese, aluminium, copper and steel. The latter is the main component, in 252
weight, of the glider; conversely, nickel, cobalt and manganese are mainly found in the battery pack of the BEV. 253
The recycling of each of the previous metal was considered together with the processes required for recovery. 254
For the ICEV disposal, precious metals have been included in the assessment according to Ecoinvent (Swiss 255
Centre for Life Cycle Inventories 2014). 256
A scenario analysis was performed on the disposal phase of BEV and ICEV. In the ‘high recycling rate’ 257
scenario the entire vehicle fleet was assumed to be recycled and disposed within the EU borders according to the 258
later described EoL. Conversely, in the ‘low recycling rate’ scenario only 57% of the vehicle fleet was assumed 259
to be disposed in EU (Mehlhart et al. 2011); part of the fleet was considered to be sold outside the EU borders 260
(Mehlhart et al. 2011) and track was lost of it. However, in order to account for the EoL of these vehicles, an 261
assumption was made on their final disposal: in the ‘low recycling rate’ scenario 43% of the fleet was assumed 262
to end up in a material landfill outside EU. To model this, the ‘Landfill of ferro metals’ process was considered. 263
Battery electric vehicle 264
Two steps have been considered for the end of life treatment of BEV. The first refers to the disposal of the 265
glider and the power train excluding the battery and the model for this is based on Ecoinvent v.2.2; the second, 266
involving the battery disposal after dismantling, has been modelled according to currently used technologies in 267
specialised industries (Umicore 2015). 268
The modelled process for the battery disposal firstly involves a single-furnace pyro-metallurgical treatment 269
method for the treatment of Li-Ion batteries and Li-polymer cells, as well as nickel metal hydride (NiMH) 270
batteries (Vadenbo 2009). The main focus of the process is the recovery of cobalt and/or nickel. Cobalt is 271
commonly found in lithium-ion and lithium-polymer batteries, whereas nickel is mainly introduced into the 272
process through the treatment of NiMH batteries. Publicly available data for the pyro-metallurgical process 273
(Vadenbo 2009; Dunn et al. 2012a; Umicore 2015) and the battery disposal process (Hischier and Gallen 2007) 274
have been put together to build a novel battery disposal model. The process for the battery disposal and the 275
relative inventory is reported in Figure 3. Material recycling is also considered. 276
The slag is mainly formed by compounds containing aluminium (Al), silicon (Si), calcium (Ca) and to some 277
extent iron (Fe). In the process, lithium also ends up in the slag in the form of lithium oxide. The slag can be 278
used in the construction or concrete industry (Vadenbo 2009). However, in this model, slag use was not 279
considered because the amount of the slag produced compared to the weight of the entre vehicle is negligible. 280
The alloy fraction is predominantly made up of residual iron, copper, cobalt, and possibly nickel. The alloy is 281
subsequently leached with sulfuric acid in a hydrometallurgical step which extracts metals like cobalt, copper, 282
nickel and iron (Vadenbo 2009). Hence, the model has included two pathways: pyro-metallurgical treatment and 283
hydrometallurgical treatment and the allocation of the two pathways has been done at 50% each. 284

11
The recovery rate of the metals from the pyro and hydrometallurgical processes was based on data elaborated by 285
different authors in the literature (Vadenbo 2009; Dunn et al. 2012a). Considering 1 kg of Li-Ion battery, these 286
recovery rates for the following metals were considered: 287
7.7% Co (Pyro) 288
13.6% Co (Hydro) 289
9.6% Cu (Pyro) 290
10.8% Steel (Pyro) 291
6.6% Steel (Hydro) 292
6% Ni (Hydro) 293
To account for the avoided burdens due to the recovery of these metals, primary production processes were 294
considered in the system expansion according to the market recycling rates (Graedel 2011; Thinkstep 2015). 295
296 Figure 3 Process flow chart for disposal of lithium-ion battery. This model was adapted and built on the base of 297
the data available in literature (Hischier and Gallen 2007; Vadenbo 2009; Dunn et al. 2012a; Umicore 2015) 298
Internal combustion engine vehicle 299
The disposal of the ICEV is based on Ecoinvent database (Swiss Centre for Life Cycle Inventories 2014). It 300
accounted for 100% recycling of aluminium, copper and steel contained in the vehicle. The rest of the materials 301
was assumed to be sent to an incineration plant after dismantling (Swiss Centre for Life Cycle Inventories 302
2014). 303
4.4 Scenario analysis: hybrid vehicles and extended range 304
12
Different types of hybrid vehicles have been analysed in the scenario analysis on the base of the BEV and ICEV 305
models. As shown in Table 2, the hybridization factors – that represents the percent of the electric part of 306
powertrain out of the total weight of the powertrain- has been changed between 30% and 90%: the chosen 307
values were 30% for the HEV, 50% for the pHEV and 90% for the E-REV according to the different vehicle 308
technologies reported in Table 2. Table 2 also shows the reference vehicles; Toyota Yaris Hybrid was chosen 309
for the hybrid vehicle and the Toyota Prius for both plug-in hybrid and extended range electric vehicles. 310
Those vehicles normally use gasoline when running on the internal combustion engine; the environmental 311
impacts of gasoline use have been computed even though the results for this case are not reported. This analysis 312
showed that the environmental impacts associated with the use of gasoline in hybrid car did not significantly 313
differ from the environmental impacts of hybrid vehicles run on diesel. Hence, to allow a fairer comparison with 314
the ICEV, we assumed that the required fuel was diesel also when analysing hybrid vehicles. 315
4.5 Scenario analysis: future energy mix 316
The use phase environmental impacts of the ICEVs and BEVs are also compared considering future EU energy 317
mix. For the production of the electricity requirements of the BEV, the EU electricity mix of 2050 was 318
considered according to the data reported in the literature (Behrens et al. 2013). Conversely, for the ICEV we 319
assumed that the diesel mix in 2050 will be made up by 72.8% of conventional diesel and 27.2% of biodiesel 320
according to the IEA (International Energy Agency 2011). Two models were built to calculate the impacts of the 321
electricity production and diesel production 2050 and then these impacts were added up to the use phase of the 322
two types of vehicle. 323
The electricity mix from 2015 to 2050 shows a decrease of energy from fossil sources (about -6% lignite, -1% 324
peat, -9% hard coal, -0.5 %coal gases, -1% heavy fuel oil and -5% natural gas), a 6% increase of nuclear and an 325
increase of all renewable sources (about +3.5% biomass, +2% biogas, +1.8% waste, +1.6% hydro, +8.5% wind, 326
+2% photovoltaic, slightly increase solar thermal). 327
The biodiesel production was modelled according to the soybean-biodiesel model reported in Ecoinvent 328
database (Swiss Centre for Life Cycle Inventories 2014). 329
5 Results 330
5.1 Normalised results 331
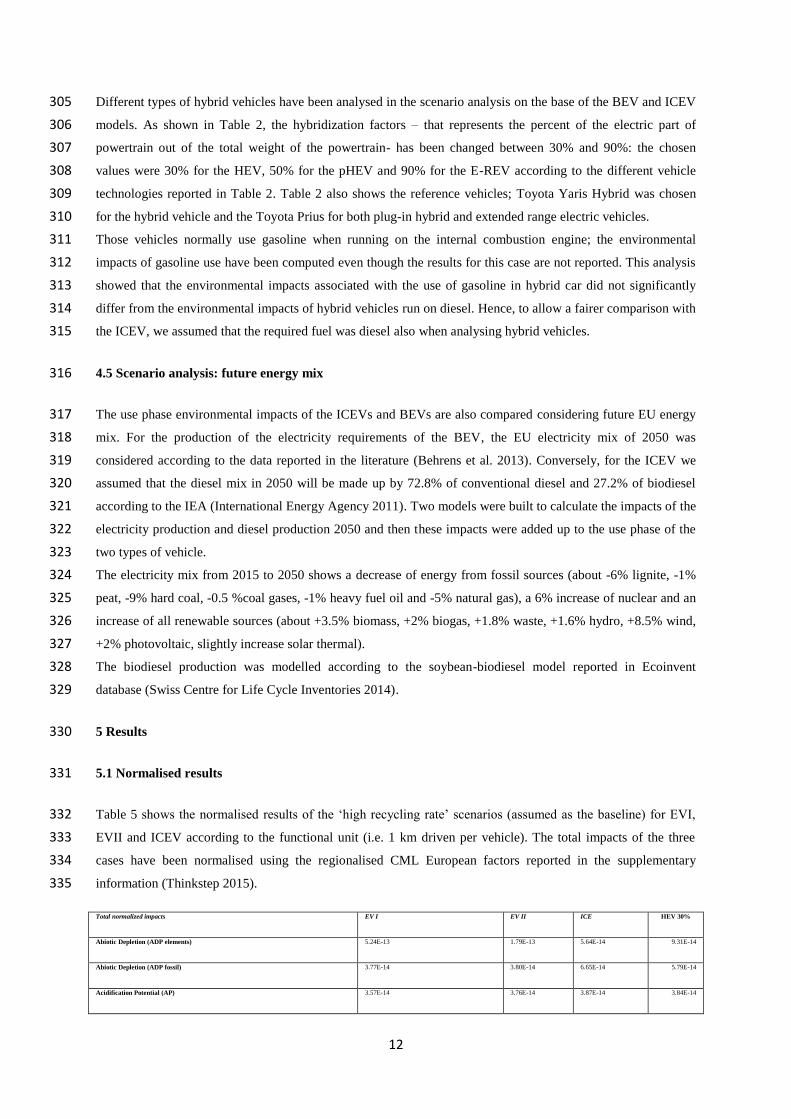
Table 5 shows the normalised results of the ‘high recycling rate’ scenarios (assumed as the baseline) for EVI, 332
EVII and ICEV according to the functional unit (i.e. 1 km driven per vehicle). The total impacts of the three 333
cases have been normalised using the regionalised CML European factors reported in the supplementary 334
information (Thinkstep 2015). 335
Total normalized impacts EV I EV II ICE HEV 30%
Abiotic Depletion (ADP elements) 5.24E-13 1.79E-13 5.64E-14 9.31E-14
Abiotic Depletion (ADP fossil) 3.77E-14 3.80E-14 6.65E-14 5.79E-14
Acidification Potential (AP) 3.57E-14 3.76E-14 3.87E-14 3.84E-14
13
Eutrophication Potential (EP) 9.76E-15 7.64E-15 9.62E-15 9.03E-15
Freshwater Aquatic Ecotoxicity Pot. (FAETP inf.) 1.62E-12 1.56E-12 8.86E-14 5.31E-13
Global Warming Potential (GWP 100 years) 2.30E-14 2.13E-14 3.21E-14 2.89E-14
Human Toxicity Potential (HTP inf.) 1.75E-13 1.42E-13 8.36E-14 2.91E-14
Marine Aquatic Ecotoxicity Pot. (MAETP inf.) 4.06E-12 3.16E-12 8.70E-13 1.01E-13
Ozone Layer Depletion Potential (ODP, steady state) 3.09E-14 2.02E-16 1.28E-16 1.56E-12
Photochem. Ozone Creation Potential (POCP) 3.14E-14 3.25E-14 -5.35E-14 1.50E-16
Terrestric Ecotoxicity Potential (TETP inf.) 8.36E-15 8.23E-15 1.36E-14 -2.77E-14
Table 5 Normalised results of the ‘high recycling rate’ scenarios for EVI, EVII and ICEV. The normalisation 336
was performed according to the European regionalised impacts reported in the GaBi database (EU25+3, year 337
2000, incl biogenic carbon (region equivalents)) 338
The impact indicators related to water (MAETP and FAETP) of EVI and EVII are significantly higher than all 339
other normalised impact indicators; the HTP and the ADP element follow in order of magnitude. The reason of 340
the increased values of those results for the EV models has to be found in the use of precious and non-precious 341
metals during manufacturing. It is common that LCA analysis of processes involving the use of metals show 342
high impacts in the water-related categories (Pizzol et al. 2011). This is related to the extraction and processing 343
of the metal itself. In LCA analysis, the MAETP is sometimes analysed but usually the FAETP is the preferred 344
category for the hot spot analysis as it refers to fresh water impacts; the MAETP is not usually included in the 345
analysis also because the emissions to environment contributing to the FAETP are very similar to those 346
contributing to the MAETP; hence there is no need for giving the same information twice. 347
In LCA, the normalisation of the results is often used to identify the relatively significance of the impact 348
categories and those that score the highest in the normalised results are usually further discussed in the hot spot 349
analysis. However, according to the following reasons, in this work we decided to analyse the ADP fossil, HTP 350
and GWP categories even though they do not determine the highest normalised impacts (a detailed break-down 351
of all the other impact categories is reported in the supplementary information). In this study, more detailed 352
results are reported for the GWP because in the western countries, policies are rarely constraining impacts on 353
water resources as a result of the increased focus on carbon emissions and global warming; GWP was chosen as 354
primary indicator because the majority of ‘green policy’ and targets for climate change are set on greenhouse 355
gas emissions without specifically looking at other indicators or water impacts. The ADP fossil is also analysed 356
to quantify the impact on depletion of fossil resources and thus on use of primary energy; furthermore, the HTP 357
is considered because of the impact of this category on human health. All other environmental indicators are 358
reported in the supplementary information for further information. 359
5.2 Base scenario 360
Figure 4 shows the GWP of the different technologies analysed for the high recycling rate scenario; the total 361
impacts are broken down into the manufacturing, use and disposal phases and the results are reported for the 362
functional unit. 363

14
The total GWPs of the two EV models are very similar (0.12 kg of CO2eq for EVI and 0.11 kg of CO2eq for 364
EVII) whereas the GWP of the ICEV is 45% higher (0.16 kg of CO2eq). The higher GWP of the ICEV is due to 365
the higher impact associated with the use phase: the disposal phase of all models is almost the same; the 366
manufacturing phase of the ICEV determines the lowest GWP and hence, it is the use phase to determine the 367
total trend of the results for the ICEV. The higher GWP of the use phase of the ICEV model is associated to the 368
greater amount of greenhouse gas emitted during the use of diesel as fuel when compared to the production and 369
use of the current EU electricity mix for electric vehicles. For all models the use phase determines the major 370
contribution to the total GWP (61% for EVI, 66% for EVII, 89% for ICEV and 80% for the HEV). Furthermore, 371
for all the scenarios analysed the disposal phase determines a benefit contribution to the environment thanks to 372
the allocation of avoided burdens according to the system expansion method adopted in this work. However, 373
this phase accounts for both the ‘disruptive’ burdens associated with the reprocessing and the ‘beneficial’ 374
burden associated with recycling of metal: the association of these two phases results in the values for the 375
disposal phase reported in Figure 4. Overall the disposal phase does not strongly contribute to the total 376
environmental burdens of the technologies analysed as the benefit of metal recycling are reduced by the burdens 377
of the energy intensive reprocessing processes. 378
379
380
Figure 4 GWP, HTP, ADP of the EVI, EVII, ICEV and HEV (30%) for the high recycling rate scenario 381
382
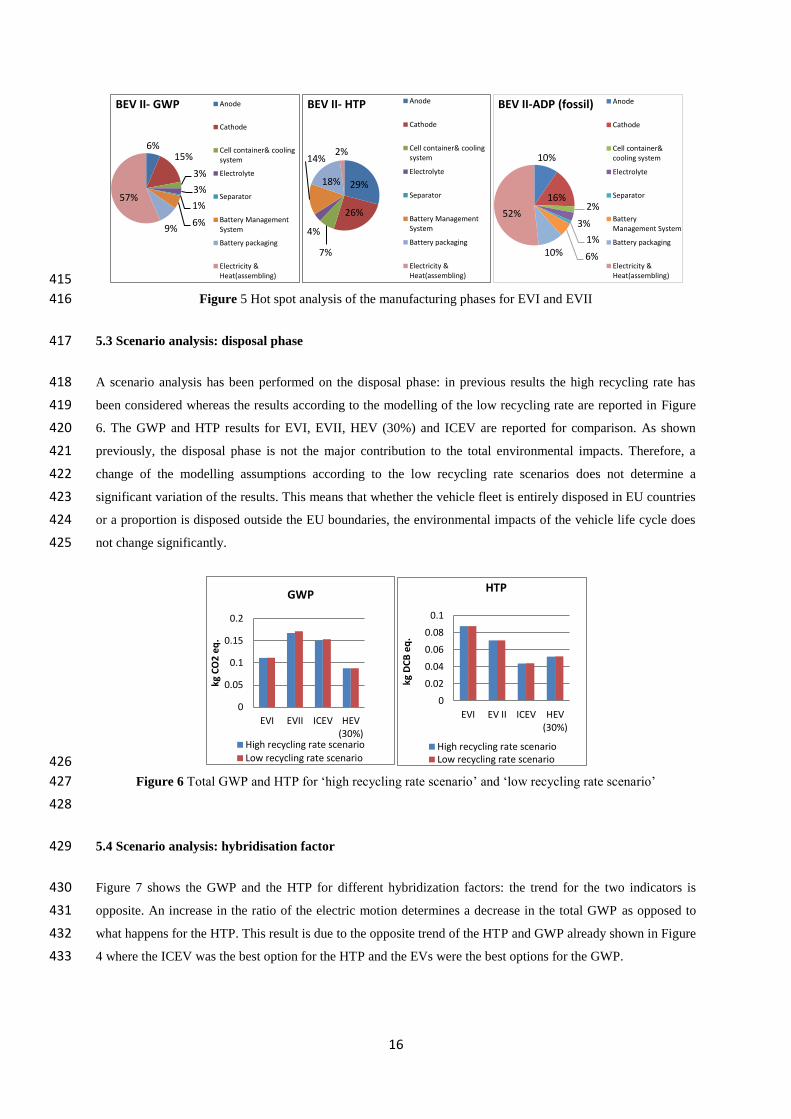
The manufacturing phase of the EVs determines a higher GWP than the manufacturing phase of the ICEV. 383
Therefore, a further analysis has been performed on the manufacturing phases of the two EV models: about half 384
of the total GWP of the manufacturing phase is due to the manufacturing of the battery pack. A detailed hot spot 385
analysis of the EV battery pack model is presented in Figure 5 for EVI and EVII. The main contributor to the 386
GWP of the battery pack for EVI is the manufacturing of the positive electrode paste as also found in previous 387
works (Majeau-Bettez et al. 2011b). In particular, the indirect burdens associated with the production of the 388
-0.05
0
0.05
0.1
0.15
0.2
EV I EV II ICEV HEV(30%)
kg C
O2
eq
.
GWP total
Manufacturingphase
Use phase
Disposal phase
-0.02
0
0.02
0.04
0.06
0.08
0.1
kg D
CB
eq
.
HTP total
Manufacturingphase
Use phase
Disposal phase
-0.5
0
0.5
1
1.5
2
2.5
EV I EV II ICEV HEV(30%)
MJ
ADPf total
Manufacturingphase
Use phase
Disposal phase
15
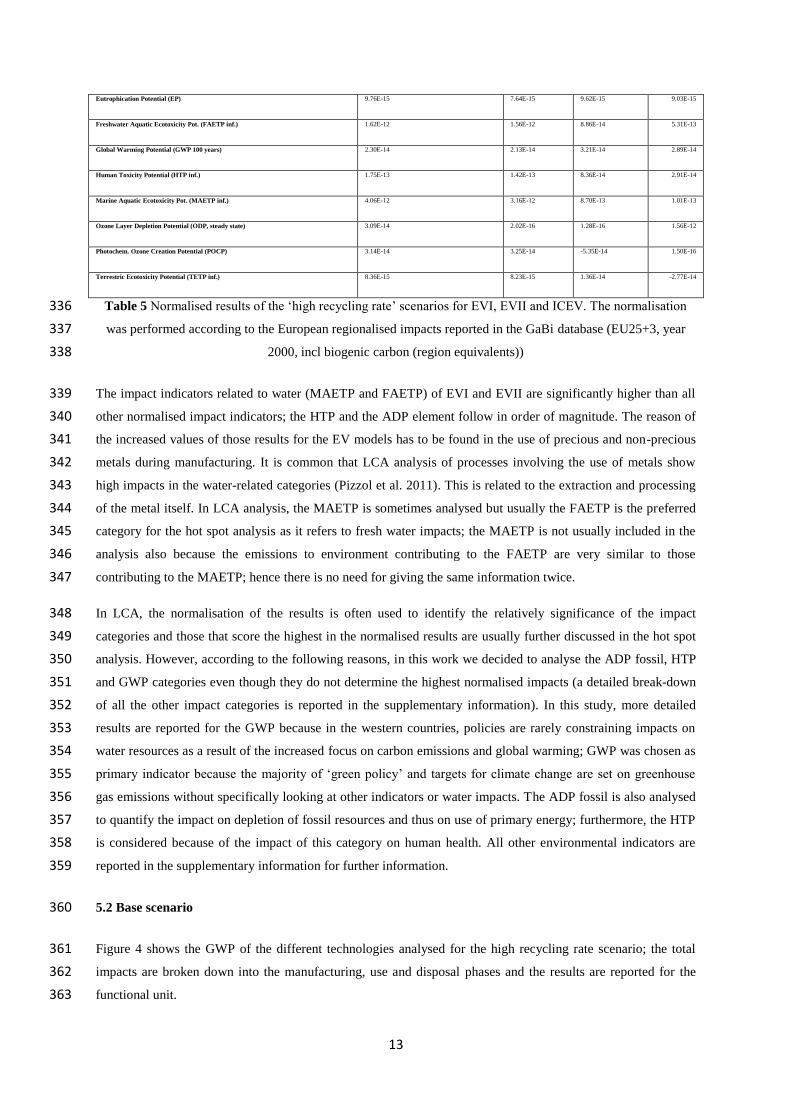
tetrafluoroethylene- a chemical used for the manufacturing of this paste- contribute for 78% to the GWP of the 389
positive electrode paste. A different hot spot analysis is shown for the manufacturing of the battery pack for 390
EVII (Figure 5). For this case, the energy used for the battery assembly determines more than 55% of the total 391
GWP of the battery pack. Overall the manufacturing phase is a significant burden of the total GWP of an EV 392
and it is comparable to the use phase. 393
The total ADP is reported in Figure 4. The trend of the results is the same as the GWP. The main contribution to 394
the total depletion of energy resources is the use phase; particularly for the case of ICEV, this is associated to 395
the diesel consumption (hence fossil resources). For the EV models, the impact of the manufacturing phase is 396
comparable to the impact of the use phase and the burden is almost equally spread among the battery 397
manufacturing and the manufacturing of the rest of the vehicle. The energy requirements for the battery 398
assembly are the main contributors to both the ADP of EVI and EVII (the energy requirements for the battery 399
assembly determine 37% of the total ADP of battery manufacturing for EVI and 52% of the total ADP of battery 400
manufacturing for EVII) as shown in Figure 5. 401
A different trend of the results is shown for the HTP in Figure 4: the total HTP of the two EV models is higher 402
than the total HTP of the ICEV model in opposition to what has been shown for ADP and GWP. The 403
manufacturing phases of the EVs are the main contributors to this indicator. The processes associated with the 404
chemical and metals production used in the manufacturing phase determine more emissions contributing to the 405
toxicological impacts than the emissions associated with the production of electricity required during the electric 406
vehicle use. In opposition to what reported for the other indicators, the HTPs of the EVI and EVII disposal 407
phases are more than double than the disposal phase of the ICEV. The detailed hot spot analysis on the HTP of 408
the batteries manufacturing is reported in Figure 5. 409
Further aggregated results for the base scenario of EVI, EVII and ICEV are reported in the supplementary 410
information where all environmental indicators are shown. The hot spot analysis of the EVI, EVII and ICEV for 411
all environmental indicators is also reported in the supplementary information and the burdens of the 412
manufacturing, use and disposal phases are identified. 413
414
9%
36%
8%3%1%
14%
4%
25%
BEV I-GWP Anode
Cathode
Cell container, tab andterminals
Electrolyte
Separator
Battery ManagementSystem
Module and batterypackaging
Electricity&Heat(assembling)
12%
18%
23%
2%0%
43%
1%1%
BEV I- HTP Anode
Cathode
Cell container, tab andterminals
Electrolyte
Separator
Battery ManagementSystem
Module and batterypackaging
Electricity&Heat(assembling)
6%12%
10%
5%
3%
17%10%
37%
BEV I-ADP(fossil) Anode
Cathode
Cell container, tab andterminals
Electrolyte
Separator
Battery ManagementSystem
Module and batterypackaging
Electricity&Heat(assembling)
16
415
Figure 5 Hot spot analysis of the manufacturing phases for EVI and EVII 416
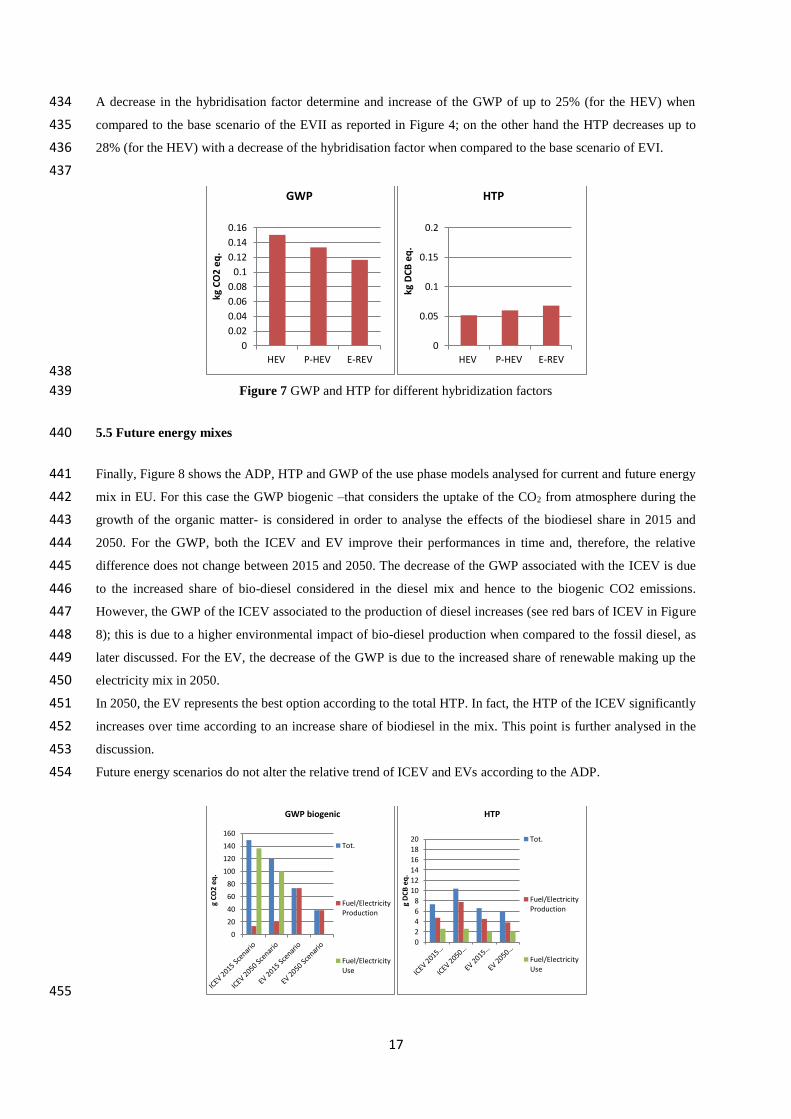
5.3 Scenario analysis: disposal phase 417
A scenario analysis has been performed on the disposal phase: in previous results the high recycling rate has 418
been considered whereas the results according to the modelling of the low recycling rate are reported in Figure 419
6. The GWP and HTP results for EVI, EVII, HEV (30%) and ICEV are reported for comparison. As shown 420
previously, the disposal phase is not the major contribution to the total environmental impacts. Therefore, a 421
change of the modelling assumptions according to the low recycling rate scenarios does not determine a 422
significant variation of the results. This means that whether the vehicle fleet is entirely disposed in EU countries 423
or a proportion is disposed outside the EU boundaries, the environmental impacts of the vehicle life cycle does 424
not change significantly. 425
426
Figure 6 Total GWP and HTP for ‘high recycling rate scenario’ and ‘low recycling rate scenario’ 427
428
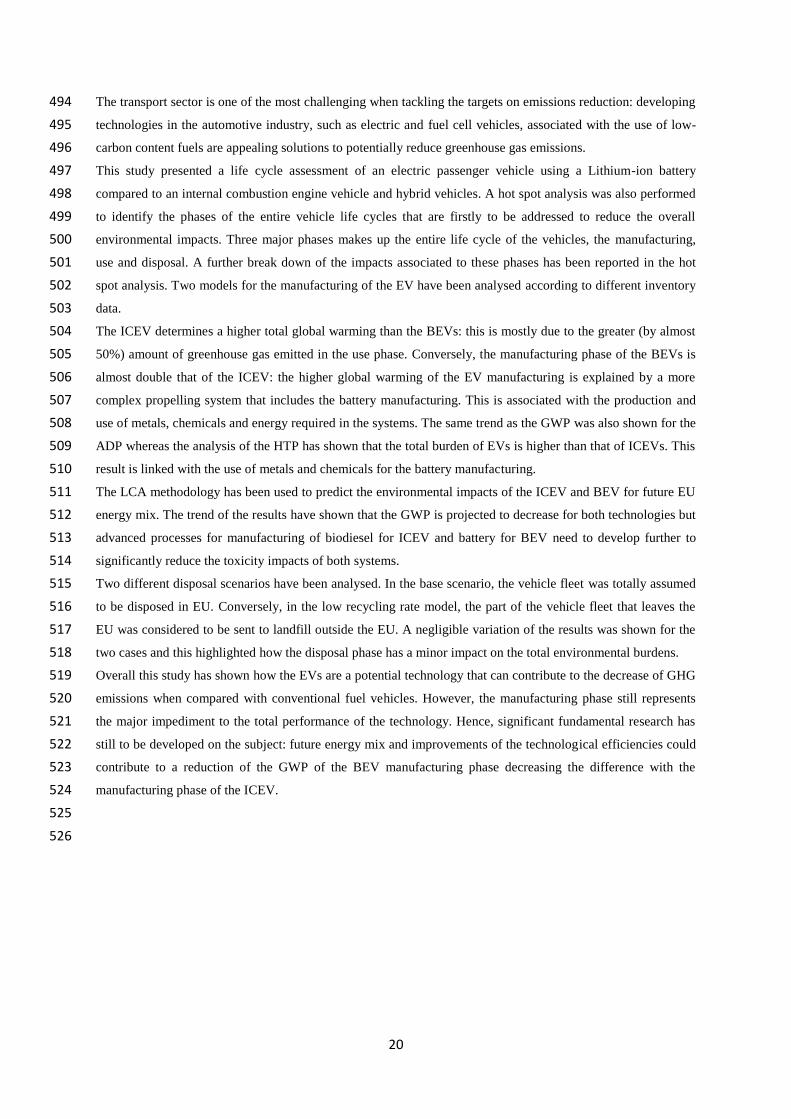
5.4 Scenario analysis: hybridisation factor 429
Figure 7 shows the GWP and the HTP for different hybridization factors: the trend for the two indicators is 430
opposite. An increase in the ratio of the electric motion determines a decrease in the total GWP as opposed to 431
what happens for the HTP. This result is due to the opposite trend of the HTP and GWP already shown in Figure 432
4 where the ICEV was the best option for the HTP and the EVs were the best options for the GWP. 433
6%15%
3%
3%
1%
6%9%
57%
BEV II- GWP Anode
Cathode
Cell container& coolingsystem
Electrolyte
Separator
Battery ManagementSystem
Battery packaging
Electricity &Heat(assembling)
29%
26%
7%
4%
14%
18%
2%
BEV II- HTP Anode
Cathode
Cell container& coolingsystem
Electrolyte
Separator
Battery ManagementSystem
Battery packaging
Electricity &Heat(assembling)
10%
16%2%
3%
1%
6%10%
52%
BEV II-ADP (fossil) Anode
Cathode
Cell container&cooling system
Electrolyte
Separator
BatteryManagement System
Battery packaging
Electricity &Heat(assembling)
0
0.05
0.1
0.15
0.2
EVI EVII ICEV HEV(30%)
kg C
O2
eq
.
GWP
High recycling rate scenario
Low recycling rate scenario
0
0.02
0.04
0.06
0.08
0.1
EVI EV II ICEV HEV(30%)
kg D
CB
eq
.
HTP
High recycling rate scenarioLow recycling rate scenario
17
A decrease in the hybridisation factor determine and increase of the GWP of up to 25% (for the HEV) when 434
compared to the base scenario of the EVII as reported in Figure 4; on the other hand the HTP decreases up to 435
28% (for the HEV) with a decrease of the hybridisation factor when compared to the base scenario of EVI. 436
437
438
Figure 7 GWP and HTP for different hybridization factors 439
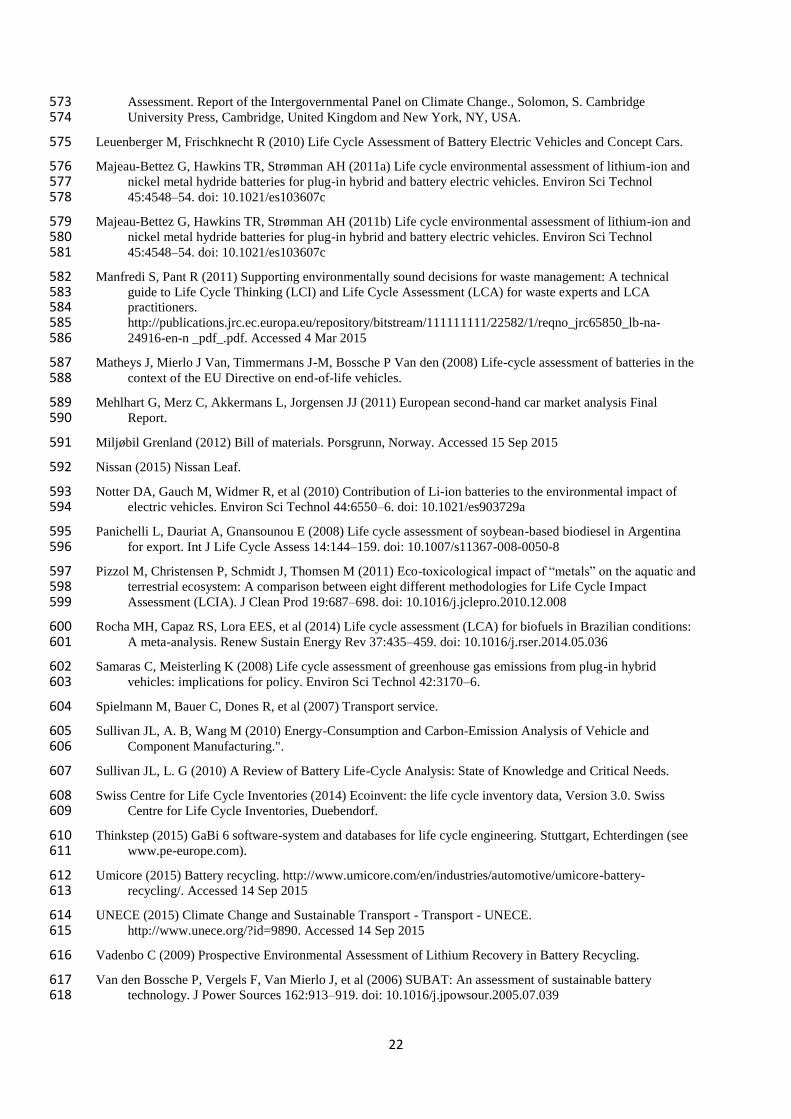
5.5 Future energy mixes 440
Finally, Figure 8 shows the ADP, HTP and GWP of the use phase models analysed for current and future energy 441
mix in EU. For this case the GWP biogenic –that considers the uptake of the CO2 from atmosphere during the 442
growth of the organic matter- is considered in order to analyse the effects of the biodiesel share in 2015 and 443
2050. For the GWP, both the ICEV and EV improve their performances in time and, therefore, the relative 444
difference does not change between 2015 and 2050. The decrease of the GWP associated with the ICEV is due 445
to the increased share of bio-diesel considered in the diesel mix and hence to the biogenic CO2 emissions. 446
However, the GWP of the ICEV associated to the production of diesel increases (see red bars of ICEV in Figure 447
8); this is due to a higher environmental impact of bio-diesel production when compared to the fossil diesel, as 448
later discussed. For the EV, the decrease of the GWP is due to the increased share of renewable making up the 449
electricity mix in 2050. 450
In 2050, the EV represents the best option according to the total HTP. In fact, the HTP of the ICEV significantly 451
increases over time according to an increase share of biodiesel in the mix. This point is further analysed in the 452
discussion. 453
Future energy scenarios do not alter the relative trend of ICEV and EVs according to the ADP. 454
455
0
0.02
0.04
0.06
0.08
0.1
0.12
0.14
0.16
HEV P-HEV E-REV
kg C
O2
eq
.
GWP
0
0.05
0.1
0.15
0.2
HEV P-HEV E-REV
kg D
CB
eq
.
HTP
0
20
40
60
80
100
120
140
160
g C
O2
eq.
GWP biogenic
Tot.
Fuel/ElectricityProduction
Fuel/ElectricityUse
0
2
4
6
8
10
12
14
16
18
20
g D
CB
eq
.
HTP
Tot.
Fuel/ElectricityProduction
Fuel/ElectricityUse

18
456
Figure 8 GWP, HTP and ADP of the ICEV and BEVI use phase for current and future energy mix. 457
This analysis only considered the impacts of different energy shares on the use phase, excluding a possible 458
variation of the environmental impacts associated with the manufacturing and disposal phases. The calculations 459
were not reported for the case of the manufacturing and use phase as the variation in the results was less strong 460
than what shown for the use phase. However, lower energy requirements associated with a ‘greener energy mix’ 461
also determined a decrease of the environmental impacts associated with both the manufacturing and disposal 462
phases (lower avoided burdens would therefore be allocated for the recycling of materials in the disposal phase) 463
6. Discussion 464
The GWPs of the BEV for EVI and EVII and high recycling rate scenarios have been compared to the results 465
reported by previous studies, as shown in Figure 9: the results presented in this study are within the range of 466
GWPs already reported. The differences mostly stem from differing assumptions concerning manufacturing 467
energy requirements and system boundaries. Data from older studies are placed in the upper range of the 468
literature results; higher energy production efficiencies, advanced technologies and higher shares of renewable 469
energy have contributed to the decrease of the total GWP of EVs. The same trend has been predicted to continue 470
also for the future years according to the analysis reported for the future energy mix in 2050. 471
0
0.5
1
1.5
2
2.5
MJ
ADP fossil
Tot.
Fuel/ElectricityProduction
Fuel/ElectricityUse

19
472
Figure 9 GWP: comparison with literature 473
474
When considering the entire life cycle of passenger vehicles, the gradual substitution of the ICEV fleet with the 475
BEV fleet will determine a progressive reduction of the greenhouse gas emissions from the automotive sector 476
thanks to the reduced emissions associated to the use phase. However, more technological developments are to 477
be considered for the manufacturing phase, especially for the battery manufacturing. The results have shown 478
that the high toxicological impacts are strictly linked with the exploitation of precious metals and production of 479
chemical used in the battery manufacturing phase. Therefore, advanced processes and higher efficiencies are 480
required to limit the impacts on water and human life. Although these are key points for the development of a 481
BEV fleet, it has to be recognised that the use of conventional internal combustion engine vehicles might 482
represent an even higher threats in future when considering the changing mix of fuels. Production of diesel from 483
soybeans is known (Panichelli et al. 2008; Rocha et al. 2014) to determine a high human toxicity impact 484
associated mainly to pesticide use during crop growth and fossil fuel consumption for oil extraction during 485
biodiesel production. 486
This study presented a significant improvement to the modelling of the inventory data used to build the 487
assessment, particularly for the disposal treatment. In fact, although publicly available data have been used for 488
the inventory, this study has uniquely developed the model of the disposal phase according to a currently used 489
industrial process. Furthermore, the attributional analysis associated with the consequential approach for the 490
calculation of the avoided burdens adopted in this study, was able to identify future changes of the energy mix 491
and project the environmental impacts of developing technologies. 492
7. Conclusions 493
20
The transport sector is one of the most challenging when tackling the targets on emissions reduction: developing 494
technologies in the automotive industry, such as electric and fuel cell vehicles, associated with the use of low-495
carbon content fuels are appealing solutions to potentially reduce greenhouse gas emissions. 496
This study presented a life cycle assessment of an electric passenger vehicle using a Lithium-ion battery 497
compared to an internal combustion engine vehicle and hybrid vehicles. A hot spot analysis was also performed 498
to identify the phases of the entire vehicle life cycles that are firstly to be addressed to reduce the overall 499
environmental impacts. Three major phases makes up the entire life cycle of the vehicles, the manufacturing, 500
use and disposal. A further break down of the impacts associated to these phases has been reported in the hot 501
spot analysis. Two models for the manufacturing of the EV have been analysed according to different inventory 502
data. 503
The ICEV determines a higher total global warming than the BEVs: this is mostly due to the greater (by almost 504
50%) amount of greenhouse gas emitted in the use phase. Conversely, the manufacturing phase of the BEVs is 505
almost double that of the ICEV: the higher global warming of the EV manufacturing is explained by a more 506
complex propelling system that includes the battery manufacturing. This is associated with the production and 507
use of metals, chemicals and energy required in the systems. The same trend as the GWP was also shown for the 508
ADP whereas the analysis of the HTP has shown that the total burden of EVs is higher than that of ICEVs. This 509
result is linked with the use of metals and chemicals for the battery manufacturing. 510
The LCA methodology has been used to predict the environmental impacts of the ICEV and BEV for future EU 511
energy mix. The trend of the results have shown that the GWP is projected to decrease for both technologies but 512
advanced processes for manufacturing of biodiesel for ICEV and battery for BEV need to develop further to 513
significantly reduce the toxicity impacts of both systems. 514
Two different disposal scenarios have been analysed. In the base scenario, the vehicle fleet was totally assumed 515
to be disposed in EU. Conversely, in the low recycling rate model, the part of the vehicle fleet that leaves the 516
EU was considered to be sent to landfill outside the EU. A negligible variation of the results was shown for the 517
two cases and this highlighted how the disposal phase has a minor impact on the total environmental burdens. 518
Overall this study has shown how the EVs are a potential technology that can contribute to the decrease of GHG 519
emissions when compared with conventional fuel vehicles. However, the manufacturing phase still represents 520
the major impediment to the total performance of the technology. Hence, significant fundamental research has 521
still to be developed on the subject: future energy mix and improvements of the technological efficiencies could 522
contribute to a reduction of the GWP of the BEV manufacturing phase decreasing the difference with the 523
manufacturing phase of the ICEV. 524
525
526

21
References 527
Aguirre K, Eisenhardt L, Lim C, et al (2012) Lifecycle Analysis Comparison of a Battery Electric Vehicle and a 528 Conventional Gasoline Vehicle. 529
Baumann H, Tillman A-M (2004) The Hitch Hiker’s Guide to LCA. An orientation in life cycle assessment 530 methodology and application. Lund, Sweden, Studentlitteratur 531
Behrens A, Coulie C, Teusch J (2013) The Potential Evolution of the European Energy System to 2020 and 532 2050. 533
Clift R (2013) System Approaches: Life Cycle Assessment and Industrial Ecology. In: Pollution: Causes, 534 Effects and Control, 5th edn. R.M. Harrison Royal Society of Chemistry, London, 535
Clift R (2006) Sustainable development and its implications for chemical engineering. Chem Eng Sci 61:4179–536 4187. doi: 10.1016/j.ces.2005.10.017 537
Clift R, Doig A, Finnveden G (2000) The application of life cycle assessment to integrated solid waste 538 management. Process Saf Environ Prot 78:279–287. 539
Daimler AG (2009) Life cycle – Environmental certificate for the S-400 hybrid. Mercedes-Benz. 540
Dunn JB, Gaines L, BArnes, M. Sullivan J, Wang M (2012a) Material and Energy Flows iin the Materials 541 Production, Assemble, and End-of-Life Stages of Automotive Lithium-Ion Battery Life Cycle. 542
Dunn JB, Gaines L, Sullivan J, Wang MQ (2012b) Impact of recycling on cradle-to-gate energy consumption 543 and greenhouse gas emissions of automotive lithium-ion batteries. Environ Sci Technol 46:12704–10. doi: 544 10.1021/es302420z 545
Egede P, Dettmer T, Herrmann C, Kara S (2015) Life Cycle Assessment of Electric Vehicles – A Framework to 546 Consider Influencing Factors. Procedia CIRP 29:233–238. doi: 10.1016/j.procir.2015.02.185 547
Ellingsen LA-W, Majeau-Bettez G, Singh B, et al (2014) Life Cycle Assessment of a Lithium-Ion Battery 548 Vehicle Pack. J Ind Ecol 18:113–124. doi: 10.1111/jiec.12072 549
Faria R, Marques P, Moura P, et al (2013) Impact of the electricity mix and use profile in the life-cycle 550 assessment of electric vehicles. Renew Sustain Energy Rev 24:271–287. doi: 10.1016/j.rser.2013.03.063 551
Genikomsakis KN, Ioakimidis CS, Murillo A, et al (2013) A life cycle assessment of a Li-ion urban electric 552 vehicle battery. In: 2013 World Electric Vehicle Symposium and Exhibition (EVS27). IEEE, pp 1–11 553
Goodenough JB, Park K-S (2013) The Li-ion rechargeable battery: a perspective. J Am Chem Soc 135:1167–76. 554 doi: 10.1021/ja3091438 555
Graedel TE et al (2011) Recycling rates of metals A status report. 556
Hawkins TR, Singh B, Majeau-Bettez G, Strømman AH (2013) Comparative Environmental Life Cycle 557 Assessment of Conventional and Electric Vehicles. J Ind Ecol 17:53–64. doi: 10.1111/j.1530-558 9290.2012.00532.x 559
Helmers E, Marx P (2012) Electric cars: technical characteristics and environmental impacts. Environ Sci Eur 560 24:14. doi: 10.1186/2190-4715-24-14 561
Hischier R, Gallen E (2007) Disposal of electric and electronic equipment (e-Waste). 562
IEA Bioenergy (2011) Bioenergy, Land Use Change and Climate Change Mitigation. 563 http://www.ieabioenergy.com/wp-content/uploads/2013/10/Bioenergy-Land-Use-Change-and-Climate-564 Change-Mitigation-Background-Technical-Report.pdf. Accessed 1 Jun 2016 565
ILCD (2011) European Commission-Joint Research Centre - Institute for Environment and Sustainability: 566 International Reference Life Cycle Data System (ILCD) Handbook- Recommendations for Life Cycle 567 Impact Assessment in the European context., First. Publications Office of the European Union. 568
International Energy Agency (2011) Biofuel for transport roadmap. 569 https://www.iea.org/publications/freepublications/publication/Biofuels_foldout.pdf. Accessed 15 Sep 570 2015 571
IPCC (2007) Climate Change 2007: The Physical Science Basis. Contribution of Working Group I to the Fourth 572
22
Assessment. Report of the Intergovernmental Panel on Climate Change., Solomon, S. Cambridge 573 University Press, Cambridge, United Kingdom and New York, NY, USA. 574
Leuenberger M, Frischknecht R (2010) Life Cycle Assessment of Battery Electric Vehicles and Concept Cars. 575
Majeau-Bettez G, Hawkins TR, Strømman AH (2011a) Life cycle environmental assessment of lithium-ion and 576 nickel metal hydride batteries for plug-in hybrid and battery electric vehicles. Environ Sci Technol 577 45:4548–54. doi: 10.1021/es103607c 578
Majeau-Bettez G, Hawkins TR, Strømman AH (2011b) Life cycle environmental assessment of lithium-ion and 579 nickel metal hydride batteries for plug-in hybrid and battery electric vehicles. Environ Sci Technol 580 45:4548–54. doi: 10.1021/es103607c 581
Manfredi S, Pant R (2011) Supporting environmentally sound decisions for waste management: A technical 582 guide to Life Cycle Thinking (LCI) and Life Cycle Assessment (LCA) for waste experts and LCA 583 practitioners. 584 http://publications.jrc.ec.europa.eu/repository/bitstream/111111111/22582/1/reqno_jrc65850_lb-na-585 24916-en-n _pdf_.pdf. Accessed 4 Mar 2015 586
Matheys J, Mierlo J Van, Timmermans J-M, Bossche P Van den (2008) Life-cycle assessment of batteries in the 587 context of the EU Directive on end-of-life vehicles. 588
Mehlhart G, Merz C, Akkermans L, Jorgensen JJ (2011) European second-hand car market analysis Final 589 Report. 590
Miljøbil Grenland (2012) Bill of materials. Porsgrunn, Norway. Accessed 15 Sep 2015 591
Nissan (2015) Nissan Leaf. 592
Notter DA, Gauch M, Widmer R, et al (2010) Contribution of Li-ion batteries to the environmental impact of 593 electric vehicles. Environ Sci Technol 44:6550–6. doi: 10.1021/es903729a 594
Panichelli L, Dauriat A, Gnansounou E (2008) Life cycle assessment of soybean-based biodiesel in Argentina 595 for export. Int J Life Cycle Assess 14:144–159. doi: 10.1007/s11367-008-0050-8 596
Pizzol M, Christensen P, Schmidt J, Thomsen M (2011) Eco-toxicological impact of “metals” on the aquatic and 597 terrestrial ecosystem: A comparison between eight different methodologies for Life Cycle Impact 598 Assessment (LCIA). J Clean Prod 19:687–698. doi: 10.1016/j.jclepro.2010.12.008 599
Rocha MH, Capaz RS, Lora EES, et al (2014) Life cycle assessment (LCA) for biofuels in Brazilian conditions: 600 A meta-analysis. Renew Sustain Energy Rev 37:435–459. doi: 10.1016/j.rser.2014.05.036 601
Samaras C, Meisterling K (2008) Life cycle assessment of greenhouse gas emissions from plug-in hybrid 602 vehicles: implications for policy. Environ Sci Technol 42:3170–6. 603
Spielmann M, Bauer C, Dones R, et al (2007) Transport service. 604
Sullivan JL, A. B, Wang M (2010) Energy-Consumption and Carbon-Emission Analysis of Vehicle and 605 Component Manufacturing.". 606
Sullivan JL, L. G (2010) A Review of Battery Life-Cycle Analysis: State of Knowledge and Critical Needs. 607
Swiss Centre for Life Cycle Inventories (2014) Ecoinvent: the life cycle inventory data, Version 3.0. Swiss 608 Centre for Life Cycle Inventories, Duebendorf. 609
Thinkstep (2015) GaBi 6 software-system and databases for life cycle engineering. Stuttgart, Echterdingen (see 610 www.pe-europe.com). 611
Umicore (2015) Battery recycling. http://www.umicore.com/en/industries/automotive/umicore-battery-612 recycling/. Accessed 14 Sep 2015 613
UNECE (2015) Climate Change and Sustainable Transport - Transport - UNECE. 614 http://www.unece.org/?id=9890. Accessed 14 Sep 2015 615
Vadenbo C (2009) Prospective Environmental Assessment of Lithium Recovery in Battery Recycling. 616
Van den Bossche P, Vergels F, Van Mierlo J, et al (2006) SUBAT: An assessment of sustainable battery 617 technology. J Power Sources 162:913–919. doi: 10.1016/j.jpowsour.2005.07.039 618

23
Wietschel M, Plötz P, Kühn A, Gnann T (2013) Market evolution scenarios for electric vehicles. 619
World Business Council for Sustainable Development (2004) Mobility 2030: Meeting the challenges to 620 sustainability. 621
Zackrisson M, Avellán L, Orlenius J (2010) Life cycle assessment of lithium-ion batteries for plug-in hybrid 622 electric vehicles – Critical issues. J Clean Prod 18:1519–1529. doi: 10.1016/j.jclepro.2010.06.004 623
624