hybrid life cycle sustainability assessment-based multi
TRANSCRIPT
University of Central Florida University of Central Florida
STARS STARS
Electronic Theses and Dissertations
2019
Hybrid Life Cycle Sustainability Assessment-based Multi-objective Hybrid Life Cycle Sustainability Assessment-based Multi-objective
Optimization: A Case for Sustainable Fleet Mix Optimization: A Case for Sustainable Fleet Mix
Burak Sen University of Central Florida
Part of the Industrial Engineering Commons
Find similar works at: https://stars.library.ucf.edu/etd
University of Central Florida Libraries http://library.ucf.edu
This Masters Thesis (Open Access) is brought to you for free and open access by STARS. It has been accepted for
inclusion in Electronic Theses and Dissertations by an authorized administrator of STARS. For more information,
please contact [email protected].
STARS Citation STARS Citation Sen, Burak, "Hybrid Life Cycle Sustainability Assessment-based Multi-objective Optimization: A Case for Sustainable Fleet Mix" (2019). Electronic Theses and Dissertations. 6331. https://stars.library.ucf.edu/etd/6331

HYBRID LIFE-CYCLE SUSTAINABILITY ASSESSMENT-BASED MULTI-OBJECTIVE OPTIMIZATION: A CASE FOR SUSTAINABLE TRANSIT BUS FLEET
MIX
by
BURAK SEN
B.S. Sakarya University, 2011 M.Sc. Karl-Franzens University of Graz/Chalmers University of Technology (Joint Degree)
A thesis submitted in partial fulfillment of the requirements for the degree of Master of Science
in the Department of Industrial Engineering and Management Systems in the College of Engineering and Computer Science
at the University of Central Florida Orlando, Florida
Spring Term
2019
Major Professor: Qipeng Phil Zheng

ii
© 2019 Burak Sen

iii
ABSTRACT
Sustainable transportation idea includes not only switching from conventional energy sources to
alternative fuel resources, but also diverging from private vehicle use and shifting to alternative
transportation modes. As a part of alternative transportation mode, utilizing alternative fuels in public
transportation operation supports sustainable transportation at it full-glance. Given their implications in
terms of air quality and sustainable movement of people, transit buses, which provide the primary public
transportation service, are considered an ideal domain for the deployment of alternative fuels. An input-
output (IO) model is developed based on Eora database – a detailed IO database that consists of national
IO tables. Using the Eora-based IO model, this study quantifies and assesses the environmental,
economic, and social impacts of alternative fuel buses in Atlanta, GA, and Miami, FL based on 6 macro-
level sustainability indicators. The life cycle sustainability performance of these buses are then compared
to that of a diesel transit bus as well as a regional comparison is carried out based on the two U.S.
metropolitan areas. Based on these results, a multi objective optimization model is constructed to find an
optimal transit bus fleet for the studied U.S. regions. It has been found that a transit fleet that is composed
of diesel buses operating in Atlanta has 30% more global warming potential than that of a transit fleet
operating in Miami. The same bus fleet operating in Atlanta incurs a life cycle cost (LCC) that is more
than double the LCC of the fleet operating in Miami. The study presents a way in which transit agencies
can strategize their transitioning to a sustainable bus fleet.

iv
To my beloved family and friends
v
TABLE OF CONTENTS
LIST OF FIGURES ...................................................................................................................... vii
LIST OF TABLES ....................................................................................................................... viii
LIST OF ACRONYMS (or) ABBREVIATIONS ......................................................................... ix
CHAPTER 1: INTRODUCTION ................................................................................................... 1
1.1 Overview .......................................................................................................................... 1
1.2 Objectives of the Thesis ................................................................................................... 5
1.3 Organization of the Thesis ............................................................................................... 6
CHAPTER 2: LITERATURE REVIEW ........................................................................................ 8
CHAPTER 3: METHODOLOGY ................................................................................................ 17
3.1 Hybrid Life Cycle Sustainability Assessment ................................................................ 17
3.1.1 Life Cycle Inventory ............................................................................................... 23
3.2 Multi-Objective Linear Programing ............................................................................... 26
3.3 Pareto Optimum ............................................................................................................. 29
CHAPTER 4: FINGINGS ............................................................................................................ 31
4.1 Hybrid Lice Cycle Sustainability Assessment Results .................................................. 31
4.1.1 Environmental Impacts ........................................................................................... 31
4.1.2 Social Impacts ......................................................................................................... 35
4.1.3 Economic Impacts ................................................................................................... 41

vi
4.2 Multi Objective Linear Programing Results .................................................................. 48
4.3 Trade-off Results ............................................................................................................ 51
CHAPTER 5: CONCLUSIONS ................................................................................................... 53
LIST OF REFERENCES .............................................................................................................. 56

vii
LIST OF FIGURES
Figure 1-1 Personal expenditures by category (millions of current years) .................................... 2
Figure 4-1 Global warming potentials of transit bus options in the studied areas ....................... 31
Figure 4-2 Global warming potential of individual life cycle phases for Atlanta ....................... 32
Figure 4-3 Global warming potential of individual life cycle phases for Miami ........................ 33
Figure 4-4 Global warming potential intensities of transit bus options in the studied areas ....... 34
Figure 4-5 Employment created by the studied bus types in Atlanta (persons) .......................... 36
Figure 4-6 Employment created by the studied bus types in Miami (persons) ............................ 37
Figure 4-7 Income ($K) generated through the studied buses in Atlanta .................................... 38
Figure 4-8 Income ($K) generated through the studied buses in Miami ..................................... 39
Figure 4-9 Social cost of air pollution caused by the studied buses in Atlanta ........................... 41
Figure 4-10 Social cost of air pollution caused by the studied buses in Miami .......................... 42
Figure 4-11 Social cost of air pollution (SCAP) intensities ($/mile) of the studied transit bus
options in both metropolitan areas ................................................................................................ 43
Figure 4-12 Gross domestic product (GDP) ($M) generated in Atlanta...................................... 44
Figure 4-13 Gross domestic product (GDP) ($M) generated in Miami ....................................... 45
Figure 4-14 Comparison of the life cycle costs and LCC intensities of the studied bus types in
the studied areas ............................................................................................................................ 46
Figure 4-15 Optimal transit bus fleet mix results for Atlanta ...................................................... 49
Figure 4-16 Optimal transit bus fleet mix results for Miami ....................................................... 50
Figure 4-17 Trade-off analysis between global warming potential and life cycle costs for the
Atlanta transit bus mix .................................................................................................................. 51

viii
LIST OF TABLES
Table 3-1 Life cycle sustainability indicators analyzed ............................................................... 21
Table 3-2 Fuel economy (fuel consumption for BE transit bus) values for the studied bus options
in the studied cities........................................................................................................................ 24
Table 3-3 Life cycle sustainability impact multipliers relevant for the sectors included in the
system boundary ........................................................................................................................... 25

ix
LIST OF ACRONYMS (or) ABBREVIATIONS
AFLEET Alternative Fuel Life-Cycle Environmental and Economic Transportation
APEEP Air Pollution Emission Experiment and Policy
BEB Battery Electric Bus
CAV Connected Autonomous Vehicle
CNG Compressed Natural Gas
DALY Disability-Adjusted Life Year
FCB Fuel-Cell Bus
GDP Gross Domestic Production
GHG Greenhouse Gas Emissions
GOS Gross Operating Surplus
GREET Greenhouse Gas, Regulated Emissions, and Energy Use in Transportation
GWP Global Warming Potential
IE Industrial Ecology
IO Input-Output
LCA Life Cycle Assessment
LCSA Life Cycle Sustainability Assessment
LCC Life Cycle Costing
LNG Liquefied Natural Gas
PMFP Particulate Matter Formation Potential
POFP Photochemical Oxidant Formation Potential
SDA Structural Decomposition Analysis
SUT Supply and Use Tables
TCO Total Cost of Ownership
VMT Vehicle Miles Traveled
VOC Volatile Organic Compound
WF Water Footprint

1
CHAPTER 1: INTRODUCTION
1.1 Overview
Today, cities accommodate over 50% of the world’s population and contribute
substantially to global GDP as well as global energy consumption and greenhouse gas (GHG)
emissions (United Nations 2018). Similarly, over 80% of the U.S. population reside in urban
areas. Due to their characteristics (e.g. concentration of population and accumulation of socio-
economic activities), the sustainability implications of these areas have become a mainstream
topic in the scientific community, making cities a focal point for researchers and policy-makers
to find ways to improve the efficiency of socio-technical systems that comprise the building
blocks of a city, one of which is transportation.
Without a doubt, the availability of a reliable surface transportation infrastructure as well
as the accessibility of urban dwellers to transportation services has far-reaching economic, social,
and environmental implications. Transportation sector alone consumes a vast amount of energy
being responsible for almost 30% of U.S. total energy in 2017 (U.S. Energy Information
Administration 2016). The mobility of people and goods relies heavily on petroleum products,
which accounted for over 90% of the U.S. transportation sector’s total energy use in 2017.
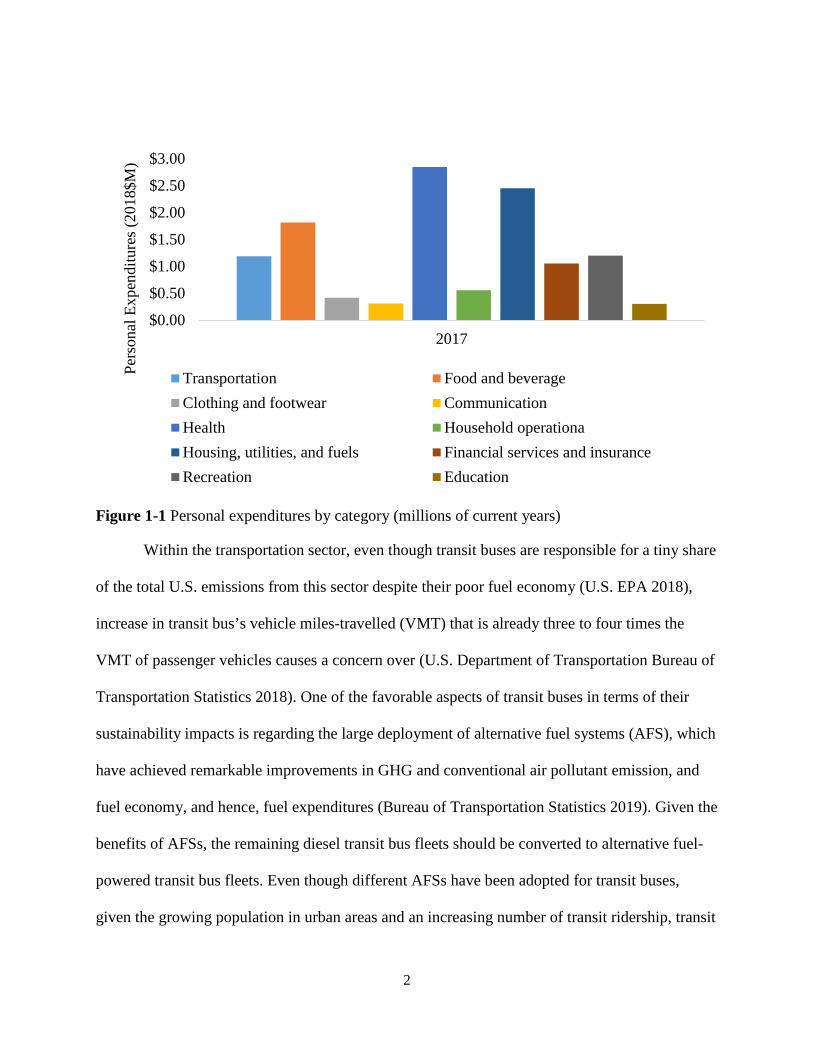
Following the health, accommodation, and food items, transportation-related expenditures make
up almost 10% of U.S. total personal expenditures, as shown in Figure 1 (U.S. Department of
Transportation Bureau of Transportation Statistics 2018). Transportation sector accounts for over
25% of the total greenhouse gas emissions, and is heavily dependent on fossil fuel, which has a
polluting production process that also generates considerably large amounts of emissions (U.S.
EPA 2019).
2
Figure 1-1 Personal expenditures by category (millions of current years)
Within the transportation sector, even though transit buses are responsible for a tiny share
of the total U.S. emissions from this sector despite their poor fuel economy (U.S. EPA 2018),
increase in transit bus’s vehicle miles-travelled (VMT) that is already three to four times the
VMT of passenger vehicles causes a concern over (U.S. Department of Transportation Bureau of
Transportation Statistics 2018). One of the favorable aspects of transit buses in terms of their
sustainability impacts is regarding the large deployment of alternative fuel systems (AFS), which
have achieved remarkable improvements in GHG and conventional air pollutant emission, and
fuel economy, and hence, fuel expenditures (Bureau of Transportation Statistics 2019). Given the
benefits of AFSs, the remaining diesel transit bus fleets should be converted to alternative fuel-
powered transit bus fleets. Even though different AFSs have been adopted for transit buses,
given the growing population in urban areas and an increasing number of transit ridership, transit
$0.00
$0.50
$1.00
$1.50
$2.00
$2.50
$3.00
2017
Pers
onal
Exp
endi
ture
s (20
18$M
)
Transportation Food and beverageClothing and footwear CommunicationHealth Household operationaHousing, utilities, and fuels Financial services and insuranceRecreation Education

3
buses are considered an ideal vehicle class to improve the sustainability impacts of transportation
in urban areas. In this regard, alternative fuels offer remarkable improvements to bus’s fuel
economy and ultimately, tailpipe emissions as well as emissions at petroleum refineries.
Furthermore, zero-emission transit buses produce no tailpipe emissions, thereby improving urban
air quality, and reducing air pollution externality (APE) costs (or social cost of air pollution)
(Ercan and Tatari 2015).
Transit service authorities will need to respond to increasing demand by growing number
of population for public transportation, with convenient service. However, given their
operational characteristics (i.e. VMT and fuel economy), an increase in ridership will likely
result in an increased amount of greenhouse gas (GHG) and tailpipe emissions, especially if
transit bus fleets that still comprise of diesel buses do not consider deploying alternative fuel
buses in their fleets. This would help reduce the U.S. dependence on imported petroleum
products used for buses while improving air quality at urban centers. Therefore, not only does
such a transition have environmental applications, but also significant economic and social
implications through increased energy security and reduced social cost of carbon. In this regard,
transition to sustainable transit bus fleet mix would be an effective strategy that transit authorities
can adopt.
In recent years, a dramatic shift from diesel fuel to alternative fuel has been experienced
in the makeup of transit bus fleets. The early adopters of alternative fuels deployed biofuels and
Compressed Natural Gas (CNG) as oppose to diesel (Baker et al. 2016). Due to reported benefits
from various transit agencies, CNG was rapidly adopted by many U.S. public transportation
agencies [Ercan and Tatari, 2015-LCA paper]. The hybrid technology, which significantly

4
improved the fuel economy of conventional diesel buses, was introduced in early 2000s,
followed by the introduction battery electric buses. Hybrid transit buses have achieved a
remarkable market penetration so far, while techno-economic circumstances (e.g. battery
technology, charging infrastructure, range anxiety etc.) that apply to battery electric transit buses
have slowed down the penetration of these type of transit buses. are still in the developmental
stage due to the limited number of battery-electric transit buses compared to total number of
transit buses in the U.S. However, the rapid developments on energy storage (battery) technology
around the globe reduced the high purchase price of battery electric buses and reduced concerns
over range anxiety.
As a result, over 50% of the U.S. transit bus fleet currently comprises of alternative fuel
buses such as hybrid-electric (over 20%), CNG (almost 30%), and a tiny share of battery electric
buses (American Public Transportation Association 2019; Lee et al. 2019). Given distinct socio-
cultural and socio-economic characteristics of cities, it is a challenging task for transit authorities
to make procurement and planning decisions that can accelerate the deployment of alternative
fuel buses. In addition, individual transit agencies may well be subject to different economic
and/or regulatory constraints that influence the decision-making process with regard to transit
bus fleet management. Holistic and well-established analytical tools should be utilized to assist
agencies in making informed decisions (Hanlin et al. 2018). For this purpose, this study applies
transit bus activity-based hybrid life cycle sustainability analysis and multi-objective
optimization to the case of sustainable transit bus fleet composition in fifteen U.S. metropolitan
areas.
5
1.2 Objectives of the Thesis
As opposed to end-users (i.e. light-duty vehicles) and U.S. trucking industry (e.g. freight
trucks), public transportation agencies have been the early adopters of alternative fuels. Today,
transit buses that run on alternative fuels outnumber diesel transit buses in the United States. In
2016, U.S. public transportation agencies provided over 10 billion trips, marking a 20% increase
in transit ridership during the last two decades (Federal Transit Administration 2019). Different
public transportation agencies serve populations, with different socio-cultural and socio-
economic backgrounds. Therefore, each public transportation agency has different circumstances
and strategize its services depending on the region, in which it serves, as well as the climatic,
geographic, and traffic conditions of that region (Xu et al. 2015). For example, while New
York’s Metropolitan Transportation Authority plans to purchase 60 battery-electric buses
through 2020, Los Angeles Metro aims to transform its transit bus fleet to a 100 percent zero
emission bus fleet by 2030 (Albert et al. 2014; Los Angeles Metropolitan Transportation
Authority 2017). Therefore, environmental and socio-economic impacts associated with transit
bus fleets of each public transportation agency also vary just like local conditions that each
agency experience. In this regard, it is crucial to get insights into these impacts while making a
decision on composing a sustainable transit bus fleet.
For this purpose, one of the main objectives of the thesis is given as the following:
1. Quantify and compare the life cycle sustainability impacts of conventional and
alternative-fuel transit buses. The quantification and comparison are based on
environmental impacts (e.g. GHG and air pollutant emissions, energy and
material consumption, and midpoint impacts such as global warming potential

6
and photochemical oxidant formation potential), social impacts (e.g. air pollution
health damage costs, human health impact (DALY), and employment), and
economic impacts (e.g. life cycle costs, taxes, and GDP).
Even though tracking and understanding the sustainability impacts of a transit bus fleet is
an important step towards a sustainable fleet composition, it is not sufficient to operationalize
this knowledge obtained from an initial life cycle sustainability assessment. Despite having
different local conditions, it is a common objective of transit agencies to minimize their negative
sustainability impacts and maximize their positive sustainability impacts while making a
decision on new bus purchases. Since transit agencies usually have limited available funds, they
are likely to transition to a sustainable fleet gradually and hence, they will have to consider
multiple factors in their decision-making practices. In order to support transit agencies at
informed decision-making, another main objective of the thesis is as follows:
2. Find a Pareto optimal composition of a transit bus fleet mix based on
aforementioned sustainability impacts in a way that will minimize the negative
impacts while maximizing the positive impacts.
1.3 Organization of the Thesis
This thesis consists of five chapters. The first chapter presents an overview of the
sustainability implications of transportation (exclusively public transportation) within the context
of urban sustainability. This chapter also states the main objectives of the thesis. The second
chapter provides the review of most relevant scientific work in the literature on life cycle
assessment and application of the studied optimization method in fleet mix problems. The third

7
chapter presents the methods and materials applied to carry out the analysis, including hybrid
life-cycle assessment and multi-objective linear programing. The fourth chapter present the
findings of the study, and the fifth chapter draws the conclusions of the study based on these
findings.

8
CHAPTER 2: LITERATURE REVIEW
Given their sustainability implications, i.e. environmental, social, and economic, transit
buses have always been a subject of interest for scholars. Furthermore, upon the introduction of
sustainability science, scholars have adopted various frameworks and methods from the
sustainability science toolbox to analyze transit buses’ multi-dimensional impacts and conduct
policy-relevant syntheses to aid strategic decision-making for public transportation investments.
Scholars have applied those frameworks and/or tools either separately (e.g. LCA, LCSA, LCC,
life cycle energy analysis etc.) or in combination with other techniques (e.g. LCA-based
optimization). There is a large number of studies in the literature that have examined different
aspects of public transportation. Therefore, this review of the literature mainly focuses on the
studies that have investigated transit bus sphere using life cycle sustainability assessment or life
cycle assessment frameworks in combination with multi-objective optimization methods. Given
the most commonly accepted lifetime of a transit bus, the studies conducted in 2007 onwards
have been included in the literature review.
Ally and Pryor (2007) constructed a process-based life cycle assessment model to assess
the life cycle environmental and energy impacts of diesel, CNG, and FC buses throughout their
lifetime – assumed to be 16 years –, including in the system boundary the stages such as bus
manufacturing, refueling infrastructure, operations, and end-of-life. The researchers found fuel
cell bus to be competitive with diesel and CNG options, particularly in terms of their global
warming potential. The study showcased an example in the Australian context and lacks the
consideration of other commonly-used alternative fuel bus options such as hybrid and battery
electric buses in their analysis. Golub et al. (2011) developed a life cycle cost model for transit

9
buses to evaluate hybrid electric bus technology’s performance in terms of operating and capital
costs. The researchers also carried out a comparison of the results between CNG, diesel, gasoline
hybrid electric, and diesel hybrid electric bus (HEB) options. They found the LCCs of diesel and
gasoline HEBs to be 3% and 5% to be higher than that of a conventional diesel bus; and the LCC
of CNG buses to be 8% higher than that of diesel buses. The developed model was
comprehensive but limited to LCC accounting only. Vahdani et al. (2011) employed a fuzzy
multiple criteria decision-making (MCDM) method to assist with transit bus fleet composition
considering various alternative fuel bus options including conventional diesel, CNG, batter
electric, hybrid electric, fuel cell, liquid propane gas (LPG), and methanol buses. The researchers
took into account several aspects that influence a bus purchase decision such as energy supply,
energy efficiency, air pollutant emissions, noise pollution, industrial relationship, technology
implementation cost, maintenance cost, vehicle capability, road facility, speed of traffic flow,
and sense of comfort. According to their analysis results, conventional diesel, CNG, and LPG are
ranked in top three of the transit bus selection. The study lacked the consideration of life cycle
perspective, and not necessarily optimized the transit fleet. Kliucininkas et al. (2012) presented a
case study from Kaunas, Lithuania on the life cycle assessment of public transportation in the
city that included trolleybuses, transit buses, and taxis/microbuses based on alternative fuel
chains. The system boundary included the extraction/production and initial treatment of fuels,
their transportation, production, distribution, and combustion. The researchers adopted the
ReCiPe method to quantify weighted damage that was caused by five alternative fuel chains, and
found the compressed biogas to have the lowest damage value, while diesel and CNG caused the

10
highest damage. The study only focused on the considered fuels’ life cycles and excluded other
life cycle stages as well as life cycle costs.
Xu et al. (2013b, a, 2015) developed a novel, load-based life cycle fuel and emissions
calculator model based on several other models such as AFLEET, MOVES, GREET, and a load
surrogate known as scale tractive power (SPT). The researchers took into consideration of
several parameters in their estimations of the life cycle environmental impacts of transit bus fuel
production and consumption, such as terrain roughness, meteorological conditions, duty cycles,
and passenger loads. They applied the model to the cases of Atlanta, GA, San Francisco, CA,
and Phoenix, AZ, and found that significant differences in emissions depending on geographic
and ridership characteristics. The study only focused on fuel cycle emissions and is not
considered a complete LCA. The researchers state that low-income households, which usually
benefit from transit buses to commute, are disproportionately exposed to emissions from transit
bus operations. However, the study lacks the inclusion of health impact costs of air pollutant
emissions from transit bus operations. Lajunen (2014) presented a cost-benefit analysis (CBA) of
hybrid and battery electric buses in terms of their life cycle costs for the considered operation
routes (or duty cycles) based on the cost variables such as capital costs, operating costs, and costs
of the energy storage system replacements. The researchers found hybrid buses to have almost
the same life cycle cost as conventional buses; and plug-in hybrid and battery electric uses to
have the best potential to lower the LCCs of transit bus operations.
Ribau et al. (2014) carried out a life cycle-based optimization study to investigate an
optimal powertrain design for plug-in hybrid electric and hybrid electric vehicles based on life
cycle cost, life cycle fuel efficiency, and life cycle greenhouse gas emissions (GHG). The

11
researchers set the system boundary of the analysis based on cradle-to-grave, which includes all
the life cycle stages from raw material extraction to end-of-life. Furthermore, they based the
optimization model on a single-objective generic algorithm (i.e. minimizing LCC, life cycle fuel
efficiency, and life cycle GHG), and a multi-objective generic algorithm (i.e. minimizing the
objective couples of LCC and life cycle fuel efficiency, LCC and life cycle GHG, and life cycle
fuel efficiency and life cycle GHG), which were then linked to a vehicle simulation software.
They found hydrogen fuel cell buses to potentially reduce the life cycle energy consumption by
almost 60% and emit almost 70% less life cycle GHG emissions relative to diesel buses. Ercan
and Tatari (2015) carried out a hybrid life cycle assessment of alternative fuel buses options (i.e.
diesel, biodiesel, CNG, liquefied natural gas (LNG), hybrid electric bus, and battery electric bus)
that operate on three driving cycles, i.e. Manhattan, Central Business District (CBD), and Orange
County Transit Authority (OCTA). The researchers included in their analysis all the life cycle
stages except for the end-of-life stage. In addition, regional electricity grid mix differences were
also considered in their analysis with regard to power supply for the battery electric bus option.
The researchers found CNG and LNG buses to underperform all the other transit bus options
operating under all the considered driving cycle conditions. In addition, the researchers found
battery electric bus options to cause the highest amount of water withdrawal given the use of the
prevailing regional grid mix; however, the use of renewable energy sources to generate power
(e.g. solar PV) reversed this result. One of the key shortcoming of this study was that it was
based on an old version of an input-output model developed by Carnegie Mellon University
Green Design Institute (2008). Li et al. (2015) presented an optimization approach, called
remaining life additional benefit-cost analysis, to aid decision-making on when and what kind of

12
actions to take with regard to retiring or retrofitting an existing bus fleet. The optimization model
considered cost components such as operating and retrofit costs, and external costs from
emissions as well as emissions generated from buses. The analysis results showed that by
employing the proposed approach, it was possible to gain over $170 million from emission
reduction under a zero inflation rate. As dictated by the study’s scope, only those costs and
emissions from the remaining lifetime of buses were included in the analysis. Ercan et al. (2015)
carried out an LCA-based multi-objective optimization and tradeoff analyses to assist with the
decision-making on composing a new transit bus fleet that is relatively sustainable. In their
analysis, the researchers only included three driving cycles such as Manhattan, Central Business
District (CBD), and Orange County Transit Authority (OCTA), and the model parameters such
as life cycle costs, life cycle environmental emissions, and life cycle air externality costs (or
social cost of air pollution) that originate from diesel, hybrid, biodiesel, battery electric, CNG,
and LNG buses. Their analysis results showed biodiesel buses to perform the worst in terms of
conventional air pollution impacts; and battery electric buses to underperform all other transit
bus options in terms of life cycle costs. The optimization model developed by the researchers
found no diesel bus in any objective weighting scenarios (e.g. cost-dominant, environmental-
dominant etc.).
Lajunen and Lipman (2016) developed simulation models of different transit but
powertrains using the Autonomie vehicle simulation software to evaluate the life cycle costs and
carbon dioxide emissions of different types of city buses based on the driving conditions in
Finland and California. The researchers found that alternative transit bus powertrains could
significantly improve the energy efficiency and reduce GHG emissions, with battery electric

13
buses potentially reducing these emissions by up to 75%. Ally and Pryor (2016) presented a case
study from Australia on life cycle cost accounting of diesel, natural gas, hybrid, and hydrogen
fuel cell transit buses. The input parameters for the developed LCC model included the cost
components such as bus purchase cost, life cycle maintenance and repair costs, life cycle fuel
costs, life cycle AdBlue (i.e. a non-hazardous aqueous urea to tackle diesel tailpipe emissions)
consumption, and end-of-life salvage value. The study found the total cost of ownership of diesel
hybrid electric transit bus to be 10% higher than that of a conventional diesel bus. Zhou et al.
(2016) designed a real-world experiment for three battery electric buses’ performances and life
cycle fuel benefits with respect to energy consumption and carbon dioxide emissions and
presented a case study for Macao, China. The researchers tested the studied battery electric buses
under different air-conditioning, passenger loads, and driving conditions (i.e. bus speed). The
analysis also included the life cycle energy consumption and environmental impacts of the
studied battery electric buses based on the GREET model. The study found that battery electric
buses operating in the case city had the potential to reduce well-to-wheel petroleum use by over
85%, well-to-wheel fossil fuel use by over 32%, and well-to-wheel carbon dioxide emissions by
as much as 35% relative to conventional diesel buses. The study is confirmatory in that auxiliary
loads such as passenger loads and air-conditioning use are significant parameters to consider
when constructing a model to analyze the performances of transit buses’ operations. Yu et al.
(2016) presented another case study concerning China on the influence of passenger load on
conventional (Euro III) diesel bus’s fuel consumption and emission performances by designing a
real-world experiment based on Vehicle Specific Power, which was also adopted in the FEC
model used by the thesis. The researchers found an inverse correlation between passenger load

14
and per-passenger emission and fuel consumption factors, marking the significance of the
inclusion of passenger loads in emission and fuel consumption analysis of transit buses. The
study only focused on the activity-based emission, i.e. emissions from transit bus operations, and
hence, did not include the life cycle impacts that are associated with fuel production. Even
though their study was not complete in that sense, it is confirmatory of the effect of passenger
loads on transit bus’s operational performance.
Tong et al. (2017) examined the life cycle ownership cost and environmental externality
of alternative fuel-powered 40’ft and 60-ft transit bus options, which included conventional bus
powered by either diesel or biodiesel, diesel hybrid-electric bus, natural gas-powered bus (either
CNG or LNG), and a battery electric bus (rapid or slow charging). Life cycle ownership cost
model included the cost parameters such as bus purchase cost, fuel costs, operation and
maintenance cost, and infrastructure cost, while environmental externality costs were estimated
by monetizing the GHG emissions through the social cost of carbon, and conventional air
pollutant emissions through the APEEP model, which is also adopted by the thesis. The study
found conventional buses to outperform all the other studied transit bus options in terms of life
cycle ownership costs as well as environmental externality costs. The study did not include in the
analysis any other life cycle indicator; however, concluded that battery electric buses could
provide important performance improvements in regard to the considered indicators. Bi et al.
(2015) carried out a comparative analysis, using a process-LCA approach, of plug-in charging
(i.e. scenario 1) and wireless charging (i.e. scenario 2) of battery electric transit buses in terms of
their life cycle energy consumption and life cycle GHG emissions. The study found wireless
charging system to consume slightly less energy and emit slightly less GHG emissions relative to

15
plug-in charging technique. In a follow-up study, Bi et al. (2018) conducted a life cycle-based
multi objective optimization for wireless charger deployment for a battery electric transit bus
network based upon the results of the researchers’ previous study. The objective function solved
in the study was to minimize life cycle costs, life cycle GHG emissions, and life cycle energy
2016consumption by selecting bus stops where wireless chargers will be deployed. Through their
analysis, the researchers revealed that it was possible through the optimal siting strategies to help
reduce the objective function parameters, on average, by 10% relative to a base case scenario,
where such a decision-making aid is not present. Lozanovski et al. (2018) carried out a
sustainability assessment of fuel cell transit buses under the European context, with
environmental LCA, total cost of ownership, and qualitative, open-ended interviews, which
represented the three pillars of sustainability (i.e. the environment, society, and the economy),
respectively. The researchers found that hydrogen production has an important implications in
terms of fuel cell buses’ environmental impacts, and that fuel cell buses become competitive
enough by 2030 when their benefits to human health and climate change are also taken into
account. Emiliano et al. (2018) presented a multi-objective optimization model applying
Weighted Tchebycheff and Augmented Weighted Tchebycheff methods to find Pareto-optimum
bus fleet combinations composed of 20 buses based on life cycle GHG emissions and
conventional air pollutant emissions that were obtained from Ercan and Tatari (2015), and total
costs that originate from transit bus operations in Joinville, Brazil. The analysis included a diesel
bus, two types of battery electric buses, and a CNG bus that run on three routes denoted as SN,
IT, and ST. The analysis results showed that battery electric buses were the only bus choice for
the SN line, whereas IT and ST lines were dominated by diesel and CNG transit buses,
16
respectively. The study confirmed the significance of using multi-objective optimization
approaches to tackle life cycle-based optimum transit bus fleet composition problems. Lee et al.
(2019) investigated the well-to-wheel environmental implications of fuel economy targets for
hydrogen fuel cell electric buses in the United States using the Greenhouse Gases, Regulated
Emissions, and Energy Use Transportation (GREET) model. The researchers found that
hydrogen fuel cell electric transit buses reach to a break-even point with diesel buses in terms
well-to-wheel energy consumption and air pollutant emissions, and start producing net benefits
in this regard. Xylia et al. (2019) presented a case study from Stockholm, Sweden on the
implications of transit bus electrification in terms of carbon emissions employing an optimization
model to find the optimum location of electric bus chargers and estimate the associated life cycle
carbon emissions, and eventually the climate change impact of bus electrification. The
researchers employed Ecoinvent – a life cycle inventory database – and Intergovernmental Panel
on Climate Change (IPCC) 2013 GWP100 impact assessment method. The life cycle
environmental impacts from powertrain manufacturing and maintenance, road construction, and
the transportation service delivery were excluded from the analysis. The optimization model
constructed by the researchers in another study of theirs was utilized for the analysis. The
researchers found that GWP of the studied bus type was mainly dominated by the emissions
associated with fuels and batteries, and that electricity as a transportation fuel type outperformed
first-generation biofuels in terms of GWP. The study concluded that electrification could be
beneficial for reducing conventional air pollution reduction; however, that it was hard to offer
the same claim for the overall reduction.

17
CHAPTER 3: METHODOLOGY
3.1 Hybrid Life Cycle Sustainability Assessment
Owing to its ability to provide a comprehensive and analytical framework, life cycle
assessment (LCA) is considered as a well-established tool, widely used by scholars from diverse
scientific backgrounds to analyze and assess the environmental impacts of production and
consumption (Guinée et al. 2002). Through complementary impact methods that may be
incorporated in an LCA, it becomes possible to quantify midpoint indicators (e.g. global
warming potential, photochemical oxidant formation potential, resource consumption etc.) and
endpoint indicators (e.g. human health, social assets, biodiversity etc.) with regard to production
or consumption system at hand (Russell et al. 2005).
Different LCA approaches have been proposed by scholars that attempted to broaden the
capabilities of the LCA tool. Since its introduction, approaches such as consequential LCA,
attributional LCA (Russell et al. 2005), process-LCA, and economic input-output (EIO) LCA
(Hendrickson et al. 1997; Lenzen 2000) have been employed to different production and
consumption systems. Recently, process LCA – also referred to as process-based LCA (Haes et
al. 2004)- and EIO LCA have reached a wider use both in academy and industry. However, LCA
is limited in that it mainly focuses on environmental and energy analysis of an economic activity,
hence not able to capture social and economic impacts thereof (Sala et al. 2013). Therefore, LCA
is extended with the social LCA (SLCA) and life cycle cost (LCC) analysis through the use of
EIO analysis. The hybrid life cycle sustainability assessment (LCSA) approach employed in this

18
study is composed of process-based LCA and EIO analysis techniques. Through hybridization,
the life cycle sustainability impacts could be more effectively estimated.
Kloepffer (2008) defined the LCSA framework, and Finkbeiner et al. (2010) contributed
to formulating and operationalizing the framework. Accordingly, LCSA was defined as the
following:
LCSA = LCA + LCC + SLCA ( 1 )
Input-output analysis method introduced by Leontief (1970) and employed in this study
enables the operationalization of the LCSA framework. Previously, similar models were developed
based on the IO method for the U.S. (Kucukvar and Tatari 2013), U.K., and Australian economies
(Foran et al. 2005). For the purposes of this study, the Eora database developed by Lenzen et al.
(2013) is used to construct a single region industry-by-industry IO model for the U.S. economy to
assess the studied life cycle sustainability impacts from the considered transit buses. Eora was
chosen because of its high consistency and level of sectoral details (Wiedmann et al. 2015). In
essence, Eora is composed of national input-output tables that represent the entire global economy
(Lenzen et al. 2013).
In Eora, an IO table is constructed converting Supply and Use Tables (SUTs) of 190
countries that are merged with environmental, social, and economic satellite accounts such as GHG
emissions, labor inputs, energy use, water requirements, etc., into Make and Use Matrixes for the
purposes of this study (Lenzen et al. 2013).
The Use matrix, denoted as U, gives information on the consumption of commodities by
other industries or final demand categories (i.e. households, government, investment, and export).

19
In this matrix, the columns show commodities purchased by industries, whereas the rows show
industries that use those commodities. As a component of U, uij denotes the value of the purchase
of commodity i by industry j. Using the information provided by U, the technical coefficient matrix
B is computed through the following equation (Miller and Blair 2009):
B = �bij� = �uijxj� ( 2 )
where bij denotes the amount of commodity i required to produce a dollar-worth output of
industry j, and xj denotes the total amount of industry j including imports.
The Make matrix – the transposed supply table -, denoted as V, provides information on
the production of commodities by industries. In this matrix, the rows show the amount of
commodities used by industries, whereas the columns show industries. Using information given
by the V matrix, the industry-based technology coefficient matrix D (also referred to as market
share matrix) can be formed as the following (Miller and Blair 2009):
D = �dij� = �vijqi� ( 3 )
where vij denotes the value of the output of commodity i by industry j; qi denotes the total
output of commodity i, and dij denotes the fraction of total commodity i’s output produced by
industries.
After defining B and D matrixes, an industry-by-industry IO model can be formulated as
the following (Miller and Blair 2009):
𝑥𝑥 = [(𝐼𝐼 − 𝐷𝐷𝐷𝐷)−1]𝑓𝑓 ( 4 )

20
where x denotes the total industry output vector, I denotes the identity matrix, DB denotes
the direct requirement matrix, and f denotes the total final demand vector.
Once the IO model is constructed, the LCSA impacts can be estimated by multiplying the
final demand of an industry j with the multiplier matrix. A vector of total LCSA impacts is
formulated as the following (Miller and Blair 2009):
r = Edimx = Edim[(I− DB)−1]f ( 5 )
where r denotes the total impact vector that gives the estimations of LCSA impacts per
unit of final demand, and Edim represents a diagonal matrix, consisting of LCSA impact values
per dollar-worth output of each industry. The multiplier matrix consists of the product of Edim
and (I – DB)-1, values of which are provided in Table 1. These multipliers are used to quantify
the LCS indicators considered in the analysis. These LCS indicators are presented in Table 1.

21
Table 3-1 Life cycle sustainability indicators analyzed
Impact Area Impact/Indicator Unit Description
Environment
al Global Warming Potential (GWP)
tCO2-eq. Total GHG emissions based on IPCC’s
factors for GWP100
Social
Employment
person
Number of jobs based on Bureau of
Labor Statistics (BLS) data for total
employment for each sector
Income
$M The compensation of employees,
wages, and salaries
Economic Gross Domestic Product
$M
Economic value added by the U.S.
sectors
Life Cycle Cost Cost of an automated heavy-duty truck
throughout its life cycle
Social Cost of Air
Pollution
Health damage cost of air pollution
Almost all of the upstream environmental impacts stemming from the manufacturing
phase are obtained the Eora-based EIO model developed for the purposes of the study. The EIO
model developed for the U.S. economy uses the economic input-output tables based on the
transactions executed 2015. As for the downstream environmental impacts, which are caused by
the use phase, both the EIO model and process-based models such as the Greenhouse gases,
Regulated Emissions, and Energy use in Transportation (GREET) (Center for Transportation
Research 2016), Alternative Fuel Life-Cycle Environmental and Economic Transportation
(AFLEET) (Burnham 2017), and Motor Vehicle Emission Simulator (MOVES) (EPA 2014)
models are used. For the categorization of the data used in the model North American Industry

22
Classification System (NAICS) is employed (Green Design Institute 2006). Therefore, the input
values to account for the upstream environmental impacts of the life cycle phases are the
purchase prices of each of the studied transit buses and their additional parts, if any.
The tailpipe emissions that stem from the fuel consumption during the use phase are
obtained from FEC Bus model developed by Xu et al. (2015), which is built upon vehicle
specific function that uses second-by-second vehicle speed data. The reason why an activity-
based approach, i.e. the use of vehicle specific power (VSP), has been adopted is because fuel
consumption and associated emissions rates are better explained by VSP (Frey et al. 2007). In
turn, there are other parameters that affect the VSP required for efficient bus operations. Road
grades and passenger loads, which have been proven to significantly affect fuel consumption
and, ultimately, the associated emissions, are among these parameters (Frey et al. 2007; Khan
and Clark 2010). The AFLEET tool enables the examination of indicators such as petroleum use,
GHGs and air pollutant emissions, and cost of ownership of both light-duty and heavy-duty
vehicles (Burnham 2017). The AFLEET tool also uses the U.S. EPA’s Motor Vehicle Emissions
Simulator (MOVES) database to trace air pollutant emissions since the MOVES model was
developed to reflect the air pollutants produced from vehicle operating processes (EPA 2014).
Just like LCA framework, LCSA framework consists of four consecutive steps, namely
goal and scope definition, life cycle inventory analysis, life cycle impacts assessment, and
interpretation (International Organization for Standardization 2006). According to this
framework, firstly, the goal and scope of the study is defined. This includes system boundary,
level of aggregation, and the midpoint and endpoint impact categories that are to be analyzed at
the end of the assessment. Secondly, the inputs and outputs, e.g. raw materials used, water,
23
energy, and emissions, of the defined system boundary are documented. In the following stage,
the impacts of the inputs used and the outputs obtained are assessed by using a specific impact
method. The ReCiPe methodology provided by Huijbregts et al. (2017) has been employed for
life cycle impact assessment. Finally, the assessment results are interpreted and reported for
effectively communicating the LCS impacts of the studied system.
3.1.1 Life Cycle Inventory
A conventional (diesel) transit bus is considered the baseline truck, composed of the
essential truck components such as truck’s body, shell, engine, other miscellaneous parts, and a
trailer. Alternative fuel buses require the installation of additional parts, and these additional
parts come along with additional costs to the baseline truck manufacturing. For example, a
hybrid bus is equipped with a battery pack and an electric motor, while a battery electric bus
(BEB) requires glider and power electronics, in addition to a battery pack and an electric motor.
Similarly, a compressed natural gas-fueled (CNG) bus uses a metal tank to store its fuel.
In addition to the differences in physical characteristics of the studied buses,
infrastructural needs of the studied buses are also reflected in the analysis. For diesel and hybrid
buses. the diesel station construction cost per gallon is first calculated based on the infrastructure
cost model provided by AFLEET (Burnham 2017). Then, to account for the parts of the station
construction costs that belong to the studied buses, the obtained value is then multiplied by the
amount of fuel consumed by the relevant buses throughout their life cycles. For CNG bus type,
the construction cost per mile is calculated based on the AFLEET; and the estimated value is
then multiplied by vehicle-miles-travelled (VMT) of CNG bus to account for their causes of the

24
examined life cycle sustainability impacts associated with the construction of a natural gas
refueling station. As for BE bus type, electric vehicle suppy equipment (EVSE) station cost that
pertains to a battery electric bus throughout its lifetime is estimated based on the total cost of
constructing a station provided by the AFLEET model (Burnham, 2017). The lifetimes of these
infrastructures are assumed to be 30 years as provided by the AFLEET model (Burnham, 2017).
The considerations (e.g. fuel prices, refueling stations, and air pollution costs) regarding the
inputs for LCSA are presented.
The life cycle fuel consumption of each studied transit bus type is calculated by the
division of a bus’s vehicle-miles-travelled by its fuel economy. Therefore, fuel economy of the
studied transit buses are significant for the LCSA results. The fuel economies of each studied
transit bus type has been obtained from the activity-based FECBUS model developed by Xu et
al. (2015), which are provided in Table 2 below.
Table 3-2 Fuel economy (fuel consumption for BE transit bus) values for the studied bus options
in the studied cities
Fuel Economy/Fuel Consumption
Atlanta Miami
Diesel (mpdg)a 3.74 4.10
Battery Eelectric (kWh/mile) 3.47 2.58
Hybrid (mpdg)a 4.85 5.88
CNG (mpdge)b 2.73 3.14

25
Table 3-3 Life cycle sustainability impact multipliers relevant for the sectors included in the system boundary
Heavy-duty
vehicle mnfg.
Motor vehicle
parts mnfg.
Motor and generator
mnfg.
Metal tank, heavy gauge mnfg.
Natural gas mnfg.
Miscellaneous electrical
equipment and component mnfg.
Carbon dioxide (CO2) (Kt/$M) 0.353065 0.358746 0.254780 0.285574 0.849641 0.163091
Methane (CH4) (Kt/$M) 0.001076 0.001332 0.001140 0.001758 0.003568 0.000846
HFC-134a (Kt/$M) 0.000300 0.000186 0.000400 0.000723 0.000476 0.000490
HFC-143a (Kt/$M) 0.000312 0.000195 0.000414 0.000750 0.000493 0.000503
HFC-125 (Kt/$M) 0.000309 0.000192 0.000407 0.000736 0.000484 0.000501
Dinitrogen oxide (N20) (Kt/$M) 0.000285 0.000193 0.000371 0.000660 0.000563 0.000441
Employment (person/$M) 3.680948 3.795739 3.888803 5.640225 3.062494 4.739971
Income (000 USD / $M) 405.066068 290.581238 447.575874 543.375575 323.424383 492.736376
GDP ($M/$M) 0.680973 0.718459 0.806596 0.830981 0.856103 0.790236

26
The inputs that are entered to the developed EIO model are the unit costs of each
component related to the manufacturing and operations of the studied buses. Accordingly, once
life cycle fuel costs, life cycle maintenance costs, and life cycle battery replacement (i.e. for
hybrid and BE buses) are calculated, it is then possible to estimate the values of the examined
life cycle sustainability indicators utilizing the multipliers, shown in Table 1, which are obtained
from the developed EIO model.
3.2 Multi-Objective Linear Programing
The multi objective linear programming (MOLP) approach has been employed for the
analysis. The LCS impacts of transit buses are categorized into three main category in
accordance with the LCSA framework, i.e. environmental, social, and economic, based on the
studied LCSA indicators. These three sustainability dimensions are considered as the multiple
objectives which, depending on the indicator that belongs to each dimension, a transit agency
seeks to minimize or maximize the impact. The life cycle sustainability indicators assumed in the
analysis are global warming potential (GWP) for environmental dimension, employment and
income for social dimension, and gross domestic product (GDP), social cost of air pollution
(SCAP), and life cycle costs (LCCs) for economic dimension.
An optimal transit bus fleet mix for Atlanta, GA, and Miami, FL is found by using the
MOLP approach, in which constraints with regard to transit agencies’ circumstances (e.g. budget
constraints, emission reduction goals or the like, etc.). The approach employed in this study is
suited to type of decision-making cases, in which there are multiple objectives to be considered,
and an infinite number of possible decisions (Eiselt and Sandblom 2012). The optimization

27
model constructed for the purposes of this study is formulated by using a MINIMAX function.
The decision variables included in the model are the number of the studied buses (i.e. diesel,
hybrid, BE, CNG, and FC) in a transit bus fleet, hypothetically assuming that the fleets in both
cities are composed of 100 buses for the purposes of the study, like in (Ercan et al. 2015).
The multi objective optimization (MOO) model has been constructed as it applies to the
transit bus fleets in two U.S. metropolitan areas, namely Atlanta, GA and Miami, FL, which are
indexed on j, composed of four transit buses, which are indexed on i. Accordingly, the sets
included in the optimization model are set J, which is composed of the studied metropolitan
areas and given as J = {1(Atlanta), 2(Miami)}; and set A, which is composed of the studied bus
types and given as A = {1(diesel), 2(hybrid electric bus), 3(compressed natural gas bus),
4(battery electric bus)}. Decision variables are Zij, the number of bus type i given a city j, and Qj,
objective function values’ maximum weighted deviations from their target values for a city j.
According to this setting, the purchase decision on each studied bus type i by each city j is
denoted by the variable Pij. For example, P22 represents hybrid electric bus that may potentially
be purchased by Miami transit fleet. The model parameters are obtained from the hybrid life
cycle sustainability analysis carried out in the first part of the thesis and defined as global
warming potential (GWP) (i.e. based on life cycle carbon dioxide equivalent emissions) as
environmental impact indicator, employment and income as social impact indicators, and gross
domestic product (GDP), life cycle cost (LCC) and social cost of air pollution (SCAP) as
economic indicators. Accordingly, 𝑍𝑍𝑖𝑖𝑖𝑖1 denotes the GWP of transit bus type i in city j, 𝑍𝑍𝑖𝑖𝑖𝑖2 denotes
the employment, 𝑍𝑍𝑖𝑖𝑖𝑖3 denotes the income, 𝑍𝑍𝑖𝑖𝑖𝑖4 denotes the GDP, 𝑍𝑍𝑖𝑖𝑖𝑖5 the LCC, and 𝑍𝑍𝑖𝑖𝑖𝑖6 denotes the
SCAP, all in the same manner as the GWP.

28
In addition, to find the target values of each model parameters for the application of the
MINIMAX function-based optimization model, six single minimization models have been
developed, which are given as the followings:
𝐺𝐺𝑖𝑖 = The minimum GWP value resulting from a fleet of 100 transit buses in city j,
𝐸𝐸𝑖𝑖 = The maximum number of employment resulting from a fleet of 100 transit buses in city j,
𝐼𝐼𝑖𝑖 = The maximum amount of income resulting from a fleet of 100 transit buses in city j,
𝐷𝐷𝑖𝑖 = The maximum amount of GDP resulting from a fleet of 100 transit buses in city j,
𝐿𝐿𝑖𝑖 = The minimum amount of LCC incurred by a fleet of 100 transit buses in city j, and
𝑆𝑆𝑖𝑖 = The minimum amount of SCAP incurred by a fleet of 100 transit buses in city j.
Since some of the model parameters such as employment, income, and GDP are positive
indicators, meaning that the higher their values are, the more benefits a transit bus fleet provides.
Therefore, to include these in the developed optimization model, their objective function values
have been multiplied by -1, which are given as the followings:
Gj = MIN ∑ Pij4i=1 × Zij1 ( 6 )
Ej = MIN ∑ Pij4i=1 × Zij2 ( 7 )
Ij = MIN ∑ Pij4i=1 × Zij3 ( 8 )
Dj = MIN ∑ Pij4i=1 × Zij4 ( 9 )
Lj = MIN ∑ Pij4i=1 × Zij5 ( 10 )
Sj = MIN ∑ Pij4i=1 × Zij6 ( 11 )
Subject to

29
∑ Pij4i=1 = 100 ( 12 )
Pij ≥ 0, ∀ i ∈ A, j = 1,2 ( 13 )
Pij ∈ INTEGER,∀ i ∈ A ( 14 )
As mentioned previously, the optimization model constructed for the analysis will
eventually find an optimum number of buses in a transit bus fleet minimizing costs and negative
impacts (i.e. GWPs, LCCs, and SCAP) and maximize positive impacts (i.e. employment,
income, and GDP). These indicators are essentially the model parameters used in the
optimization model. Because these model parameters have different units, the objective function
of the model will be composed of the weighted percentage deviations of these parameters, as also
applied in (Ercan et al. 2015). Four weighting scenarios have been examined in the thesis. These
scenarios include equal weights (𝛽𝛽𝐸𝐸𝐸𝐸𝐸𝐸 = 𝛽𝛽𝑆𝑆𝑆𝑆𝑆𝑆 = 𝛽𝛽𝐸𝐸𝑆𝑆𝑆𝑆 = 1), environmental-dominant (𝛽𝛽𝐸𝐸𝐸𝐸𝐸𝐸 =
2,𝛽𝛽𝑆𝑆𝑆𝑆𝑆𝑆 = 𝛽𝛽𝐸𝐸𝑆𝑆𝑆𝑆 = 1), social-dominant (𝛽𝛽𝑆𝑆𝑆𝑆𝑆𝑆 = 2,𝛽𝛽𝐸𝐸𝐸𝐸𝐸𝐸 = 𝛽𝛽𝐸𝐸𝑆𝑆𝑆𝑆 = 1, economic-dominant
(𝛽𝛽𝐸𝐸𝐸𝐸𝐸𝐸 = 𝛽𝛽𝑆𝑆𝑆𝑆𝑆𝑆 = 1,𝛽𝛽𝐸𝐸𝑆𝑆𝑆𝑆 = 1).
3.3 Pareto Optimum
To make more informed decisions, it is very useful to have a knowledge of the trade-offs
between multiple objectives that are considered in the decision-making process. Trade-offs, as
found in this analysis, are nothing but the conditions, with which an objective gets worse while
another objective is improved. This state, where such a condition applies to, is called Pareto
optimality. Following the methodology presented by Winston and Albright (2008), the trade-off
curves for the assumed multiple objectives were determined. Accordingly, it is possible for a
transit agency (or a decision-maker, in this regard) to understand the changes in the objective
function value when a decision is altered. The parameters included in the trade-off analysis are

30
the life cycle costs (LCCs) and global warming potentials (GWPs) of the studied transit bus
options.
To generate the trade-off curves, a single objective optimization model (i.e. a
minimization problem) has been constructed using linear programming method. The parameters
that have been used in this optimization model remain the same as those used in the multi-
objective optimization problem defined in the previous section. Accordingly, the maximum
GWP and LCC values are first calculated using the following model:
Hj = MAX∑ 𝑃𝑃𝑖𝑖𝑖𝑖4𝑖𝑖=1 × 𝑍𝑍𝑖𝑖𝑖𝑖1 ( 15 )
Oj = MAX∑ 𝑃𝑃𝑖𝑖𝑖𝑖4𝑖𝑖=1 × 𝑍𝑍𝑖𝑖𝑖𝑖3 ( 16 )
where Hj denotes the maximum GWP that can result from a fleet of any combination of
100 transit buses for city j; and Oj denotes the maximum LCC that can result from a fleet of any
combination of 100 transit buses. Once these maximum values are calculated, the boundary
values of GWP and LCC could be determined since the minimum values are obtained from Gj
and Lj. Pareto optimal solutions are determined at every 20 thousand tons of CO2 intervals using
the following single objective optimization model:
Lj = MIN ∑ Pij4i=1 × Zij5 ( 17 )
Subject to
∑ Pij4i=1 = 100 ( 18 )
Pij ≥ 0, ∀ i ∈ A, j = 1,2 ( 19 )
Pij ∈ INTEGER,∀ i ∈ A ( 20 )
Gj ≤ ∑ Pij4i=1 × Zij1 ≤ Hj ( 21 )
The constraint ( 20 ) is repeated for each predetermined GWP interval, which was 20,000
ton C02 in this case by changing Lj.

31
CHAPTER 4: FINGINGS
4.1 Hybrid Lice Cycle Sustainability Assessment Results
4.1.1 Environmental Impacts
The environmental impacts are reported based on the global warming potentials of the
studied transit buses operating in the examined metropolitan areas. The overall results are
presented in Figure 2. Accordingly, the total GWP of all the studied transit buses are
significantly higher in Atlanta relative to Miami; however, the GWP intensities (i.e. CO2-eq. per
life cycle vehicle-miles-traveled) of the transit buses are higher in Miami than in Atlanta. A CNG
bus has been observed to be the worst performing transit bus type studied in terms of the GWP in
Atlanta. In Miami, while a battery electric bus has been observed to cause the biggest harm with
regard to the GWP, a CNG bus operating in Miami has been estimated to cause only 3% less
GWP than its battery electric counterpart.
Figure 4-1 Global warming potentials of transit bus options in the studied areas
0
2000
4000
6000
8000
Diesel Hybrid CNG BE
CO
2-eq
. (to
n)
Atlanta Miami

32
The underlying reason behind this picture is the heavy burden that the production of
natural gas as a transportation fuel places on the total GWP of a CNG bus. Another factor that
plays a significant role in this result is the CNG bus’s fuel economy obtained from the activity-
based FECBUS model, which is the lowest in comparison to all the other bus options considered
in the analysis.
Figure 4-2 Global warming potential of individual life cycle phases for Atlanta
A diesel bus operating in Atlanta has a GWP of 5025 ton CO2-eq., which is almost two
times that of a diesel bus operating in Miami. The activities associated with vehicle
manufacturing, and fuel production and consumption have been observed to be responsible for
the great majority of the GWP impacts of this type of bus in both metropolitan areas examined.
While tailpipe emissions make up almost 30% of the GWP potential of a diesel bus operating in
Miami, it is almost 45% for the same bus in Atlanta. In addition, the GWP attributable to fuel
0
2000
4000
6000
8000
Diesel Hybrid CNG BE
CO
2-eq
. (to
ns)
Bus manufacturing Battery manufacturingGlider manufacturing Maintenance and repairFuel production Battery replacementFuel station construction Fuel station maintenanceAdditional parts manufacturing Tailpipe

33
production activities for a diesel bus in Atlanta is 22% of the total GWP, it is less than 20% for a
diesel bus operating in Miami. On the other hand, vehicle manufacturing-related impacts have
been observed to be responsible for almost 45% of the GWP of a diesel bus in Miami, while it
has been estimated to account for 23% of the total impact in Atlanta. As can be seen in Figure 3
and Figure 4, the manufacturing of battery electric bus causes the largest GWP, among other life
cycle components. It has been observed that CNG bus underperforms all the other studied transit
bus types both in Atlanta and Miami.
Figure 4-3 Global warming potential of individual life cycle phases for Miami
Given the role of vehicle-miles-travelled in fuel economy profiles (and fuel production as
a result of the consumption) of the studied transit bus options, the studied transit bus options
operating in Miami have caused lesser amounts of GWPs relative to those in Atlanta. Therefore,
0
1000
2000
3000
4000
Diesel Hybrid CNG BE
CO
2-eq
. (to
ns)
Bus manufacturing Battery manufacturingGlider manufacturing Maintenance and repairFuel production Battery replacementFuel station construction Fuel station maintenanceAdditional parts manufacturing Tailpipe

34
to better understand the efficiency of these bus options, it is useful to take a look at the GWP
intensity of each bus options running in both cities, as shown in Figure 5.
Figure 4-4 Global warming potential intensities of transit bus options in the studied areas
Battery electric bus has been found to be the most efficient bus option for operations in
Atlanta, whereas it is conventional bus that has been found to be the most efficient bus option for
operations in Miami.
0.0893 0.0888
0.1286
0.0755
0.12330.1410
0.1678 0.1668
Diesel Hybrid CNG BE
GWP intensity (ton CO2-eq./mile)
Atlanta Miami

35
4.1.2 Social Impacts
The social impacts are reported based on the employment and income indicators. The
overall results with regard to employment are presented Figure 6 and Figure 7. Accordingly, the
total employment created by each studied truck type in Atlanta is about two times the
employment created by the studied transit buses in Miami. This is due largely to the daily VMT
of the buses driven in Atlanta being greater relative to that of Miami. Employment associated
with CNG bus type has been observed to be the highest in Atlanta, followed by battery electric
bus type. Of the total employment created, almost 65% is attributable to maintenance and repair
(M&R) activities. This is mainly to the fact that average daily mileage (or VMT) of the studied
transit bus options in Atlanta is higher than the daily VMT of the studied transit bus options
operating under the Miami conditions. This higher VMT results in relatively more maintenance
and repair activities of a diesel bus in Atlanta. When it comes to employment, M&R activities
also play a significant role in Miami; however, employment related to bus manufacturing has
also been found significant as such activities are responsible for almost 35% of the total
employment created by a diesel bus in Miami.

36
Figure 4-5 Employment created by the studied bus types in Atlanta (persons)
In Atlanta, the activities related to maintenance and repair have been observed to
contribute to employment creation the most for all the studied bus types. In Miami, given
relatively shorter VMT, the activities related to the manufacturing of hybrid and battery electric
bus types contribute the most to employment creation, with 49% and 38.5% of the total
employment, respectively, while it is the activities related to maintenance and repair that
contribute the most to employment creation by diesel (51%) and CNG (45%) buses. In Atlanta, a
CNG bus type has been observed to create the highest number of employment, whereas it is the
battery electric bus type in Miami.
0
5
10
Diesel Hybrid CNG BE
Pers
ons
Employment
Bus manufacturing Battery manufacturingGlider manufacturing Maintenance and repairFuel production Battery replacementFuel station construction Fuel station maintenanceAdditional parts manufacturing

37
Figure 4-6 Employment created by the studied bus types in Miami (persons)
Overall, employment associated with battery electric bus type has been observed to be the
highest in Miami, followed by CNG bus type. As mentioned previously, this is also the case in
Atlanta. The reason behind the effect of CNG bus type on employment is likely to be attributable
to natural gas supply (i.e. natural gas refueling station). The findings related to employment are
consistent with the data provided by Hughes-Cromwick et al. (2018) in American Public
Transportation Association (APTA)’s recent report. The data in this report revealed that vehicle
operations and maintenance account for the great majority of the employment in public transit
industry. Furthermore, the APTA’s report stated that each $1 billion investment in public transit
industry resulted in 50,000 jobs. When it is assumed that the same amount of investment is done
in the transit bus system, the amount of employment generated by the transit bus system has been
estimated to be around 6 to 9 thousands in Atlanta, and 3 to 5 thousands in Miami. Considering
012345
Diesel Hybrid CNG BE
Pers
ons
Employment
Bus manufacturing Battery manufacturingGlider manufacturing Maintenance and repairFuel production Battery replacementFuel station construction Fuel station maintenanceAdditional parts manufacturing

38
the fact that these results only reflect the transit bus systems in these cities, the numbers are
aligning with that of the APTA’s report.
Income is another indicator that represents the social dimension. As shown in Figure 8,
the battery electric bus type has been estimated to generate the highest income ($610K),
followed by CNG bus type ($595K) in Atlanta. For all the studied bus types in Atlanta, the
activities associated with maintenance and repair activities have been observed to generate the
majority of the total income generated. This is followed by the activities related to the
manufacturing of each bus type. These results align with the rate of employment created through
these activities, which are consistent with the data provided by APTA’s report. The lowest
income generating transit bus options in Atlanta have been found to be conventional ($455K)
and hybrid transit buses ($510K). The difference stems from the income generated through
hybrid bus manufacturing activities.
Figure 4-7 Income ($K) generated through the studied buses in Atlanta
$0
$140
$280
$420
$560
$700
Diesel Hybrid CNG BE
Inco
me
($K
)
Bus manufacturing Battery manufacturingGlider manufacturing Maintenance and repairFuel production Battery replacementFuel station construction Fuel station maintenanceAdditional parts manufacturing

39
As for Miami, the picture is slightly different in that the income generated through the
activities associated with bus manufacturing is almost the same as those stemming from fuel
production and M&R related activities combined. Unlike the case of Atlanta, battery electric and
hybrid bus types have been estimated to generate the highest income, with almost $390K and
$315K of income, respectively. In Miami as well, there seems to be a consistent relation between
the rate of employment and the income generated. Another difference observed in Miami relative
to Atlanta is that the incomes generated through bus manufacturing activities have been found to
be higher than any other life cycle component. This is followed by maintenance-and-repair-
related activities and fuel production-related activities. This is mainly due to the relatively lower
VMT and the relatively better fuel economy/fuel consumption experienced in Miami.
Figure 4-8 Income ($K) generated through the studied buses in Miami
$0
$100
$200
$300
$400
$500
Diesel Hybrid CNG BE
Inco
me
($K
)
Bus manufacturing Battery manufacturingGlider manufacturing Maintenance and repairFuel production Battery replacementFuel station construction Fuel station maintenanceAdditional parts manufacturing

40
In Atlanta, the manufacturing of battery (including battery replacement) for battery
electric transit bus has been estimated to account for 9% of the total income generated through
this bus type; whereas the income generated through battery manufacturing has been estimated to
be almost 15% of the total income in Miami.

41
4.1.3 Economic Impacts
One of the economic sustainability indicators that represent the economic dimension is
social cost of air pollution (SCAP). Figure 10 presents the overall social cost of air pollution
caused by each of the studied bus types operating in Atlanta. Tailpipe emissions have been
observed to cause the greatest health damage in Atlanta due to relatively higher VMT. This is
followed by the health damage costs incurred by the activities associated with fuel production in
Atlanta; on average, over one fourth of the SCAP of the studied buses, except for the battery
electric bus type, is caused by the production of diesel or natural gas as a transportation fuel. On
the other hand, the activities related to power generation for the battery electric bus type is
responsible for over 70% of the SCAP in Atlanta.
Figure 4-9 Social cost of air pollution caused by the studied buses in Atlanta
$0
$50
$100
$150
$200
Diesel Hybrid CNG BE
Soci
al C
ost o
f Air
Pollu
tion
($K
)
Bus manufacturing Battery manufacturingGlider manufacturing Maintenance and repairFuel production Battery replacementFuel station construction Fuel station maintenanceAdditional parts manufacturing Tailpipe

42
As shown in Figure 10 and Figure 11, the battery electric bus type incurs the least amount
of SCAP in both of the analyzed metropolitan areas. In Atlanta, with $147K of SCAP, CNG bus
type has been found to incur the highest social cost of air pollution, followed by conventional
bus. Unlike in Atlanta, due to the activities related to diesel production, the diesel bus causes the
highest amount ($57K) of SCAP in Miami, even though the SCAP incurred by the CNG bus’s
tailpipe emissions is slightly higher than that of a diesel bus in Miami, where CNG bus type has
been estimated to cause a SCAP of $55K.
Figure 4-10 Social cost of air pollution caused by the studied buses in Miami
Health impact costs resulting from a diesel bus operating in Atlanta and Miami are
estimated to be $140K and $57K, respectively. The total health impact cost of a diesel bus in
Miami is largely driven by the conventional air pollutants coming from bus’s tailpipe, which is
$0
$14
$28
$42
$56
$70
Diesel Hybrid CNG BE
Soca
il C
ost o
f Air
Pollu
tion
($K
)
Bus manufacturing Battery manufacturingGlider manufacturing Maintenance and repairFuel production Battery replacementFuel station construction Fuel station maintenanceAdditional parts manufacturing Tailpipe

43
estimated to be responsible for 77% of the total SCAP, whereas fuel production related activities
(15%) and bus manufacturing related activities (7%) are the two other major drivers of the total
social cost of air pollution from a diesel bus in Miami. Since the VMTs of the studied transit bus
types are different in Atlanta than in Miami, it is useful to take a look at the SCAP intensity of
the studied transit buses, as shown in Figure 12. Accordingly, the SCAP intensity of CNG bus
type has been estimated to be almost identical, whereas for the remainder of the transit bus
options has been found to run more efficiently in Atlanta than in Miami despite their higher fuel
economies under the conditions in Miami. The underlying reason why this has been the case is
that the conventional air pollutants in Miami cause greater health impact relative to those in
Atlanta.
Figure 4-11 Social cost of air pollution (SCAP) intensities ($/mile) of the studied transit bus
options in both metropolitan areas
$0.00
$0.50
$1.00
$1.50
$2.00
$2.50
$3.00
Diesel Hybrid CNG BE
SCA
P In
tens
ity ($
/mile
)
Atlanta Miami

44
Another indicator that is representative of the economic dimension is gross domestic
product (GDP). Figure 13 presents the results with regard to GDP generated by the studied
transit bus types in Atlanta. One of the first observations that can be made from the figure is that
the rate of employment, income generation, and the GDP generated are consistent with each
other, reflecting the significance of the accumulation of economic activity (i.e. maintenance and
repair related activities). Even though the GDP generated through the manufacturing of hybrid
and battery electric bus types are highest in Atlanta, the CNG bus type has been observed to
produce the highest total GDP, owning to the activities associated with bus maintenance and
repair (44%), and fuel production (28.5%). Accordingly, CNG bus type has been estimated to
generate $1.33 million in Atlanta, followed by battery electric transit bus, generating $1.29
million.
Figure 4-12 Gross domestic product (GDP) ($M) generated in Atlanta
$0.0$0.2$0.4$0.6$0.8$1.0$1.2$1.4
Diesel Hybrid CNG BE
Gro
ss D
omes
tic P
rodu
ct ($
M)
Bus manufacturing Battery manufacturingGlider manufacturing Maintenance and repairFuel production Battery replacementFuel station construction Fuel station maintenanceAdditional parts manufacturing

45
In Miami, the battery electric bus has been observed to generate the highest GDP
($747K), owning to the activities associated with the manufacturing of this bus type, as shown in
Figure 14. The CNG bus follows, generating $632K of GDP. Almost 70% of total GDP
generated by these bus types are accounted for by the activities related to the manufacturing of
this bus type and maintenance and repair. The additional parts installed on a battery electric bus
accounted for 13% of the GDP generated from this bus type, while the additional parts installed
on a CNG bus has been observed to be responsible for only 4% of the total GDP from this bus
type.
Figure 4-13 Gross domestic product (GDP) ($M) generated in Miami
The last economic sustainability indicator analyzed is the life cycle cost of the studied bus
types. As evident from Figure 15, the battery electric bus type has been estimated to have the
highest LCC, among the other bus options. Accordingly, the biggest LCC component of the
$0.00
$0.20
$0.40
$0.60
$0.80
Diesel Hybrid CNG BE
Gro
ss D
omes
tic P
rodu
ct ($
M)
Bus manufacturing Battery manufacturing
Glider manufacturing Maintenance and repair
Fuel production Battery replacement
Fuel station construction Fuel station maintenance
Additional parts manufacturing Tailpipe

46
battery electric bus in Miami is the initial bus cost, while the costs associated with the battery
electric bus maintenance and repair activities have been observed to account for the biggest share
of the LCC of this bus type in Atlanta. It has been also observed that, due to relatively higher
VMT in Atlanta, the costs associated with the fuel consumption account for a significant part of
the LCC difference between the two studied metropolitan areas with respect to the BEB
operations.
Figure 4-14 Comparison of the life cycle costs and LCC intensities of the studied bus types in
the studied areas
As can be seen from Figure 15, even though the studied bus types operating in Atlanta
incurred higher LCCs (mainly due to the activities related to fuel consumption and production)
relative to those operating in Miami, the LCC intensity, given as incurred LCC per mile, is
$0 $500 $1,000 $1,500 $2,000
$0
$10
$20
$30
$40
$50
$60
Diesel Hybrid CNG BE
Life Cycle Cost ($K)
LCC
Inte
nsity
($/m
ile)
Axis Title
Atlanta Miami Miami Atlanta

47
higher in Miami than in Atlanta. This provides an overall understanding that a transit bus fleet
operating in Atlanta is economically more efficient than that of Miami.

48
4.2 Multi Objective Linear Programing Results
One of the main objectives of the thesis is to find an optimum transit bus fleet mix for the
analyzed metropolitan areas based on the life cycle sustainability performances of each of the
studied transit bus options, which have been investigated considering the geographic and social
characteristics of the two cities. According to the analysis results, when a transit bus fleet
composition decision is to be made based upon the investigated life cycle sustainability
indicators, the newly composed fleet mix does not include a diesel or a CNG bus. According to
the equal weights scenario, the Atlanta transit bus fleet is composed of 90 battery electric buses
and 10 diesel hybrid-electric buses. As shown in Figure 14, the LCC- and socio-economic
dominant scenarios resulted in the same transit bus fleet mix, composed of 67 battery electric bus
and 33 diesel hybrid-electric bus types. Lastly, the Atlanta transit bus fleet mix has been
observed to include 97 battery electric bus and only 3 diesel hybrid-electric bus options under the
environmental-dominant scenario.

49
Figure 4-15 Optimal transit bus fleet mix results for Atlanta
According to these results, the Atlanta transit bus fleet will cost an extra $7.2 million for
a fleet of 100 buses, while saving almost 53 thousand tons of CO2-eq. and $7 million of SCAP,
relative to a fleet of 100 conventional diesel buses. As shown in Figure 15, the optimization
resulted in different outcomes for Miami.
0 20 40 60 80 100
Equal weights
LCC dominant
Economic-Social heavily dominant
Environmental dominant
Transit Bus Fleet Mix
Diesel Hybrid CNG Battery-Electric

50
Figure 4-16 Optimal transit bus fleet mix results for Miami
Accordingly, the environmental-dominant scenario and the equal weights scenario results
provided similar outcomes with respect to the Miami transit bus fleet, with the former being
composed of 75 battery electric bus and 25 conventional diesel bus, and the latter being
composed of 76 battery electric bus and 24 conventional diesel bus options. The remaining two
scenarios have resulted in the same outcomes, with the fleet mix composed of 87 diesel hybrid-
electric bus and 13 battery electric bus options. This is largely due to the relatively lower
vehicle-miles-traveled by the bus options in Miami. Another likely reason is the lower ridership
in Miami, relative to Atlanta, since, as the thesis shows, passenger load is a significant factor in
the vehicle specific power required and hence, bus’s fuel consumption. The newly composed
transit bus fleet would results in an SCAP reduction of over $2 million, and generating $16
million more GDP relative to a fleet of 100 conventional diesel buses.
0 20 40 60 80 100
Equal weights
LCC dominant
Economic-Social heavily dominant
Environmental dominant
Transit Bus Fleet Mix
Diesel Hybrid CNG Battery-Electric

51
4.3 Trade-off Results
Based on the results obtained from the hybrid life cycle sustainability assessment and
multi-objective optimization analysis, a tradeoff has been observed between the global warming
potential and life cycle costs of the studied bus types. As presented in Figure 16, the Atlanta
transit bus mix shows a drastically linear decrease reaching the highest reduction in the LCC
between $155 and $160 million, and its GWP follows a much slower linear decrease peaking at
750 thousand tons of CO2-eq. emissions.
Figure 4-17 Trade-off analysis between global warming potential and life cycle costs for the
Atlanta transit bus mix
The boundary of the trade-off presented in the figure above is determined by the highest
and lowest data values. Essentially, this trade-off graph indicates that, for the optimum bus
150
155
160
165
170
175
180
400 450 500 550 600 650 700 750 800
LCC
($M
)
GWP (thousand tons CO2-eq.)
Atlanta Transit Bus Mix Trade-Off Graph

52
choice considering all the six indicators included in the analysis, the cost of reducing the GWP of
the Atlanta transit bus mix increases substantially after 500 thousand tons of CO2-eq. emissions.
In contrast to the case of Atlanta, no trade-off has been found for the Miami transit bus mix when
the Pareto optimality has been searched for based only on the GWP and LCC indicators. This is
likely because the hybrid LCSA results showed that the conventional diesel bus type has the
lowest GWP and LCC under Miami driving conditions. Therefore, in every iteration the
optimization model presented with the equation ( 17 ) subject to the constrains ( 18 ) through ( 21
) was run, another diesel transit bus was added given their lowest LCC and lowest GWP under
the operating conditions in Miami.

53
CHAPTER 5: CONCLUSIONS
Transit buses are claimed to have important implications in terms of mitigating global
warming, reducing the social cost of air pollution owning to its ability to lower private vehicle
use and hence, fuel consumption, and contributing to the national economy through employment
creation, and GDP and income generation. However, different cities have different geographic
and social characteristics, which in turn affect the costs and benefits of transit buses. Taking into
consideration these factors, this thesis has first analyzed the life cycle sustainability implications
of alternative transit bus options based on six sustainability indicators and compared the results
with that of a conventional diesel bus. Secondly, the results of the hybrid LCSA have been used
in a multi-objective optimization model constructed by using the MINIMAX function – a multi-
objective linear programming method – to find an optimal transit bus fleet mix.
The results of the study confirm the significance of taking into consideration regional
differences (e.g. terrain characteristics, transit ridership, driving cycle characteristics, and
auxiliary loads such as an air conditioner etc.) when analyzing the life cycle impacts of transit
buses. This indicates that different efforts may be necessary for each public transportation
agency to improve the overall sustainability of their transit bus fleets. This is also supported by
the trade-off analysis. Based on the GWP intensity analysis results, the CNG bus option has been
found to underperform all the other bus options from the environmental sustainability standpoint.
Therefore, even though CNG-powered transit buses have been the first choice of transit agencies
to adopt in their transit bus fleets ((Hughes-Cromwick et al. 2018), it is the worst transit bus
options, especially in terms of its environmental impacts due mainly to higher hydrofloro

54
carbons (HFCs) and nitrogen oxides from natural gas production, and higher tailpipe emissions
due to the worst fuel economy.
As evident from the LCC and GWP intensity results, the Atlanta transit bus fleet is likely
to be more efficient relative to the Miami transit bus fleet, despite better fuel economies of the
studied transit bus types in Miami. Similarly, battery electric bus has been found to be more
suitable and sustainabl for the Atlanta transit bus fleet relative to that of Miami. This is likely to
be because of the differences between the electricity grid mix in Florida Reliability Coordinating
Council (FRCC) and in SERC Reliability Corporation (SERC). The electricity supply in Florida
is dominated largely by natural gas, whereas the electricity supply in Georgia is domintated
largely by nuclear and renewable energy sources.
Diesel transit bus has been found in an optimum transit bus fleet in Miami under the
equal weights and environmentally-dominant scenarios. Given the modeling technique employed
in this study, relatively better fuel economy of diesel transit bus operating in Miami, which is one
of the significant determinants of fuel consumption, and relatively lower diesel prices are the
main reasons behind that optimization result. This result is consistent with the findings from
others such as Allcott and Wozny (2012) and Jeihani and Sibdari (2010) in that consumers take
into account either lower fuel prices or better fuel economy when purchasing a vehicle. With
these findings in mind, the inclusion of diesel transit bus in an optimal transit bus fleet can be
explained. Another reason therefor is likely to be the impact of the effect of electricity generation
mix on battery electric vehicle adoption, as revealed by Choi et al. (2018). Based on the multi-
objective optimization results, it can be concluded.

55
These findings reveal that public transportation agencies would be better off taking into
account geographic and socio-economic circumstances, under which each agency operates.
Furthermore, regulatory environment is likely to be significant in composing a transit bus fleet
that would outperform an old transit bus fleet in terms of sustainability impacts. However,
constraints that may arise from state-wide rules, regulations, or laws have not been taken into
account in the multi-objective optimization analyses.
There are a few aspects that should be considered for a future study that will investigate
the sustainability impacts of transit bus sphere. Firstly, a future study should broaden the life
cycle sustainability impact analysis by including more indicators, if possible. Secondly, given
their environmental performance and abundance of fuel, hydrogen fuel cell (FCB) or hydrogen
fuel cell-electric transit buses (FCEB) could be included in the analysis. However, a sensitivity
analysis should be better applied in that case because the relevant literature contains studies on
FCB and FCEB that assumed varying values for fuel economy of this transit bus type as well as
hydrogen fuel prices. Laslty, Eora database does not contain enough information on the impacts
of the construction industry. This is likely to have resulted in underestimating the sustainability
impacts of constructing the infrastructure required to supply fuel to the studied transit bus
options. Therefore, it is recommended that another IO database be used by researchers and/or
decision-makers to conduct a LCSA of alternative fuel-powered transit buses.

56
LIST OF REFERENCES
Albert A, Bickford R, Cappelli A, et al (2014) Capital Program Oversight Committee Meeting
Allcott H, Wozny N (2012) Gasoline Prices, Fuel Economy, and the Energy Paradox.
Cambridge, MA
Ally J, Pryor T (2007) Life-cycle assessment of diesel, natural gas and hydrogen fuel cell bus
transportation systems. J Power Sources 170:401–411. doi: 10.1016/j.jpowsour.2007.04.036
Ally J, Pryor T (2016) Life cycle costing of diesel, natural gas, hybrid and hydrogen fuel cell bus
systems: An Australian case study. Energy Policy 94:285–294. doi:
10.1016/J.ENPOL.2016.03.039
American Public Transportation Association (2019) Public Transit Leading in Transition to
Clean Technology Key Takeaways
Baker R, Cochran L, Norboge N, et al (2016) Alternative Fuel Vehicle Forecasts Final report
Bi Z, Keoleian GA, Ersal T (2018) Wireless charger deployment for an electric bus network: A
multi-objective life cycle optimization. Appl Energy 225:1090–1101. doi:
10.1016/J.APENERGY.2018.05.070
Bi Z, Song L, De Kleine R, et al (2015) Plug-in vs. wireless charging: Life cycle energy and
greenhouse gas emissions for an electric bus system. Appl Energy 146:11–19. doi:
10.1016/J.APENERGY.2015.02.031
Bureau of Transportation Statistics (2019) Transportation Statistics Annual Report 2018.

57
Washington, D.C.
Burnham A (2017) User Guide for AFLEET Tool 2017. 45
Carnegie Mellon University Green Design Institute (2008) Economic Input-Output Life Cycle
Assessment (EIO-LCA), US 1997 Industry Benchmark model [Internet]
Center for Transportation Research (2016) GREET Life-Cycle Model User Guide
Choi H, Shin J, Woo J (2018) Effect of electricity generation mix on battery electric vehicle
adoption and its environmental impact. Energy Policy 121:13–24. doi:
10.1016/j.enpol.2018.06.013
Eiselt HA, Sandblom CL (2012) Operations Research - A Model-Based Approach, 2nd edn.
Springer-Verlag Berlin Heidelberg
Emiliano WM, Costa L, Maria Carvalho S, et al (2018) Multiobjective optimization of transit
bus fleets with alternative fuel options: The case of Joinville, Brazil. Int J Sustain Transp
ISSN. doi: 10.1080/15568318.2018.1518500
EPA (2014) MOVES2014a User Guide
Ercan T, Tatari O (2015) A hybrid life cycle assessment of public transportation buses with
alternative fuel options. Int J Life Cycle Assess 20:1213–1231. doi: 10.1007/s11367-015-
0927-2
Ercan T, Zhao Y, Tatari O, Pazour JA (2015) Optimization of transit bus fleet’s life cycle
assessment impacts with alternative fuel options. Energy 93:323–334. doi:
10.1016/j.energy.2015.09.018

58
Federal Transit Administration (2019) National Transit Database Provides Key Stats on Public
Transportation in the U.S. | US Department of Transportation. In: Connections.
https://www.transportation.gov/connections/national-transit-database-provides-key-stats-
public-transportation-us. Accessed 22 Mar 2019
Finkbeiner M, Schau EM, Lehmann A, Traverso M (2010) Towards Life Cycle Sustainability
Assessment. Sustainability 2:3309–3322. doi: 10.3390/su2103309
Foran B, Lenzen M, Dey C, Bilek M (2005) Integrating sustainable chain management with
triple bottom line accounting. Ecol Econ 52:143–157. doi: 10.1016/j.ecolecon.2004.06.024
Frey HC, Rouphail NM, Zhai H, et al (2007) Comparing real-world fuel consumption for diesel-
and hydrogen-fueled transit buses and implication for emissions. Transp Res Part D
12:281–291. doi: 10.1016/j.trd.2007.03.003
Golub A, Zhen F, Clark N, et al (2011) Creation of life-cycle cost tool for transit buses to
evaluate hybrid electric bus technologies in real- world operation. Transp Res Rec J Transp
Res Board 19–26. doi: 10.3141/2218-03
Green Design Institute (2006) The EIO-LCA Method. http://www.eiolca.net/Method/index.html.
Accessed 23 Mar 2016
Guinée J, Gorrée M, Heijungs R (2002) Handbook on life cycle assessment - Operational Guide
to the ISO Standards. Kluwer Academic Publishers, Dordrecht
Haes H a. U, Heijungs R, Suh S, Huppes G (2004) Three Strategies to Overcome the Limitations
of Life-Cycle Assessment. J Ind Ecol 8:19–32. doi: 10.1162/1088198042442351

59
Hanlin J, Reddaway D, Lane J (2018) Battery Electric Buses State of the Practice
Hendrickson CT, Horvath A, Joshi S, et al (1997) Comparing Two Life Cycle Assessment
Approaches: A Process Model-vs. Economic Input-Output-Based Assessment. IEEE 176–
181
Hughes-Cromwick M, Analyst P, Dickens M, Skoutelas PP (2018) 2018 Public Transportation
Fact Book. Washington, D.C.
Huijbregts MAJ, Steinmann ZJN, Elshout PMF, et al (2017) ReCiPe2016: a harmonised life
cycle impact assessment method at midpoint and endpoint level. Int J Life Cycle Assess
22:138–147. doi: 10.1007/s11367-016-1246-y
International Organization for Standardization (2006) ISO 14040:2006 Environmental
management -- Life cycle assessment -- Principles and framework
Jeihani M, Sibdari S (2010) The Impact of Gas Price Trends on Vehicle Type Choice. J Econ
Econ Educ Res 11:
Khan AS, Clark N (2010) An Empirical Approach in Determining the Effect of Road Grade on
Fuel Consumption from Transit Buses. SAE Int J Commer Veh 3:2010-01-1950. doi:
10.4271/2010-01-1950
Kliucininkas L, Matulevicius J, Martuzevicius D (2012) The life cycle assessment of alternative
fuel chains for urban buses and trolleybuses. J Environ Manage 99:98–103. doi:
10.1016/j.jenvman.2012.01.012
Kloepffer W (2008) Life Cycle Sustainability Assessment of Products. Int J LCA 13:89–95. doi:
60
10.1065/lca2008.02.376
Kucukvar M, Tatari O (2013) Towards a triple bottom-line sustainability assessment of the U.S.
construction industry. Int J Life Cycle Assess 18:958–972. doi: 10.1007/s11367-013-0545-9
Lajunen A (2014) Energy consumption and cost-benefit analysis of hybrid and electric city
buses. Transp Res Part C Emerg Technol 38:1–15. doi: 10.1016/J.TRC.2013.10.008
Lajunen A, Lipman T (2016) Lifecycle cost assessment and carbon dioxide emissions of diesel,
natural gas, hybrid electric, fuel cell hybrid and electric transit buses. Energy 106:329–342.
doi: 10.1016/J.ENERGY.2016.03.075
Lee DY, Elgowainy A, Vijayagopal R (2019) Well-to-wheel environmental implications of fuel
economy targets for hydrogen fuel cell electric buses in the United States. Energy Policy
128:565–583. doi: 10.1016/j.enpol.2019.01.021
Lenzen M (2000) Errors in Conventional and Input-Output—based Life—Cycle Inventories. J
Ind Ecol 4:127–148. doi: 10.1162/10881980052541981
Lenzen M, Moran D, Kanemoto K, Geschke A (2013) Building EORA: A Global Multi-Region
Input–Output Database at High Country and Sector Resolution. Econ Syst Res 25:20–49.
doi: 10.1080/09535314.2013.769938
Leontief W (1970) Environmental Repercussions and the Economic Structure: An Input-Output
Approach. Rev Econ Stat 52:262–271
Li L, Lo HK, Cen X (2015) Optimal bus fleet management strategy for emissions reduction.
Transp Res Part D Transp Environ 41:330–347. doi: 10.1016/j.trd.2015.10.007

61
Los Angeles Metropolitan Transportation Authority (2017) Metro Leads the Nation in Setting
Ambitious 2030 Zero Emission Bus Goal; Takes First Step with Purchase of 100 Electric
Buses. In: Public Relations. https://www.metro.net/news/simple_pr/metro-leads-setting-
2030-zero-emission-bus-goal/. Accessed 22 Mar 2019
Lozanovski A, Whitehouse N, Ko N, et al (2018) Sustainability Assessment of Fuel Cell Buses
in Public Transport. Sustainability 10:1480. doi: 10.3390/su10051480
Miller RE, Blair PD (2009) Input-output analysis: foundations and extensions, Second.
Cambridge University Press, Cambridge
Ribau JP, Silva CM, Sousa JMC (2014) Efficiency, cost and life cycle CO 2 optimization of fuel
cell hybrid and plug-in hybrid urban buses. Appl Energy 129:320–335. doi:
10.1016/j.apenergy.2014.05.015
Russell A, Ekvall T, Baumann H (2005) Life cycle assessment – introduction and overview. J
Clean Prod 13:1207–1210. doi: 10.1016/j.jclepro.2005.05.008
Sala S, Farioli F, Zamagni A (2013) Life cycle sustainability assessment in the context of
sustainability science progress (part 2). Int J Life Cycle Assess 18:1686–1697. doi:
10.1007/s11367-012-0509-5
Tong F, Hendrickson C, Biehler A, et al (2017) Life cycle ownership cost and environmental
externality of alternative fuel options for transit buses. Transp Res Part D Transp Environ
57:287–302. doi: 10.1016/j.trd.2017.09.023
U.S. Department of Transportation Bureau of Transportation Statistics (2018) National

62
Transportation Statistics 2018. Washington, D.C.
U.S. Energy Information Administration (2016) Monthly Energy Review. Washington, DC
U.S. EPA (2019) Inventory of U.S. Greenhouse Gas Emissions and Sinks: 1990-2017
U.S. EPA (2018) Fast Facts on Transportation Greenhouse Gas Emissions. Washington, D.C.
United Nations (2018) SDG 11 Syenthesis Report 2018: Tracking Progress Towards Inclusive,
Safe, Resilient and Sustainable Cities and Human Settlements. Nairobi, Kenya
Vahdani B, Zandieh M, Tavakkoli-Moghaddam R (2011) Two novel FMCDM methods for
alternative-fuel buses selection. Appl Math Model 35:1396–1412. doi:
10.1016/j.apm.2010.09.018
Wiedmann TO, Schandl H, Moran D (2015) The footprint of using metals: new metrics of
consumption and productivity. Environ Econ Policy Stud 17:369–388. doi: 10.1007/s10018-
014-0085-y
Winston LW, Albright SC (2008) Practical Management Science, 3rd edn. South-Western
Cengage Learning
Xu Y, Gbologah F, Cernjul G, et al (2013a) Comparison of Fuel-Cycle Emissions per Passenger
Mile from Multiple Bus and Rail Technologies. 204–216. doi:
doi:10.1061/9780784413210.019
Xu Y, Gbologah FE, Lee D-Y, et al (2015) Assessment of alternative fuel and powertrain transit
bus options using real-world operations data: Life-cycle fuel and emissions modeling. Appl
Energy 154:143–159. doi: 10.1016/j.apenergy.2015.04.112

63
Xu Y, Lee D-Y, Gbologah F, et al (2013b) Load-Based Life Cycle Greenhouse Gas Emissions
Calculator for Transit Buses: An Atlanta, GA, Case Study. In: Green Streets, Highways, and
Development 2013. American Society of Civil Engineers, Austin, TX, pp 284–294
Xylia M, Leduc S, Laurent A-B, et al (2019) Impact of bus electrification on carbon emissions:
The case of Stockholm. J Clean Prod 209:74–87. doi: 10.1016/J.JCLEPRO.2018.10.085
Yu Q, Li T, Li H (2016) Improving urban bus emission and fuel consumption modeling by
incorporating passenger load factor for real world driving. Appl Energy 161:101–111. doi:
10.1016/j.apenergy.2015.09.096
Zhou B, Wu Y, Zhou B, et al (2016) Real-world performance of battery electric buses and their
life-cycle benefits with respect to energy consumption and carbon dioxide emissions.
Energy 96:603–613. doi: 10.1016/j.energy.2015.12.041