libya post-gaddafi development
DESCRIPTION
Oil and economic development post civil warTRANSCRIPT
Seediscussions,stats,andauthorprofilesforthispublicationat:http://www.researchgate.net/publication/257099172
Oilandeconomicdevelopment:Libyainthepost-Gaddafiera
ARTICLEinECONOMICMODELLING·MAY2013
ImpactFactor:0.7·DOI:10.1016/j.econmod.2013.01.022
CITATION
1
READS
66
2AUTHORS,INCLUDING:
IssaAli
UniversityofBenghazi
4PUBLICATIONS1CITATION
SEEPROFILE
Availablefrom:IssaAli
Retrievedon:05October2015

This article appeared in a journal published by Elsevier. The attachedcopy is furnished to the author for internal non-commercial researchand education use, including for instruction at the authors institution
and sharing with colleagues.
Other uses, including reproduction and distribution, or selling orlicensing copies, or posting to personal, institutional or third party
websites are prohibited.
In most cases authors are permitted to post their version of thearticle (e.g. in Word or Tex form) to their personal website orinstitutional repository. Authors requiring further information
regarding Elsevier’s archiving and manuscript policies areencouraged to visit:
http://www.elsevier.com/authorsrights
Author's personal copy
Oil and economic development: Libya in the post-Gaddafi era
Issa Ali a,⁎, Charles Harvie b,1
a School of Economics, University of Benghazi, Benghazi, Libyab School of Economics, University of Wollongong, Wollongong, NSW 2522, Australia
a b s t r a c ta r t i c l e i n f o
Article history:Accepted 10 January 2013
JEL classification:E27E60Q33Q43Q48
Keywords:Oil related shocksLibyaDynamic macroeconomic modelSimulation analysisPolicy implications
Libya experienced traumatic political and economic upheaval during 2011 arising from an eight-month-longcivil war that cost thousands of lives, resulted in major economic dysfunction, destroyed part of the country'sinfrastructure, almost halted oil production, the country's major source of revenue generation and exports, aswell as destroyed part of the sector's support infrastructure.While the civil war resulted in the ending of 42 yearsunder Muammar Gaddafi rule, the economic legacy as represented by the costs of reconstruction efforts isenormous. While the freeing up of tens of billions of dollars of frozen assets may be the key to the country'sshort-term rehabilitation, longer-term reconstruction, growth and stability will fundamentally depend uponrehabilitating the country's oil sector. Interestingly, this rehabilitation will also have a wider global impact.This paper uses a deterministic dynamic macroeconomic model to analyse the effects upon key macroeco-nomic variables of a recovery in Libyan oil production to levels that existed prior to the revolution. Modelsimulation results indicate that additional oil revenue brings about: an increase in government revenue, in-creased government spending in the domestic economy, increased foreign asset stocks and increased outputand wages in the non-oil sector. However, increased oil revenue may also produce adverse consequences,particularly upon the non-oil trade balance, arising from a loss of competitiveness of non-oil tradablegoods induced by an appreciation of the real exchange rate and increased imports stimulated by increasedreal income. Model simulation results also suggest that investment-stimulating policy measures by the gov-ernment produce the most substantive longer-term benefits for the economy.
© 2013 Elsevier B.V. All rights reserved.
1. Introduction
The oil-rich countries, many of which can be classified as develop-ing, experienced substantially increased revenue as a result of increasedoil prices during the period of the late 1970s and early 1980s, and thenafter 2000. However, many natural resource-rich countries haveachieved lower long-run economic growth rates when compared withnon-natural resource producing and exporting economies (Auty,2001; Sachs and Warner, 1995, 2001). This puzzling issue is describedin the literature as the so-called “resource curse”2effect. This term wasfirst coined by Auty (1993) to highlight the under-performance of re-source abundant and extracting countries compared to non-resourceabundant countries. Subsequent empirical studies confirmed an inversecorrelation between economic growth and natural resource abundanceamong developing countries, but no obvious explanation for this find-ing has been found such as an important growth variable that is com-mon in resource-poor countries but which is deficient in resource-abundant countries (Mikesell, 1997). For instance, the empirical study
by Sachs andWarner (1995) found that countries with a high resourceexport to GDP ratio over the period 1971–89 experienced a poorer eco-nomic growth performance. They used a simple endogenous economicgrowthmodel to try and explain this relationship. This study stimulatedfurther literature of both a theoretical and empirical nature that alsoconfirmed the existence of under-performance in terms of economicgrowth, and which aimed to shed further explanatory light on this re-sult such as Auty (2001, 2004), Auty and Mikesell (1998), Brückner(2010), Cai (2009), Manzano and Rigobon (2001), Mikesell (1997),Neumayer (2004), Rodríguez and Sachs (1999), Ross (1999), Sachsand Warner (2001), Sala-i-Martin and Subramanian (2003), Stijns(2001a) and van der Ploeg and Poelhekke (2009).3
There is also extensive literature devoted to modelling and em-pirically analysing the effects of natural resource production uponthe growth performance of small open economies over the shortand long terms emphasising so-called Dutch disease effects.4,5Anumber of these theoretical studies emphasise that resource
Economic Modelling 32 (2013) 273–285
⁎ Corresponding author. Tel.: +218 919357021.E-mail addresses: [email protected] (I. Ali), [email protected] (C. Harvie).
1 Tel.: +61 2 4221 3702; fax: +61 2 4221 3725.2 The resource curse effect is also referred to as the Paradox of Plenty.
3 See also Stevens (2003) for an extensive review of the literature and key issues.4 A term first coined by the Economist in 1977. This is an approach to explaining the
resource curse emphasising the declining competitiveness and productivity of themanufacturing and other tradable sectors arising from an appreciation of the real ex-change rate in the wake of a resource boom.
5 See Brahmbhatt et al. (2010) for an extensive review of Dutch disease theory andempirical evidence.
0264-9993/$ – see front matter © 2013 Elsevier B.V. All rights reserved.http://dx.doi.org/10.1016/j.econmod.2013.01.022
Contents lists available at SciVerse ScienceDirect
Economic Modelling
j ourna l homepage: www.e lsev ie r .com/ locate /ecmod
Author's personal copy
production affects the economy, specifically during the short run,through a number of channels including: resource movement;spending; income; wealth and exchange rate effects (see, for exam-ple, Buiter and Miller, 1981; Buiter and Purvis, 1982; Corden andNeary, 1982; Eastwood and Venables, 1982; Neary and vanWijnbergen, 1984). This literature was extended during the 1990sto capture long-run effects including capital stock accumulation(an additional wealth effect), foreign asset stock accumulation viathe current account (a current account effect) and budgetary financ-ing implications. Furthermore, the literature has also taken into ac-count implications for adjustment arising from different exchangerate regimes (fixed or flexible) and the identification of optimal pol-icy responses in a dynamic context with the objective of minimisingthe adverse effects of a resource boom on the non-resource sector(see, for example, Cox and Harvie, 2010; Harvie, 1993; Harvie andGower, 1993; Harvie and Thaha, 1994).
The Libyan economy is no exception to that of other resourceabundant countries. Although Libya has been a considerable produc-er of crude oil since the 1960s, it displays lower economic and socialindicators when compared with other developing oil and non-oilproducing economies. The country's lack of transparency, inefficientgovernment institutions, widespread corruption andmisuse of its oilrevenue contributed to the under-performance of its economicgrowth and development. This recently resulted in traumatic politi-cal and economic upheaval arising from an eight-month long civilwar that led to the ending of 42 years of dictatorship underMuammar Gaddafi in October 2011. The cost of the war was enor-mous with up to 30,000 lives lost,6 major economic dysfunction, de-struction of the country's infrastructure, reduced oil production, thecountry's major source of revenue generation and exports, from1.6 million barrels per day before the war to 50,000 barrels aday during it as well as destroying much of the sector's supportinfrastructure.7
The economic legacy of the conflict, specifically in terms of thecost of reconstruction, is enormous. While the freeing up of tens ofbillions of dollars of frozen assets may be the key to the country'sshort-term reconstruction efforts, longer-term reconstruction, growthand stability will fundamentally depend upon rehabilitating thecountry's oil sector. Libya's oil industry and the revenue it generates,therefore, holds the key to rebuilding the country's infrastructure andimproving the longer-term economic well-being of its population. Oilaccounted for about 40 percent of the country's total economic outputand 95 percent of its export earnings before the onset of the war.Rehabilitating this sector and getting oil production back to prewarlevels have become an economic priority to the Libyan authorities,boosting government revenue and exports and intensifying the needto identify how best the authorities use the oil windfall through fiscalpolicy for the sustained growth and development of the economy(Barnett and Ossowski, 2002; Brahmbhatt et al., 2010; Davis et al.,2003; Gelb and Associates, 1988).
In this paper a dynamic general equilibriummacroeconomicmodel isdeveloped for Libya to evaluate the effects of rehabilitation of oil revenue,arising from increased oil production, upon key macroeconomic vari-ables. It takes into consideration the impact of expanded oil revenueupon the non-oil trade balance, foreign asset stock, physical capitalstock, human capital stock, imported capital stock and non-oil produc-tion. Model simulation results indicate that additional oil revenue bringsabout: an increase in government revenue, increased governmentspending in the domestic economy, increased foreign asset stocks and in-creased output and wages in the non-oil sector. However, increased oil
revenue may also produce Dutch disease consequences, particularlyupon the non-oil trade balance, arising from a loss of competitivenessof non-oil tradable goods induced by an appreciation of the real ex-change rate and increased imports stimulated by increased real income.Model simulation results also suggest that investment and productivitystimulating policy measures by the government produce the most sub-stantive longer-term benefits for the economy.
The paper proceeds as follows. Section two provides an overviewof the domestic and global importance of the Libyan energy sector.Section three discusses the theoretical framework utilised in thispaper, with emphasis placed upon a fixed exchange rate combinedwith control over capital mobility. Section four discusses the parame-ter values used for the simulation analysis. Section five presents theresults of various oil rehabilitation simulation scenarios, while sectionsix concludes and identifies policy implications.
2. The domestic and global importance of the Libyan energy sector
The energy sector outlook in Libya is of considerable contempo-rary importance not only for future domestic development, but alsofor the global economy in general and the European Union in par-ticular. The Libyan economy has been heavily dependent on the oilsector since the early 1960s. As Table 1 indicates the significance ofoil for the economy stems from: its role as a major source of gov-ernment revenue, contributing 91 percent of total government rev-enue in 2007, oil exports contributed more than 90 percent of totalexports over the period 1970–2007, and a major share of nationalincome is derived from oil production. The oil sector is alsoexpected to generate substantive future revenue, essential for thereconstruction of the economy, its infrastructure and the attain-ment of sustainable growth. How effectively these will be obtainedwill critically depend on the new government implementing soundpolicies aimed at maximising the benefits from current and futureoil revenue. Such policies need to focus upon increasing productiv-ity through increased investment in infrastructure (physical capi-tal), human capital and technology acquisition in the non-oiloutput sector (Collier et al., 2009; Davis et al., 2003; Gylfason andZoega, 2002; Hartwick, 1977; Morrison and Schwartz, 1996;Stijns, 2001b). The benefits for the non-oil sector arising fromphysical, human and imported capital stock (technology) accumu-lation induced by oil sector revenue could be substantial in termsof employment and growth generation. Critical to this, however,is the need to rapidly rehabilitate the oil sector and its productionto pre-civil war levels.8
The energy sector outlook in post Gaddafi Libya is also importantfor the global economy in general and for European countries in par-ticular, as the majority of Libyan crude oil and natural gas in the pasthas been sold to Europe. Libya was the world's fourth largest crude oilproducer when oil production reached its peak of 3.3 million barrelsper day in 1970 (see Table 2). This high level of production, however,declined remarkably during the early 1970s and into the late 1980swhen it reached its lowest level of 0.9977 million barrels per day in1985. This was mainly due to: political factors such as the process ofnationalisation and government participation in the oil industry
6 Accurate figures on the number of fatalities is not known, however estimates havevariously put the number of those killed at between 2,000–30,000 people.
7 In October 2011 the Chairman of Libya's National Oil Corporation, Nouri Berouin,told Reuters that daily oil production had risen to 430,000 barrels a day.
8 In this regard there are a number of current obstacles. First, Libya's oil industry re-lies on three main basins for its production – Sirte, Murzuk and Palagian. Sirte is by farthe most important, accounting for about 80 percent of the country's total production.However, this basin is subject to: security issues having been heavily mined during thecivil war which will take time to clear, key personnels are likely to be reluctant to re-turn to this relatively dangerous area until this is complete, pumps used to extractthe oil are old and have seized up requiring the need to re-drill, and much of the sup-port infrastructure was looted during the war. The Murzuk and Palagian basins presentfewer problems as they are newer and more secure. The pipeline between Murzuk andTripoli, however, was damaged during the war and will take time to replace. Due tothis uncertainty there have been varying estimates as to how quickly the country canreturn to pre-civil war levels of oil production.
274 I. Ali, C. Harvie / Economic Modelling 32 (2013) 273–285
Author's personal copy
which started in 1971, the United States embargo that began and in-creased gradually from the early 1980s, and sanctions imposed onLibya by the United Nations from the early 1990s due to the Lockerbiecrisis (Mahmud and Russell, 1999). Since 2003 oil production has in-creased gradually amounting to over 1.7 million barrels per day in2006. This is about 52 percent of the peak production level achievedin 1970. This increase can be mainly attributed to the lifting of theUN sanctions and the USA embargo in 2003 and 2004, respectively.These developments allowed major oil companies to return to Libyaand raise their exploration efforts for oil and natural gas in the coun-try (Energy Information Administration, 2007). By 2015, Libya aimsto raise its production of oil gradually to reach 3 million barrels perday (European Commission DG trade, 2009).
Even though Libya's production of oil is surpassed by a numberof other oil-producing countries, such as Saudi Arabia and Iran, itcan still exert an important influence on the world price of oil. AsTable 2 indicates, Libyan oil production averaged approximately5–14 percent of total OPEC oil production over the period 1965–2010.9 This contribution is expected to increase as Libya has thepotential, with adequate rehabilitation measures, to raise oil andnatural gas production significantly in the coming years. Thus, theenergy sector in post-Gaddafi Libya can be expected to influencethe world oil price and, therefore, the European and global econo-mies. This is due to a number of advantages that the Libyan oiland energy sector have. First, according to OPEC (OPEC, 2010/2011) Libya has huge proven crude oil and natural gas reserves of47.1 billion barrels and 1.5 billion cubic metres, respectively, in2010 (see Table 3). Second, Libyan oil is of a high quality with pro-duction costs among the lowest in the world.10 Third, proximity ofLibya to Europe provides a further advantage in terms of low trans-portation cost. Nowadays the majority of Libyan crude oil and nat-ural gas are exported to European countries, including Italy, France,Germany, and Spain. Accordingly, given the aforementioned ad-vantages, the recent political change in Libya, the willingness of Eu-ropean countries to diversify their crude oil and gas suppliers and,also, declining oil production from the North Sea (Bahgat, 2006),ensure that this unique relationship will remain strong and enableLibyan oil and gas to be shipped to the rest of the world throughEurope. The return of Libyan oil to the international oil market islikely to put downward pressure on oil prices and ease global infla-tionary pressure.
3. Theoretical framework: the model
The oil-related macroeconomic model developed for the Libyaneconomy in this paper has its foundations in the contributions ofBuiter and Miller (1981), Eastwood and Venables (1982), Buiter andPurvis (1982), Neary and Van Wijnbergen (1984), Harvie andGower (1993), Harvie and Thaha (1994) and, more recently and
importantly, Cox and Harvie (C–H henceforth) (2010), for the case ofa flexible exchange rate and an advanced resource-abundant economy.The latter contribution is a general equilibrium model focusing on thedynamic long-run nature of the adjustment process. These models rep-resent extensions to the basic Dornbusch model (1976), incorporatingfeatures particularly arising from the existence of an oil sector and itsrelated economic effects. In these models a deterministic frameworkis adopted in which economic agents are assumed to possess rationalor forward-looking expectations. This is equivalent to the case of perfectforesight. Non-financialmarkets are subject to sticky prices and in somemodels, such as Harvie and Gower (1993), Harvie and Thaha (1994)and Cox andHarvie (2010), sticky quantity adjustment, resulting in dis-equilibrium throughout the adjustment process. On the other hand, fi-nancial markets are assumed to be in continual equilibrium. Thus, theeffects arising from oil-related shocks are initially transmitted primarilythrough the financial market and then to the product and labourmarkets.
However, for these models, specifically the C–H model, to be moreapplicable for an oil producing developing economy such as that ofLibya, a number of amendments have to be made. These are as follows.First, the majority of oil production and its revenue is produced andgenerated by government-owned entities; hence oil production andrevenue is under government control. Therefore, the way in which thegovernment spends the oil revenue will have a significant impactupon the future development of the economy. Second, the governmentallocates the oil revenue between two types of expenditure – (1) con-sumption expenditure which stimulates the demand for domesticnon-oil output, (2) development (or investment) expenditure, whichis divided into three parts; government development spending onphysical capital, government development spending on human capitaland that devoted to imported capital (technology). The first type of gov-ernment expenditure induces non-oil output demand,while the secondinduces non-oil output demand and supply.
Third, it is assumed that the oil sector, during its production andboom periods, generates a long-run sustainable impact on non-oil
9 In 2011 its contribution to global production fell to 2 percent due to the civil war.10 Only a handful of countries, such as Azerbajian and Nigeria, produce such highquality oil which is in high global demand for usage in transportation, energy produc-tion and high value adding products.
Table 3Proven crude oil (in billion barrels) and natural gas reserves (billion standard cu. m.) inLibya, 1990–2010.Source: OPEC, Annual Statistical Bulletin, Yearbooks 2008 & 2010/2011.
Year Libyan crude oil reserves Libyan natural gas reserves
1990 22.800 1.2081995 29.500 1.3132000 36.000 1.3142005 41.464 1.4912010 47.097 1.495
Table 2Average oil production, selected countries, 1961–2007 (million barrels per day) andLibyan share of daily production (%).Source: OPEC, Annual Statistical Bulletin, Yearbooks 2008 & 2010/2011.
Year Libya OPEC Venezuela Algeria SaudiArabia
Kuwait Iran Libya/OPEC(%)
1965 1.2188 14.3254 3.4729 0.5587 2.2053 2.3603 1.9083 8.511970 3.3180 23.3881 3.7080 1.0291 3.7991 2.9896 3.8290 14.191975 1.4798 27.0946 2.3462 0.9826 7.0754 2.0842 5.3501 5.461980 1.8316 26.8556 2.1650 1.0199 9.9005 1.6637 1.4674 6.821985 0.9977 15.4332 1.5640 0.6724 3.1750 0.9363 2.1923 6.461990 1.3891 22.7809 2.1352 0.7835 6.4125 0.8586 3.1353 6.101995 1.3990 25.5884 2.3785 0.7525 8.0234 2.0066 3.5950 5.472000 1.3472 28.8733 2.8910 0.7960 8.0945 1.9961 3.6613 4.672006 1.7512 32.4486 3.0356 1.3688 9.2079 2.6645 4.0726 5.402010 1.4866 29.1830 2.8536 1.1898 8.1656 2.3121 3.5440 5.10
Table 1The significance of oil in the Libyan economy⁎.Source: The Central Bank of Libya, Economic Bulletin, various issues.
1970 1975 1980 1985 1990 1995 2000 2007
Oil revenues to totalrevenues (%)
84.6 74.2 88.7 65.9 58.0 73.9 57.3 91.1
Oil exports to totalexports (%)
90.8 95.1 99.2 97.8 96.8 92.1 95.6 93.9
Oil GDP to total GDP (%) 74.4 57.3 46.9 39.3 35.1 34.2 33.8 39.8
⁎ The Table is calculated at 1997 constant prices.
275I. Ali, C. Harvie / Economic Modelling 32 (2013) 273–285
Author's personal copy
output. The oil boom generates both physical capital stock accumula-tion in the non-oil sector and human capital stock accumulation in-duced by government capital expenditure (spending effect), foreignasset stock accumulation via developments in the current account(current account effect), acquisition of technology through capitalimports (technology effect), and budgetary implications via tax reve-nues generated from oil production (revenue effect). These contrib-ute to permanently boosting the productivity capacity of non-oiloutput in the post-oil boom period in particular.
Fourth, the model assumes that the nominal exchange rate isfixed, since it has remained noticeably unchanged over most of therecent past in Libya, and international capital mobility remains highlycontrolled by the government.
Fifth, in the C–Hmodel there is assumed to be four financial assetsavailable in the economy. These are domestic money, domestic bonds,foreign bonds and equities. Equities represent claims to ownership ofthe physical capital stock used in the non-oil sector. In the case ofLibya there is assumed to be only one financial asset available in theeconomy, which is a money asset. This assumption is due to the im-maturity of financial assets in the economy, and lack of data availablefor other financial assets.
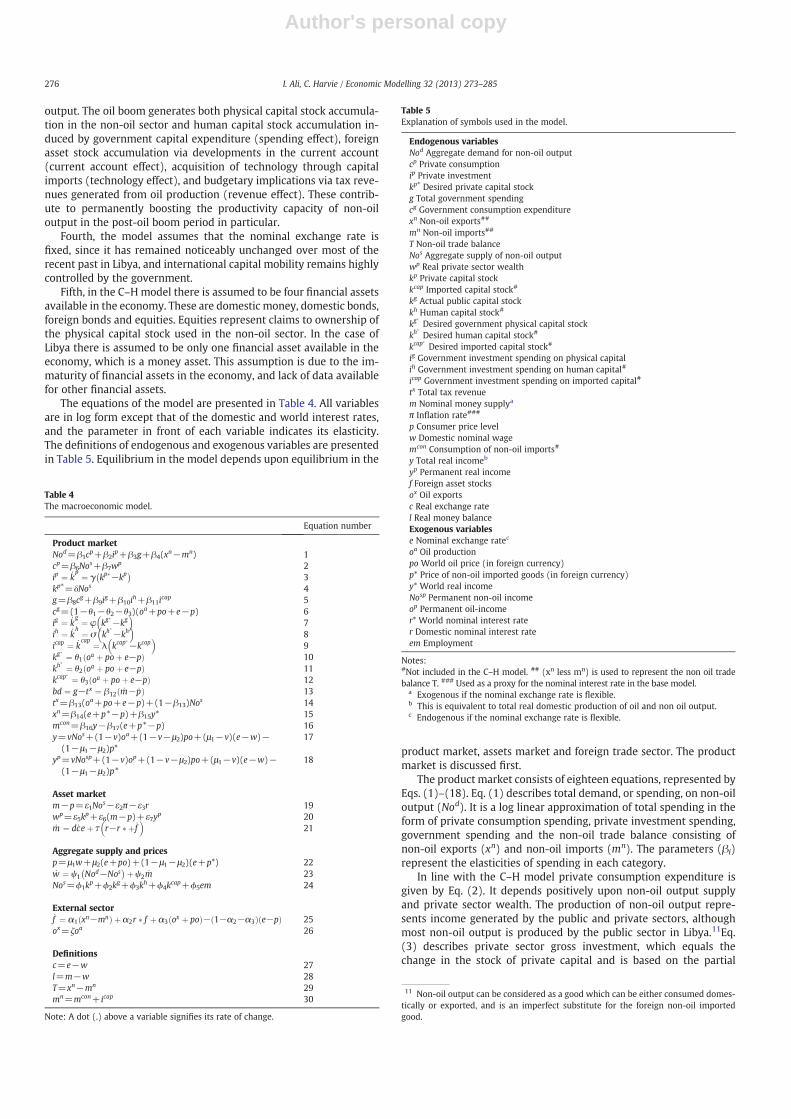
The equations of the model are presented in Table 4. All variablesare in log form except that of the domestic and world interest rates,and the parameter in front of each variable indicates its elasticity.The definitions of endogenous and exogenous variables are presentedin Table 5. Equilibrium in the model depends upon equilibrium in the
product market, assets market and foreign trade sector. The productmarket is discussed first.
The product market consists of eighteen equations, represented byEqs. (1)–(18). Eq. (1) describes total demand, or spending, on non-oiloutput (Nod). It is a log linear approximation of total spending in theform of private consumption spending, private investment spending,government spending and the non-oil trade balance consisting ofnon-oil exports (xn) and non-oil imports (mn). The parameters (βi)represent the elasticities of spending in each category.
In line with the C–H model private consumption expenditure isgiven by Eq. (2). It depends positively upon non-oil output supplyand private sector wealth. The production of non-oil output repre-sents income generated by the public and private sectors, althoughmost non-oil output is produced by the public sector in Libya.11Eq.(3) describes private sector gross investment, which equals thechange in the stock of private capital and is based on the partial
Table 4The macroeconomic model.
Equation number
Product marketNod=β1c
p+β2ip+β3g+β4(xn−mn) 1
cp=β6Nos+β7w
p 2ip ¼ _k
p ¼ γ kp�−kp� �
3kp⁎=δNos 4g=β8c
g+β9ig+β10i
h+β11icap 5
cg=(1−θ1−θ2−θ3)(oa+po+e−p) 6ig ¼ _k
g ¼ φ kg�−kg
� �7
ih ¼ _kh ¼ σ kh
�−kh
� �8
icap ¼ _kcap ¼ λ kcap
�−kcap
� �9
kg� ¼ θ1 oa þ poþ e−pð Þ 10
kh� ¼ θ2 oa þ poþ e−pð Þ 11
kcap� ¼ θ3 oa þ poþ e−pð Þ 12
bd ¼ g−tx ¼ β12 _m− _pð Þ 13tx=β13(oa+po+e−p)+(1−β13)Nos 14xn=β14(e+p*−p)+β15y* 15mcon=β16y−β17(e+p*−p) 16y=vNos+(1−v)oa+(1−v−μ2)po+(μ1−v)(e−w)−
(1−μ1−μ2)p*17
yp=vNosp+(1−v)op+(1−v−μ2)po+(μ1−v)(e−w)−(1−μ1−μ2)p*
18
Asset marketm−p=ε1Nos−ε2π−ε3r 19wp=ε5kp+ε6(m−p)+ε7yp 20_m ¼ d _ceþ τ r−r � þ _f
� �21
Aggregate supply and pricesp=μ1w+μ2(e+po)+(1−μ1−μ2)(e+p*) 22_w ¼ ψ1 Nod−Nos
� �þ ψ2 _m 23Nos=ϕ1k
p+ϕ2kg+ϕ3k
h+ϕ4kcap+ϕ5em 24
External sector_f ¼ α1 xn−mnð Þ þ α2r � f þ α3 ox þ poð Þ− 1−α2−α3ð Þ e−pð Þ 25ox=ζoa 26
Definitionsc=e−w 27l=m−w 28T=xn−mn 29mn=mcon+ icap 30
Note: A dot (.) above a variable signifies its rate of change.
Table 5Explanation of symbols used in the model.
Endogenous variablesNod Aggregate demand for non-oil outputcp Private consumptionip Private investmentkp⁎ Desired private capital stockg Total government spendingcg Government consumption expenditurexn Non-oil exports##
mn Non-oil imports##
T Non-oil trade balanceNos Aggregate supply of non-oil outputwp Real private sector wealthkp Private capital stockkcap Imported capital stock#
kg Actual public capital stockkh Human capital stock#
kg�Desired government physical capital stock
kh�Desired human capital stock#
kcap�Desired imported capital stock#
ig Government investment spending on physical capitalih Government investment spending on human capital#
icap Government investment spending on imported capital#
tx Total tax revenuem Nominal money supplya
π Inflation rate###
p Consumer price levelw Domestic nominal wagemcon Consumption of non-oil imports#
y Total real incomeb
yp Permanent real incomef Foreign asset stocksox Oil exportsc Real exchange ratel Real money balanceExogenous variablese Nominal exchange ratec
oa Oil productionpo World oil price (in foreign currency)p* Price of non-oil imported goods (in foreign currency)y* World real incomeNosp Permanent non-oil incomeop Permanent oil-incomer* World nominal interest rater Domestic nominal interest rateem Employment
Notes:#Not included in the C–H model. ## (xn less mn) is used to represent the non oil tradebalance T. ### Used as a proxy for the nominal interest rate in the base model.
a Exogenous if the nominal exchange rate is flexible.b This is equivalent to total real domestic production of oil and non oil output.c Endogenous if the nominal exchange rate is flexible.
11 Non-oil output can be considered as a good which can be either consumed domes-tically or exported, and is an imperfect substitute for the foreign non-oil importedgood.
276 I. Ali, C. Harvie / Economic Modelling 32 (2013) 273–285
Author's personal copy
adjustment hypothesis. This partial adjustment arises from costs ofadjusting the actual physical capital stock (kp) to the desired capitalstock (kp⁎). The increase in capital from the end of the previous periodto the end of the current period is some fraction γ of the divergencebetween the desired and actual stock of capital. The desired capitalstock is assumed to depend upon non-oil output12(see Eq. (4)).
Total government spending (g) is identified by Eq. (5). It dependspositively on two components of expenditure; government consump-tion spending (cg), which is assumed to be dependent upon oil revenueas shown in Eq. (6), and government development expenditure. Govern-ment development spending is divided into three parts; governmentdevelopment spending on physical capital (for example, infrastructure)(ih), government development spending on human capital (for example,education and health care) (ih) and that devoted to imported capital (forexample, imported foreign technology) (icap). The Libyan governmentplays an important role in providing infrastructure and free educationand health care necessary to build human capital13(World Bank, 2006),as well as acquiring imported technology.
Eqs. (7), (8), and (9) describe government investment spending onthe physical, human and imported capital stocks, respectively, whicharises from a gradual adjustment of the actual public capital stock totheir policy determined levels. The policy determined levels are deter-mined by oil revenue, as given by Eqs. (10), (11) and (12). This is anothermajor difference between this model and that of the C–H model.
Eq. (13) identifies the budgetary stance, which is government ex-penditure (g) less tax revenues (t). The budget deficit can be financedin three ways; through money accommodation (sales of governmentbills and securities to the Central Bank of Libya (CBL)), by borrowingdomestically from the private sector, or by borrowing from abroad. InLibya the government issues bonds to the central bank only, and doesnot issue bonds to the public. The public are not able to buy treasurybills and bonds due to the lack of financial institutions in the economy.Also, the Libyan government has not, as yet, borrowed from abroad.Therefore, Eq. (13) shows that any excess of real total expenditure (g)over real total tax revenue (tx) must be financed by borrowing domes-tically from the CBL. Tax revenues are generated from two sources, oilproduction and non-oil production (Eq. (14)).
The non-oil trade balance is disaggregated further into non-oil ex-ports less non-oil imports as shown in Eq. (15) and identity Eq. (30).Eq. (15) specifies non-oil exports (xn), which depend positively uponthe real exchange rate (e+p* — p) and world real income (y⁎). Non-oilimports are also disaggregated into non-oil consumption imports(mcon) and non-oil capital imports (icap). Eq. (16) identifies non-oil con-sumption imports, which depend negatively upon the real exchange rateand positively on domestic real income (y). Eq. (9) identifies non-oil cap-ital imports which are assumed to be endogenously determined, arisingfrom a gradual adjustment of actual imported capital spending to its pol-icy determined level. Libyan non-oil capital imports, which comprisecapital goods and raw material goods, increased rapidly during the oilboom periods of the late 1970s and early 1980s, and again after 2000.This is attributed to the highly ambitious development programmeconducted by government during the oil boom periods. Thus, a largeshare of oil revenue has been used directly for the purchase of imports,
in particular capital imports, containing advanced technology. This isanother departure from the C–H model and is considered one of themain contributions of this model.
Real and permanent income (yp) definitions, first used by Buiter andPurvis (1982), are given by Eqs. (17) and (18) as in the C–Hmodel. Realincome, as identified in Eq. (17), depends upon non-oil output (Nos), oilproduction oa that is assumed to be exogenous, the world price of oil(po), that is also exogenous, the real exchange rate as emphasisedhere and the exogenously determined price of non-oil imported goods(p⁎). However, in the C–Hmodel such income goes to the private sector,whereas in thismodel only non-oil income, generated fromnon-oil out-put, accrues directly to the private sector, and oil income generated fromoil production goes directly to government. This is another major depar-ture from the C–Hmodel. Real oil output directly affects government in-come and, in turn, spending, as in Eqs. (5), (6), (7), (8) and (9). Itwill alsoaffect non-oil output supply as in Eq. (24) through imported capital,human and physical capital accumulation, and the allocation of oilproduction as in Eq. (26). Non-oil output will directly influence privatesector consumption and the money market, as in Eqs. (2) and (19).
Eq. (18) is the same as in the C–Hmodel. It represents permanent in-come,which is a function of exogenous permanent non-oil output (Nosp),exogenous permanent oil output (op), the world price of oil, the real ex-change rate and price of non-oil imported goods (see also Harvie, 1994).It is assumed that v, which is the share of non-oil production in total valueadded, does not change as a result of oil production, is treated as being thesame in real and permanent income, and is constant through time. If theshare of oil production in domestic real income (1 – v) is larger than itsshare in domestic consumption (μ2), then the economy will be an oilexporter during its period of production. An assumption maintainedthroughout the remainder of this paper.
Asset market equilibrium is given by Eqs. (19)–(21).14Unlike theC–H model, there is only one financial asset (money) in this model.Libyan financial markets are immature and still in the process ofbeing liberalized and capital flows are restricted due to the constantnominal interest rate. Thus, there is a limited range of alternative fi-nancial assets. Furthermore, the interest rate does not reflect the in-crease in price levels. As a consequence the interest rate does notreflect the true opportunity cost of holding money in Libya. In addi-tion, since the interest rate is subject to regulation by policymakers,it is no longer a good proxy for the cost of holding money but, rather,tends to show the restrictiveness of monetary policy. Therefore, therate of inflation is utilised, besides the interest rate, as a proxy vari-able for the opportunity cost of holding money in this model.15Forthis reason the specification of money market equilibrium, as givenby Eq. (19), incorporates real non-oil income, the interest rate andthe rate of inflation.16The nominal money supply is assumed to be en-dogenous as the nominal exchange rate is fixed. The demand for realmoney balances (the nominal money stock m deflated by the con-sumer price level pc) depends positively upon real non-oil income
12 In the C–H model the change in the stock of private capital is determined byTobin's q ratio, which is the ratio of the marginal market valuation of capital relativeto the replacement cost of the capital.13 In this context, Libya has achieved essential improvements in terms of primary,secondary, and tertiary school enrolments. For example, secondary school enrolmentsubstantially increased from 21 percent in 1970 to 95 percent in 2002. Also, tertiaryenrolment recorded a significant increase from 3 percent to 53per cent in the same pe-riod. However, there are concerns about the quality of the content and actual access toup-to-date knowledge and expertise. These concerns are attributed mainly to Libya'sisolation for more than a decade due to the embargo and the sanctions imposed uponthe country by the US and UN, and the ban on foreign languages from the curricula. Re-garding the health sector, life expectancy has increased from 52 years in 1970 to72 years in 2002 as a result of improvements in health care services (for more detail,see World Bank, 2006, p.7 & 8).
14 Tobin's q and the real return on private capital services are omitted from this mod-el due to the lack of data and adequate information. This is also due to the lack of de-velopment of private financial markets.15 In this respect, many researchers have used alternative variables to that of the in-terest rate in the demand for money equation in developing countries. For instance,Usui (1996) used the rate of inflation as a proxy for the opportunity cost of holdingmoney beside the interest rate in the demand for money for the Indonesian economy.He found that the inflation rate is significant and negatively related to money demand,reflecting the opportunity cost of holding money, while the interest rate is not signifi-cantly related to money demand.16 As indicated in Table 7, the inflation rate coefficient (0.36) is negative and also sig-nificant at the 1 percent level, supporting the theoretical specification identified in thispaper. This means that a 1 percent increase in the inflation rate will bring about a de-crease in real money demand by 0.36 percent. However, the long-run coefficient of thedomestic interest rate is not significant; indicating that the interest rate does not re-flect the increase in price levels. As a consequence, the interest rate does not reflectthe true opportunity cost of holding money in Libya and does not have an importanteffect on real money demand.
277I. Ali, C. Harvie / Economic Modelling 32 (2013) 273–285

Author's personal copy
(Nos), representing a transactions demand, and negatively upon theinterest rate and the inflation rate. It is assumed that the money mar-ket always clears so this equation always holds.
Domestic private sector real wealth (wp) is given by Eq. (20) as inthe C–H model, except that real bond holdings by the private sectorare excluded from Eq. (20). This is due to the fact that the Libyan gov-ernment does not issue bonds to the public. Domestic private sectorreal wealth consists of three components. The first major componentis the private capital stock which is assumed to be owned entirely bythe private sector and is produced from private investment. The sec-ond major component is real money balances, which consists of thecash, deposits and savings of the private sector. The final componentis permanent non-oil income which is equivalent to that of perma-nent non-oil output.17
Eq. (21) shows the money growth equation. It indicates the as-sumption of a fixed exchange rate combined with imperfect capitalmobility.18Since a fixed exchange rate is assumed for the case ofLibya the money supply and its growth is endogenously determined.It depends upon exogenously determined changes in domestic creditexpansion (dċe) and the accumulation of foreign exchange reservesthrough balance of payments surpluses/deficits (fės) (see Harvie,1993, and Harvie and Thaha, 1994), as shown in Eq. (21⁎).
_m ¼ d _ceþ f _es ð21⁎Þ
dċe is exogenously determined by the government and is assumedfor simplicity to be equal to zero. Changes in foreign exchange re-serves arise from developments in the current account _f
� �and
from capital flows due to differences in the domestic and foreignnominal interest rate (r – r⁎), as shown in Eq. (21**), where τ indi-cates the interest rate sensitivity of international capital flows.19
f _es ¼ τ r−r�ð Þ þ _f 21⁎⁎
By substituting Eqs. (21**) into Eq. (21⁎), Eq. (21) is obtained.Eqs. (22)–(24) define the price level and aggregate non-oil output
supply. Price and inflationary expectations developments are givenby Eqs. (22), (23), and (24). Eq. (22) defines the consumer pricelevel, which is a weighted average of nominal wages, the domesticcost of oil and the domestic cost of the world non-oil imported goodas represented by the imported goods price index in foreign currencymultiplied by the exchange rate.
Adjustment of nominal wages is generated by an expectationsaugmented Phillips curve, as given by Eq. (23). Two possible adjust-ment sources are considered. These are excess demand for non-oilgoods relative to its available supply (Nod – Nos) and core inflation(π). Core inflation depends upon developments in the monetarygrowth rate (Eq. (21)).
Aggregate non-oil output supply is endogenously determined,as given by Eq. (24). It depends positively on the public capitalstock,20human capital stock, private capital stock, imported capitalstock and employment. Government investment is divided intothree parts; investment that affects non-oil output through
physical capital stock accumulation, investment that affectsnon-oil output through human capital formation and investmentin imported capital (technology).
Inclusion of the public capital stock is attributed to the assumptionthat it is complementary to that of the private capital stock in nature.For example, Aschauer (1989a, 1989b) argues that public capitalspending, especially on infrastructure, operates as a complement toprivate sector inputs, and “crowds in” private capital accumulationand enhances its efficiency. In addition, Morrison and Schwartz(1996) examine the relationship between public capital and costs ofprivate production. Their results indicate the importance of public in-frastructure investment to the private sector's productivity. They findthat public infrastructure investment reduces the cost of private pro-duction, and can lead to increased productivity. Hence it has a poten-tially positive and significant effect on non-oil aggregate supply.Furthermore, like other typical oil-exporting countries in the MiddleEast and North Africa, Libya is dependent on imports of industrial in-puts in the form of physical capital and technology from developedcountries. Importation of capital goods and raw materials, which con-tribute more than 65% of total imports (Annual report, CBL, 2005), arecrucial for the production of non-oil output, hence they play an im-portant role in the economic development process. Thus, unlike theC–H model and other long-run models, the stock of capital imports(kcap) is vital for the supply of goods and services and is also includedin Eq. (24).
The external sector consists of the current account and oil trade bal-ance. Developments in the current account are given by Eq. (25a) (seefor example Harvie and Gower (1993) and Harvie (1994)).
_f þ e−p ¼ α1T þ α2 r�f þ e−pð Þ þ α3 ox þ poþ e−p� �
25a
where (ox) represents net exports of oil. Rearranging Eq. (25a) and ex-pressing this in terms of changes in foreign exchange reserves, Eq. (25)is obtained. This shows that changes in foreign exchange reserves, as
reflected in the current account balance _f� �
, depends positively upon
the non-oil trade balance (as given by Eq. (29)), foreign interest income(r⁎ f), net oil exports and on the real exchange rate (e – p). In long-runsteady state the current account balance must be zero, otherwise fur-ther wealth effects will arise requiring further macroeconomic adjust-ment. Eq. (25) is as in the C–H model.
Eq. (26) indicates that net oil exports are exogenously deter-mined, being dependent upon government policy towards the do-mestic usage or export of oil production.
Finally, Eqs. (27)–(30) define four variables which are used exten-sively throughout this study. Eq. (27) defines the real exchange rateas used in this study, Eq. (28) defines real money balances, Eq. (29)defines the non-oil trade balance and Eq. (30) defines non-oilimports.
4. Parameter values used for the simulation analysis
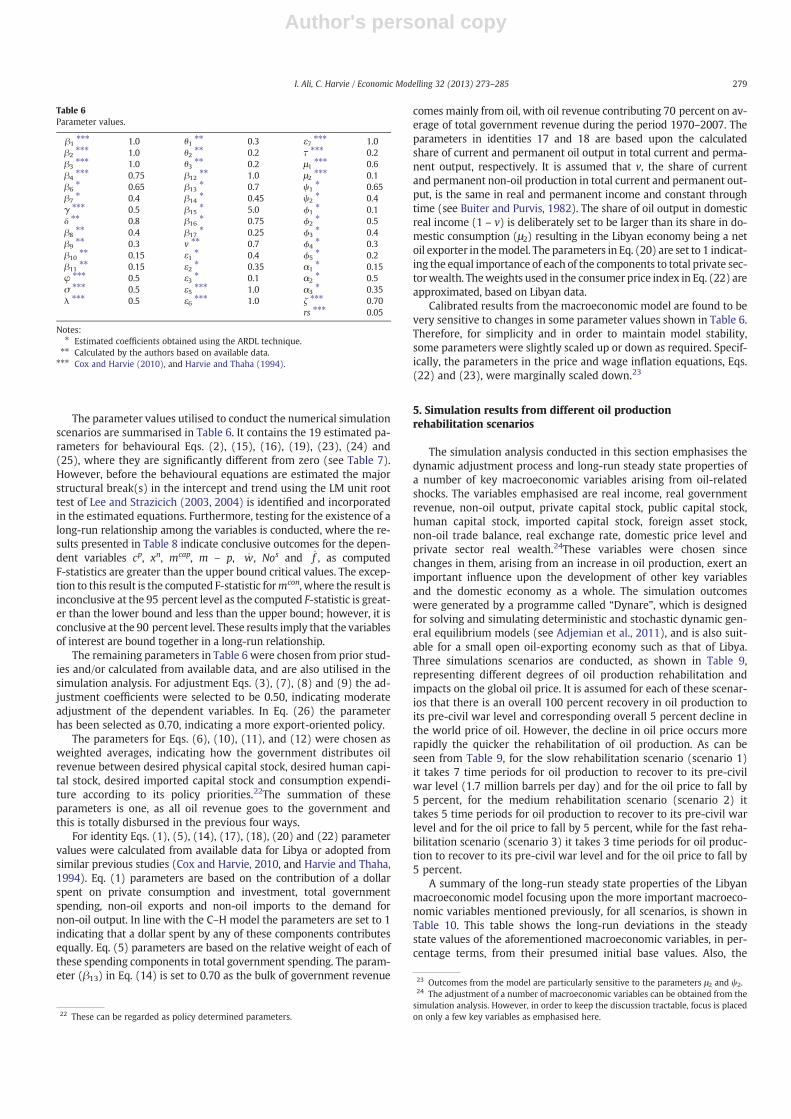
The equations of the model are grouped into three categories, be-havioural, adjustment and identity, respectively. The parameter valuesutilised are those obtained from: 1) estimation of the behavioural equa-tions of the model using the ARDL cointegration technique.21FollowingPesaran and Pesaran (2009) and Pesaran et al. (2001) andwithout hav-ing any prior knowledge about the direction of the relationship amongthe variables, the behavioural equations are expressed in the form of anunrestricted error correction model (UECM), 2) those calculated fromavailable Libyan data, 3) those set as adjustment coefficients, 4) thoseobtained from other studies, and 5) those imposed due to data limita-tion or in order to ensure model stability.
17 This is a proxy for the present value of the future income stream of the privatesector.18 This assumption means that there is a discrepancy between the return on domesticfinancial assets and foreign financial assets, which can continue for a prolonged periodof time. A fixed nominal exchange rate, which is unable to adjust in order to achievethe equalization between expected returns on domestic financial assets and foreign fi-nancial assets, and differences in the returns on domestic and foreign financial assetsresults in persistent capital flows with money supply implications.19 The value of parameter τ can range from zero to infinity. If τ is equal to zero thenthere is completely imperfect international capital mobility, whereas if τ is equal to in-finity there is perfect international capital mobility.20 The reason for including government development expenditure is to capture theeffects of government-led development strategies, in particular during the oil boomperiods. 21 As contained in Table 7.
278 I. Ali, C. Harvie / Economic Modelling 32 (2013) 273–285
Author's personal copy
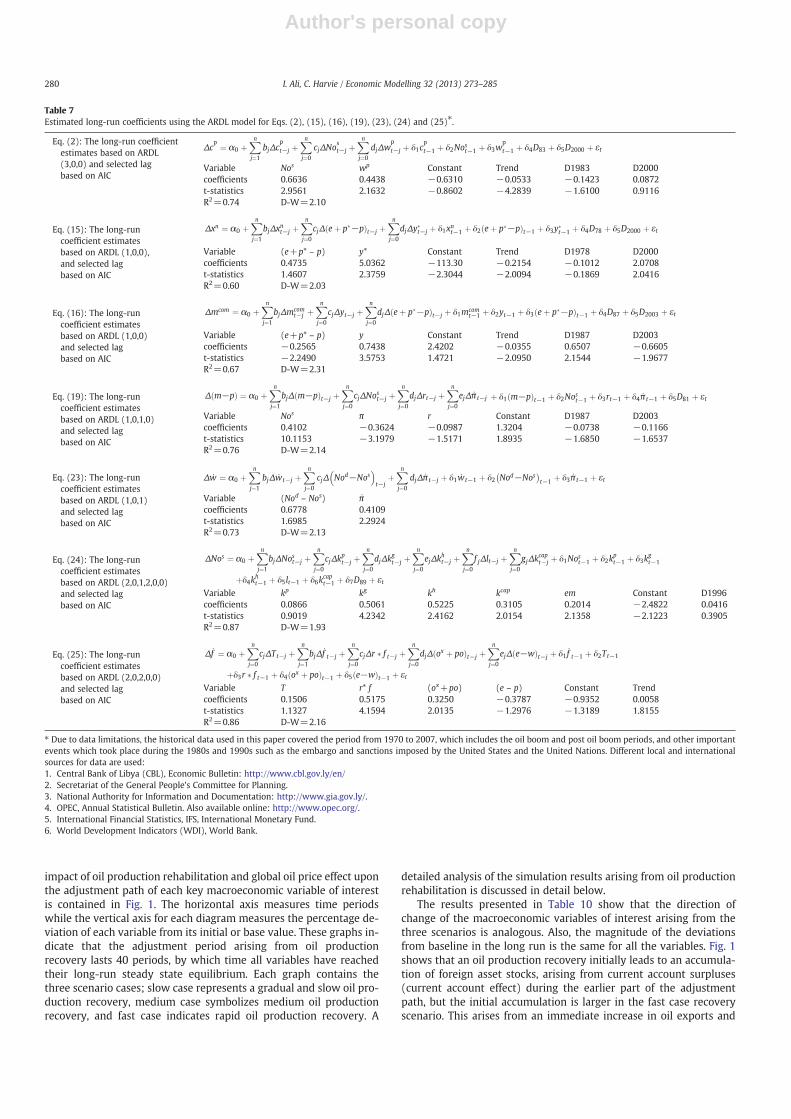
The parameter values utilised to conduct the numerical simulationscenarios are summarised in Table 6. It contains the 19 estimated pa-rameters for behavioural Eqs. (2), (15), (16), (19), (23), (24) and(25), where they are significantly different from zero (see Table 7).However, before the behavioural equations are estimated the majorstructural break(s) in the intercept and trend using the LM unit roottest of Lee and Strazicich (2003, 2004) is identified and incorporatedin the estimated equations. Furthermore, testing for the existence of along-run relationship among the variables is conducted, where the re-sults presented in Table 8 indicate conclusive outcomes for the depen-dent variables cp, xn, mcap, m – p, _w, Nos and _f , as computedF-statistics are greater than the upper bound critical values. The excep-tion to this result is the computed F-statistic formcon, where the result isinconclusive at the 95 percent level as the computed F-statistic is great-er than the lower bound and less than the upper bound; however, it isconclusive at the 90 percent level. These results imply that the variablesof interest are bound together in a long-run relationship.
The remaining parameters in Table 6 were chosen from prior stud-ies and/or calculated from available data, and are also utilised in thesimulation analysis. For adjustment Eqs. (3), (7), (8) and (9) the ad-justment coefficients were selected to be 0.50, indicating moderateadjustment of the dependent variables. In Eq. (26) the parameterhas been selected as 0.70, indicating a more export-oriented policy.
The parameters for Eqs. (6), (10), (11), and (12) were chosen asweighted averages, indicating how the government distributes oilrevenue between desired physical capital stock, desired human capi-tal stock, desired imported capital stock and consumption expendi-ture according to its policy priorities.22The summation of theseparameters is one, as all oil revenue goes to the government andthis is totally disbursed in the previous four ways.
For identity Eqs. (1), (5), (14), (17), (18), (20) and (22) parametervalues were calculated from available data for Libya or adopted fromsimilar previous studies (Cox and Harvie, 2010, and Harvie and Thaha,1994). Eq. (1) parameters are based on the contribution of a dollarspent on private consumption and investment, total governmentspending, non-oil exports and non-oil imports to the demand fornon-oil output. In line with the C–H model the parameters are set to 1indicating that a dollar spent by any of these components contributesequally. Eq. (5) parameters are based on the relative weight of each ofthese spending components in total government spending. The param-eter (β13) in Eq. (14) is set to 0.70 as the bulk of government revenue
comes mainly from oil, with oil revenue contributing 70 percent on av-erage of total government revenue during the period 1970–2007. Theparameters in identities 17 and 18 are based upon the calculatedshare of current and permanent oil output in total current and perma-nent output, respectively. It is assumed that v, the share of currentand permanent non-oil production in total current and permanent out-put, is the same in real and permanent income and constant throughtime (see Buiter and Purvis, 1982). The share of oil output in domesticreal income (1 – v) is deliberately set to be larger than its share in do-mestic consumption (μ2) resulting in the Libyan economy being a netoil exporter in themodel. The parameters in Eq. (20) are set to 1 indicat-ing the equal importance of each of the components to total private sec-torwealth. Theweights used in the consumer price index in Eq. (22) areapproximated, based on Libyan data.
Calibrated results from the macroeconomic model are found to bevery sensitive to changes in some parameter values shown in Table 6.Therefore, for simplicity and in order to maintain model stability,some parameters were slightly scaled up or down as required. Specif-ically, the parameters in the price and wage inflation equations, Eqs.(22) and (23), were marginally scaled down.23
5. Simulation results from different oil productionrehabilitation scenarios
The simulation analysis conducted in this section emphasises thedynamic adjustment process and long-run steady state properties ofa number of key macroeconomic variables arising from oil-relatedshocks. The variables emphasised are real income, real governmentrevenue, non-oil output, private capital stock, public capital stock,human capital stock, imported capital stock, foreign asset stock,non-oil trade balance, real exchange rate, domestic price level andprivate sector real wealth.24These variables were chosen sincechanges in them, arising from an increase in oil production, exert animportant influence upon the development of other key variablesand the domestic economy as a whole. The simulation outcomeswere generated by a programme called “Dynare”, which is designedfor solving and simulating deterministic and stochastic dynamic gen-eral equilibrium models (see Adjemian et al., 2011), and is also suit-able for a small open oil-exporting economy such as that of Libya.Three simulations scenarios are conducted, as shown in Table 9,representing different degrees of oil production rehabilitation andimpacts on the global oil price. It is assumed for each of these scenar-ios that there is an overall 100 percent recovery in oil production toits pre-civil war level and corresponding overall 5 percent decline inthe world price of oil. However, the decline in oil price occurs morerapidly the quicker the rehabilitation of oil production. As can beseen from Table 9, for the slow rehabilitation scenario (scenario 1)it takes 7 time periods for oil production to recover to its pre-civilwar level (1.7 million barrels per day) and for the oil price to fall by5 percent, for the medium rehabilitation scenario (scenario 2) ittakes 5 time periods for oil production to recover to its pre-civil warlevel and for the oil price to fall by 5 percent, while for the fast reha-bilitation scenario (scenario 3) it takes 3 time periods for oil produc-tion to recover to its pre-civil war level and for the oil price to fall by5 percent.
A summary of the long-run steady state properties of the Libyanmacroeconomic model focusing upon the more important macroeco-nomic variables mentioned previously, for all scenarios, is shown inTable 10. This table shows the long-run deviations in the steadystate values of the aforementioned macroeconomic variables, in per-centage terms, from their presumed initial base values. Also, the
Table 6Parameter values.
β1⁎⁎⁎ 1.0 θ1 ⁎⁎ 0.3 ε7 ⁎⁎⁎ 1.0
β2⁎⁎⁎ 1.0 θ2 ⁎⁎ 0.2 τ ⁎⁎⁎ 0.2
β3⁎⁎⁎ 1.0 θ3 ⁎⁎ 0.2 μ1 ⁎⁎⁎ 0.6
β4⁎⁎⁎ 0.75 β12
⁎⁎ 1.0 μ2 ⁎⁎⁎ 0.1β6
⁎ 0.65 β13⁎ 0.7 ψ1
⁎ 0.65β7
⁎ 0.4 β14⁎ 0.45 ψ2
⁎ 0.4γ ⁎⁎⁎ 0.5 β15
⁎ 5.0 ϕ1⁎ 0.1
δ ⁎⁎ 0.8 β16⁎ 0.75 ϕ2
⁎ 0.5β8
⁎⁎ 0.4 β17⁎ 0.25 ϕ3
⁎ 0.4β9
⁎⁎ 0.3 v ⁎⁎ 0.7 ϕ4⁎ 0.3
β10⁎⁎ 0.15 ε1 ⁎ 0.4 ϕ5
⁎ 0.2β11
⁎⁎ 0.15 ε2 ⁎ 0.35 α1⁎ 0.15
φ ⁎⁎⁎ 0.5 ε3 ⁎ 0.1 α2⁎ 0.5
σ ⁎⁎⁎ 0.5 ε5 ⁎⁎⁎ 1.0 α3⁎ 0.35
λ ⁎⁎⁎ 0.5 ε6 ⁎⁎⁎ 1.0 ζ ⁎⁎⁎ 0.70rs ⁎⁎⁎ 0.05
Notes:⁎ Estimated coefficients obtained using the ARDL technique.
⁎⁎ Calculated by the authors based on available data.⁎⁎⁎ Cox and Harvie (2010), and Harvie and Thaha (1994).
22 These can be regarded as policy determined parameters.
23 Outcomes from the model are particularly sensitive to the parameters μ2 and ψ2.24 The adjustment of a number of macroeconomic variables can be obtained from thesimulation analysis. However, in order to keep the discussion tractable, focus is placedon only a few key variables as emphasised here.
279I. Ali, C. Harvie / Economic Modelling 32 (2013) 273–285
Author's personal copy
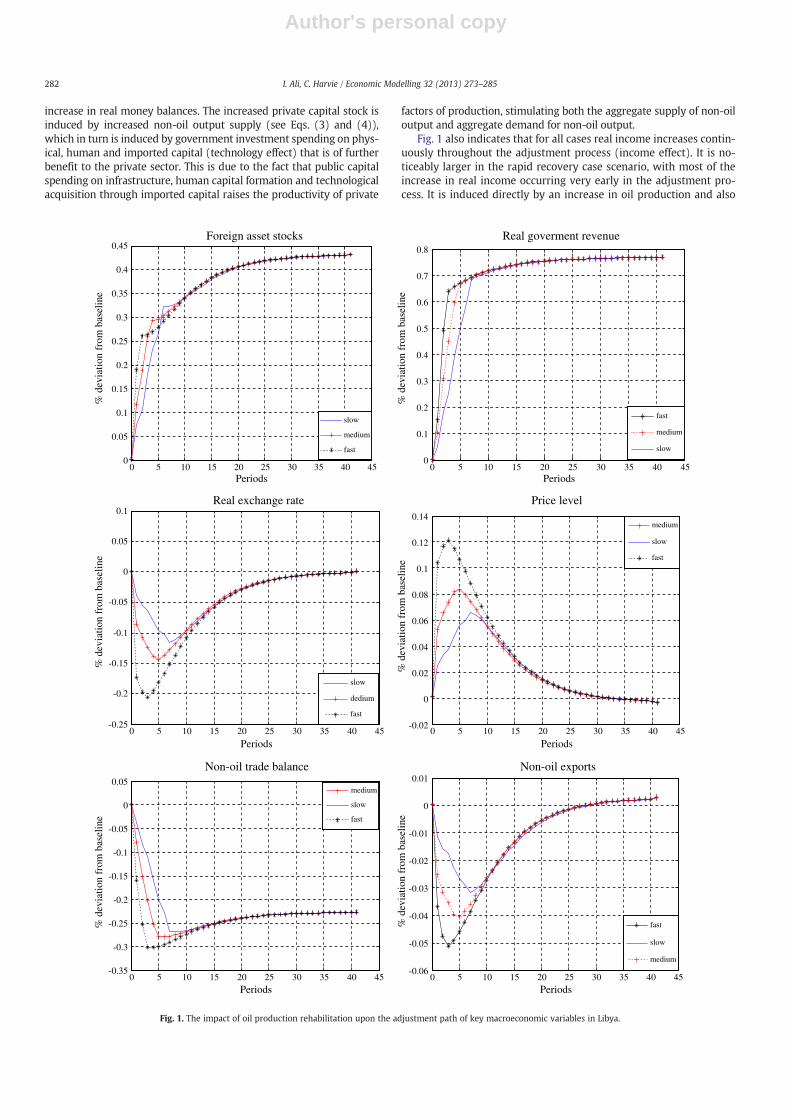
impact of oil production rehabilitation and global oil price effect uponthe adjustment path of each key macroeconomic variable of interestis contained in Fig. 1. The horizontal axis measures time periodswhile the vertical axis for each diagram measures the percentage de-viation of each variable from its initial or base value. These graphs in-dicate that the adjustment period arising from oil productionrecovery lasts 40 periods, by which time all variables have reachedtheir long-run steady state equilibrium. Each graph contains thethree scenario cases; slow case represents a gradual and slow oil pro-duction recovery, medium case symbolizes medium oil productionrecovery, and fast case indicates rapid oil production recovery. A
detailed analysis of the simulation results arising from oil productionrehabilitation is discussed in detail below.
The results presented in Table 10 show that the direction ofchange of the macroeconomic variables of interest arising from thethree scenarios is analogous. Also, the magnitude of the deviationsfrom baseline in the long run is the same for all the variables. Fig. 1shows that an oil production recovery initially leads to an accumula-tion of foreign asset stocks, arising from current account surpluses(current account effect) during the earlier part of the adjustmentpath, but the initial accumulation is larger in the fast case recoveryscenario. This arises from an immediate increase in oil exports and
Table 7Estimated long-run coefficients using the ARDL model for Eqs. (2), (15), (16), (19), (23), (24) and (25)⁎.
Eq. (2): The long-run coefficientestimates based on ARDL(3,0,0) and selected lagbased on AIC
Δcp ¼ α0 þ
Xn
j¼1
bjΔcpt−j þ
Xn
j¼0
cjΔNost−j þ
Xn
j¼0
djΔwpt−j þ δ1c
pt−1 þ δ2Nost−1 þ δ3w
pt−1 þ δ4D83 þ δ5D2000 þ εt
Variable Nos wp Constant Trend D1983 D2000coefficients 0.6636 0.4438 −0.6310 −0.0533 −0.1423 0.0872t-statistics 2.9561 2.1632 −0.8602 −4.2839 −1.6100 0.9116R2=0.74 D-W=2.10
Eq. (15): The long-runcoefficient estimatesbased on ARDL (1,0,0),and selected lagbased on AIC
Δxn ¼ α0 þXn
j¼1
bjΔxnt−j þXn
j¼0
cjΔ eþ p�−pð Þt−j þXn
j¼0
djΔy�t−j þ δ1xnt−1 þ δ2 eþ p�−pð Þt−1 þ δ3y�t−1 þ δ4D78 þ δ5D2000 þ εt
Variable (e+p* – p) y* Constant Trend D1978 D2000coefficients 0.4735 5.0362 −113.30 −0.2154 −0.1012 2.0708t-statistics 1.4607 2.3759 −2.3044 −2.0094 −0.1869 2.0416R2=0.60 D-W=2.03
Eq. (16): The long-runcoefficient estimatesbased on ARDL (1,0,0)and selected lagbased on AIC
Δmcom ¼ α0 þXn
j¼1
bjΔmcomt−j þ
Xn
j¼0
cjΔyt−j þXn
j¼0
djΔ eþ p�−pð Þt−j þ δ1mcomt−1 þ δ2yt−1 þ δ3 eþ p�−pð Þt−1 þ δ4D87 þ δ5D2003 þ εt
Variable (e+p* – p) y Constant Trend D1987 D2003coefficients −0.2565 0.7438 2.4202 −0.0355 0.6507 −0.6605t-statistics −2.2490 3.5753 1.4721 −2.0950 2.1544 −1.9677R2=0.67 D-W=2.31
Eq. (19): The long-runcoefficient estimatesbased on ARDL (1,0,1,0)and selected lagbased on AIC
Δ m−pð Þ ¼ α0 þXn
j¼1
bjΔ m−pð Þt−j þXn
j¼0
cjΔNost−j þXn
j¼0
djΔrt−j þXn
j¼0
ejΔ _π t−j þ δ1 m−pð Þt−1 þ δ2Nost−1 þ δ3rt−1 þ δ4 _π t−1 þ δ5D81 þ εt
Variable Nos π r Constant D1987 D2003coefficients 0.4102 −0.3624 −0.0987 1.3204 −0.0738 −0.1166t-statistics 10.1153 −3.1979 −1.5171 1.8935 −1.6850 −1.6537R2=0.76 D-W=2.14
Eq. (23): The long-runcoefficient estimatesbased on ARDL (1,0,1)and selected lagbased on AIC
Δ _w ¼ α0 þXn
j¼1
bjΔ _wt−j þXn
j¼0
cjΔ Nod−Nos� �
t−jþXn
j¼0
djΔ _π t−j þ δ1 _wt−1 þ δ2 Nod−Nos� �
t−1 þ δ3 _π t−1 þ εt
Variable (Nod – Nos) _πcoefficients 0.6778 0.4109t-statistics 1.6985 2.2924R2=0.73 D-W=2.13
Eq. (24): The long-runcoefficient estimatesbased on ARDL (2,0,1,2,0,0)and selected lagbased on AIC
ΔNos ¼ α0 þXn
j¼1
bjΔNost−j þXn
j¼0
cjΔkpt−j þ
Xn
j¼0
djΔkgt−j þ
Xn
j¼0
ejΔkht−j þ
Xn
j¼0
f jΔlt−j þXn
j¼0
gjΔkcapt−j þ δ1Nost−1 þ δ2k
pt−1 þ δ3k
gt−1
þδ4kht−1 þ δ5lt−1 þ δ6k
capt−1 þ δ7D89 þ εt
Variable kp kg kh kcap em Constant D1996coefficients 0.0866 0.5061 0.5225 0.3105 0.2014 −2.4822 0.0416t-statistics 0.9019 4.2342 2.4162 2.0154 2.1358 −2.1223 0.3905R2=0.87 D-W=1.93
Eq. (25): The long-runcoefficient estimatesbased on ARDL (2,0,2,0,0)and selected lagbased on AIC
Δ _f ¼ α0 þXn
j¼0
cjΔTt−j þXn
j¼1
bjΔ _f t−j þXn
j¼0
cjΔr � f t−j þXn
j¼0
djΔ ox þ poð Þt−j þXn
j¼0
ejΔ e−wð Þt−j þ δ1 _f t−1 þ δ2Tt−1
þδ3r � f t−1 þ δ4 ox þ poð Þt−1 þ δ5 e−wð Þt−1 þ εtVariable T r* f (ox+po) (e – p) Constant Trendcoefficients 0.1506 0.5175 0.3250 −0.3787 −0.9352 0.0058t-statistics 1.1327 4.1594 2.0135 −1.2976 −1.3189 1.8155R2=0.86 D-W=2.16
⁎ Due to data limitations, the historical data used in this paper covered the period from 1970 to 2007, which includes the oil boom and post oil boom periods, and other importantevents which took place during the 1980s and 1990s such as the embargo and sanctions imposed by the United States and the United Nations. Different local and internationalsources for data are used:1. Central Bank of Libya (CBL), Economic Bulletin: http://www.cbl.gov.ly/en/2. Secretariat of the General People's Committee for Planning.3. National Authority for Information and Documentation: http://www.gia.gov.ly/.4. OPEC, Annual Statistical Bulletin. Also available online: http://www.opec.org/.5. International Financial Statistics, IFS, International Monetary Fund.6. World Development Indicators (WDI), World Bank.
280 I. Ali, C. Harvie / Economic Modelling 32 (2013) 273–285
Author's personal copy
surplus in the oil trade balance and higher foreign interest income(see Eqs. (25) and (26)). An initial accumulation of foreign exchangereserves leads to a temporary increase in the money stock so as tomaintain the fixed nominal exchange rate policy, leading to an in-crease in the domestic price level in the short term. Foreign assetstocks increase continuously throughout the adjustment process to-wards long-run steady state in all cases, signifying current accountsurpluses, accumulating by 40 percent in long-run steady state. Thisis despite a deficit in the non-oil trade balance arising from increasednon-oil imports and decreased non-oil exports.25 This can beexplained by the fact that the non-oil trade balance deficit is entirelyoffset by continual surpluses in the oil trade balance, with the latterbeing brought about by an increase in oil export volumes as well asfrom an increase in foreign interest income.
Total real government revenue initially increases during the ad-justment process, as can be observed from Fig. 1. However, this in-crease is greater in the fast recovery case and less in the slowrecovery case. Government income, therefore, increases immediate-ly in the early stage of adjustment in all cases, facilitating larger gov-ernment capital spending upon public capital (infrastructure),human capital formation and imported capital and larger potentialbenefits for the private sector. Consequently, this stimulates devel-opment in the non-oil sector.26 Real government income increasesthereafter to the long-run steady state level where it is higher thanits base value by 77 percent, in all cases. This result is perfectly con-sistent with Libyan government objectives of bringing about, andbenefitting more from, a rapid rehabilitation of oil production inthe economy.
Developments in government revenue (revenue effect) affecttotal real income directly since government spending increases,and indirectly via expansions in non-oil output supply as can be ob-served from Eq. (24). The indirect effect is induced, as mentionedabove, by public capital stock, human capital stock and importedcapital stock accumulation, which also benefits the private capitalstock and non-oil output supply. Also, increased government real in-come arising from oil production rehabilitation will have a signifi-cant impact upon the real exchange rate. During oil recoveryperiods the government increases its spending to maintain its bal-anced budget policy, resulting in increased demand for bothnon-oil as well as imported goods (see Eq. (1)). Consequently, theincreased demand for non-oil output (spending effect) will lead toa higher domestic price level during the short run and an apprecia-tion of the real exchange rate. As can be seen from Fig. 1 the realexchange rate will appreciate by more in the fast recovery scenariodue to a higher price level in the earlier part of the adjustmentprocess. It appreciates by less in the slow and medium recoveryscenarios due to a lower price level increase. An appreciation ofthe real exchange rate (exchange rate effect) will have a significant
influence upon the adjustment of a number of key macroeconomicvariables, particularly non-oil exports, non-oil imports, and non-oiltrade balance, and consequently upon the domestic economy as awhole.
The non-oil trade balance initially deteriorates during the adjust-ment process for all scenarios, with a noticeably larger deteriorationfor the rapid oil production recovery scenario, suggesting the exis-tence of Dutch disease effects, as can be seen from Fig. 1. The prima-ry reason for the deterioration in the non-oil trade balance is acombination of increasing non-oil imports and declining non-oil ex-ports throughout the adjustment path. Increased non-oil importsare stimulated by an appreciation of the real exchange, an increasein real domestic income and government spending on capital im-ports. However, the adjustment of non-oil exports is stronglyinfluenced by the initial sizeable appreciation of the real exchangerate, particularly in the fast oil production recovery case. Dutch dis-ease consequences are, therefore, likely to occur in terms of deteri-oration in the non-oil trade balance during the early stage of theadjustment process toward long run steady state. As the real ex-change rate appreciates this results in a loss of competitiveness fornon-oil exports (exchange rate effect), and higher domestic demandstimulated by an increase in real income increases the demand fornon-oil imports.
During the medium to long-run steady state the non-oil trade bal-ance experiences a slight improvement as a result of an improvementin non-oil exports and decline in non-oil imports. This arises from asubsequent depreciation of the real exchange rate, as can be observedfrom Fig. 1. The non-oil trade balance declines by almost 8 percent inlong-run steady state.
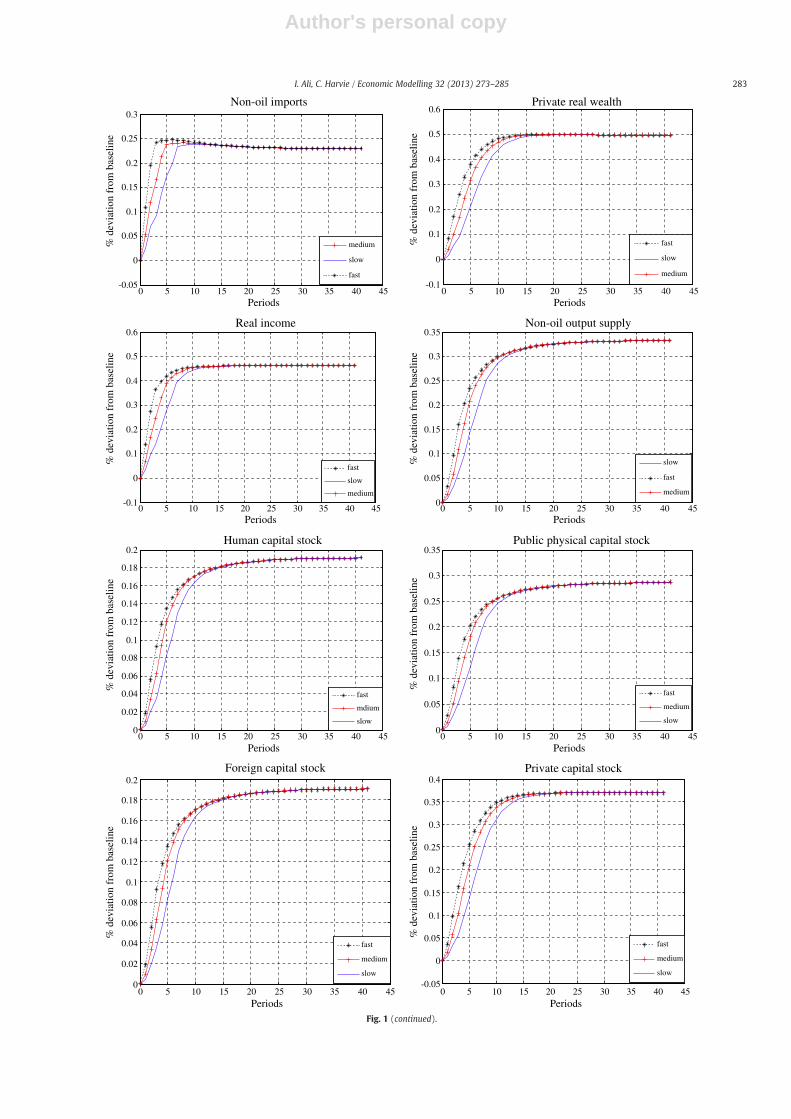
The simulation results for private sector real wealth indicate thatit increases continuously throughout the adjustment process towardits long-run steady state for all scenarios. It accumulates by almost50 percent, as can be observed in Fig. 1. Increased private sectorreal wealth in all scenarios arises due to an accumulation in privatecapital stock (see Fig. 1), an increase in permanent income and an
25 Increased non-oil imports, in particular non-oil capital imports, deteriorate thenon-oil trade balance and reduce the accumulation of foreign asset stocks. However,imported capital has a positive impact upon non-oil output supply.26 This explains the continual increase in non-oil output supply in the early stage ofadjustment (see Fig. 1).
Table 8Testing for the existence of a long-run relationship among the variables⁎.
Equation 95% Lower bound 95% Upper bound 90% Lower bound 90% Upper bound The computed F-statistic
F(cp/Nos, wp, D83, D2000) 7.1331 8.1223 5.9643 6.8483 8.5036F(xn/(e+p*−p), y*, D78, D2000) 7.2027 8.0224 5.9599 6.8090 9.5687F(mcon/y, (e−p*−p), D87, D2003) 6.8999 7.9831 5.7676 6.7289 6.9717F m−p=Nos; r; _π ;D81ð Þ 4.9827 5.9803 4.1361 5.0154 6.1426F _w= Nod−Nos
� �; _π
� �2.8906 4.1355 2.2636 3.3349 6.7978
F(Nos/kp, kg, kh, em, kcap, D89) 3.6605 5.0006 3.0991 4.2756 6.2444F _f =T; r�; f ; ox þ poð Þ; e−pð Þ� �
4.0285 5.3829 3.3851 4.6270 5.9057
⁎ Critical values are obtained directly from the empirical results generated by Microfit 5.
Table 9The scenarios of Libyan oil production rehabilitation (% change).
Scenarios/periods 1 2 3 4 5 6 7
Slow scenario(scenario 1)
oa 0.1 0.3 0.4 0.6 0.75 0.85 1.00po −0.01 −0.02 −0.03 −0.035 −0.040 −0.045 −0.05
Mediumscenario(scenario 2)
oa 0.2 0.5 0.7 0.9 1.00po −0.01 −0.02 −0.03 −0.04 −0.05
Fast scenario(scenario 3)
oa 0.4 0.7 1.00po −0.02 −0.04 −0.05
Table 10Long-run steady state properties of the model for the three scenarios.
Variable f T g c wp y Nos kg Kh kcap kp p
Deviation frombase line
43 −22.5 77 0 50 45 34 28 19 19 37 0
Note: The numbers indicate percentage deviation from baseline.
281I. Ali, C. Harvie / Economic Modelling 32 (2013) 273–285
Author's personal copy
increase in real money balances. The increased private capital stock isinduced by increased non-oil output supply (see Eqs. (3) and (4)),which in turn is induced by government investment spending on phys-ical, human and imported capital (technology effect) that is of furtherbenefit to the private sector. This is due to the fact that public capitalspending on infrastructure, human capital formation and technologicalacquisition through imported capital raises the productivity of private
factors of production, stimulating both the aggregate supply of non-oiloutput and aggregate demand for non-oil output.
Fig. 1 also indicates that for all cases real income increases contin-uously throughout the adjustment process (income effect). It is no-ticeably larger in the rapid recovery case scenario, with most of theincrease in real income occurring very early in the adjustment pro-cess. It is induced directly by an increase in oil production and also
0 5 10 15 20 25 30 35 40 450
0.05
0.1
0.15
0.2
0.25
0.3
0.35
0.4
0.45Foreign asset stocks
Periods
% d
evia
tion
from
bas
elin
e
slow
medium
fast
0 5 10 15 20 25 30 35 40 450
0.1
0.2
0.3
0.4
0.5
0.6
0.7
0.8
Real goverment revenue
Periods
% d
evia
tion
from
bas
elin
e
fast
medium
slow
0 5 10 15 20 25 30 35 40 45-0.25
-0.2
-0.15
-0.1
-0.05
0
0.05
0.1Real exchange rate
Periods
% d
evia
tion
from
bas
elin
e
slow
dedium
fast
0 5 10 15 20 25 30 35 40 45-0.02
0
0.02
0.04
0.06
0.08
0.1
0.12
0.14
Price level
Periods
% d
evia
tion
from
bas
elin
e
medium
slow
fast
0 5 10 15 20 25 30 35 40 45-0.35
-0.3
-0.25
-0.2
-0.15
-0.1
-0.05
0
0.05
Non-oil trade balance
Periods
% d
evia
tion
from
bas
elin
e
medium
slow
fast
0 5 10 15 20 25 30 35 40 45-0.06
-0.05
-0.04
-0.03
-0.02
-0.01
0
0.01Non-oil exports
Periods
% d
evia
tion
from
bas
elin
e
fast
slow
medium
Fig. 1. The impact of oil production rehabilitation upon the adjustment path of key macroeconomic variables in Libya.
282 I. Ali, C. Harvie / Economic Modelling 32 (2013) 273–285
Author's personal copy
0 5 10 15 20 25 30 35 40 45-0.05
0
0.05
0.1
0.15
0.2
0.25
0.3Non-oil imports
Periods
% d
evia
tion
from
bas
elin
e
medium
slow
fast
0 5 10 15 20 25 30 35 40 45-0.1
0
0.1
0.2
0.3
0.4
0.5
0.6Private real wealth
Periods
% d
evia
tion
from
bas
elin
e
fast
slow
medium
0 5 10 15 20 25 30 35 40 45-0.1
0
0.1
0.2
0.3
0.4
0.5
0.6Real income
Periods
% d
evia
tion
from
bas
elin
e
fast
slow
medium
0 5 10 15 20 25 30 35 40 450
0.05
0.1
0.15
0.2
0.25
0.3
0.35Non-oil output supply
Periods
% d
evia
tion
from
bas
elin
e
slow
fast
medium
0 5 10 15 20 25 30 35 40 450
0.02
0.04
0.06
0.08
0.1
0.12
0.14
0.16
0.18
0.2Human capital stock
Periods
% d
evia
tion
from
bas
elin
e
fast
mdium
slow
0 5 10 15 20 25 30 35 40 450
0.05
0.1
0.15
0.2
0.25
0.3
0.35Public physical capital stock
Periods
% d
evia
tion
from
bas
elin
e
fast
medium
slow
0 5 10 15 20 25 30 35 40 450
0.02
0.04
0.06
0.08
0.1
0.12
0.14
0.16
0.18
0.2Foreign capital stock
Periods
% d
evia
tion
from
bas
elin
e
fast
medium
slow
0 5 10 15 20 25 30 35 40 45-0.05
0
0.05
0.1
0.15
0.2
0.25
0.3
0.35
0.4Private capital stock
Periods
% d
evia
tion
from
bas
elin
e
fast
medium
slow
Fig. 1 (continued).
283I. Ali, C. Harvie / Economic Modelling 32 (2013) 273–285
Author's personal copy
by subsequent changes in non-oil output (see Eq. (17)). In long-runsteady state for all scenarios real income is approximately 45 percenthigher than its base value, as indicated in Table 10. On the demandside an increase in real income stimulates non-oil imports, which inturn contributes to a deterioration of the non-oil trade balance. How-ever, an increase in non-oil capital imports enhances non-oil outputsupply and also real income.
Non-oil output supply improves continuously throughout the ad-justment process to its long-run steady state for all three scenarios,but it increases by less in the slow oil production recovery scenarioin the early stage of adjustment. The major contributory factors tothis development throughout the adjustment process include: a con-tinuous increase in private capital stock, public capital stock (that is,infrastructure), human capital stock (education and training), andimported capital stock (technological acquisition) (see Fig. 1). An in-crease in overall public capital stock is stimulated directly by govern-ment development spending (spending effect). An increase in non-oiloutput supply stimulates demand via private consumption and pri-vate investment. Also, an increase in non-oil output supply increasesthe nation's real income and induces imports to rise, thereby possiblyleading to a trade balance deficit. Thus, the positive effects of an in-crease in non-oil output supply are offset partially by deteriorationin the non-oil trade balance.
The Dutch disease effect upon non-oil output is not likely to occurduring the early stage of the adjustment process toward long-runsteady state from the above results. The windfall revenue arisingfrom the oil sector rehabilitation brings about increased domestic de-mand for non-oil output, while a real exchange rate appreciation re-duces the demand for non-oil output (spending effect and anexchange rate effect). The latter contributes to a loss of competitive-ness of the non-oil tradeables sector. In this model the former effectdominates the latter effect and non-oil output demand increasesoverall. On the non-oil output supply side a Dutch disease effectduring the early periods of adjustment is also not observed, due tothe gradual accumulation in physical, human and imported capitalstocks27(see Fig. 1 and Eq. (24)).
In long-run steady state non-oil output supply is found to behigher than its base value by 34 percent in all scenarios. This isagain due to the accumulation of public, human and imported capitalstock as well as private capital stock in long-run steady state.
The adjustment process from the short-run to the long-run steadystate indicates an important result for economic development ofLibya. Model simulation results indicate that oil sector rehabilitationbrings about: an increase in government revenue, increased govern-ment spending in the domestic economy, increased foreign assetstocks and increased output in the non-oil sector, particularly inthe medium and rapid oil production recovery scenarios duringthe adjustment process. However, increased oil revenue due to oilproduction recovery may also produce adverse consequences, par-ticularly upon the non-oil trade balance, arising from a loss of com-petitiveness of non-oil tradable goods induced by an appreciation ofthe real exchange rate and increased imports stimulated by in-creased real income. The adverse effects are obviously larger in themedium and fast scenarios. Model simulation results also suggestthat investment and productivity stimulating policy measuresby the government produce the most substantive longer-termbenefits for the economy. That is, rebuilding the country's infra-structure through new government development spending uponphysical capital accumulation and improving the longer-termeconomic well-being of the population through government
investment spending upon education and health services willproduce substantive longer-term benefits for the economy. Therehabilitation of the oil sector will also have a wider global im-pact. Rehabilitation of Libyan oil production will likely put down-ward pressure on world oil prices, reduce global inflationarypressure and exert a positive influence on global growth. Conse-quently, Libyan oil production rehabilitation is not only of considerableimportance to the country itself but also to the global economy moregenerally. The latter impact, however, has not been modelled in thisstudy.
6. Conclusions and policy implications
The Libyan economy experienced dramatic political and eco-nomic upheaval in 2011. Critical to the country's future recoveryfrom the devastation of the civil war is to rebuild the economywhich will depend upon how rapidly the oil sector can be rehabili-tated, but the duration of this process is currently uncertain. The im-pact of this recovery is, however, of significant contemporaryimportance to both the Libyan economy and the global economymore generally.
This paper developed a dynamic general equilibrium macroeco-nomic model aimed at highlighting some of the key macroeconomicdevelopments likely to arise from a recovery of the oil sector, aimedat analysing the dynamic adjustment process and long-run steadystate properties. Focus was placed upon three oil-related rehabilita-tion scenarios. The major conclusion derived from this paper is thatthe country's oil sector recovery will potentially result in an increasein private capital stock, hence private sector wealth, real income, do-mestic physical capital stock, human capital stock, imported capitalstock and non-oil supply (and demand). These positive impacts areobviously larger in the fast and medium oil production recovery sce-narios respectively. However, Dutch disease consequences are likelyto be confined to the non-oil trade balance during the adjustmentprocess towards long-run steady state. That is, a recovery of the oilsector also has the potential to deteriorate the non-oil trade balancethrough a loss of competitiveness from a real exchange rate appreci-ation, and it is worse in the case of the rapid oil production recoveryscenario due to higher inflationary outcomes with a fixed nominal ex-change rate. Nevertheless, despite the loss of competitiveness of thenon-oil tradable sector, non-oil output supply increases throughoutthe early periods of adjustment. This is attributable to the fact thatthe Dutch disease effect upon non-oil output is offset by governmentdevelopment spending on physical, human and imported capitalstocks. In the context of the Libyan economy, this confirms the crucialrole that the government, which owns the oil sector, must play inenhancing the positive consequences and/or minimising the adverseeffects of the oil sector recovery upon the non-oil sector. The govern-ment could improve productivity and increase the availability andtype of capital available for the non-oil tradable sector, such asthat for the manufacturing and agricultural sectors, by increasing orchanging the composition of government investment in infrastruc-ture, human capital formation and technology acquisition in thesesectors (Barnett and Ossowski, 2002; Brahmbhatt et al., 2010;Collier et al., 2009; Davis et al., 2003; Gylfason and Zoega, 2002;Morrison and Schwartz, 1996; Stijns, 2001b). This will eventuallyimprove their competitiveness. It will be the responsibility ofpolicymakers to identify where such development spending is bestdirected, which will require more detailed analysis of key bottlenecksand capacity constraints facing the non-oil sector. Moreover, the ben-efits for the non-oil sector arising from public capital stock, humancapital stock, and imported capital stock accumulation induced bythe recovery of the oil sector could be of substantial importance interms of employment and growth generation. This emphasises theimportance of bringing about a rapid rehabilitation of the oil sector.
27 A possible explanation for this result is that the real wage is not included in Eq.(24) due to technical difficulties in its estimation. When the real wage was includedin the simulation procedure, an initial decline in non-oil output supply was observed.Therefore the absence of this variable from Eq. (24) appears to mitigate the Dutch dis-ease effect upon non-oil output supply.
284 I. Ali, C. Harvie / Economic Modelling 32 (2013) 273–285
Author's personal copy
An increase in non-oil output will possibly lead to an increase in thedemand for labour, and hence reduce unemployment.
The model presented incorporated and demonstrated the impor-tance of a number of channels through which oil production rehabil-itation will impact the macro-economy, namely a(n): revenue effect,income effect, spending or wealth effect, exchange rate effect, currentaccount effect, and technology effect. A major innovation of this paperhas been in highlighting the importance of the technology effect, tra-ditionally ignored in the literature, which is likely to be of importancefor developing, oil exporting but technologically backward economiessuch as that of Libya.
The model presented in this paper can also be modified with theaim of conducting equivalent simulations under alternative exchangerate policies, combined with different degrees of international capitalmobility. A change in the nominal exchange rate from a fixed toflexible exchange rate regime could affect the development of theoverseas sector; therefore the government may further minimisethe adverse effects of the oil boom upon the non-oil trade balanceby moving to a more flexible exchange rate system. Under a flexibleexchange rate regime the exchange rate is capable of adjusting sothat either capital inflows or outflows will have no effect upon foreignexchange reserves. As a consequence, growth of the money stock isexogenous and policy determined and the nominal exchange rate isendogenous. This could contribute to insulation of the domestic econ-omy from inflationary factors such as growth of the money stockwhich occurs in the case of a fixed exchange rate. This is left forfurther research.
References
Adjemian, S.E., Bastani, H., Juillard, M., Mihoubi, F., Perendia, George, Ratto, M.,Villemot, S.E., 2011. Dynare: Reference Manual. Version 4 Dynare Working Papers,1.CEPREMAP.
Aschauer, D.A., 1989a. Is public expenditure productive? Journal of Monetary Economics23, 177–200.
Aschauer, D.A., 1989b. Does public capital crowd out private capital? Journal of MonetaryEconomics 24, 171–188.
Auty, R., 1993. Sustaining Development inMineral Economies: the Resource Curse Thesis,Routledge, London.
Auty, R., 2001. Resource Abundance and Economic Development. Oxford UniversityPress, Oxford, UK.
Auty, R.M., Mikesell, R.F., 1998. Sustainable Development in Mineral Economies.Clarendon Press, Oxford.
Bahgat, G., 2006. Libya Looks to a Bright Future Post-Sanctions, Mediterranean Year-book 2006. Institut Europeu de la Mediterrània, Barcelona.
Barnett, S., Ossowski, R., 2002. Operational Aspects of Fiscal Policy in Oil-ProducingCountries. Working Paper 02/177. International Monetary Fund, Washington, DC.
Brahmbhatt, M., Canuto, O., Vostroknutova, E., 2010. “Dealing with Dutch Disease”,Economic Premise, 16: 1–7. World Bank, Washington, DC.
Brückner, M., 2010. Natural resource dependence, non-tradables, and economic growth.Journal of Comparative Economics 38 (4), 461–471.
Buiter, W.H., Miller, M.H., 1981. Monetary policy and international competitiveness:the problem of adjustment. Oxford Economic Papers 33, 143–175.
Buiter, W.H., Purvis, D.D., 1982. Oil, disinflation and export competitiveness: a model ofthe Dutch disease. In: Bhandari, J., Putnam, B. (Eds.), Economic Interdependenceand Flexible Exchange Rates. MIT Press, Cambridge, Mass.
Cai, Y., 2009. Resources, Revolution and Repression: The Paradox of Plenty. Centre for Ap-plied Macroeconomic Analysis, Australian National University, Canberra, Australia.
Central Bank of Libya, 2005. Annual Economic Report. Central Bank of Libya, Tripoli.Collier, P., van der Ploeg, F., Spence, M.M., Venables, A.J., 2009. Managing Resource Rev-
enues in Developing Economies. IMF Staff Papers 57, 84–118.
Corden, W.M., Neary, P.J., 1982. Booming sector and deindustrialization in a small openeconomy. The Economic Journal 92, 825–848.
Cox, G.M., Harvie, C., 2010. Resource price turbulence and macroeconomic adjustmentfor a resource exporter: A conceptual framework for policy analysis. Energy Eco-nomics 32 (2), 469–489.
Davis, J.M., Ossowski, R., Fedilino, A., 2003. Fiscal Policy Formulation and Implementa-tion in Oil-Producing Countries. International Monetary Fund, Washington, DC.
Dornbusch, R., 1976. Exchange rate dynamics. Journal of Political Economy 84, 1161–1176.Eastwood, R.K., Venables, A.J., 1982. The macroeconomic implications of a resource dis-
covery in an open economy. The Economic Journal 29, 285–299.Energy Information Administration (EIA), 2007. Country Analysis Briefs (Libya). http://
eia.doe.gov.European Commission DG trade, 2009. Trade Sustainability Impact Assessment (SIA) of
the EU–Libya Free Trade Agreement.Gelb, A., Associates, 1988. Oil Windfalls: Blessing or Curse?World Bank, Washington, DC.Gylfason, T., Zoega, G., 2002. Natural Resources and Economic Growth: the Role of
Investment. Working Paper No. 142. Central Bank of Chile, Santiago de Chile.Hartwick, J.M., 1977. Intergenerational equity and the investing of rents from exhaustible
resources. American Economic Review 67, 972–974.Harvie, C., 1993. The macroeconomic effects of oil shocks under fixed and flexible
exchange rates — a comparison. OPEC Review 259–278 (Autumn).Harvie, C., 1994. Oil shocks and the macroeconomy: a short- and long-run comparison.
The Journal of Energy and Development 18 (1), 59–94.Harvie, C., Gower, L., 1993. Resource shocks and macroeconomic adjustment in the
short and long run. The Middle East Business and Economic Review 5 (1), 1–14.Harvie, C., Thaha, A., 1994. Oil production andmacroeconomic adjustment in the Indonesian
economy. Energy Economics 16 (4), 253–270.Lee, J., Strazicich, M.C., 2003. Minimum Lagrange multiplier unit root test with two
structural breaks. The Review of Economics and Statistics 85 (4), 1082–1089.Lee, J., Strazicich, M.C., 2004. Minimum Lagrange Multiplier Unit Root Test with one
Structural Break. Working Paper. Department of Economics, Appalachian StateUniversity.
Mahmud, M.B., Russell, A., 1999. An analysis of Libya's revenue per barrel from crudeoil upstream activities, 1961–93. OPEC Review 213–249 (September).
Manzano, O., Rigobon, R., 2001. Resource Curse or Debt Overhang? Working Paper No.8390. National Bureau of Economic Research, Cambridge, MA.
Mikesell, R.F., 1997. Explaining the resource curse, with special reference to mineral-exporting countries. Resources Policy 23 (4), 191–199.
Morrison, C.J., Schwartz, A.E., 1996. State infrastructure and productive performance.American Economic Review 86, 1095–1111.
Neary, J.P., van Wijnbergen, S., 1984. Can an oil discovery lead to a recession? A com-ment on Eastwood and Venables. The Economic Journal 94, 390–395.
Neumayer, E., 2004. Does the ‘resource curse’ hold for growth in genuine income aswell? World Development 32 (10), 1627–1640.
Pesaran, B., Pesaran, M.H., 2009. Time Series Econometrics using Microfit 5.0. OxfordUniversity Press, Oxford.
Pesaran, M.H., Shin, Y., Smith, R.J., 2001. Bounds testing approaches to the analysis oflevel relationships. Journal of Applied Econometrics 16 (3), 289–326.
Rodríguez, F., Sachs, J.D., 1999. Why do resource abundant economies growmore slowly?A new explanation and an application to Venezuela. Journal of Economic Growth 4,277–303.
Ross, M.L., 1999. The political economy of the resource curse. World Politics 51, 297–322.Sachs, J.D., Warner, A.M., 1995. Natural Resource Abundance and Economic Growth.
National Bureau of Economic Research Working Paper Series, No. 5398.Sachs, J.D., Warner, A.M., 2001. The Curse of Natural Resources. European Economic Re-
view 45, 827–838.Sala-i-Martin, X., Subramanian, A., 2003. Addressing the Natural Resource Curse: An Il-
lustration from Nigeria. Working Paper 9804.National Bureau of Economic Re-search, Cambridge, MA.
Stevens, P., 2003. Resource Impact — Curse or Blessing? A Literature Survey. Universityof Dundee.
Stijns, J.P., 2001a. Natural Resource Abundance and Economic Growth Revisited. Universityof California at Berkeley.
Stijns, J.P., 2001b. Natural Resource Abundance and Human Capital Accumulation.Working Paper. University of California at Berkeley.
Usui, N., 1996. Policy Adjustments to the Oil Boom and their Evaluation: The Dutch Diseasein Indonesia. World Development 24 (5), 887–900.
van der Ploeg, F., Poelhekke, S., 2009. Volatility and the natural resource curse. OxfordEconomic Papers 61, 727–760.
World Bank, 2006. Socialist People's Libyan Arab Jamahiriya. Country Economic Report.World Bank, Washington, DC.
285I. Ali, C. Harvie / Economic Modelling 32 (2013) 273–285