legacy plan environmental scan technical report: … plan environmental scan technical report: ......
TRANSCRIPT

Legacy Plan Environmental Scan
Technical Report:
Park and Recreation Issues and Opportunities
Amy Pow, MCIP February, 2011

1
City of Lakewood Andrew Neiditz, City Manager
David Bugher, Assistant City Manager/ Development Mary Dodsworth, Director of Parks, Recreation and Community Services
Amy Pow, Legacy Plan Project Lead Maria Sevier, GIS Coordinator
Lakewood City Council
Mayor Douglas G. Richardson Deputy Mayor Don Anderson
Council Member Claudia B. Thomas Council Member Walter Neary
Council Member Michael D. Brandstetter Council Member Mary Moss
Council Member Jason Whalen
Lakewood Parks and Recreation Advisory Board Roger Laybourn, Chair
J. Alan Billingsley Jim Charboneau Gary Fowler Jason Gerwen Vito Iacobazzi Tanja Scott
Legacy Team
Jason Gerwen, Co‐chair Vito Iacobazzi, Co‐chair
Kim Dodds Cynthia Gracey
Jon Graef Linda Graves
Deborah Johnson Celina Kim
Michele Lafontaine Anessa McClendon
Phil Raschke Jan Rich
Amanda Richardson Jerry Weydert Levi Wilhemsen Scott Williams
Mary Dodsworth, Director Amy Pow, Project Lead and Facilitator
Suzi Riley, Department and Legacy Team Secretary

2
A LEGACY is a gift
left behind but which always has an influence on the present day
or handed down to be remembered and revered
LAKEWOOD’S LEGACY PLAN presents a gift
of healthy park and recreation opportunities for the enjoyment of today’s residents
and a sustainable inheritance to be preserved for tomorrow’s generations

3
Table of Contents Chapter 1 Introduction .................................................................................................................. 5 Chapter 2 Planning Context ........................................................................................................... 6 2.1 Regional Setting ...................................................................................................... 6
2.2 Natural Features ..................................................................................................... 6
2.3 Park Planning Areas ................................................................................................ 8
2.4 Demographics ....................................................................................................... 11
2.5 Population Projections .......................................................................................... 20
Chapter 3 Emerging Trends ......................................................................................................... 21 3.1 Demographic Shift ................................................................................................ 21
3.2 Personal Behaviors and Life Styles ....................................................................... 22
3.3 Society and Economy ............................................................................................ 23
3.4 Climate Change and Environment ........................................................................ 24
3.5 Park and Recreation Industry ............................................................................... 25
Chapter 4 Park and Open Space Resources ................................................................................. 27 Chapter 5 Recreation Programming ............................................................................................ 33 5.1 Program Areas ...................................................................................................... 33
5.2 Program Types ...................................................................................................... 34
5.3 Program Evaluation ............................................................................................... 35
Chapter 6 Partners and Alternative Providers ............................................................................. 44 Chapter 7 Community Aspirations ............................................................................................... 47 7.1 Participation, Barriers and Communication ......................................................... 47
7.2 Future Needs ......................................................................................................... 48
7.3 Level of Service Opinions ...................................................................................... 49

4
Chapter 8 Management and Finance .......................................................................................... 50 8.1 Organization and Administration .......................................................................... 50
8.2 Budget Appropriation ........................................................................................... 53
8.3 Revenue and Expenditure ..................................................................................... 54
8.4 Public Perception .................................................................................................. 56
Chapter 9 Public Participation ..................................................................................................... 57 9.1 Legacy Team .......................................................................................................... 57
9.2 Key Stakeholder Interviews .................................................................................. 57
9.3 Webpage and Internet Survey .............................................................................. 57
9.4 Focus Groups......................................................................................................... 58
9.5 Community Survey ................................................................................................ 58
9.6 Local Papers, Flyers, Program Guide and Press Releases ..................................... 58
Chapter 10 Summary of Environmental Scan: Issues and Opportunities .................................... 59 10.1 Land Use and Planned Growth ............................................................................. 59
10.2 Parks, Open Space and Natural Environment ....................................................... 60
10.3 Recreation Programs and Services ....................................................................... 61
10.4 Maintenance ......................................................................................................... 62
10.5 Management and Finance .................................................................................... 63
10.6 Concluding Remarks ............................................................................................. 64
List of Appendices ......................................................................................................................... 65 Appendix A: Park and Outdoor Facility Inventory ..................................................................... 66
Appendix B: Current Park and Recreation Partnership Profile ................................................. 70
Appendix C: Alternative Provider Profile .................................................................................. 73
Appendix D: Legacy Team Mission and Membership ............................................................... 75
Appendix E: List of Key Stakeholder Interview and Interview Questionnaire .......................... 78
Appendix F: Internet Survey Findings ....................................................................................... 80
Appendix G: Focus Group Meetings—Summary of Findings .................................................... 83
Appendix H: Issue Matrix ........................................................................................................... 88
Appendix I: List of City‐Related Document Review ................................................................. 93
Appendix J: Community Benefits Built Around the Four Pillars of Sustainability .................... 94

5
Chapter 1 Introduction
Since the adoption of the Parks and Recreation Master Plan in 2005, the City of Lakewood (the City) has expanded the Recreation Division, created new partnerships, added three new parks and made park system‐wide improvements to better serve Lakewood’s residents. The Parks, Recreation and Community Services Department (the Department) has become more proactive in providing parks and recreation programs to the community. In view of the service expansion and new trends, the City grasped the opportunity to update the 2005 Master Plan and address future park and recreation needs of the community. In the summer of 2010, the Department began to embark on the development of a 20‐year sustainable park and recreation plan, known as Lakewood’s Legacy Plan. This strategic plan will lay out a road map to guide the future development of park and recreation services; while leaving behind a healthy and sustainable park and recreation system for future residents. The planning process for the Legacy Plan involves four phases. The initial phase provides an Environmental Scan for preparing the strategic plan. The second phase is the development of the vision, mission, goals and levels of park and recreation services. The third is the preparation of an action plan and a six‐year Capital Improvement Program to achieve the mission and goals of the plan. Finally, the last phase comprises the actual production of the Legacy Plan and its adoption. This Technical Report contains the findings and analyses of the first phase (Environmental Scan) of the Plan. Chapters 2 to 8 include the assessment of both the external and the internal environments. The assessment of the external drivers includes demographic analysis, population projections, community need assessment and analysis of emerging trends affecting park and recreation. Internal environmental assessments include the park inventory update, program evaluation, partner relations and organizational analyses. The City strongly values community input into the process. The Legacy Plan will be developed in partnership with the general public, service providers and partnering agencies. Chapter 9 serves as the documentation of an extensive public participation program launched at the beginning of the planning process to gather public input for the Plan. The concluding Chapter 10 summarizes the issues, needs, opportunities and constraints presented both by the external and the internal environments. They form the foundation on which the Legacy Plan will be built.

6
Chapter 2 Planning Context
2.1 Regional Setting
The City of Lakewood is the second largest city in Pierce County and the 16th in the State of Washington1. It is strategically located in the southwestern part of the County along I‐5 between Sea‐Tac International Airport and Olympia, the State Capitol (Map 1). Today, over 58,000 people and close to 1,100 businesses proudly call Lakewood home. The City is conveniently located in close proximity to many natural and recreational assets. The lovely South Puget Sound and Chambers Bay lie just five miles to its northwest, and the scenic Mt. Rainer National Park is about 35 miles to the southeast. Lakewood’s neighbors include the City of Tacoma to the north, the Town of Steilacoom to the west, Joint Base Lewis‐McChord to the south, and Unincorporated Pierce County to the east.
2.2 Natural Features
Our City’s name truly reflects the natural beauty of the City adorned with glistening lakes, creeks and streams, wooded natural areas, habitats and wetlands. About one‐sixth of the City is covered by water. The five major lakes shaping the beautiful cityscape include American Lake, Gravelly Lake, Lake Steilacoom, Lake Louise and Wards Lake. Adding much to the glamorous natural setting are other smaller lakes such as Barlow Pond, Boyles Lake, Carp Lake, Emerson Lake, Lost Lake, Mud Lake and Seeley Lake. Unfortunately, most of the lakes are not publicly accessible; therefore, somewhat limiting the recreation opportunities for the residents. The City has many creeks and streams. Two major creeks identified as “priority habitats” by the State Department of Fish and Wildlife are Chambers Creek and Fleet Creek, both located in the northern portion of the City. Two others, flowing into the centrally‐located Lake Steilacoom, include Clover Creek and Ponce de Leon Creek. About 155 acres of wetlands have been identified along the Creeks and Lakes. Two largest wetlands with significant ecological and biological values are the 105 acres of wetland running along Flett Creek, commonly known as the Old Flett Dairy Wetland, and the 37‐acre Crawford March near Seeley Lake. These natural resources are important assets for the community. With proper planning and development of the necessary strategies to provide public access and protect environmentally sensitive areas, these priceless natural treasures will offer a variety of opportunities for outdoor recreation and environmental stewardship.
1 City ranking is based on the 2009 estimated population. <http://www.citypopulation.de?USA‐Wahington.html>

7

8
2.3 Park Planning Areas
With over 12,000 acres, Lakewood is made up of diverse neighborhoods traversed by major arterials, lakes and creeks; resulting in some areas being isolated from the rest of the City. In certain areas, residents have to cross major roads and water bodies to access the closest park and recreation facilities. The physical barriers can cause inconvenience and create longer trips for residents to travel to their nearest parks and open space. The Legacy Plan recommends using major physical barriers as boundaries to create ten park planning areas. It is hoped that through the delineation of park planning areas, residents living within each park planning area will have safe access to and be equitably served by sufficient parks and outdoor recreation opportunities within reasonable walking distance. The ten park planning areas2, shown in Map 2, are delineated with the use of the following physical barriers:
• Interstate 5 (I‐5); • Major arterials including Steilacoom Boulevard SW, Washington Boulevard SW, portions
of Bridgeport Way SW, Gravelly Lake Drive SW, 100st Street SW and South Tacoma Way; • Creeks such as Chambers Creek, Leech Creek and Clover Creek; and • Lakes such as Lake Steilacoom and American Lake.
In terms of the acreage3 of the park planning areas, a wide spectrum of areas was created ranging from the largest Area 5 of over 2,600 acres to the smallest and isolated Area 9 of less than 300 acres. Generally speaking, the size bears no significance for the purpose of ensuring equitable, safe and convenient access to park and recreation services. The size and the configuration of any park planning area were solely determined by the alignment and the location of the major physical barriers discussed above.
2 Some Park Planning Areas have historic names which were identified long before the City of Lakewood was incorporated. For example, Area 1 is commonly referred to as Oakbrook and Area 9 as Springbrook. However, not all Park Planning Areas have “names’. For the purpose of this Report, they are identified by a number, such as Park Planning Area 1 etc. 3 The area for each Park Planning Area shown in Table 1 is estimated through the use of Geographic Information System prepared by City GIS staff. The area includes both land and water areas within each Park Planning Area.

9
Table 1: Ten Park Planning Areas of Lakewood
PARK PLANNING
AREA
BOUNDARIES AREA (IN ACRES)
1 North: City northern boundary (Chambers Creek) East: Chambers Creek South: Steilacoom Boulevard SW West: City western boundary
1,546.5
2 North: City northern boundary (including Leech Creek) East: South Tacoma Way South: Steilacoom Boulevard SW West: Chambers Creek
1,324.3
3 North: Steilacoom Boulevard SW East: South Tacoma Way South: 100th Street SW West: Bridgeport Way SW
665.4
4 North: City northern boundary East: City eastern boundary (including a portion of I-5) South: City southern boundary (including a portion of 112th Street S) West: I-5, SR 512E and South Tacoma Way
894.2
5 North: Steilacoom Boulevard SW East: Lake Steilacoom South: Gravelly Lake Drive SW and Washington Boulevard SW West: City western boundary
2,606.1
6 North: Steilacoom Boulevard SW East: Bridgeport Way SW and Gravelly Lake Drive SW South: Gravelly Lake Drive SW West: Lake Steilacoom
665.4
7 North: Bridgeport Way SW, 100th Street SW, South Tacoma Way and SR 512E East: I-5 South: Clover Creek West: Gravelly Lake Drive SW
1,270.7
8 North: Washington Boulevard SW and Gravelly Lake Drive SW East: Clover Creek South: I-5 West: Thorne Lane SW and American Lake
2,085.0
9 North and west: I-5 East: City eastern boundary South: McChord Drive SW
282.8
10 North: Thorne Lane SW, American Lake and City boundary near Woodbrook East: City boundary near Woodbrook South: City southern boundary and I-5 West: City south-western boundary (including American Lake)
782.3

10

11
2.4 Demographics
Demographics represent the statistical characteristics of a constantly changing population. They provide a snapshot of the community the Department serves. Knowing the demographic profile will help define needs, potential markets and recreation preferences for park and recreation planning. People of different ages, ethnic backgrounds, income levels and family compositions have diverse lifestyles and demands; thus affecting recreation choice and participation. The Legacy Plan is founded on the premise that a “one‐size‐fit‐all” approach to park design and planning will not be fair and equitable to meet the unique needs of any planning area. In the past, the park profession inclined to value “equal treatment to all” by providing every neighborhood a same set of park facilities and amenities. Often times, the specific needs of individual neighborhoods were overlooked. To help identify the unique needs of those living in each park planning area, this section highlights the demographic characteristics of each area. Future design of park sites and recreation programs can be customized to address the distinctive needs of each neighborhood. Technical Appendix I accompanying this Report contains the demographic profile of each park planning area. Population data are collected from various sources4 provided by US Census Bureau.
4 Since the 2010 census data are not fully available at the time of developing this Report, the 2000 Census information prepared by US Census Bureau is used in this Chapter. It is, however, expected that there has been no significant growth within the past decade. As a matter of fact, the preliminary 2011 data freshly released by the US Census Bureau shows that there is a loss of 48 persons over the decade. Data sets used in this Report are mainly extracted from two Summary Files: • "Summary File 1 (SF1)" is commonly known as the "short form" developed by US Census Bureau to summarize
such data of all persons living in the US as of April 1, 2000 (100% data) as name, sex, race, ethnicity, age, relationship to head of household and own/rent information available at a census block level.
• "Summary File 3 (SF3)" is commonly known as the "long form" developed by US Census Bureau to summarize the sample data distributed to one per six households (thus not 100% accurate) to include all SF1 data plus other socio‐economic and housing data available at a census block group level.

12
2.4.1 Population and Gender
Table 2: Population and Gender
Park Planning Area5
Population Male Female
1
10,024 (100%) 6,710 (49.7%) 6,733 (50.3%)
2
6,684 (100%) 3,237 (48.4%) 3,447 (51.6%)
3
2,064 (100%) 1,001 (48.5%) 1,063 (51.5%)
4
4,317 (100%) 2,106 (48.8%) 2,211 (51.2%)
5
10,339 (100%) 4,957 (47.9%) 5,382 (52.1%)
6
3,541 (100%) 1,694 (47.2%) 1,847 (52.2%)
7
6,913 (100%) 3,392 (49.1%) 3,521 (50.9%)
8
5,574 (100%) 2,723 (48.9%) 2,851 (51.1%)
9
4,272 (100%) 2,199 (51.5%) 2,073 (48.5%)
10
4,754 (100%) 2,329 (49.0%) 2,425 (51.0%)
City Total
58,211 (100%) 28,484 (48.9%) 29,727 (51.1%)
Park Planning Area 5 is the most populated (10,339) among all areas, representing 17% of the City population. Park Planning Area 3 is the least populated (2,064) with only 3.5%. In terms of population density, Park Planning Area 9 is the densest with 15.1 persons per acre, whereas Park Planning Area 8 is the least crowded with only 2.7 persons per acre. The overall ratio of male to female residents is 1 to 1.04. Although there are more female than male residents in Lakewood, it is still in line with the County’s.
5 In order to take into account city boundary adjustments, Technical Appendix I provide demographic data adjustments for Park Planning Areas 1, 2, 4 and 5. City totals are official Census data directly extracted from Summary File 3, therefore they do not represent the sum of individual columns.

13
2.4.2 Age Understanding the age distribution of population for each Park Planning Area will shed light on the kinds of park facilities which residents use the most. For example, play structures for toddlers are appropriate for children under 5, while walking trails interspersed with benches and places to rest are much desired by older adults. Table 3 gives a bird‐eye view of how diverse the park planning areas are in terms of “median age”.
Table 3: Median Age
Park Planning Area Median Age
1 41.8
2 33.3
3 34.0
4 28.6
5 41.6
6 39.3
7 33.6
8 36.8
9 24.8
10 26.2
City of Lakewood
35.0
Residents of Park Planning Areas 1, 5, 6 and 8 are somewhat older than the City as a whole. Among all areas, Park Planning Area 6 has the most mature population with almost 20% of the residents aged 65 and over. Park Planning Area 9 represents the youngest with only 2.5% aged 65 and over. The difference between the two is almost six‐fold.

14
2.4.3 Race The racial and ethnic make‐up of communities indicates the nature of diversity among residents. Three indicators are used to depict racial diversity. They are the ratio between White and African Americans, the percentage of two or more races, and the percentage of persons with a Hispanic or Latino background in any race.
Table 4: Racial Diversity
Park Planning
Area
White to African
American Ratio
% of Two or More Races
% of Persons with a
Hispanic or Latino
Background
% of Spanish Spoken at
Home6
1 6.1 : 1 5.6% 5.6% 1.8%
2 4.8 : 1 6.6% 7.6% 3.9% 3 1.7 : 1 9.4% 8.2 3.2% 4 3.1 : 1 7.3% 13.0% 3.3% 5 7.6 : 1 8.3% 3.7% 2.6% 6 14.9 : 1 5.9% 4.2% 2.5% 7 4.5 : 1 7.8% 11.1% 4.7% 8 9.6 : 1 6.0% 5.9% 3.1% 9 2.9 : 1 11.1% 20.6% 6.2%
10 4.4 : 1 8.1% 11.8% 4.1%
City Total
5.3 : 1 7.0% 8.4% 6.3%
In terms of the ratio between white and African Americans, Park Planning Area 3, followed by Areas 9, 4, 10, 7 and 2 are the most diverse. Park Planning Area 3 is almost three times more diverse than the City average. If diversity is expressed in the form of two or more races, Park Planning Areas 9, 3, 5, 10, 7 and 4 have a higher percentage of racial mix than the City as a whole. If gauged by the percentage of Hispanic/Latino background, Areas 9, 4, 10 and 7 are more diverse than the City. When all of the above indicators are considered, Park Planning Areas 9, 10 and 3 are the three most diverse areas.
6 Only the population aged 25 and over who reported on language spoken is included in this analysis.

15
2.4.4 Households Size and Owner Occupancy Household size often reflects the types of dwellings available in an area. As more apartment units are built in response to smart growth policy direction, the average household size will drop over time. Owner occupancy, median value of homes and median rent are some of the indicators showing the socio‐economic composition of the Park Planning Areas.
Table 5: Household Characteristics
Park Planning
Area
# of Households
Average Household
Size
% of Owner-
Occupied Units
Median Home
Value ($)
Median Rent ($)
1
5,172 2.16 53.9% 150,600 0
2
3,087 2.28 36.9% 154,400 369
3
852 2.40 10.2% 103,100 322
4
3,230 2.25 28.3% 24,550 540
5
3,774 2.54 70.8% 143,400 375
6
1,582 2.25 54.8% 135,300 448
7
2,873 2.39 39.3% 100,200 359
8
2,307 2.42 64.0% 129,900 625
9
1,780 2.40 9.4% 40,550 348
10
1,954 2.44 18.7% 67,800 348
City Total
23,792 2.38 37.5% 147,600 550
Based on the three indicators mentioned above, the City is truly made up of very diverse neighborhoods. In terms of the “median home value”, Park Planning Area 2 has the highest and Area 4 the lowest. As for the “percent of owner‐occupied units”, Area 5 represents the highest whereas Area 9 the lowest. The differences in “home value” and “home‐ownership” between the two extremes of the wide spectrum of park planning areas are more than six and seven times respectively. Obviously, the leisure and recreation needs among the very different neighborhoods are highly distinctive.

16
2.4.5 Education and Income Two other important indicators portraying the socio‐economic composition of an area are education attainment and income levels. Very often, there is a direct correlation between both.
Table 6: Education and Income
Park Planning
Area
% of Population7 with a High-
School Diploma
% of Population8
with a Bachelor’s
Degree
Per Capita Income ($)
Median Household Income ($)
1
24.7% 14.6% 23,818 53,687
2
28.7% 16.8% 21,057 40,795
3
38.9% 9.2% 17,998 29,068
4
38.7% 8.4% 14,320 27,220
5
35.2% 20.3% 23,936 51,400
6
23.4% 22.4% 24,006 49,150
7
37.7% 7.2% 16,449 32,748
8
21.5% 21.5% 35,160 42,994
9
32.7% 2.2% 10,431 21,578
10
36.2% 5.4% 11,815 21,250
City Total
28.5% 13.5% 20,569 36,422
The difference between the highest median household income in Park Planning Area 1 and the lowest in Area 10 is about two‐and‐a‐half times. The amount of discretionary income for recreation and leisure purposes between the two areas would be significantly different. Consideration should be given to provide more free opportunities particularly for children and teens living in low‐income areas such as Park Planning Areas 10, 9, 4, 3 and 7. As for the level of education attainment, Park Planning Area 6 has the highest percentage of population (22.4%) with a college degree, whereas Area 9 has the lowest (2.2%).
7 Only the population aged 25 and over is included in this analysis. 8 Only the population aged 25 and over is included in this analysis.

17
2.4.6 Single‐Parents with Children under 18 Single parenting has become more and more common in today’s transient society. Single parents with children often juggle their busy schedules between work and family obligations, and struggle to find time to do things together with their young children. Program providers should be sensitive to their special needs. Particular attention should be given to ensure services are both financially affordable and conveniently located to serve this emerging type of family.
Table 7: Family Composition
Park Planning Area # of Families % of Families Led by Single Parents with Children
under 18
1
3,355 29.9%
2
1,892 19.6%
3
573 57.9%
4
2,090 41.1%
5
2,667 19.9%
6
929 29.5%
7
1,646 52.0%
8
1,651 29.0%
9
1.021 88.1%
10
1,188 73.4%
City Total
15,202 44.5%
While four park planning areas have an above‐average percentage of families led by single parents with children under 18, Park Planning Areas 9 and 10 have the most alarming rate. Park Planning Area 9, in particular, almost doubles that of the City, with almost nine out of ten families being made up of single parents with children under 18.

18
2.4.7 Poverty Many of the above indicators, such as education, income and single‐parent families, are some of the roots causing poverty9.
Table 8: Poverty Status (1999)
Park Planning
Area
% of Population
Living Below
Poverty Level
% of Population under Age 12 Living
Below Poverty Level
% of Families Living Below
Poverty Level
% of Families
with Children under 18
Living Below
Poverty Level
% of Female- householder Families with
Children under 18
Living Below Poverty Level
1
8.9% 3.0% 6.1% 2.3% 3.1%
2
9.5% 1.5% 4.5% 2.5% 3.8%
3
10.1% 0.4% 5.8% 1.9% 1.0%
4
23.5% 7.3% 20.8% 5.6% 9.2%
5
5.6% 0.9% 3.1% 0.3% 1.8%
6
7.0% 2.3% 6.4% 1.9% 1.5%
7
22.2% 7.1% 18.3% 2.3% 12.5%
8
10.4% 3.1% 8.1% 1.1% 4.9%
9
32.6% 10.2% 32.1% 7.7% 19.7%
10
37.7% 13.0% 34.2% 8.9% 20.6%
City Total
17.3% 5.1% 12.5% 10.7% 7.0%
No matter how one measures “poverty”, whether in terms of the percentage of population or the percentage of families living below the poverty level, both Park Planning Areas 10 and 9 are the poorest areas in the City. About a fifth of families in these two park planning areas are led by female householders with children under 18 years old. 9 There is a wealth of scholarly articles discussing the relationships among education, parenting and poverty. See http://onlinelibrary.wiley.com/doi/10.1111/1467‐8624.00236/abstract; www.thegrio.com/.../single‐mothers‐need‐pathway‐out‐of‐poverty.php; http://bixbycenter.ucsf.edu/publications/files/Latino.pov.pdf; http://www3.uakron.edu/schulze/401/readings/singleparfam.htm.

19
2.4.8 Disability While disability may include many forms, such as sensory, physical, mental, self‐care and go‐outside‐the‐home10 disabilities, it is both a mandate and an obligation for park and recreation providers to accommodate persons with special needs under the Americans with Disabilities Act (ADA). Table 9 shows where people with special needs reside in the City.
Table 9: Disability Status of Civilian Non‐Institutionalized Population
Park Planning Area % of Population Aged 5 – 20
with a Disability
% of Population Aged 21 – 64
with a Disability
% of Population Aged 65 and Over with a Disability
1
7.3% 22.4% 29.3%
2
3.5% 23.6% 36.8%
3
15.2% 22.2% 0%
4
14.3% 30.0% 49.4%
5
8.4% 18.0% 36.3%
6
9.3% 22.1% 48.2%
7
15.2% 33.6% 43.5%
8
15.4% 22.8% 37.4%
9
12.9% 28.2% 58.6%
10
13.7% 27.4% 60.0%
City Total
11.5% 24.7% 37.6%
Park Planning Areas 8, 3, 7, 4, 10 and 9 have relatively high percentage of children and young adults aged between 5 and 20 living with at least one form of disability. Among adults between 21 and 64, those living in Park Planning Areas 7, 4, 9 and 10 have a relatively high percentage with one form of disability. Almost half or more of the mature adults older than 65 living in Park Planning Areas 10, 9, 4 and 6 have, at least, one form of disability. This percentage is expected to increase over time as Lakewood’s population continues to age.
10 “Go‐Outside‐the‐Home” Disability (Census 2000) definition is based on a four‐part question asking whether one has any difficulty in doing certain activities due to a disability condition lasting 6 months or more; or going outside the home alone to shop or visit a doctor's office. (Note: Only asked of persons aged 16 and over).

20
2.5 Population Projections
The Legacy Plan will look into the future and address the recreation needs in the next 20 years. Table 10 depicts how and where Lakewood will likely grow by 2030 and upon full development. Since the City is highly developed, most of the future population growth will occur in areas where residential intensification, in the form of infill and mixed‐use developments, takes place. Two growth scenarios are projected in Table 10, namely a “Travel Demand Model (TDM)” scenario and a “Target Growth” scenario. The former contains projections prepared by Transpo Group in 2009 when developing the Non‐Motorized Transportation Plan. The latter takes into account the growth targets allocated to the City by regional authorities. The detailed definitions of and assumptions behind these scenarios are explained in details in the accompanying Technical Appendix I.
Table 10 Population Projections
Park Planning
Area
2030 Full Development
TDM Scenario
Target Growth
Scenario
TDM Scenario
Target Growth
Scenario 1 8,580 8,861 8,756 9,036
2 7,400 8,350 8,149 9,099 3 2,098 2,402 2,365 2,669 4 4,590 4,599 4,595 4,603 5 11,044 13,231 12,102 14,289 6 2,869 3,328 3,097 3,556 7 7,926 9,306 9,154 10,534 8 6,377 7,526 6,973 8,122
9 4,395 5,158 5,149 5,912 10 6,881 9,246 6,793 9,159
City Total 62,161 72,008 67,132 76,979
The Legacy Plan should address the recreation needs of a target population of 72,000 by 2030.
21
Chapter 3 Emerging Trends Today, our world becomes more and more transient and experiences rapid yet dramatic changes like never before. Therefore, understanding the trends that affect the park and recreation industry is very important as the Department develops a 20‐year Legacy Plan to meet the future recreation needs of the community. An awareness of trends affecting future facility operation and program participation will open doors to new opportunities. This will help us develop priorities for the business operation and better position “parks and recreation” as an essential service to the community. Technical Appendix II, accompanying this Report, contains a thorough discussion of the emerging trends affecting the park and recreation industry and their implications for long‐range planning. Emerging trends can be organized into five major areas:
3.1 Demographic Shift
• Our Nation is aging, and so are the State and the City. The median age of Americans
today is 37 years. By 2030, it is projected to be 39 years. About one‐fifth of the State’s total population will be over 65 by 2030.
• Our households are shrinking. For Lakewood, the number of persons per household will continue to shrink from 2.38 in 2000 to about 2.19 by 2030.
• Our Nation becomes more culturally diverse. By 2020, the Hispanic population will reach 80 million, comprising one in five US residents. English as the language used at home has dropped from 87% in 1990 to 84.3% in 2000. As for Lakewood between 1990 and 2000, the diversity index11 increased almost 2%, with approximately 12% increase in two or more races, 6% in other race alone, 5% in Pacific Islanders alone and 3% in Black/ African Americans alone. During the same period, there was a 5.5% increase in Hispanic population. In 2000, the Hispanic/Latino population made up close to 8.5% of the entire population, compared to only 5.5% in Pierce County.
• There will be more and more persons with special needs. In 2005, almost 22 million of older adults in our Nation had a functional deficit, and 12 million of this group had an activity limitation. This percentage will grow over time as the population ages.12 By 2030, these figures are projected to grow to 38 million and 22 million respectively, assuming both rates of functional and activity limitations remain the same.13
11 The Economic and Social Research Institute (ESRI). “City of Lakewood 1990 and 2000 Comparison Profile (1 Mile Radius Ring)”. 12 According to 2000 Census, 3.2% of our residents were 65 or older. 13 Waidmann, T.K.and Liu, K. (2000). “Disability Trends Among Elderly Persons and Implications for the Future”. The Journals of Gerontology. Series B. Psychological Sciences and Social Sciences. 2000 Sep; Vol 55(5):S298‐307. Washington, DC: The Urban Institute.

22
Lakewood’s disability rate among those aged 21 to 64 is about 4% more than that of Pierce County.
3.2 Personal Behaviors and Life Styles
• Both “Gen X’s14” and “Gen Y’s15” crave fun, fast‐paced and action‐packed experiences;
seek the pursuit of pleasure and the stimulation of the senses. They prefer collective activities, media and technology‐based leisure and extreme sports.
• The high‐tech world has given birth to a generation of sedentary lifestyles. The high‐tech/high‐touch generation shares common leisure activities such as internet surfing, computer and video games, social networking and TV watching. As a result, obesity prevalence for adults increased from 10% in 1990 to 24% in 1996, and was projected to rise to 35% by 2015.
• Situated in the Pacific Northwest, our State has convenient access to scenic mountains, natural wooded areas and great bodies of water. The great outdoors provide opportunities for people both seeking high‐risk challenges and yearning for spiritual quests. Washingtonians mostly engage in activities that are low cost and close to home, therefore, walking and bicycling become the most popular activities statewide.
• The 2000 National Survey on Recreation and the Environment (NSRE) estimated that walking would grow 23% and 34% in the next 10 and 20 years respectively. Blessed with the great outdoors, one can expect even a higher rate in WA. In 2003, the Recreation and Conservation Office forecasted that a significant growth in walking would be expected among older adults aged 50 and above.16 It is likely that the popularity of walking will continue to increase over the next 20 years.
14 “Generation X” is the generation born after the baby‐boom ended, between 1966 and 1976. Technologically speaking, Gen X has witnessed the rise of cable TV, video games and internet. Their political experiences and cultural perspectives were shaped by the end of the cold war, the fall of the Berlin Wall, and a series of US economic calamities such as the 1973 oil crisis, the 1979 energy crisis and the early 1980’s economic recession. 15 “Generation Y”, also known as the Millennial Generation or Generation Next, were born roughly between mid 1970 and 2000. Expression and acceptance are highly important to this generation. They are very familiar with digital technologies, media and communications, including texting, IM, YouTube and Facebook. They often find comfort in on‐line gaming. Their economic outlook has been hard hit by the late 2000’s economic recession. 16 Washington State Recreation and Conservation Office. (2003). Estimates of Future Participation in Outdoor Recreation (Addendum to SCORP). WA: Olympia.
23
3.3 Society and Economy
• Unemployment will remain high in the foreseeable future. The 18‐month long
recession, technically ended in mid‐2009, has many lingering effects. A high single‐digit unemployment rate would likely stick around in our State and Nation for at least another three to five years.
• The gap between those who “have” resources and “have‐not” is getting wider. Over 10% of Lakewood’s households earned less than $10,000 per year, whereas 8.4% earned more than $100,000 annually. In 2000, the median household income for Lakewood was $36,442, compared to $45,204 in Pierce County.
• Population living in poverty is on the rise. According to the US Census Bureau, about one in seven people in the US today lives in poverty. The rise in poverty level is steepest among children with one in five being affected. Many of the students in Lakewood are impacted. As of May 2010, 63.8% of Clover Park School District students qualified for free or reduced‐fee lunches.
• Crime continues to be a concern. Lakewood’s violent crime rate increased 6.2%, from 532 in 2008 to 565 in 2009, at a rate much higher than those of the State and the County. In terms of property crime, Lakewood experienced a decrease of 1.2%, from 3,442 in 2008 to 3,040 in 2009.
• Technology will continue to shape the way we live and do business. In the US, social networking now accounts for 11% of all time spent online. In December 2009, a total of 234 million people aged 13 and older used mobile devices. Twitter processed more than one billion tweets and averaged almost 40 million tweets per day. Over 25% internet page views occurred at one of the top social networking sites, up from 13.8% a year before.17 About 91% of 15‐year old students in our Country in 2003 had access to a computer at home, using them to do homework, play games, network, chat with friends and surf the internet. In 2010, about 84% of households in Lakewood had access to internet at home.
• Nationally, there is an emerging recognition that parks and recreation services play a significant role in improving the quality of life of the City, and that parks and open space are catalysts for both community building and economic development. A series of Parks Forum discussion papers recently released by American Planning Association directly associate well‐maintained parks and greenways with a strong sense of place and community identity, enhanced property values, and business, future homeowner and tourist attractions.
17 <http://venturebeat.com/2010/02/10/54‐of‐us‐internet‐users‐on‐facebook‐27‐on‐myspace/>.

24
3.4 Climate Change and Environment
• There is a renewed awareness and sensitivity to the preservation of our natural
environment. Many cities have developed best practices and strategies to address open space and urban forest preservation, wildlife habitat and natural area restoration, invasive plant management and shoreline/wetland/critical area management.
• Another fast growing trend is the construction of “green” buildings using Leadership in Energy and Environmental Design (LEED)18 certified strategies to improve energy savings, water efficiency, CO2 emission reductions and stewardship of resources. Since the inception of the LEED certification system in 1998, the U.S. Green Building Council has grown to encompass more than 14,000 projects in the United States and 30 countries covering 1.062 billion square feet (99 km²) of development area.19
• There is a recent revolution in the built (man‐made) environment, known as smart growth, to address climate change20 and control urban sprawl which negatively affects energy consumption. Both the American Planning Association and the Environmental Protection Agency recognize that development decisions would affect the lives of future generations. Principles of Smart Growth have been introduced to encourage mixed uses, compact and walkable neighborhoods, a range of housing and transportation choices, open space preservation and public participation.
• Sustainable development has been gaining momentum since late 1980’s in response to the growing awareness of global warming and the need to reduce carbon footprint. To comprehensively address sustainability, there is a trend to introduce a fourth pillar, culture, to the three already‐established ones, social (people), economic (profit) and environmental (planet), commonly known as the “triple bottom‐line” of sustainability. Through the introduction of the cultural aspect, communities become more livable through the recognition of the importance of cultural arts and heritage preservation. More and more cities, including Tacoma, have adopted a “quadruple bottom‐line” to address sustainability. The park and recreation profession has a huge role to play to comprehensively promote the four pillars of sustainability. Parks, open space and recreation services generate a host of community benefits and outcomes in each of the four pillars of sustainability.21
18 LEED (Leadership in Energy and Environmental Design) is a system developed and trademarked by the U.S. Green Building Council to evaluate whether buildings are environmental‐friendly. 19 US Green Building Council. (2008). Green Building By the Numbers. Washington, DC. 20 American Planning Association. ( 2002). Policy Guide on Smart Growth. <http://www.planning.org/policy/guides/> 21 Appendix J displays the range of community benefits in support of the quadruple bottom‐line of sustainability.
25
3.5 Park and Recreation Industry
• How to define level of service within the industry has been evolving rapidly. Instead of addressing “equality” and paying attention to a “one‐size‐fit‐all” approach, a new approach has recently emerged to focus on “fairness and equity” of park provision. The new approach places emphasis on local need assessment studies and community‐led park master planning processes to address accessibility, location, barriers, partners and transportation etc.
• Urban parks are on the rise to address open space and leisure walking needs within the compact built environment. Urban parks are commonly expressed in the form of paved plazas or courtyards adorned with public arts and water features, or linear urban trails with widened boulevard, city streetscapes and bike facilities. Sometimes, these urban parks are interspersed with community gardens to replace lost backyards in high‐density living.
• Lately, there is an increasingly vocal group of play experts (including environmental psychologists, child development specialists, educators and landscape architects) who see creative play as serious work providing time for kids to learn, discover and be creative. They advocate the creation of a play environment open to manipulation. They see the addition of familiar swings and slides as only offering repetitive gross‐motor play activities often isolated from other activities. Instead, they recommend adventure playgrounds made up of “loose parts,” such as water, sand, balls and other manageable materials, for children to work, explore, create and make‐believe.
• Sports have become more specialized providing year‐round competitive opportunities to develop a child from recreation play to a scholarship‐earning level over a longer season at a younger age. Among youths and teens aged 7‐17, there has been an increase in skateboarding (75%), snowboarding (30.3%), tackle football (23.5%), tennis (9.5%), bowling (8.5%) and soccer (4.6%). However, participation has decreased in such sports as in‐line skating (‐60.4%), softball (‐36.1%), fresh water fishing (‐20.2%) skiing (‐28.5%), volleyball (‐18.7%), basketball (‐17.9%), golf (‐17.3%), bicycle riding (‐14.1%), mountain biking (‐13.8%) and baseball (‐12%). Besides a five‐fold growth in soccer over the past two decades, sport trends between 2007 and 200922 concluded that respectable gains in participation were found in court volleyball (up 17.2%), indoor soccer (up 11.8%), rugby (up 11.8%) and beach volleyball (up 7.5%).
• Extreme sports are on the rise in most cities. A 2008 SGMA Report23 showed that among those aged 6 years and older, the most popular extreme sports in the US, listed in a decreasing order of participation, included in‐line skating, skateboarding, mountain biking, snowboarding, paintball, cardio kickboxing, climbing (indoor, boulder), trail
22 SGMA. (2009). Team Sports Participation Affected by Many Outside Factors. 23SGMA (2008). Extreme Sports: An Ever‐Popular Attraction. <http://www.sgma.com/press/2_Extreme‐Sports%3A‐An‐Ever‐Popular‐Attraction>.

26
running, ultimate Frisbee, wakeboarding, mountain/rock climbing, BMX bicycling, roller hockey and boardsailing/windsurfing.
• Community center design has placed more emphasis on the scale of development, the use of Crime Prevention Through Environmental Design (CPTED) principles and the pursuit of LEED certification. Large multi‐purpose centers, usually over 65,000 sq. ft., could help increase cost recovery, promote retention and encourage cross‐use. Besides, indoor centers provide year‐round access to recreation opportunities particularly relevant to Pacific Northwest’s weather condition.
• There is a trend to utilize ecologically sound management practices in park and facility maintenance and operation. This would include recycling programs, reduced use of pesticides, energy‐efficient lighting installations, water conservation and bio‐swale additions in park design to reduce water runoff.
• Forming partnerships and engaging volunteers have become efficient ways of doing business. Today, over 95% of park and recreation agencies have formed some kind of partnerships to extend their reach, increase programming capabilities and expand funding ability. According to a 2009 Recreation Management article, the most common partners include local schools (75.2%), other local government agencies (69.1%), non‐profit organizations (59.8%), state government (43.9%) and private corporations, service clubs or local businesses (38.5%).
• Agencies have begun to find solutions to create and sustain healthy finances. They aggressively pursue alternatives to expand funding sources beyond general fund tax dollars, improve cost‐recovery and explore park facilities as self‐sufficient revenue centers. Some cities or counties have considered the creation of an independent Park District with its own taxing authority to ensure sustainable finances. Two Park Districts, Metro Parks Tacoma and Peninsula Metropolitan Park District, are in the vicinity of Lakewood, and Pierce County has started a discussion around this unique opportunity.
• To be more accountable, transparent, responsive and effective, today more and more cities and their parks and recreation departments are using business models to gain better efficiencies. This would require a paradigm shift towards a business mindset in planning and managing services, with emphasis on core business, best practices, smart operation, performance management and customer service.
Today, the park and recreation industry faces the on‐going challenges of meeting or exceeding the expectations of their diverse and aging population and stiffer competition for tax dollars. In order for the Legacy Plan to position the Department to meet the anticipated needs of the community in the coming two decades, staff should constantly stay on top of the emerging trends affecting the industry, review their strategic directions and adjust operations accordingly.

27
Chapter 4 Park and Open Space Resources
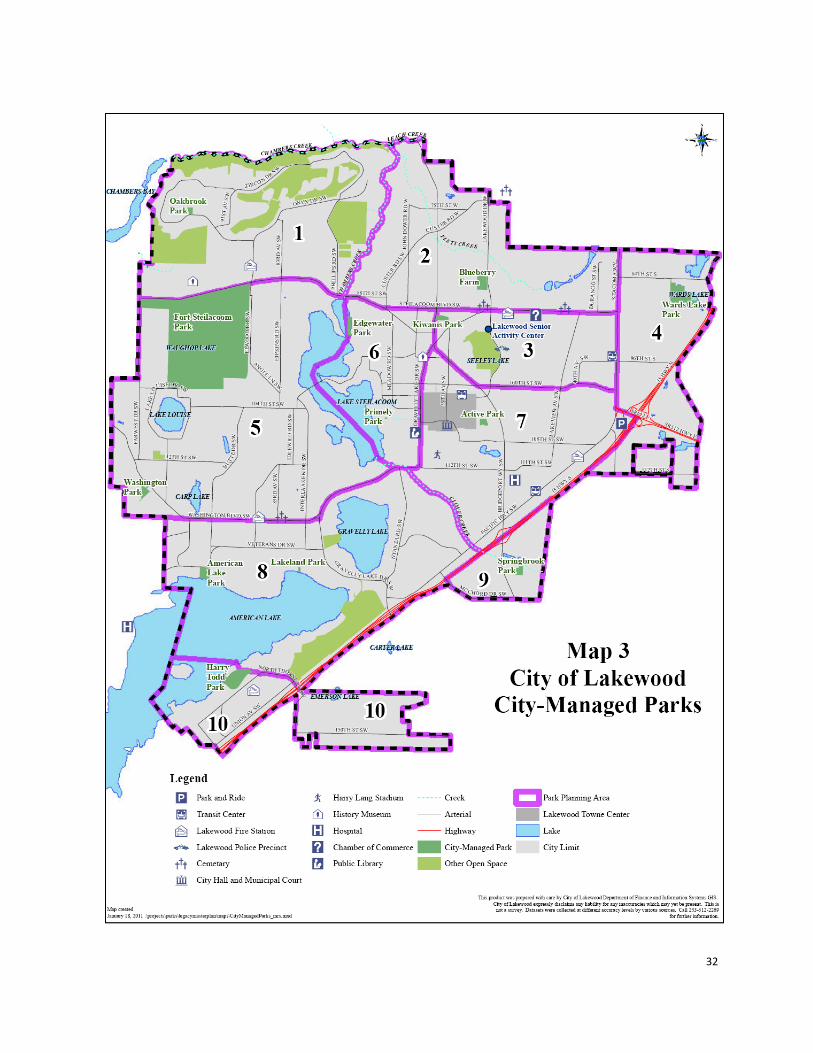
Through the provision of safe, clean and well‐managed parks and open space, the Department supports healthy lifestyles, builds neighborhood identities, contributes to the community’s sense of security and stimulates city‐wide economic development. Currently, the Department manages a total of 13 park sites, totaling about 460 acres. Appendix A and Map 3 respectively show the inventory and the location of all city‐managed parks and facilities. They range from a large Fort Steilacoom Park of over 350 acres, serving visitors from a wide region, to a small Primley Park of less than 0.2 acre, serving a particular local neighborhood. While the majority of the current park assets are developed and well maintained, there are a few undeveloped or minimally maintained areas. Examples include Lakeland Park, Edgewater Park and some portions of developed parks kept in their natural state for residents to relax and enjoy, such as the well‐preserved native oak woodland and meadows in Fort Steilacoom Park and the 20‐acre natural area in Wards Lake Park.
The Department offers 15 play structures in various parts of the City. Among the ten parks managed for high‐impact recreation purposes, each has at least one playground structure to welcome neighborhood users, such as toddlers learning how to navigate a slide. Playground in Fort Steilacoom Park

28
Many smaller parks serving local neighborhoods, such as Active Park, Springbrook Park and Washington Park, have basketball courts for causal play. However, major sport facilities such as baseball and soccer fields are mostly provided in larger parks serving a wider community or the entire City/ region, such as Harry Todd Park and Fort Steilacoom Park. In total, the City offers seven baseball fields, three soccer fields, five basketball courts, one tennis court and two skate parks.
Ballfield and Playground in Washington Park
Sports Field Fort Steilacoom Park
First Lions Skatepark in Kiwanis Park

29
A total of ten picnic shelters are provided in six major parks for community use. Four of them are located in Fort Steilacoom Park and two in Harry Todd Park. Picnic shelter and playground set in Springbrook Park
Fort Steilacoom Park also houses a very popular 22‐acre dog park.
Dog Park in Fort Steilacoom Park

30
Blessed with lake frontages, the City operates three boat launches at American Lake Park, Edgewater Park and Wards Lake Park. Beach access and swim areas are also available at American Lake Park and Harry Todd Park.
Boat Launch in American Lake Park
Swimming beach access in Harry Todd Park
Car top launch near the natural areas in Wards Lake Park
31
Lakewood parks and open spaces offer numerous walking opportunities for residents to stay active. The Department manages a total of over 51,000 feet of gravel paths, 22,300 feet of asphalt pathways and almost 5,000 feet of cement trails. Trails are provided in all types of parks, for both high and low‐impact recreation pursuits. Restrooms in parks are highly desired by the public according to the 2011 Needs Assessment Study. However, their maintenance and operation impacts are excessive. Except Fort Steilacoom Park, which has restrooms open year‐round, all other restrooms in American Lake Park, Harry Todd Park, Kiwanis Park and Wards Lake Park are seasonal. In the 2005 Parks and Recreation Master Plan, a majority of the parks were classified as either regional, community, neighborhood or special use parks. A few new parks were developed after the adoption of the Master Plan and have not yet been classified. In light of the emerging trend, the park and open space classification system should be re‐visited. During the next phase of Legacy Plan development, parks and open space will be re‐defined and a new classification of various kinds of open space may be recommended.
32
33
Chapter 5 Recreation Programming
Programs are recreation activities and services designed to deliver specific outcomes and benefits for individuals and a community as a whole. The City offers a wide variety of recreation programs and life‐long learning opportunities for all residents in the community. Programs currently offered by the Department comprise a variety of program areas, service areas, types and formats.
5.1 Program Areas
The recreation programs and learning opportunities which the Department currently offers embrace five major program areas covering active living and wellness, arts and culture, nature and environment, personal enrichment and community building.
• Active Living and Wellness – Provide opportunities to promote health and wellness and engage individuals, families or groups of individuals in active lifestyles. Active living is one of the very best methods to ensure that everyone in the community stays active and healthy. It often benefits the individual’s physical and mental health. Current program examples include team sports, fitness and wellness classes for all ages, individual sports for youths and adults, sports camps and playground programs in the summer.
• Arts and Culture – Provide opportunities for individuals, families or groups of individuals to appreciate the wealth of arts and culture, preserve City’s history, and encourage people to explore arts as a leisure pursuit to enrich their lives. Experiential and creative arts programs allow for personal and cultural expression and exploration. Current program examples include arts classes for all ages, art camps and special events and performances such as Brightest Star, Summer Concert and Father/Daughter Dance.
• Nature and Environment – Provide opportunities for individuals, families or groups of individuals to appreciate the great outdoors through outdoor recreation and environmental education. Natural and environmental leisure activities bestow a sense of respect for Mother Nature, improve awareness and knowledge of environmental issues, and instill stewardship and conservation values so nowadays needed to combat climate change. Current program examples include hiking programs, nature day camps and special events such as Kids Fishing Event.
• Personal Enrichment – Provide opportunities for individuals to learn new skills and enrich their lives at any stage of their lifecycle. The provision of enrichment programs would, in turn, create a learning legacy for the community. Current program examples include life‐long learning classes, day camps for preschoolers, after‐school programs for teens, and trips and tours for older adults.

34
• Community Building – Provide opportunities to bring the community together by
participating in a wide variety of events, activities and volunteer opportunities. Community building programs not only provide affordable recreation options for the whole family to enjoy, celebrate and do things together, but also create tradition and build a sense of pride, ownership and identity in the community. Under this program area, the Department successfully offers one annual city‐wide signature event, SummerFEST, attracting regional visitors; and a number of well‐attended special events, such as the Christmas Tree Lighting Festival and Truck and Tractor Day. Lakewood’s Senior Activity Center offers many monthly and seasonal events, including Grandparent’s Day, Halloween and St. Patrick’s Day. In addition, the Department provides volunteering opportunities for the public to participate in and give back to the community, such as Parks Appreciation Day and Make a Difference Day.
5.2 Program Types
To suit different lifestyles and preferences, it’s important to provide recreation and life‐long learning programs with a wide span of formats, ranging from pre‐registered/structured to drop‐in/self‐initiated. The programs and classes offered by the Department mostly require pre‐registration; whereas events and summer playground programs welcome community members to drop‐in and participate as they wish. The following table outlines detailed programs currently offered by both program area and program type. Table 11: Current Program Classification by Program Area and Type
PROGRAM TYPE
PROGRAM AREA
Active Living/ Wellness
Arts & Culture
Nature & Environment
Personal Enrichment
Community Building
Teams
• Team sports/ leagues for youths/ teens
NA NA NA NA
Classes/ Programs
• Sports programs for youths and adults
• Fitness/ Wellness classes for preschoolers and older adults
• Day camps
• Art classes for youths/ teens and older adults
• Day camps
• Outdoor programs
• Day camps
• Life-long learning classes for preschoolers, youths/ teens and older adults
• Day camps for pre-schoolers, youths/ teens
• Tours & trips for older adults
NA

35
PROGRAM TYPE
PROGRAM AREA
Active Living/ Wellness
Arts & Culture
Nature & Environment
Personal Enrichment
Community Building
Drop-in Programs
• Playground Program
• Late Nite
NA NA NA NA
Signature Events
NA NA NA NA • SummerFEST
Special Events
NA • Brightest Star
• Summer Concerts
• Father/ Daughter Dance
• Kids Fishing Event
NA • Christmas Tree Lighting
• Truck & Tractor Day
• Parks Appreciation Day
• Make a Difference Day
• Senior Activity Center seasonal events
5.3 Program Evaluation
To help evaluate the performance of the recreation programs currently offered by the Department, the programming staff has compiled data and statistics of all programs offered within a 12‐month assessment period from the Fall of 2009 to the Summer of 2010. This Report provides a summary of program evaluation based on the program and activity offerings, service area and place of residence, customer profile, participation rate, program usage, program capacity and direct cost recovery. For program evaluation purposes, it is crucial to find out how current program users feel about the quality of the program after their participation. Unfortunately at this juncture, the Department has not regularly tracked customer satisfaction through post‐participation surveys. Therefore, the program evaluation discussion in this Report does not include such performance indicators as the level of customer satisfaction and the quality of programs as perceived by participants.

36
5.3.1 Program and Activity Offerings During the 12‐month assessment period, the Department offered close to 520 activities, totaling 2,563 hours of services. These activities ranged from a one‐day event to a series of classes offered year‐round. Table 12 shows that there was a good mix of structured (437 activities offered with a total of 2,320 hours) and non‐structured programs (83 activities offered with a total of 243 hours). In terms of fee structure, the activities offered ranged from a “free experience” to an average of $43 per class per session. Personal enrichment classes had the highest fees of close to $80 per class per session, while youth arts and culture classes represented the lowest fee of less than $20 per class per session. However, the majority of classes offering a wide‐range of active living, arts and culture and nature and environment experiences were very affordable, mostly within the $20‐$40 price range. According to the 2011 Needs Assessment, 64% of respondents were willing to pay user‐fees for services. Based on the previous demographic profile discussions, the need for scholarship funds to encourage participation of lower‐income families should not be overlooked. Table 12: Activities and Fees by Program Area
Program Area and Type # of Activities
Offered
# of Hours Offered
Average Fee per Activity
Active Living: Team Sports
126 176 $50
Active Living: Classes/Programs
126 506 $29
Active Living: Drop-in Programs
45 135 $0
Arts and Culture: Classes/Programs
46 651 $35
Arts and Culture: Special Events
8 16 $10
Nature and Environment: Classes/Programs
18 80 $22
Nature and Environment: Special Events
1 7 $10
Personal Enrichment: Classes/Programs
121 907 $78
Community Building: Special Events
28 73 $0
Community Building: Signature Event (SummerFEST)
1 12 $78
Program/ Activity Total
520 2,563 NA

37
5.3.2 Service Area and Place of Residence While almost all recreation programs intend to serve the community as a whole, there were two programs that specifically targeted neighborhoods in need and a few others that served customers from throughout the region. The two neighborhood programs the Department offered included a summer playground program held in Springbrook Park and the Late Nite program at Woodbook Middle School. Most of the events attracted regional visitors. Almost 50% and 40% of the visitors respectively attending SummerFEST and other special events (such as Truck and Tractor Day) came from other cities in the region. On average, close to three‐quarters of the programs were attended by Lakewood residents. Depending on the waiting list and program usage, the Department has an opportunity to introduce a “non‐resident fee” for those living in other cities regularly attending classes. Based on the 2011 Needs Assessment Study, over half of the respondents agreed that non‐residents should pay a higher fee. However, the pros and cons should be fully examined before introducing a differential fee policy.
Table 13: Percentage of Lakewood Participants by Program Area
Program Area and Type
Percentage of City Participants
Active Living: Team Sports
76.8%
Active Living: Classes/Programs
74.7%
Active Living: Drop-in Programs
81.5%
Arts and Culture: Classes/Programs
57.7%
Arts and Culture: Special Events
79.5%
Nature and Environment: Classes/Programs
91.1%
Nature and Environment: Special Events
74.8%
Personal Enrichment: Classes/Programs
76.3%
Community Building: Special Events
62.2%
Community Building: Signature Event (SummerFEST)
49.2%
Average Percentage
72.4%

38
5.3.3 Customer Profile Customers recorded by the Department are unduplicated participants attending classes/ programs or events. The Department keeps track of the age and the gender of the customers who pre‐register for classes.
Table 14: Customer Profile During the 12‐month assessment period, the Department had served a total of 16,826 customers and visitors. Amongst them, close to 3,000 attended classes requiring pre‐registration. Approximately 55% (1,600) of the registered customers were female and 45% (1,306) male. While the average age of all registered customers was 32.4, the majority of the population segments the Department served were either children/teens or older adults. Currently, there is a lack of structured classes or programs marketed for young adults.
Program Area and Type # of Customers
# of Male Customers
# of Female Customers
Average Age of Customers
Active Living: Team Sports
357 251 106 8.5
Active Living: Classes/Programs
714 315 399 29.3
Active Living: Drop-in Programs
118 76 42 11.9
Arts and Culture: Classes/Programs
215 71 141 49.3
Arts and Culture: Special Events
260 134 126 50.6
Nature and Environment: Classes/Programs
31 4 27 40
Nature and Environment: Special Events
304 195 110 8
Personal Enrichment: Classes/Programs
909 260 649 61.3
Community Building: Special Events
1,917 NA NA NA
Community Building: Signature Event (SummerFEST)
12,000 NA NA NA
All Programs
16,826 1,306 1,600 32.4

39
5.3.4 Program Participation Defined as “the number of (unduplicated) participants” times “the number of activity hours held”, the indicator of participant‐hours is commonly used to gauge how well recreation programs are attended.
Table 15: Program Participation
Program Area and Type # of Unduplicated Participants
# of Activity Hours
# of Participant-Hours
Active Living: Team Sports
357 176 62,832
Active Living: Classes/Programs
714 506 361,284
Active Living: Drop-in Programs
118 135 15,930
Arts and Culture: Classes/Programs
215 651 139,965
Arts and Culture: Special Events
260 16 4,160
Nature and Environment: Classes/Programs
31 80 2,480
Nature and Environment: Special Events
304 7 2,128
Personal Enrichment: Classes/Programs
909 907 824,463
Community Building: Special Events
1,917 73 139,941
Community Building: Signature Event (SummerFEST)
12,000 12 144,000
Program Total
16,826 2,563 1,697,183
With only a recreation staff force of 3.75 Full‐Time Equivalents, the Department has offered a phenomenal 1.7 million participant‐hours within the 12‐month assessment period. This number demonstrates that the programs Department offered are not only well attended, but also efficiently operated.
40
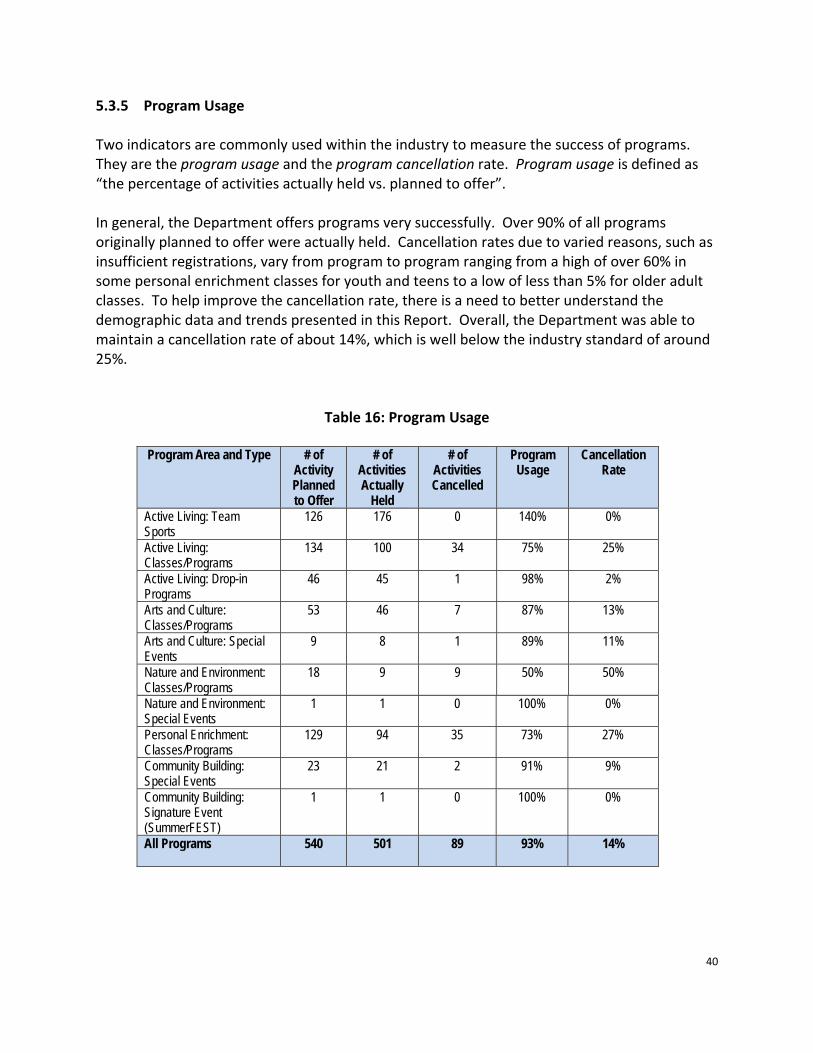
5.3.5 Program Usage Two indicators are commonly used within the industry to measure the success of programs. They are the program usage and the program cancellation rate. Program usage is defined as “the percentage of activities actually held vs. planned to offer”. In general, the Department offers programs very successfully. Over 90% of all programs originally planned to offer were actually held. Cancellation rates due to varied reasons, such as insufficient registrations, vary from program to program ranging from a high of over 60% in some personal enrichment classes for youth and teens to a low of less than 5% for older adult classes. To help improve the cancellation rate, there is a need to better understand the demographic data and trends presented in this Report. Overall, the Department was able to maintain a cancellation rate of about 14%, which is well below the industry standard of around 25%.
Table 16: Program Usage
Program Area and Type # of Activity Planned to Offer
# of Activities Actually
Held
# of Activities Cancelled
Program Usage
Cancellation Rate
Active Living: Team Sports
126 176 0 140% 0%
Active Living: Classes/Programs
134 100 34 75% 25%
Active Living: Drop-in Programs
46 45 1 98% 2%
Arts and Culture: Classes/Programs
53 46 7 87% 13%
Arts and Culture: Special Events
9 8 1 89% 11%
Nature and Environment: Classes/Programs
18 9 9 50% 50%
Nature and Environment: Special Events
1 1 0 100% 0%
Personal Enrichment: Classes/Programs
129 94 35 73% 27%
Community Building: Special Events
23 21 2 91% 9%
Community Building: Signature Event (SummerFEST)
1 1 0 100% 0%
All Programs
540 501 89 93% 14%

41
It appears that the Department has the potential to expand a few more activities for programs which exceed the current usage rate of 100%. Besides events, the most in‐demand program is “Team Sports”. Recreation staff should, however, be sensitive to the ever‐changing sports trends when additional team sports are proposed. There are three program areas currently maintaining a waiting list. In the 12‐month assessment period, 30 persons were on the wait list for Personal Enrichment classes; six for Arts and Culture classes and another six for Active Living classes and programs. Very often, the wait list reflects that some of the programs might have been running at their full capacity, which is determined by not only the capacity of the room or programming space, but also the availability of equipment and the ability of the instructor to provide quality instruction or supervision.

42
5.3.6 Direct Cost Recovery With the scaling back of municipal budgets, many parks and recreation agencies are asked to improve the cost recovery for certain types of programs. To help assess the current rate of cost recovery, this Report takes only into account the direct costs of service delivery when service cost is calculated. Direct cost is defined as “costs directly related to the delivery of a program, such as those associated with the instructor/staff time leading the class, supplies, commodities, fuel, admissions, rentals and professional services including referees or event performers”. Table 17 arrays all programs in a descending order of cost recovery. Programs recovered at a rate of 100% or more without any tax subsidy include preschooler health and fitness classes, youth sports classes and team sports, youth arts and culture classes and youth enrichment classes. Special events usually require full tax subsidy, with the exception of two, i.e. Father and Daughter Dance and Kids Fishing Event, which had a very high cost recovery due to private sponsorships.
Table 17: Direct Cost Recovery
PROGRAM AREA
Active Living & Wellness
Arts & Culture
Nature & Environment
Personal Enrichment
Community Building
Programs Requiring No Tax Subsidy Preschoolers Health and Fitness Classes/ Programs 207% Youth Sports Classes / Programs 143% Youth Sports Leagues 140% Arts and Culture Youth Classes/ Programs 128% Father and Daughter Dance 115% Kids Fishing Event 103% Youth Enrichment Classes 103%

43
PROGRAM AREA
Active Living/ Wellness
Arts & Culture
Nature & Environment
Personal Enrichment
Community Building
Programs Requiring Less than 50% Tax Subsidy Springbrook Playground Program 86% Kinder Camps 82% SummerFEST 81% Preschool Enrichment Classes 80% Youth Camps 73% Older Adult Arts and Culture Classes/ Programs 67% Truck and Tractor Day 54% Older Adult Enrichment Classes 54% Programs Requiring More than 50% Tax Subsidy Older Adult Health and Fitness Classes/ Programs 40% Outdoor Programs 39% Older Adult Trips & Tours 23% Lakewood's Brightest Star 14% Senior Activity Center Seasonal Events 3% Programs Requiring Full Tax Subsidy Make a Difference Day 0% Parks Appreciation Day 0% Christmas Tree Lighting Ceremony 0% Woodbrook Late Nite 0% Summer Concert Series 0%
Currently, the above cost recovery findings do not necessarily reflect any established pricing philosophy to ensure affordable and equitable offerings. There is an opportunity for the Legacy Plan to define community benefits and identify core businesses driven by the Department’s mission. The Legacy Plan should recommend a pricing pyramid to equitably guide future cost recovery targets.

44
Chapter 6 Partners and Alternative Providers
In response to shrinking funding resources and the public outcry for accountability and stewardship, partnerships are widely used by government agencies across the Nation to maximize resources for the benefit of the community. A partnership is a cooperative venture between two or more parties with a common goal to improve the efficiencies in completing a mutually‐beneficial project by combining or complementing each other’s resources. When parties work in partnership, they jointly use their resources (money and personnel), assets (facilities and equipment) or influence to help achieve commonly‐agreed goals. Currently, the Department has collaborated with close to one hundred partners, including public, private and non‐profit agencies. Appendix B contains a profile of all partners currently collaborating with the Department to help manage or develop park resources, plan programs and events, deliver activities, market programs or share the use of facilities or program space. For park development and management, the Department has successfully partnered with public agencies including the County and the State to operate Fort Steilacoom Park and the Clover Park School District to develop a neighborhood‐school park at Lake Louise Elementary School. On the programming side, the Department has partnered with various types of agencies including: (a) public partners such as the School District, Pierce College and the County for joint planning, programming and shared use of programming space; (b) close to 40 non‐profit and local interest groups such as Puget Sound Anglers, Clover Park Kiwanis Club, Lakewood First Lions, Clover Park and Lakewood Rotary Clubs, Army Strong, Lakewood Historical Society, Lakewood’s Promise and Ninos Heroes Soccer League for joint programming and marketing; and (c) over 30 private organizations including Cabelas, Harold LeMay Enterprises Inc., Lakewold Gardens and UK International Soccer for sponsorship of events and joint marketing purposes. Different types of partners often have different forms of partnership agreement governing how relationships are to be managed. These collaborations may take many forms ranging from informal “handshake” understandings to formal written agreements, such as Inter‐local Agreements. While most of the Department’s partnerships are informal, the Department has Inter‐local Agreements with Pierce County to rent space at the Lakewood Community Center and to maintain Fort Steilacoom Park. Volunteers are crucial partners. They have made a huge contribution to the Department’s operation in areas such as dog park monitoring, senior ambassadors, invasive plant removal and park maintenance etc. Last year, the Department received close to 5,740 hours of volunteer help including contributions from various Commissioners and Board Members. Another important resource that supports annual basic park maintenance is the City’s Work Crew program. Created as an alternative sentencing program in the municipal court system to reduce jail housing costs, the work crew offenders perform community service hours in lieu of

45
jail time and fines. Although the number of participants varies from week to week and season to season, we anticipate approximately 5,000 hours each year in park maintenance support. Work crew participants regularly support daily park rounds (litter and garbage removal, basic vandalism repairs and graffiti removal, parking lot clean up, weeding, and raking chips in the playgrounds) and provide seasonal clean up and special project support. In monetary terms, together the pool of volunteers and the work crew participants have brought in approximately $150,00024 to the operation of the Department. Building a pool of committed volunteers will inspire future volunteers, market services, brand the department’s image and champion future funding. Alternative providers may, sometimes, be partners. Primarily, they are community resources within Lakewood providing complementary recreation and leisure activities/services for local residents (Map 4). Schools and colleges are one of the major alternative providers. Many schools and colleges provide public open space, walking trails and playground facilities serving nearby neighborhoods. Educational institutions also provide a wide range of life‐long learning and recreation services to the community. Two major nation‐wide non‐profit agencies providing active living, arts and nature programs in Lakewood are the YMCA and the Boys and Girls Club. Appendix C gives some examples of major alternative providers currently serving the Lakewood community. As a good steward of public resources, the Department should nurture relationships with other agencies to explore potential partnerships, improve coordination with other providers and cultivate a spirit of volunteerism. Further, the Department should continuously look for opportunities to develop partnerships in order to expand or improve park and recreation services to the community. There is an opportunity for the Legacy Plan to craft principles guiding the development of a partnership policy. The policy should address the different types (formal and informal) of partnership agreements, mutually‐agreed‐upon priorities, costs and benefits, and management procedures.
24This is based on RCO’s rate of donated unskilled labor of $14 per hour effective January 2011.

46

47
Chapter 7 Community Aspirations
To ensure that the Legacy Plan is founded on a true understanding of the aspirations of the community, a city‐wide needs assessment was developed to solicit demands, preferences, feedback and opinions about parks and recreation services from the general public. A statistically‐valid survey was conducted in November 2010 by Management Learning Laboratories. A total of 6,000 households were randomly selected for the survey, and 421 usable responses were returned. The Needs Assessment Study25 is accompanied as Technical Appendix III to this Report.
7.1 Participation, Barriers and Communication
Several trends in participation and preferences on communication emerged from the Needs Assessment Study:
• The most frequently visited park was Fort Steilacoom Park, with almost 80% of respondents visiting that facility at least once in the past 12 months. Trailing this regional park was American Lake Park (60%). The most well‐used neighborhood park was Active Park, but only a third of the respondents had visited it.
• Major recreation pursuits included outdoor fitness activities, such as walking and jogging. Among all respondents, 77% participated in outdoor fitness at least once per year, and 52% attended community special events. Other recreation activities, such as arts programs and youth and adult sports, were sparsely participated.
• With the Joint Base Lewis McChord being City’s immediate neighbor to the south, many military families who reside off‐base choose to call Lakewood home. It is estimated that Lakewood has a current military population of about 7,200. Of those families surveyed with at least one member serving in the military, about two‐thirds used the recreation facilities and programs within the Base, half visited facilities and programs in neighboring cities and 40% held memberships in private health clubs and gyms.
• Aside from the lack of time for recreation pursuits, major barriers to participation included a disinterest in the opportunities provided; a lack of information; insufficient restrooms and trails, and better facilities existing elsewhere. Perceptions of safety and cost also appeared to be barriers. About half of the population aged 45‐54 and about 40% over 70 years of age expressed the most disinterest in the Department’s programs and facilities. It appears to display a direct correlation between income level and the expression of disinterest. About 40% of those aged 25‐44 perceived the lack of information as a barrier to participation.
• The most preferred method to receive information continued to be the traditional direct mailing out of printed brochure to households (74%). Other effective means of
25 Management Learning Laboratories. (2011). City of Lakewood Recreation Needs Assessment. NC: Wake Forest University/MLL.

48
communication included newspaper (46%) and signs in parks (38%). Electronic and digital media received endorsements from nearly a third of the respondents. These media included direct emails (35%) and city website (31%), which respondents ranked slightly higher than flyers. The Department should consider reaching out more to those aged 25‐44, the Generations X and Y, via digital means of communication.
7.2 Future Needs
One of the main purposes of the survey was to identify needs for future planning. The findings below reflect areas of genuine need ranked in a descending order by those respondents who would both “use the programs/ facilities in the next 24 months” and at, the same time, “considered them important for the community at large”:
• On the park and facility side, the top five rankings were: o Multi‐use trials and sidewalks o Restrooms in parks o Neighborhood parks o Dog parks o Playgrounds and picnic shelters
The two top facility needs identified above would mostly be desired by residents aged between 25 and 54 (ranging from 32% to 39% within their own age groups). Restrooms, in particular, would be needed to serve the older adults aged between 65 and 69 (over 40%). In terms of ethnicity, Asians (50%) appeared to appreciate trails more. As for neighborhood parks, those aged 25‐34 would need the most (close to 38% within this age group), followed by those aged 35‐54 (about 32%) and 18‐24 (almost 29%). More than three‐quarters of Caucasians would welcome a park close to their homes.
• Regarding recreation programs, the top five rankings were:
o Outdoor concerts/ movies o Festivals/ special events o Family recreation o Fitness classes o Outdoor recreation and fishing
Outdoor concerts and movies would mostly be preferred among 45‐54 (34% within this age group), followed by age groups 18‐24 (29%) and 35‐44 (24%). Almost 27% of Hispanics would attend outdoor concerts/ movies, followed by both Caucasians and Asians (around 20% each). Close to 30% aged 35‐54, 29% Asians and 23% Caucasians would welcome special events and festivals for the family to enjoy.

49
7.3 Level of Service Opinions
The survey also sought opinions about the Department’s level of services. Some of the findings can serve as baseline data to benchmark with other cities of similar sizes participating in the International City/ County Management Association’s Center for Performance Measurement.
• The Department did great in satisfying the needs of the residents. Almost 80% stated that the parks, facilities and programs they visited satisfied their needs. Among all respondents, 83% felt that the Department provided an essential service to the City; 76% indicated the work of the Department added to the quality of life in Lakewood; and 63% was satisfied with the quality of parks and recreation programs offered by the Department.
• In general, there was a very positive perception about park provision in Lakewood. A large majority of 85% felt that parks and facilities were conveniently located; implying the current park level of service (the half‐mile service radius) very reasonable and acceptable. Less than 70% was satisfied with the quantity (number) of parks and facilities in the community.
• Over 80% was satisfied with the quality (condition and appearance) of parks and facilities. The current level of maintenance should continue at its current level.
• When respondents were asked to give an opinion on their recreation preferences, nearly all (93%) indicated that preservation and conservation of open space was important. About 70% preferred neighborhood parks over a large centralized park for convenient access.
• Over 60% of respondents were satisfied with the levels of safety of parks and facilities. To address safety issues, 65% supported adding lights and 57% wanted more police presence.
• On the programming side, 60% felt that the Department was an important provider of recreation for the whole family. About 58% felt that the variety and the range of programs offered were good. Half of the respondents thought recreation opportunities were fairly provided across the community. The directions respondents offered to the Department included more partnership with schools (86%) and more activities for the entire family to participate together (48%).
• There is room for the Department to improve its communication with residents. Among all respondents, 45% felt that the Department was responsive to community recreation needs; and only 34% found that communication with the Department was easy. While 62% felt that the brochure was simple to understand and 54% considered program advertised was good, only 40% felt that registration for programs was easy.

50
Chapter 8 Management and Finance
8.1 Organization and Administration
The Parks and Recreation Department was first established within the City in 2003. In 2010, the Human Services Division of the City Clerks Department transitioned into the Department to form the Parks, Recreation and Community Services Department. The new Department operates under the direction of the Assistant City Manager/ Development who also oversees the Departments of Community Development, Public Works and Economic Development.

51
Under the direction of the Parks, Recreation and Community Services Director, the Department is made up of six Divisions: Parks, Fort Steilacoom Park, Recreation, Senior Services, Human Services and Administration.

52
Led by the Parks Maintenance Manager with a total of six Full‐Time Equivalents (FTEs) and seasonal staff, the Parks Division is responsible for both routine maintenance of parks, such as turf care, litter control, irrigation repairs, ballfield maintenance and preventive maintenance. The Division also supports special events, oversees vandalism repairs and volunteer support projects. Under the arrangement of an Inter‐local Agreement with Pierce County, the Fort Steilacoom Park Division takes care of the on‐going maintenance and operation of the community jewel, relying on the additional support of a 0.5 FTE administrative staff. The functions of the Recreation Division are primarily shared between two full‐time Recreation Coordinators, one 0.75 FTE Office Assistant and seasonal programming support. The Division provides a wide range of sports, fitness, outdoor and environmental recreation, arts classes, special events and other offerings to various age groups. Operating within the Lakewood Senior Activity Center, the Senior Services Division is managed by one full‐time Recreation Coordinator and supported by another 0.75 FTE Office Assistant and seasonal staff. Staffed by one FTE and additional support staff, the Human Services Division works to ensure Lakewood’s citizens have access to the resources they need in order to improve their quality of life. The City provides funding to local agencies to ensure basic needs are met as well as access to resources that enhance opportunities for success in life. With 1.5 FTEs, the Administration Division provides leadership, supervison and administrative support to the Department, Parks and Recreation Advisory Board, Arts Commission, emergency management and customer services. Prior to the new Parks, Recreation and Community Services Department, there had been a slight increase of FTEs from 10 to 12.95 between 2005 and 2009. While the number of FTEs appeared to increase to 13.1 in 2010 with the transitioning of Human Services to the Department; overall, the Department has lost one FTE and several seasonal positions in the Parks Division and Fort Steilacoom Park Division due to budget shortfalls.
Table 18
Staffing Levels Year
Total FTEs
2006
10.50
2007
12.95
2008
12.95
2009
12.95
2010
13.10
2011
12.75

53
8.2 Budget Appropriation
Similar to other public agencies so severely impacted by the dwindling tax revenues since the recession started in late 2007, the City and the Department have made efforts to streamline services and be more efficient. Since 2006, after the adoption of the Parks and Recreation Master Plan, the Department’s appropriation averaged about 4.9% of the total City’s operating General Fund.26 While the recession has somewhat affected the Department in 2009, there have been some slight increases in the last two General Fund appropriations due to the transfer of a new Division. Overall, this percentage falls in line with those of other cities of similar size. Currently, the City spends approximately $36 per capita on park and recreation services27.
Table 19 City and Department Appropriations—General Fund
Year City Appropriation
($) Department
Appropriation ($)
Percent of City Total
2006
35,414,930 1,735,500 4.9%
2007
35,731,080 1,522,710 4.3%
2008
38,152,330 1,801,080 4.7%
2009
39,124,991 1,551,584 4.0%
2010
36,738,871 2,093,300 5.7%
2011
38,175,130 2,083,230 5.5%
26 Both the City’s and the Department’s appropriations in the General Fund Budgets excludes capital outlays and debt services. 27 Penn State researchers, Geof Godbey, Professor Emeritus of Leisure Studies, and Andrew Mowen, Associate Professor of Recreation and Parks Management, said in February 2011 that “the payoff for investing in public parks and recreation sites may be healthier, more physically‐fit residents and a less strained healthcare system. There is a strong relationship between how much money is spent to provide such services and the amount of physical activity that people take part in.” In a study prepared for the National Recreation and Park Association, they concluded that “spending an extra 10 dollars per person on park and recreational facilities provided more vigorous exercise for girls and better strength‐building for both sexes”.

54
8.3 Revenue and Expenditure
Over the past five years, the Department has made efforts to contain expenditures in spite of inflation. Overall, the Parks Division remains the major cost‐center. There has been a gradual rise in the recreation expenditures as the Department progressively increased its edge in providing program offerings to the community.
Table 20 Expenditure by Division
Division
Year
2006
2007
2008
2009
2010
Parks
491,241.65
464,846.81
491,784.63
464,275.19
438,757.83
Fort Steilacoom
Park
343,628.87
386,025.81
393,308.98
374,876.39
390,420.65
Recreation
430,266.59
476,526.72
504,287.42
523,518.70
511,404.22
Senior
Services
144,333.55
177,434.11
181,189.59
207,277.45
201,263.88
Human Services
NA
NA
NA
NA
512,573.03
Administration
140,587.20
169,836.38
195,999.01
206,631.91
205,359.32
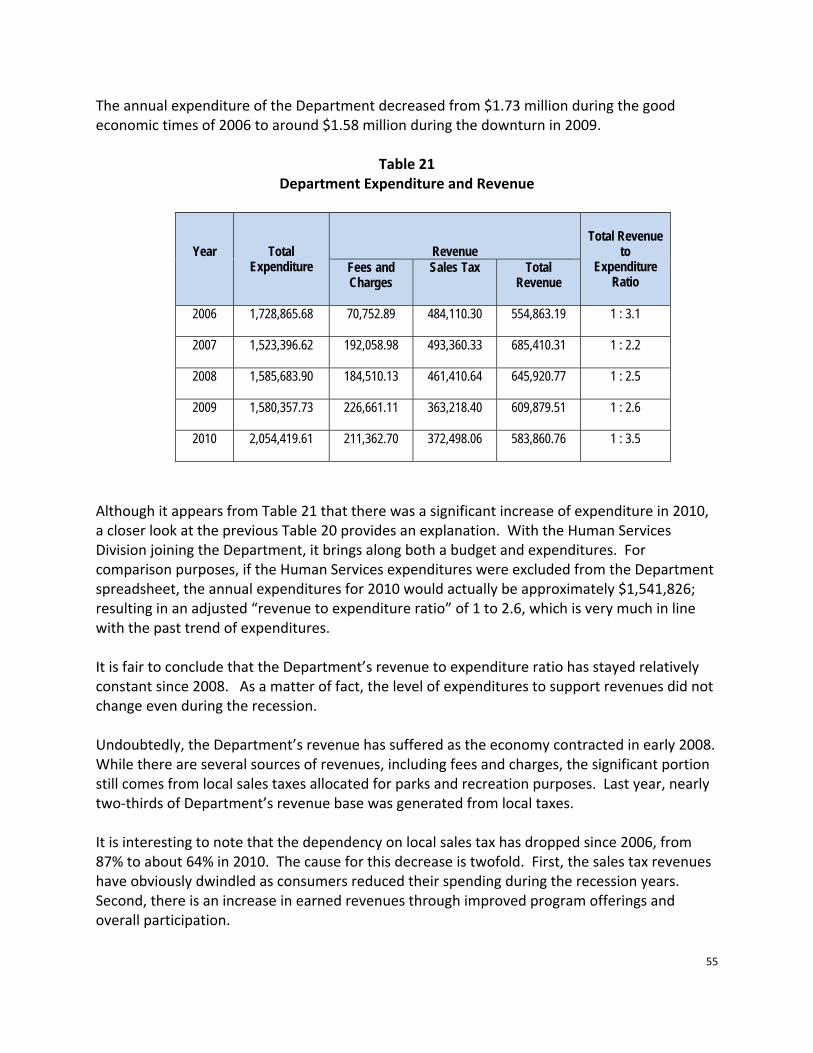
55
The annual expenditure of the Department decreased from $1.73 million during the good economic times of 2006 to around $1.58 million during the downturn in 2009.
Table 21
Department Expenditure and Revenue
Year
Total Expenditure
Revenue
Total Revenue
to Expenditure
Ratio Fees and Charges
Sales Tax Total Revenue
2006
1,728,865.68 70,752.89 484,110.30 554,863.19 1 : 3.1
2007
1,523,396.62 192,058.98 493,360.33 685,410.31 1 : 2.2
2008
1,585,683.90 184,510.13 461,410.64 645,920.77 1 : 2.5
2009
1,580,357.73 226,661.11 363,218.40 609,879.51 1 : 2.6
2010
2,054,419.61 211,362.70 372,498.06 583,860.76 1 : 3.5
Although it appears from Table 21 that there was a significant increase of expenditure in 2010, a closer look at the previous Table 20 provides an explanation. With the Human Services Division joining the Department, it brings along both a budget and expenditures. For comparison purposes, if the Human Services expenditures were excluded from the Department spreadsheet, the annual expenditures for 2010 would actually be approximately $1,541,826; resulting in an adjusted “revenue to expenditure ratio” of 1 to 2.6, which is very much in line with the past trend of expenditures. It is fair to conclude that the Department’s revenue to expenditure ratio has stayed relatively constant since 2008. As a matter of fact, the level of expenditures to support revenues did not change even during the recession. Undoubtedly, the Department’s revenue has suffered as the economy contracted in early 2008. While there are several sources of revenues, including fees and charges, the significant portion still comes from local sales taxes allocated for parks and recreation purposes. Last year, nearly two‐thirds of Department’s revenue base was generated from local taxes. It is interesting to note that the dependency on local sales tax has dropped since 2006, from 87% to about 64% in 2010. The cause for this decrease is twofold. First, the sales tax revenues have obviously dwindled as consumers reduced their spending during the recession years. Second, there is an increase in earned revenues through improved program offerings and overall participation.

56
To shift towards a business mind‐set, the Department should find creative means to expand revenues beyond the reliance on the local sales tax. Aside from finding program sponsors and raising funds, there is an opportunity for the Department to reasonably increase the fees and charges over time. The public opinion on the operating and capital finances gathered in the 2011 Needs Assessment Study has offered the Department some creative options for future exploration.
8.4 Public Perception
Through the community survey, the public unveiled perceptions and assessments on various aspects of the Department’s administration and finance. In general terms, almost two‐thirds (62%) of the respondents showed confidence in the leadership of the department. Their confidence is echoed by the fact that over half (55%) of the respondents were satisfied with the management of the department, and half considered department staff courteous and helpful. Financially speaking, 75% of respondents supported corporate sponsorships for events and 62% for corporate logos and signage at facilities and events. Almost two‐thirds (64%) were willing to pay for play, 71% felt the need for reduced fees for low‐income households and 54% supported a higher fee for non‐residents. A majority (63%) was satisfied with the recreation opportunities received for the tax dollars; and 60% supported the issuance of capital bonds for park improvements. Creating an independent Park District with its own taxing authority has been seen as a solution to secure sustainable financing. Voters around our State had formed seven metropolitan park districts from 2002 to 2005 after the introduction of state legislation to allow them to do so. Six more have been formed since 2009. Today, there are a total of 14 park districts in Washington. At this juncture, only 30% of Lakewood residents were ready to support an independent Park District. Among those who supported the idea, 53% were male respondents, 70.3% had a household income of less than $49,999 and 68.7% aged between 25 and 54. The statistics shed light on the Department’s need for a public education and outreach campaign.

57
Chapter 9 Public Participation
Public consultation is the cornerstone of the Legacy Plan. Any sustainable plan calls for the full support of grass‐roots, elected officials, partners, interest groups and staff members. It is the Department’s commitment to create a legacy for future generations; while being accountable to the current diverse needs of the community. To this end, an extensive and meaningful public participation program was launched at the outset of the planning process. The entire program includes several components to fully engage all residents, external and internal customers and stakeholders throughout the process. While many of program elements will continue to be implemented throughout the four phases of plan development, this chapter highlights those that had been employed for environmental scan purposes.
9.1 Legacy Team
In July 2010, an advisory committee, the Legacy Team, was set up to provide advice and input to the planning process. Appendix D contains the membership list, the mission and the roles of the Team. The 17‐member Team comprises members of the public, partner agencies and staff members representing different areas of expertise, including youths, older adults, persons of special needs, cultural competency, human services, health, education, military, transportation and trails, sports, arts and culture, nature and environment, park maintenance, recreation programming and comprehensive planning. The Team is co‐chaired by two members of the Parks and Recreation Advisory Board. During the first phase, the Team has met three times in July, October and December of 2010 to consider the strengths, weaknesses, opportunities and threats of the current park and recreation system; identify issues; provide input on community needs survey design; review emerging trends; review needs assessment findings and discuss partnerships. The Team has provided invaluable input to the development of this Report.
9.2 Key Stakeholder Interviews
In the beginning of the planning process, over 13 key departmental staff, Council and Legacy Team members were interviewed to solicit their opinions about park and recreation and their expectations on what the Legacy Plan will do for the City. The questionnaire guiding the open discussion is displayed in Appendix E.
9.3 Webpage and Internet Survey
The announcement of the development of the Legacy Plan was posted on the City’s webpage since early July 2010. To invite feedback and collect information, an internet survey using Survey Monkey was posted simultaneously. The internet survey ran till the end of October

58
2010. A total of 67 responses were received. Although the internet survey is not scientific and cannot be used to project community‐wide aspirations and needs, issues surfaced have shed light on current constraints and future opportunities. Appendix F summarizes the findings of the internet survey.
9.4 Focus Groups
Four focus groups were conducted in October 2010 to identify community issues and opportunities for input into the design of a needs assessment questionnaire. An advertisement was posted on the City’s website inviting the public to attend. About 36 members of the public and interested agencies responded to discuss needs and partnering opportunities in various program areas including active living & wellness, arts & culture, and nature & environment. Findings of the focus group discussions are summarized in Appendix G.
9.5 Community Survey
The City recognizes the importance of scientifically gathering community‐wide data in order to assess the needs of the entire population. A mail‐out survey was sent to a randomly‐selected group of 6,000 households in early November 2010. Over 420 expressed future park and recreation needs and preferences, and provided valuable opinions for future planning. The 2011 Needs Assessment Study is accompanied in this Report as Technical Appendix III.
9.6 Local Papers, Flyers, Program Guide and Press Releases
During the environmental scan process, various information articles and advertisements were sent out through conventional means including local publications and resources such as Lakewood Connections, PATCH, Suburban Times, school flyers and Recreation Program Guides. In November 2010, The News Tribune released an article on “random households received parks survey” to encourage residents to respond to the needs assessment. Continuous public involvement is a crucial component of the Legacy Plan process. Some of the above means of participation will continue in subsequent phases, including input from the Legacy Team, posting of the needs assessment survey and other completed reports on the Legacy Plan webpage and other community presentations.

59
Chapter 10 Summary of Environmental Scan: Issues and Opportunities
The strength, weakness, issue and threat assessment of both the external planning environment and the internal organization context has presented a set of new opportunities and needs for the Legacy Plan to embrace. Appendix H contains a full‐list of issues identified through various sources of data collection, including, but not limited to, key stakeholders interviews, focus group meetings, Legacy Team input, document reviews (Appendix I) and community surveys. The types of issues and needs identified are organized into five major groupings below.
10.1 Land Use and Planned Growth
Issues Currently, the interface between the City’s Comprehensive Plan and the current Parks and Recreation Master Plan is weak. The seven planning areas contained in the current Plan are no longer used. Areas for park planning warrant a new delineation in the new strategic plan. The population growth for Lakewood is targeted to reach 72,000 by 2030. Part of the growth is triggered by the 5,000 additional military personnel bringing their families to Lakewood in the next five years.28 Further, the Joint Base Lewis‐McChord will likely close some of its multi‐purpose fields to accommodate new growth. All of these intensifying demands will further burden the City’s existing park system and recreation services. At the same time, the State is encouraging cities to create active and walkable communities within future growth and economic development areas. Opportunities Generate community benefits to:
• Support smart growth and sustainable development; • Support target population growth; • Contribute towards city’s economic development by improving the quality of life for
both residents and workers; • Celebrate a sense of place and community identity through park and recreation
services; and • Generate economic impacts by bolstering Fort Steilacoom Park as a unique regional
attraction.
28 AECOM. (2010). Joint Base Lewis McChord Growth Coordination Plan (Draft). P. 13.

60
Consider action strategies to: • Integrate the Legacy Plan with the City's Comprehensive Plan Update process; • Address the specific needs of the future demographics and the military population; and • Complement the city‐wide Non‐Motorized Transportation Initiative through the
creation of landscaped linear parks, urban plazas and community gardens.
10.2 Parks, Open Space and Natural Environment
Issues While the current Master Plan adopts a ½‐mile service radius for neighborhood parks, many of the new parks have not been classified and the major physical barriers affecting local resident access to parks were not considered. The Department recently prepared a Planning and Feasibility Study29 recommending a future development scenario for Fort Steilacoom Park. While the on‐going operation and maintenance of the Park remains a challenge, the Study affirms the economic development potential of this site as a major regional park. Acquiring land for park development has not been a priority in the past due to the absence of dedicated funding. Besides recognizing the efficiencies of purchasing properties adjacent to existing park sites, the Park and Recreation Advisory Board has identified and considered “street ends” on which the City owns an easement interest based on the size, access and use potential of each site. However, no further actions were taken. Opportunities Generate community benefits to:
• Provide connected greenways and an open space system to connect off‐street multi‐purpose trails with on‐street non‐motorized trails;
• Provide urban linear park and amenities to complement “complete streets” and encourage walkability;
• Protect habitat corridors and other environmentally sensitive areas; • Preserve shorelines and critical areas; • Promote environmental education and outdoor awareness; • Provide leadership in environmental stewardship; and • Protect the needs of future generations through open space acquisition and
conservation.
29 John Swanson Design Studio, LLC. (2010). Fort Steilacoom Park and Fort Steilacoom Golf Course Planning and Feasibility Study. WA: Seattle.

61
Consider action strategies to: • Define “open space” and propose an updated “park classification” in light of the
emerging trends of connectivity and smart growth; • Address physical barriers to ensure safe and convenient walking access to parks; • Revisit park level of service based on the principles of “fairness and equity” to address
diverse needs; • Review the role of street ends in the context of linear park development; • Identify principles for future land acquisition to address service gaps and needs; • Consider voter‐approved measures to secure dedicated funding for land acquisition and
park development; and • Partner with other agencies to utilize open space areas for community use.
10.3 Recreation Programs and Services
Issues In the past, the recreation needs of the diverse population segments have not been fully articulated. The recently‐conducted community needs assessment has revealed valuable information for staff to consider when planning for future program offerings. The survey showed that one of the main barriers to program participation was the lack of interest in the programs provided. Other barriers included the lack of information, the variety of programs offered and cost. It further revealed the lack of a coordinated and effective marketing strategy as well as the need for a scholarship program for low‐income families. The City has not consistently and systematically collected program data for evaluation and planning purposes. Post‐participation surveys have not been conducted to collect participant feedback on classes and activities. In addition, although the Department has an adopted pricing policy and cost recovery targets for various types of programs, it is not specific enough or consistently applied when developing program fees. Being a tenant inside the County‐owned Lakewood Community Center has posed some constraints on the utilization of the Senior Activity Center and the expansion of services. The center should be re‐branded to attract older, yet active, adults; and a multi‐purpose facility should be explored to more efficiently offer Department services and programs to all ages. Opportunities Generate community benefits to:
• Create positive health impacts through active living programs and opportunities; • Reduce health cost impacts by addressing obesity; • Promote social equity through affordable, inclusive and accessible offerings;
62
• Promote arts and culture to enrich the quality of life of the citizens; and • Celebrate cultural diversity through parks and recreation opportunities.
Consider action strategies to:
• Define Department’s role and niche among alternative providers in response to recreation needs of the community;
• Apply the needs assessment survey findings to inform future program planning; • Address program barriers; • Consider the potential to further expand team sports; • Introduce post‐participation surveys to collect feedbacks from program users; • Identify sustainable finances to fund parks and programs; • Strengthen marketing strategies and develop a business/marketing plan for each
program area; • Consider the use of digital media to reach out to the young adults aged between 25‐44; • Develop a pricing philosophy and adopt a pricing pyramid to guide cost recovery of
programs; • Consider the feasibility of introducing “non‐resident fees”; • Consider pay‐to‐play as 64% of survey respondents supported user fees; • Introduce a scholarship program funding through sponsorships or other means to
subsidize low‐income families; • Re‐brand the Senior Activity Center and consider older adult programming within a
multi‐purpose community center setting to encourage inter‐generation and family‐wide programs.
10.4 Maintenance
Issues The needs assessment survey revealed that some factors related to operation and maintenance were considered barriers to participation. About 30% of the respondents responded that there was a lack of restrooms, 25% felt better facilities existed elsewhere and 14% perceived facilities as unsafe. As far as ADA compliance is concerned, two waterfront areas, located in Harry Todd Park and American Lake Park, were found inaccessible. Further, little work has been done to identify deferred maintenance needs.
63
Opportunities Generate community benefits to:
• Improve property values of homes by providing safe and clean parks and open space; and
• Create livable communities through the provision of welcoming and well‐maintained parks and facilities.
Consider action strategies to:
• Develop park and facility maintenance level of service standards to reflect new park classification and function;
• Demonstrate to the public that the Department is a good steward of its resources by creating a “depreciation account” to proactively take care of park assets;
• Address ADA issues through a transition plan update process and include ADA projects in City's Capital Improvement Program; and
• Develop park design guidelines to include amenities and restrooms to reflect the new park classification.
10.5 Management and Finance
Issues On the management side, nearly two‐thirds of the community survey respondents expressed confidence in the leadership of the Department. Approximately 55% were satisfied with the management of the Department. However, only 34% found it easy to communicate with the Department. In general, there is a lack of a performance management culture and policies/procedures within the Department. While Parks Division has developed standard operating procedures for park maintenance and community use, the Department, in general, does not have a comprehensive set of policies and procedures to guide the day‐to‐day business and operation. Recreation programs are not regularly evaluated, and performance tracking for benchmarking and evaluation is seldom practiced. On the finance side, finding sustainable funding to operate park and recreation services under the City operation remains a challenge. Consideration should be given to improve revenue bases through sponsorships and cost‐recovery improvements. There is an emerging trend to create an independent taxing authority to sustain finances. At this juncture, only a third of the survey respondents were ready to support a Park District. Sixty percent of respondents agreed that the Department should pursue capital bonds park projects and improvements.

64
Opportunities Generate community benefits to:
• Connect and involve people through cultivating a responsive and an accountable Department;
• Build strong communities, trusting relationships and social support through parks and recreation opportunities; and
• Expand revenue base to support programs for low‐income families. Consider action strategies to:
• Cultivate good relationship with the community, customers, partners and volunteers; • Develop a partnership policy; • Improve public relations, marketing and outreach strategies; • Identify policies and procedures needed to improve the operation of the Department; • Explore creative options to support park and recreation operation; • Consider the public readiness and an education campaign for a Park District; • Develop and track performance indicators for service evaluation; and • Nurture a performance management culture within the Department.
The community benefits identified under each topical grouping can be categorized differently based on their environmental, economic, social and cultural contributions and impacts. Appendix J attempts to provide an alternative framework in support of the “quadruple bottom‐line” of sustainability.
10.6 Concluding Remarks
This Report has identified many issues and opportunities for the Legacy Plan to take into consideration. Not all opportunities are necessarily relevant to achieving the vision, mission and goals of the Legacy Plan; and not all can be implemented at once given limited resources. The purpose of this Report is to identify and document all opportunities so that each of them can be given an equal opportunity for further assessment during the subsequent plan development stages. Phase 2, the next step, will work on the visioning of strategic goals and outcomes to determine opportunities that the Department should address. Phase 3 will strategize and prioritize the identified opportunities to form an action plan and a capital improvement program for implementation over the next six years. The final Legacy Plan will include recommendations derived from Phases 2 and 3 with the purpose of creating and leaving behind a sustainable and healthy park and recreation legacy for Lakewood residents.

65
List of Appendices

66
Appendix A: Park and Outdoor Facility Inventory
Park Name
PARK ACREAGE Pa
rk P
lanni
ng A
rea
Main
tena
nce L
evel
of
Serv
ice A
ssig
ned
Tota
l Lan
d Ac
res (
by G
IS)
Maintained Ground Acreage
Irrigated Turf
Non Irrigated
Turf
Land-scape Beds
Total Maintained
CD SF SF SF AC
Active 7 1 2.35 86,000 0 5,826 2.11 2
American Lake 8 1 5.53 132,275 4,679 5,672 3.27 2
Blueberry Farm 3 4 7.91 0 0 0 0.00 3
Edgewater 6 4 2.83 0 23,000 0 0.53 3 Fort Steilacoom * 5 1 390.71 874,000 1,358,473 11,362 51.51 2
Harry Todd 10 1 17.14 158,408 272,000 1,800 9.92 2
Kiwanis 3 2 2.85 97,929 0 2,830 2.31 2
Lakeland 8 4 0.48 0 0 0 0.00 3
Oakbrook 1 3 1.55 67,000 0 1,140 1.56 2
Primley 6 4 0.17 0 0 7,400 0.17
Springbrook 9 3 3.16 92,000 1,600 50 2.15 2
Wards Lake 4 2 23.36 31,625 53,900 10,109 2.20 2
Washington 5 3 3.62 75,000 0 0 1.72 2
Total 461.66 1,614,237 1,713,652 46,189 77.46
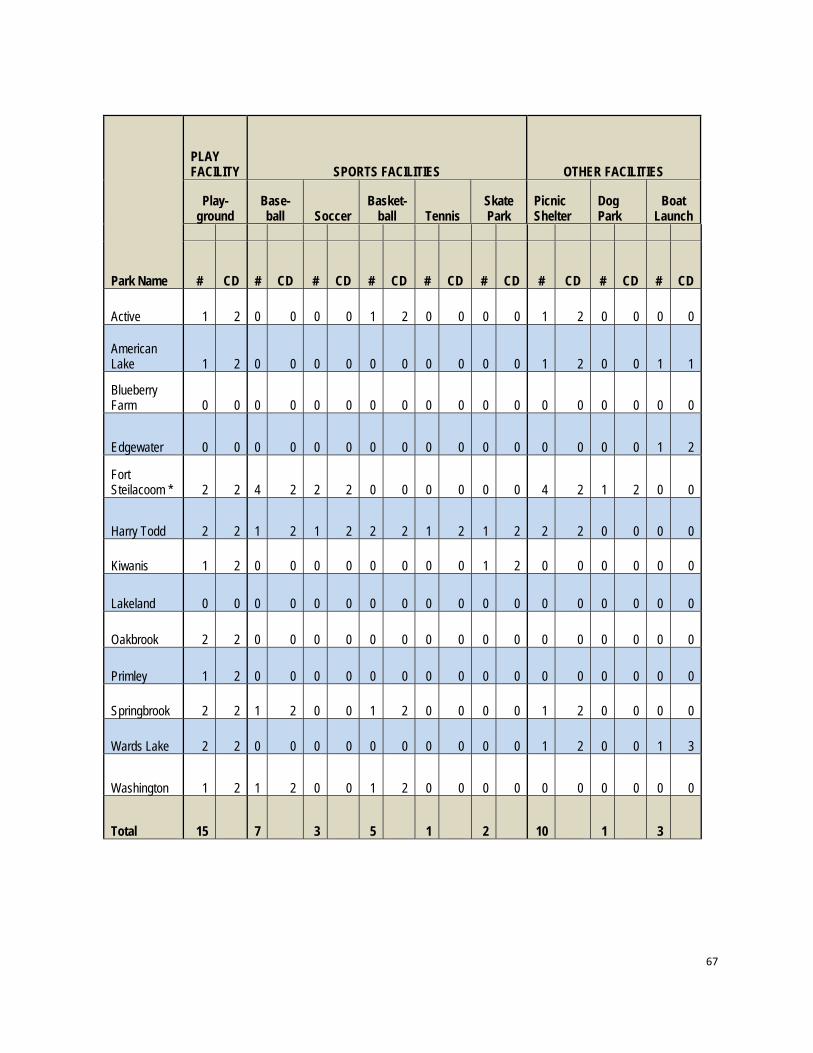
67
Park Name
PLAY FACILITY SPORTS FACILITIES OTHER FACILITIES
Play-ground
Base-ball Soccer
Basket-ball Tennis
Skate Park
Picnic Shelter
Dog Park
Boat Launch
# CD # CD # CD # CD # CD # CD # CD # CD # CD
Active 1 2 0 0 0 0 1 2 0 0 0 0 1 2 0 0 0 0
American Lake 1 2 0 0 0 0 0 0 0 0 0 0 1 2 0 0 1 1
Blueberry Farm 0 0 0 0 0 0 0 0 0 0 0 0 0 0 0 0 0 0
Edgewater 0 0 0 0 0 0 0 0 0 0 0 0 0 0 0 0 1 2
Fort Steilacoom * 2 2 4 2 2 2 0 0 0 0 0 0 4 2 1 2 0 0
Harry Todd 2 2 1 2 1 2 2 2 1 2 1 2 2 2 0 0 0 0
Kiwanis 1 2 0 0 0 0 0 0 0 0 1 2 0 0 0 0 0 0
Lakeland 0 0 0 0 0 0 0 0 0 0 0 0 0 0 0 0 0 0
Oakbrook 2 2 0 0 0 0 0 0 0 0 0 0 0 0 0 0 0 0
Primley 1 2 0 0 0 0 0 0 0 0 0 0 0 0 0 0 0 0
Springbrook 2 2 1 2 0 0 1 2 0 0 0 0 1 2 0 0 0 0
Wards Lake 2 2 0 0 0 0 0 0 0 0 0 0 1 2 0 0 1 3
Washington 1 2 1 2 0 0 1 2 0 0 0 0 0 0 0 0 0 0
Total 15 7 3 5 1 2 10 1 3

68
Park Name
MAINTAINED TRAILS/ ROADS ANCILLARY FACILITIES
Gravel Paths
Asphalt Paths
Cement Paths Roads
Paved Parking
Gravel Parking
Restroom Stalls
LF CD LF CD LF CD LF CD # CD # CD # CD
Active 0 0 1,207 2 360 2 0 NA 1 2 0 0 0 0
American Lake 0 0 960 2 223 2 477 1 1 1 0 0 6 2
Blueberry Farm 0 0 0 0 0 0 0 0 0 0 0 0 0 0
Edgewater 0 0 0 0 0 0 0 0 0 0 0 0 0 0
Fort Steilacoom * 49,607 2 14,681 2 497 2 7,521 3 2 2 3 2 4 2
Harry Todd 966 2 806 2 290 2 200 2 3 2 1 2 8 2
Kiwanis 0 0 1,020 1 1,405 1 0 0 2 1 0 0 2 2
Lakeland 0 0 0 0 0 0 0 0 0 0 0 0 0 0
Oakbrook 0 0 90 2 0 0 0 0 1 2 0 0 0 0
Primley 200 2 0 0 0 0 0 0 0 0 0 0 0 0
Springbrook 0 0 0 0 970 2 0 0 1 2 0 0 0 0
Wards Lake 295 2 2,675 2 1,200 2 1,030 2 1 2 0 0 2 2
Washington 0 0 840 2 0 0 0 0 1 2 0 0 0 0
Total 51068 22279 4945 9228 13 4 22

69
Park Name Park-specific Notes
Active The one basketball court is a full court. American Lake
American Lake Boat Launch is included in American Lake dataset. Restrooms are seasonal.
Blueberry Farm
Blueberry Farm restoration project coordinated by Recreation Department as a volunteer effort.
Edgewater Lineal park with a small boat launch. Primarily undeveloped land that has minimal maintenance provided.
Fort Steilacoom * The two soccer fields are full-size fields. Dog park is 22 acres. Restrooms are year-round.
Harry Todd The two basketball courts are full courts. Skatepark is 18,000 sq. ft.. Restrooms are seasonal.
Kiwanis Skatepark is 12,800 sq. ft. Restrooms are seasonal.
Lakeland Park is undeveloped.
Oakbrook NA
Primley Park is maintained by neighborhood volunteers
Springbrook The one basketball court is a half court.
Wards Lake Restrooms are seasonal.
Washington The one basketball court is a quarter court.
NOTE: * With the exception or Fort Steilacoom Park with parcels owned by the State, Western State, Pierce College and DNR, all parks listed in this inventory are owned and managed by the City. CONDITION (CD): The score reflects the overall park or facility condition based on the maintenance level of service assigned to each park. (0=Not Applicable, 1=Above Standard, 2=Standard, 3=Below Standard).

70
Appendix B: Current Park and Recreation Partnership Profile
Park
Management/ Development
Joint Planning
Joint Program-ming
Share Facility Use
Joint Market-ing
Others
City of Lakewood Internal Partners Lakewood Arts Commission X Lakewood City Council X X Lakewood Community Development Dept X Lakewood GIS / IT Division X Lakewood Legacy Team X Lakewood Municipal Court / Work Crew X X Lakewood Parks and Recreation Advisory Board
X X
Lakewood Police Department X X X Lakewood Public Works Department X Lakewood Youth Council X X X Public Partners City of University Place X X X X Clover Park School District X X X X X Joint Base Lewis McChord (JBLM) X Lakewood Fire District X X X Lakeview Light and Power X Lakewood Water District X Metro Park District of Tacoma X X X X Pierce College X X X Pierce County X X X X Pierce County Aging and Long Term Care X Pierce County Library X Puget Sound Energy X State of Washington X Town of Steilacoom X X X X X WA Dept of Fish and Wildlife X X
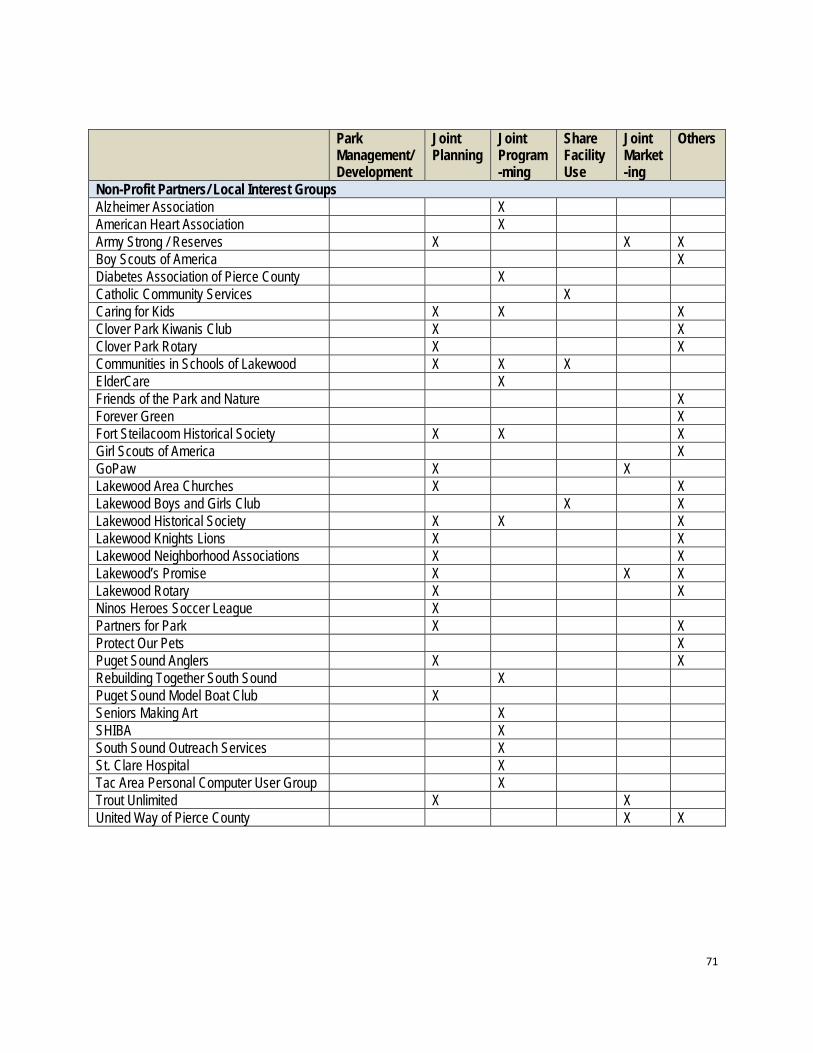
71
Park
Management/ Development
Joint Planning
Joint Program-ming
Share Facility Use
Joint Market-ing
Others
Non-Profit Partners/ Local Interest Groups Alzheimer Association X American Heart Association X Army Strong / Reserves X X X Boy Scouts of America X Diabetes Association of Pierce County X Catholic Community Services X Caring for Kids X X X Clover Park Kiwanis Club X X Clover Park Rotary X X Communities in Schools of Lakewood X X X ElderCare X Friends of the Park and Nature X Forever Green X Fort Steilacoom Historical Society X X X Girl Scouts of America X GoPaw X X Lakewood Area Churches X X Lakewood Boys and Girls Club X X Lakewood Historical Society X X X Lakewood Knights Lions X X Lakewood Neighborhood Associations X X Lakewood’s Promise X X X Lakewood Rotary X X Ninos Heroes Soccer League X Partners for Park X X Protect Our Pets X Puget Sound Anglers X X Rebuilding Together South Sound X Puget Sound Model Boat Club X Seniors Making Art X SHIBA X South Sound Outreach Services X St. Clare Hospital X Tac Area Personal Computer User Group X Trout Unlimited X X United Way of Pierce County X X

72
Park
Management/ Development
Joint Planning
Joint Program-ming
Share Facility Use
Joint Market-ing
Others
Private Partners Ace Van & Storage X Bridgeport Place Assisted Living X Brown Bear Carwash X Cabelas X X Clear Channel Outdoor X Comcast X Emerald City Smoothie X Emerson Dental X Gene’s Towing X Integrity Hearing X Harbor Oral Surgery X Heartwarming Care X Holiday Retirement X Holroyd Co. X Korsmo Construction X Harold Le May Enterprises, Inc. X X Lakewold Gardens X X X X X Lexus of Fife X Merrill Gardens X Miles Sand & Gravel X Narrows Glen Retirement Home X Phase II Construction X Point Defiance Village X Senior Scene X Shur Kleen Carwash X Stone Mountain’s Flooring Outlet X Suburban Times X Rain or Shine X The Footcare Place X The News Tribune X The Weatherly Inn X Tucci and Sons X UK International Soccer X X

73
Appendix C: Alternative Provider Profile
Active‐living and Wellness Program Providers
1. Boys and Girls Club a. Number of Members: 224 b. Market Segments: Aged 6‐18 c. Programs: Sports and ESL, special events and trips/tours d. Facilities for community use: Gym, multi‐purpose rooms and other rooms
2. Franciscan Health System a. Market Segments: Whole community b. Programs: Wellness and health programs, special events c. Facilities for community use: Multi‐purpose rooms
3. Lakewood Baseball and Softball Club a. Number of Members: 1,000 b. Market Segments: Aged 7‐14 c. Programs: Baseball and softball leagues
4. Lakewood Steilacoom‐Dupont Soccer Club a. Number of Members: 600 b. Market Segments: Aged 11‐18 c. Programs: Soccer Micro
Nature and Environment Program Providers
1. Parks and Trails Steilacoom a. Market Segments: Whole community b. Programs: Special event, trips/tours
2. Lakewold Gardens d. Number of Members: 800 e. Market Segments: Aged 40‐70 f. Programs: Gardening and environmental education, special events and
trips/tours g. Facilities for community use: Multi‐purpose rooms and performing space
3. Chambers‐Clover Creek Watershed Council a. Number of Members: 10 b. Market Segments: Whole community c. Programs: Environmental education forums and trips/tours d. Facilities for community use: Quality monitoring equipment

74
4. Protect Our Pets
a. Market Segments: Whole community b. Special Interest: Off‐leash park
Arts and Culture Program Providers
1. Lakewood First Lions a. Number of Members: 89 b. Market Segments: Whole community c. Programs: Trips and tours
2. Crossover Christian Center a. Market Segments: Whole community b. Programs: Community activities c. Facilities for community use: Fellowship hall and church building (capacity 125)
3. Lakewood Historic Society/Lakewood Rotary a. Number of Members: 350 b. Market Segments: Whole community c. Programs: Trips/tours (museums) and monthly lectures
4. Clover Park School District a. Market Segments: Whole community b. Programs: Sports, clubs and activities for Grade 6‐12, special events c. Facilities for community use: gym, multi‐purpose rooms, sports facilities and
performing space

75
Appendix D: Legacy Team Mission and Membership
Mission and Mandate To provide input and advice as the Department develops a strategic parks and recreation plan, the Lakewood Legacy Plan, to address the following, among others:
• Community needs and issues • Long‐term direction, vision, mission, goals and priorities • Near‐term strategies and priorities for programs and operations • Level of service standards for parks, maintenance and program services • Implementation strategies, such as partnership, capital needs and funding
Membership The Legacy Team is a Committee comprised of agency representatives, Parks and Recreation Advisory Board members, City staff, individual residents and users of City’s programs and facilities. The Legacy team represents a diverse make‐up of people from all walks of life. Members bring to the process experience and knowledge in the areas of park maintenance, recreation programming, transportation and trails, sports, special needs, human services, arts, cultural diversity, the environment, health and wellness, military and education. Terms of Service The Legacy Team will work for the next 18 months working through four phases of strategic planning:
• Phase 1‐ Environmental Scan • Phase 2‐ Goals, Levels of Service and Outcome Development • Phase 3‐ Action Plan and Capital Improvement Program Development • Phase 4‐ Legacy Plan Development
Roles and Expectations Members are expected to:
• Support the strategic planning goals and process; • Consult their own staff/agency/public members in their area(s) of expertise • Provide input with the community’s interest in mind; • Attend and participate in meetings; • Send a representative to meetings in your absence; • Review draft planning reports prepared under each phase of the planning process in a
timely manner; and • Support and/or attend public meetings and other public participation opportunities
throughout the process.

76
Legacy Team Membership List
Area of Expertise
Name
Contact Information
Youth Council
Celina Kim
8605 – Maple Street SW Lakewood, WA 98498
253-678-5227 [email protected]
Older Adults and
Senior Activity Center
Jan Rich
9620 108th Ave Ct SW Lakewood, WA 98498
589-8894 [email protected]
Special needs/ human services
Kim Dodds
6000 Main Street SW Lakewood, WA 98499
253-983-7756 [email protected]
Sports and athletics
Jon Graef
Tacoma PC Sports Commission 1119 Pacific Ave., 5th Floor
Tacoma, WA 98402 253-284-3259 (Office)
Arts and culture Lakewood Arts Commission
Phil Raschke
9933 – Onyx Drive SW Lakewood, WA 98498
253-861-1366 [email protected]
Nature and environment
Michele Lafontaine
Pierce College Science Division 9401 Farwest Drive SW
Lakewood, WA USA 98498 253-389-8681
Transportation and trails
Levi Wilhemsen
Transport Advisory Com Member 8551 Zircon Drive SW #E-80
Lakewood, WA 98498 253.678.1404
Health and wellness
Linda Graves
(June to Dec 2010)
Tac Pierce County Health Dept 3629 South D Street Tacoma, WA 98418
253-798-3817 [email protected]
Military / MWR
Jerry Weydert

77
Area of Expertise
Name
Contact Information
Clover Park School Dist
Cynthia Gracey
Clover Park School District 9219 Lakewood Drive SW,
Lakewood, WA 98499 583-7364
Cultural Competency
Anessa McClendon 9626 116th St SW
Lakewood, WA 98498 (253) 306-7850
Park / facility maintenance
Scott Williams 6000 Main Street SW Lakewood, WA 98499
253-983-1024 [email protected]
Recreation programming
Amanda Richardson
6000 Main Street SW Lakewood, WA 98499
253-983-7827 [email protected]
Comprehensive planning
Deborah Johnson
6000 Main Street SW Lakewood, WA 98499
253-983-7772 [email protected]
Parks and Recreation Advisory
Board Legacy Plan Co-Chairs
Vito Iacobazzi 10821 Woodale Lane SW
Lakewood, WA 98498 253-202-5977
Jason Gerwen 8417 101st Street Ct SW Lakewood, WA 98498
253-582-6535 [email protected]
Director of Parks, Recreation, and Community Services
Mary Dodsworth
(253) 983-7741
Principal Planner (Project Lead)
Amy Pow
(253) 983-7828
Administrative Assistant (Committee Secretary)
Suzi Riley
(253) 983-7758
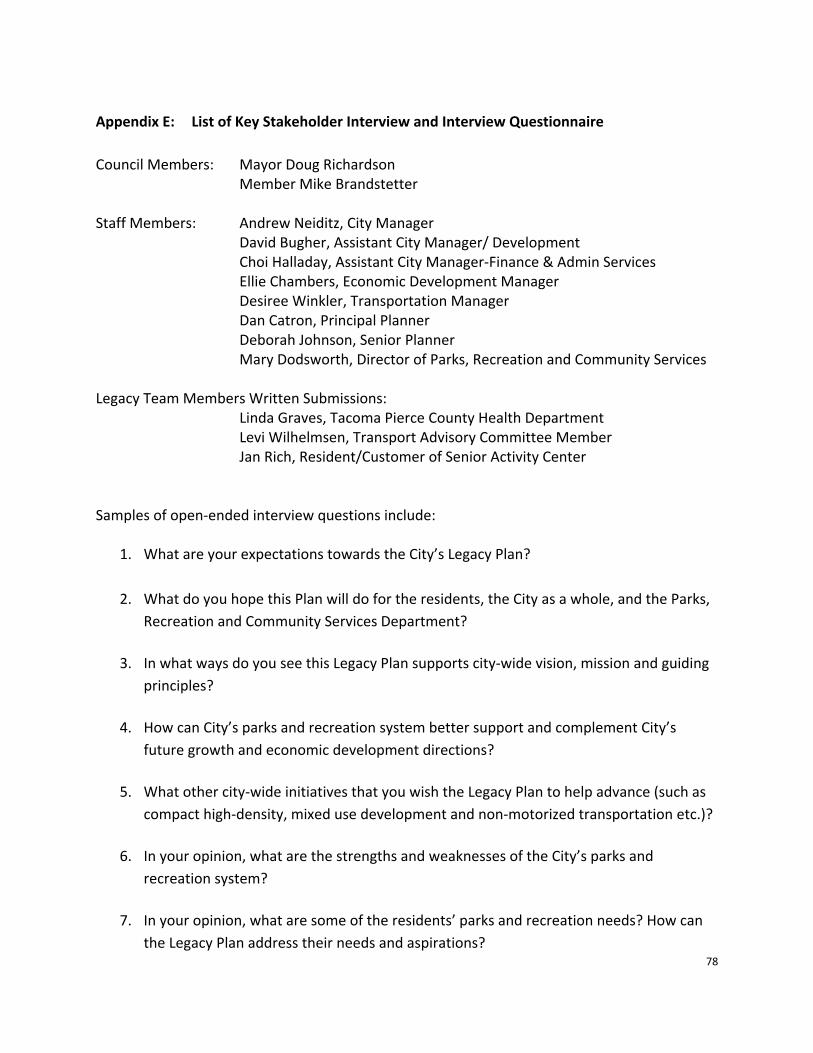
78
Appendix E: List of Key Stakeholder Interview and Interview Questionnaire
Council Members: Mayor Doug Richardson Member Mike Brandstetter Staff Members: Andrew Neiditz, City Manager David Bugher, Assistant City Manager/ Development Choi Halladay, Assistant City Manager‐Finance & Admin Services Ellie Chambers, Economic Development Manager
Desiree Winkler, Transportation Manager Dan Catron, Principal Planner Deborah Johnson, Senior Planner Mary Dodsworth, Director of Parks, Recreation and Community Services
Legacy Team Members Written Submissions: Linda Graves, Tacoma Pierce County Health Department Levi Wilhelmsen, Transport Advisory Committee Member Jan Rich, Resident/Customer of Senior Activity Center
Samples of open‐ended interview questions include:
1. What are your expectations towards the City’s Legacy Plan?
2. What do you hope this Plan will do for the residents, the City as a whole, and the Parks, Recreation and Community Services Department?
3. In what ways do you see this Legacy Plan supports city‐wide vision, mission and guiding
principles?
4. How can City’s parks and recreation system better support and complement City’s future growth and economic development directions?
5. What other city‐wide initiatives that you wish the Legacy Plan to help advance (such as compact high‐density, mixed use development and non‐motorized transportation etc.)?
6. In your opinion, what are the strengths and weaknesses of the City’s parks and
recreation system?
7. In your opinion, what are some of the residents’ parks and recreation needs? How can the Legacy Plan address their needs and aspirations?

79
8. From the City’s finance and administration perspectives, what are the opportunities and
challenges of the City’s parks and recreation system?
9. What are some of the greatest areas in need of improvements or issues that Parks, Recreation and Community Services Dept currently has or will face in the future?
10. Are there any policies or best practices you wish this Plan to consider in order to improve the efficiency and effectiveness of conducting the businesses in the Parks, Recreation and Community Services Department?
11. What are the city‐wide outcomes or performance measures, aside from those recommended by ICMA, that you would like the Legacy Plan to achieve?

80
Appendix F: Internet Survey Findings
Total number of respondents:
A total of 70 responses were received during the entire period posted on the internet running from July to October, 2010.
Demographics of respondents:
Age:
• Below 19 (1.4%) • 20‐34 (20.3%) • 35‐54 (37.3%) • 55‐64 (26.1%) • 65‐74 (5.8%)
Gender:
• Male (44.3%) • Female (55.7%)
Annual household income before taxes:
• Under $24,000 (6%) • $24,000 ‐ $49,999 (22%) • $50,000 ‐ $74,999 (22%) • $75,000 ‐ $99,999 (20%) • $100,000 and above (31%)
Household composition:
• 91% with children attending pre‐elementary schools • 67% with children attending elementary schools • 88% with children attending middle schools • 89% with children attending high schools • 63% adults • 23% over 55 years old
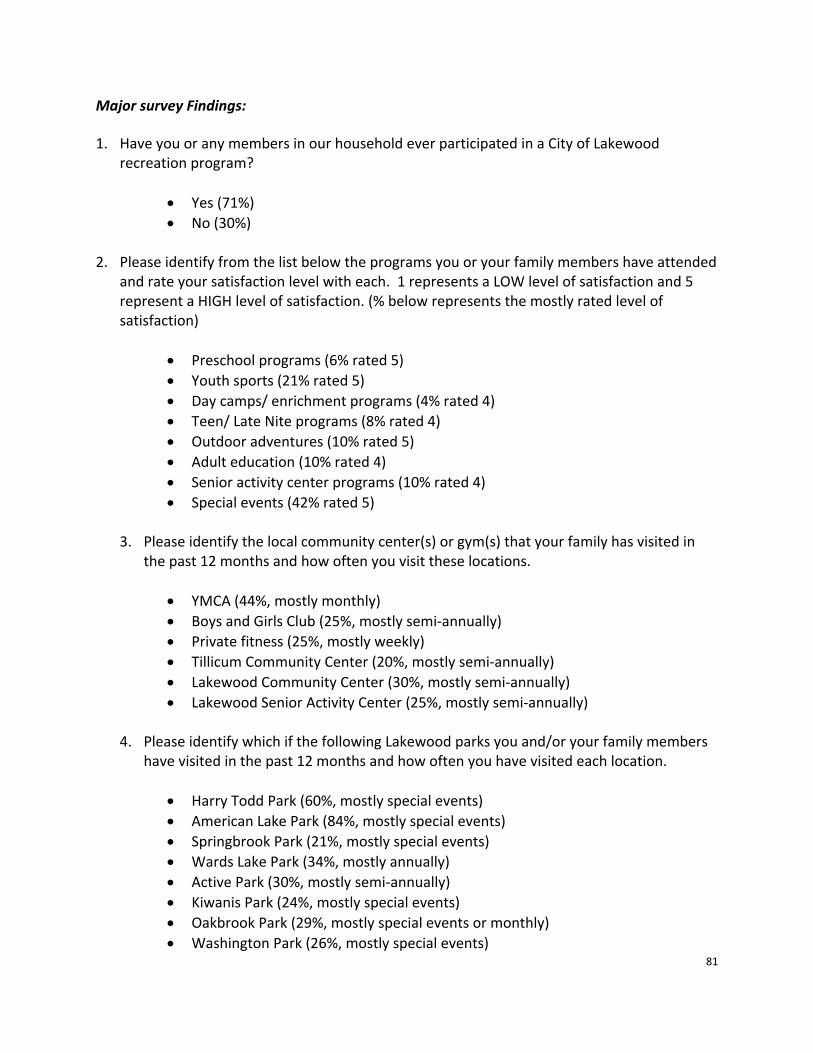
81
Major survey Findings: 1. Have you or any members in our household ever participated in a City of Lakewood
recreation program?
• Yes (71%) • No (30%)
2. Please identify from the list below the programs you or your family members have attended
and rate your satisfaction level with each. 1 represents a LOW level of satisfaction and 5 represent a HIGH level of satisfaction. (% below represents the mostly rated level of satisfaction)
• Preschool programs (6% rated 5) • Youth sports (21% rated 5) • Day camps/ enrichment programs (4% rated 4) • Teen/ Late Nite programs (8% rated 4) • Outdoor adventures (10% rated 5) • Adult education (10% rated 4) • Senior activity center programs (10% rated 4) • Special events (42% rated 5)
3. Please identify the local community center(s) or gym(s) that your family has visited in the past 12 months and how often you visit these locations.
• YMCA (44%, mostly monthly) • Boys and Girls Club (25%, mostly semi‐annually) • Private fitness (25%, mostly weekly) • Tillicum Community Center (20%, mostly semi‐annually) • Lakewood Community Center (30%, mostly semi‐annually) • Lakewood Senior Activity Center (25%, mostly semi‐annually)
4. Please identify which if the following Lakewood parks you and/or your family members
have visited in the past 12 months and how often you have visited each location.
• Harry Todd Park (60%, mostly special events) • American Lake Park (84%, mostly special events) • Springbrook Park (21%, mostly special events) • Wards Lake Park (34%, mostly annually) • Active Park (30%, mostly semi‐annually) • Kiwanis Park (24%, mostly special events) • Oakbrook Park (29%, mostly special events or monthly) • Washington Park (26%, mostly special events)

82
• Seeley Lake Park (30%, mostly special events or annually) • Edgewater Park (23%, mostly special events) • Fort Steilacoom Park ( 94%, mostly weekly) • Fort Steilacoom Golf Course (38%, mostly annually) • Fort Steilacoom Disc Golf Course (32%, mostly monthly)
5. What types of park and recreation activities and/or experiences would you and your
family most likely participate in? (Mark all that apply) The five most participated activities/ experiences were:
• Trails and paths: walking or running (79%) • Natural/wildlife areas or nature trails (60%) • Community events/outdoor concerts (54%) • Playing/ recreating in a park close to home (49%) • Dog park (47%)
6. How would you prefer to receive information from the City of Lakewood regarding the
Legacy Plan or other parks and recreation programs and services?
• Direct mail brochure (44%) • Email (46%) • Website (41%) • Newspaper (24%)

83
Appendix G: Focus Group Meetings—Summary of Findings
Four focus groups were held on October 21 to explore issues and opportunities for City’s park and recreation services. In addition to the Legacy Team, three other groups were conducted to focus on: 1. Arts and Culture Focus Group Attendance: Malcolm Russell, James Venturini, Ed Kane, Paul Wagamann, Retha Hagward,
Barbara Vest, Kim Prentice, Dave Sclair, Pastor Frederick Brown Summary of Findings What is City’s role?
• City provides facilities AND coordinates user groups o Partners/Non‐profits can provide programs
• Ask what does the community want? o Represent all groups o Identify trends/needs/research
• Take information/programs OUT INTO the community o How do we get it – one stop location?
• Maintain what we already have • Coordinate “campaign” to build capital facilities
o Barns/theatre/centers • Create marketing communication (info clearinghouse) hub • Improve network – Community Connections • Provide affordable programming
o How do we pay for it o Public/private partnerships
• Promote Arts & Culture in Lakewood What are the pressing issues?
• City needs an “Identity” – Improve reputation • Need better program space/facilities ($)
o Public use o Art center(s)
• Set priority of budget allocation o Parks/facilities o Programs
• Address competition • Explore partnerships • Improve communication/marketing/coordination—be the coordination among agencies
(One big calendar approach)

84
• Seek community ownership/buy‐in • Address maintenance • Foster volunteerism – keep small groups independent of each other • Explore City’s niche as an Umbrella Organization
o Keep people in town, bring others in (destination community)
Who does the City serve well?
• Youth sports • Youth programs • YMCA/B & G Club serves low income • Older, active adults
Who is NOT being served? • Low income families • Military families • Homeless – churches/city • Ages 16‐21‐30
o Single adults o Mid life grownups w/$$$
How can partnerships improve efficiencies?
• With an available facility, groups can provide programs • Past art festival at Village Plaza
o International o MLK o Summerfest o X‐mas tree lighting
Integrate Arts & Culture o Coordinate logistics (make it easy)
One stop shopping Facility and requirements
• Types of partnerships o Schools o Meeting of service providers to share/ what’s happening o Annual conference of “Lakewood” o Neighborhood ASSC o Churches o Business Community o Service Clubs o Non‐profits (Lakewood’s Promise) o Other neighborhood cities/organizations
Steilacoom/UP/military

85
o Older, mature adults (do not lose them!) 2. Wellness and Active Living Focus Group
Attendance: Benjamin Parrish, Troy Holmes, Debbi Saint, Donna Hoffman, Cynthia Gracey,
Chris Gupp, Stephanie Dodson, Paul Bocchi
Summary of Findings: What is City’s role?
• Coordination – local, adjacent communities • Programming for under served • Partnerships – coaches training
What are the pressing issues?
• Improve communication (come together) • Need more youth programs • Share volunteers • Less duplication • Improve networking • Improve marketing and promotion • Need a City‐wide Info clearinghouse • Create safe access to trails/parking
o Trail connectivity o Transportation – how do we access facilities and programs? o Lights would provide more/better access at sites
• Provide concessions on busy weekend – keep people in the parks • Add staff at the sites – who is there to help/lead
Who does the City serve well?
• Youth who can pay • Pet owners • Senior adults • Teens • Military (questionable)
Who is NOT being served? • Low income people • Young workers approximately ages 18‐34 • Special needs • Military – extended family • Families

86
How can better serve low income youth?
• Program fees too high • Communication is important • Coordinate “smaller” groups to make a league
o Older/younger adult programs • Have a facility coordinator on the Board (consistency) • Volunteer coordination
o Being volunteers o Needing volunteers
• Address safety issues o Outside to play is scary o Nature deficient o Parks/access
• Provide more Wellness and Active Living programs 3. Nature and Environment Focus Group
Attendance: Amy Paulson, Jeff Brown, Brian Coulson, Stephanie Walsh, Dennis Hewitt, Al Schmauder, Jim Senko, Don Russell, Jeff Brown Summary of Findings: What is City’s role?
• Address water quality of lakes • Recognize what we have NOW before making changes
o MAINTAIN what we have now • Remove invasive plant species • Provide minimal access clean up garbage in natural areas
o While maintaining/cleaning, PREVENT negative impact to areas What are the pressing issues?
• Sustain restoration of parks/Waughop Lake • Install/implement sewer systems • Address safety in parks/ on lakes (invasive plants) • Inform non‐users of parks/open spaces (website/stories) • Separate active/passive users • Provide trails with amenities to walk/run • Balance between groomed/ungroomed (ADA) • Create “Friends of Parks” at all sites
Who are Department’s partners?
• Neighborhood Association/groups o Police areas

87
• School District programs – engaged • Historical Societies • Document – tell the stories • Native Plant societies • Pierce College • Neighbor Jurisdictions – Steilacoom, UP, PC
How does the Department sustain programs? • Address equity among partners • Less of a personal approach • Consider Park District – local/county multi‐area
What are some of the Environmental Interpretation/Discover opportunities?
• AT ALL SITES o History o Plant life o Educate o Tell the stories
• How do we get people connected to the earth/parks/nature? o Use documents – tell stories – implement historical aspects o More activities/access (safe) o How do we get people to parks?
Bus stops/Bike access (trails) Low income issue Mobility issue
SRS/ADA issue

88
Appendix H: Issue Matrix
No Area of Concern Issue Opportunity
1 Comprehensive Plan Update
The City will be updating the Comprehensive Plan to meet the State revised 2014 deadline. Currently the interface between the Comprehensive Plan and the current Parks and Recreation Plan is weak.
The development of a new Legacy Plan provides an opportunity to better integrate with the City's Comprehensive Plan Update process.
2 Park Planning Areas
The 2005 Parks and Recreation Master Plan mentioned the seven Planning Areas once indicated in the Comprehensive Plan, but did not apply them for any area analysis. According to the Planning Staff, these seven areas contained in the Plan are no longer used.
Delineating park planning areas using major physical barriers as boundaries could ensure safe and convenient walking access to neighborhood parks and recreation services.
3 Built Environment
The State is encouraging cities to create active communities and walkable/ bikable cities. How can the Legacy Plan respond to this emerging urban development trend?
The Council adopted the Non Motorized Transportation Plan in 2009 to support an active community. Develop parks and recreation program, strategies and policies which promote physical activity, such as the creation of pleasant outdoor and walking environment in urban growth centers by providing landscaped urban trails, plazas and community gardens.
4
Future Growth and Economic Development
The future of development of the Lakewood Station District, Tillicum Neighborhood and Woodbrook Business Park will generate population and economic growth. How can parks, open space and recreation programs support the future growth?
The Legacy Plan should address the needs of those living or working in planned growth areas. Park and recreation providers would play a role in supporting planned growth and economic development through improving the quality life of both residents and workers.
5 International District
The City is considering the feasibility of extending the International District near I-5 and South Tacoma Way. How can the City customize park design and recreation services to support this unique opportunity?
Create an urban linear park with a cultural and heritage theme to support the International District.

89
No Area of Concern Issue Opportunity
6
Population and Demographics
The County and its cities are currently fine-tuning the 2030 population, housing and employment projections to meet the allocation goals. The final projection numbers may be adjusted during the course of discussion. Since the 2010 Census data will not be ready in time for this Environmental Scan, the demographic data used for the Legacy Plan may have to rely on the decade-old Census data.
Adopt the new 2030 projection numbers as revised. The City could attract a younger population, as the military population grows, and more new immigrants should the International District become a reality. The Legacy Plan should address the future demographic composition.
7 Military Population
The growing military population living both on and off base at Joint Base Lewis-McChord (JBLM) has created a huge demand for park and recreation services. How can the Legacy Plan address their needs?
The possible closure of some recreation facilities within JBLM could create, on the one hand, more opportunities for the City to serve the military population; but on the other, impact more on existing park services.
8
Park and Facility Inventory
The City's park and facility inventory was collected in 2002. It has not been updated to reflect new park sites, improvements and current conditions.
Update park and facility inventory as part of the Environmental Scan.
9 Park Level of Service (LOS)
How park LOS should be approached requires further studies. The per capita LOS may not be relevant as neighborhoods become denser. The State Recreation and Conservation Office (RCO) is currently reviewing park LOS for cities to consider.
Review and provide clear definitions and LOS for parks and open space.
10
Fort Steilacoom Park and Golf Course
On-going maintenance of the Park remains a challenge. The City is currently negotiating the Interlocal Agreement with Pierce County to review the maintenance and management arrangement of the site, and the potential addition of the golf course to the Agreement. The economic impact to the City as a designated regional park and attraction is yet to be determined. Toxic algae exposure was found in Waughop Lake causing some health concern. Cost to clean up the Lake is not yet determined.
Bolster City’s jewel as an unique attraction with abundant historic and natural assets.

90
No Area of Concern Issue Opportunity
11
Waterfront Access and Street Ends
Access to waterfront areas for recreation purposes is of public interest. The PRAB has considered recommendations for each site based on its size, access and use potential. No action has been taken to date by City Council.
Review the issue in the context of linear urban park development.
12
Open Space/ Park Acquisition
There is no park and open space acquisition plan or dedicated funding to address future park needs.
Acquire surplus schools and other properties to address service gaps and needs, and revisit park impact fees and other voter-approved measures to secure dedicated funding for land acquisition and park development.
13
Recreation Program Inventory
The City has not consistently and systematically collected program data for evaluation and planning purposes.
The City's new initiative to participate in ICMA's performance tracking and management provides the Department the imperative to collect data to align with ICMA's requirement.
14
Recreation Program LOS
The current Parks and Recreation Master Plan does not provide sufficient direction for recreation programming. The recreation needs of the diverse population segments were not fully articulated.
A city-wide community survey, scientifically conducted, could give us an understanding of the recreation needs of the diverse population segments.
15 Recreation Programming
There are service gaps that need to be addressed. There is a lack of coordinated and effective marketing strategies.
Explore partnership opportunities to support programming. Need to address program barriers.
16 Health and Obesity
According to Tacoma-Pierce County Health Department, our County has some of the highest obesity rate in the State. How can City's park and recreation programs proactively address the issue?
Prevent obesity through health, active living and wellness programs.
17
Pricing Pyramid and Cost Recovery
The Department does not have an adopted pricing policy and has not fully articulated cost recovery targets for various types of programs and services.
Understanding the pricing philosophy and adopting a pricing pyramid could help staff develop programs with cost recovery targets in mind.

91
No Area of Concern Issue Opportunity
18
Senior Activity Center
Being a tenant inside the County-owned Lakewood Community Center has posed some constraints on the utilization of the senior activity center and the expansion of services.
Review the future of the senior activity center in relation to the rest of the Lakewood Community Center. Could the center be relocated elsewhere to form part of a multi-purpose center serving the entire community?
19 Sports Facilities
Future needs for sports facilities have to be determined.
Assess future needs in response to current use and trends.
20 Park Security
There are perceived safety concerns throughout the City and in our parks. Organized neighborhood watches have minimal success.
Assess public perceptions and issues of park safety through a scientific community survey.
21 Park Maintenance
Once the new park classification is developed, the maintenance level of service should be reviewed to ensure consistencies.
Develop park and facility maintenance level of service standards to reflect park use and function.
22
Deferred and Preventive Maintenance
Little work has been done to identify deferred maintenance needs and proactively take care of City assets. A Depreciation Account has not been created for park assets.
Taking care of what the City has will demonstrate to the public that the Department is a good steward of City’s resources and assets.
23 Sustainable Funding
Finding sustainable funding to operate park and recreation services remains a challenge under City operation.
Explore options to support park and recreation operation. Separating park and recreation services from the City operation could have new potentials for sustainable funding.
24 Policies and Procedures
While Parks Division has developed standard operating procedures for park maintenance, the Department, in general, does not have a comprehensive set of policies and procedures to guide the businesses and their operation.
Identify policies and procedures needed to improve the effectiveness and efficiency of the Department.

92
No Area of Concern Issue Opportunity
25 American Disability Act (ADA) Compliance
The City had recently completed a thorough ADA facilities update with Department of Justice. Only two sites, Harry Todd waterfront and American Lake waterfront, were found inaccessible. Unless funding is available to proactively address these two sites, parks and facilities will comply with ADA requirements only when improvements and redevelopments occur.
Address ADA issues through a transition plan update process, and consider including ADA projects in City's Capital Improvement Program.
26 Performance Management
Performance tracking for benchmarking is not practiced.
The City is now moving towards the tracking of performance through ICMA Center of Performance Management. There is an opportunity for the Parks, Recreation and Community Services Department to develop and collect additional performance indicators that could affect City-wide performances.
Note: All issues above were identified through various sources, such as city-wide document reviews, Legacy Team member input, and interviews with members of the City Council, Legacy Team and key City staff.
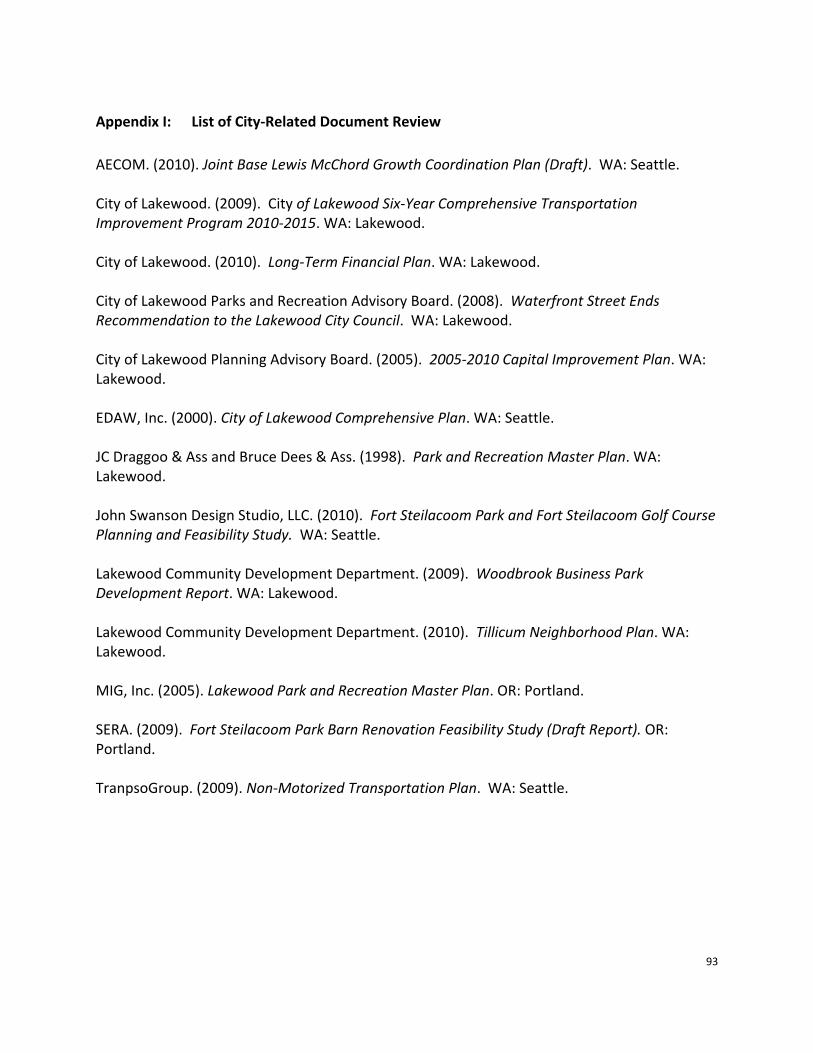
93
Appendix I: List of City‐Related Document Review
AECOM. (2010). Joint Base Lewis McChord Growth Coordination Plan (Draft). WA: Seattle. City of Lakewood. (2009). City of Lakewood Six‐Year Comprehensive Transportation Improvement Program 2010‐2015. WA: Lakewood. City of Lakewood. (2010). Long‐Term Financial Plan. WA: Lakewood. City of Lakewood Parks and Recreation Advisory Board. (2008). Waterfront Street Ends Recommendation to the Lakewood City Council. WA: Lakewood. City of Lakewood Planning Advisory Board. (2005). 2005‐2010 Capital Improvement Plan. WA: Lakewood. EDAW, Inc. (2000). City of Lakewood Comprehensive Plan. WA: Seattle. JC Draggoo & Ass and Bruce Dees & Ass. (1998). Park and Recreation Master Plan. WA: Lakewood. John Swanson Design Studio, LLC. (2010). Fort Steilacoom Park and Fort Steilacoom Golf Course Planning and Feasibility Study. WA: Seattle. Lakewood Community Development Department. (2009). Woodbrook Business Park Development Report. WA: Lakewood. Lakewood Community Development Department. (2010). Tillicum Neighborhood Plan. WA: Lakewood. MIG, Inc. (2005). Lakewood Park and Recreation Master Plan. OR: Portland. SERA. (2009). Fort Steilacoom Park Barn Renovation Feasibility Study (Draft Report). OR: Portland. TranpsoGroup. (2009). Non‐Motorized Transportation Plan. WA: Seattle.

94
Appendix J: Community Benefits Built Around the Four Pillars of Sustainability
Environmental:
• provide connected greenways and an open space system to connect off‐street multi‐purpose trails with on‐street non‐motorized trails
• provide urban linear park and amenities to complement “complete streets” and encourage walkability
• protect habitat corridors and other environmentally sensitive areas • preserve shorelines and critical areas • promote environmental education and outdoor awareness • take leadership in environmental stewardship • protect the needs of the future generation through open space acquisition and
conservation Economical:
• contribute towards city’s economic development by improving the quality of life of residents and workers
• support smart growth • boast property values by providing safe and clean parks and open space; • generate economic impacts by bolstering Fort Steilacoom Park • generate revenues through diverse recreation offerings and improved cost recovery • find sustainable finances to fund parks and programs • reduce health cost impacts by addressing obesity
Social:
• create livable communities through the provision of welcoming and well‐maintained parks and facilities;
• promote social equity through affordable, inclusive and accessible offerings • connect and involve people through parks and recreation opportunities • build strong communities, trusting relationships and social support • complement and support smart growth/ sustainable urban development • create positive health impacts through active living opportunities
Cultural:
• promote arts and culture to enrich the quality of life of the citizens • provide cultural events to celebrate the sense of place and community identify • preserve park history by adding a dimension to city‐wide historic preservation • foster community arts in public parks and open space • celebrate cultural diversity through parks and recreation opportunities

95
THE FOUR PILLARS OF SUSTAINABILITY

96
(This page is intentionally left blank.)