lecture 4 - geovisualization
TRANSCRIPT

Lecture 4 - Geovisualization
Module 2

A. Data types
B. Data collection
C. Effective communication
D. Data visualization
A. B. C. D.
0% 0%0%0%
A. Refers to techniques to
encode data as visuals
B. Helps choosing the best
design
C. A way to present data
A. B. C.
0% 0%0%
A. Make it colourful
B. Make the message clear
and effective using
graphics
C. Hide the facts from the
audience
A. B. C.
33% 33%33%
15
A. True
B. False
A. B.
50%50%
15

A. True
B. False
A. B.
50%50%
15

A. Number and title
B. Number, title and column
headings
C. Title and column
headings
D. Source, column headings,
title and number
A. B. C. D.
25% 25%25%25%
15
A. True
B. False
A. B.
50%50%
15

A. Chart type design, axis scale and labels, data labels, formatting captions
B. Chart type recommended by Excel
C. Chart axis, data labels and right colour
A. B. C.
33% 33%33%
15

“Geo”: from Greek “gē” - earth

… or Geographic visualization:
maps and graphics are used to gain insight
from geographic information (supported by
spatial data)
"Hekateaus7m" by Dariusz Ciach, 2003. Licensed under CC BY-SA 2.5 via Wikipedia - http://en.wikipedia.org/wiki/File:Hekateaus7m.jpg#/media/File:Hekateaus7m.jpg
Hecatæus's map (500 BC)
Describes the earth as a circular plate with an encircling Ocean and
Greece in the centre of the world.
As many other early maps in antiquity his map has no scale.
Units of measurements: "days of sailing" on the sea and "days of
marching" on dry land.
The purpose of this map was to accompany Hecatæus's geographical
work that was called Periodos Ges, or Journey Round the World.

John Snow’s map showing the clusters of
cholera cases in the London epidemic of 1854
Dr. Snow was able to establish a geographic
association between cholera cases and a water
pump by visual analysis of its location.
This pattern was then used to infer the relationship
between the disease and drinking water.

https://www.youtube.com/watch?v=Nun95_cQzBg
Maps provide a spatial context that aids
information-processing and visualization.
This has a huge impact on the world today
where most decisions are data-driven and rely
on visuals to facilitate that process.
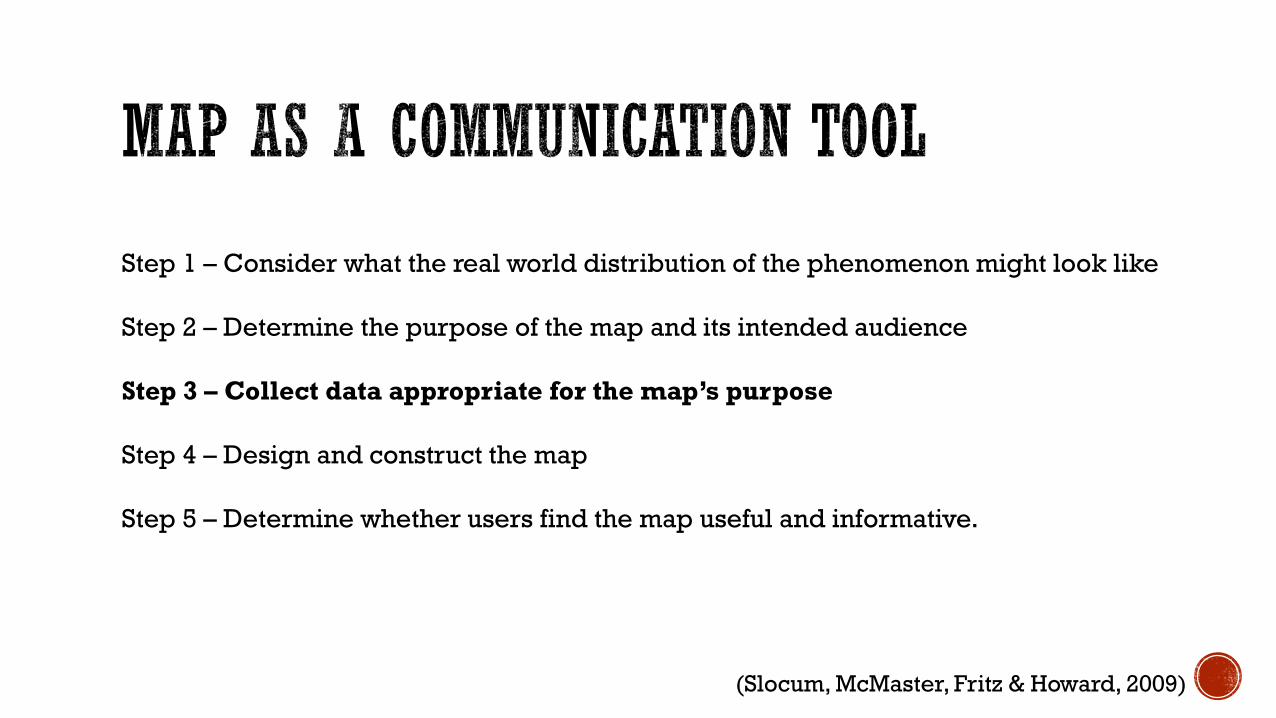
Step 1 – Consider what the real world distribution of the phenomenon might look like
Step 2 – Determine the purpose of the map and its intended audience
Step 3 – Collect data appropriate for the map’s purpose
Step 4 – Design and construct the map
Step 5 – Determine whether users find the map useful and informative.
(Slocum, McMaster, Fritz & Howard, 2009)
Spatial is often used interchangeably with geographic:
geographic refers to the Earth’s surface and near-surface whereas spatial refers to any
space, not only the space of the Earth’s surface.
Geospatial data is a compromise between these two concepts.
Geospatial data must contain a location and that could be an address or coordinates.

Geospatial data can be geographically referenced or georeferenced.
Georeferencing: act of assigning locations to data
Examples:
• Giving names to places is the simplest form of georeferencing (e.g. street
address)
• Metric georeference (geographic coordinate systems)

• Geographic information (values, character strings or symbols that convey to the
user information about the location of the feature being observed)
• Temporal information (a record of when the data was collected)
• Thematic information (description of the real-world feature to which the data refers
- attributes)
The ingredients we need for a Geospatial Revolution!

• Environmental resources
• Utilities (gas, water, electricity
lines, cables namely the location
of these networks)
• Administrative, survey and census
data
• Topography
• Remotely sensed data (data
captured by satellites)

Objects (vector data in GIS – points, lines, polygons)
Or
Layers (raster data in GIS - cells/pixels with a specific width and height, displayed
in a grid)
Adequate representation depending on the application:
urban planning, civil engineering, public services, medical and humanitarian
organizations, business

• Geospatial data can be generated from already available sources such as
satellite images and maps or it has to be collected in the field.
Remotely sensed data (satellite images, LIDAR, aerial photographs) and digitized
and/or scanned maps provide geospatial data for larger areas and/or when specific
thematic data is required.
Field data needs to be collected when data does not exist in any other format or it is
not provided with the required spatial and temporal resolution.
Two important types of field data are survey data and Global Positioning Systems
(GPS) data.

Using remote sensing (satellite
images) for land use mapping –
thematic geospatial data (raster)
http://www.earthzine.org/wp-content/uploads/2014/07/photo-333.png
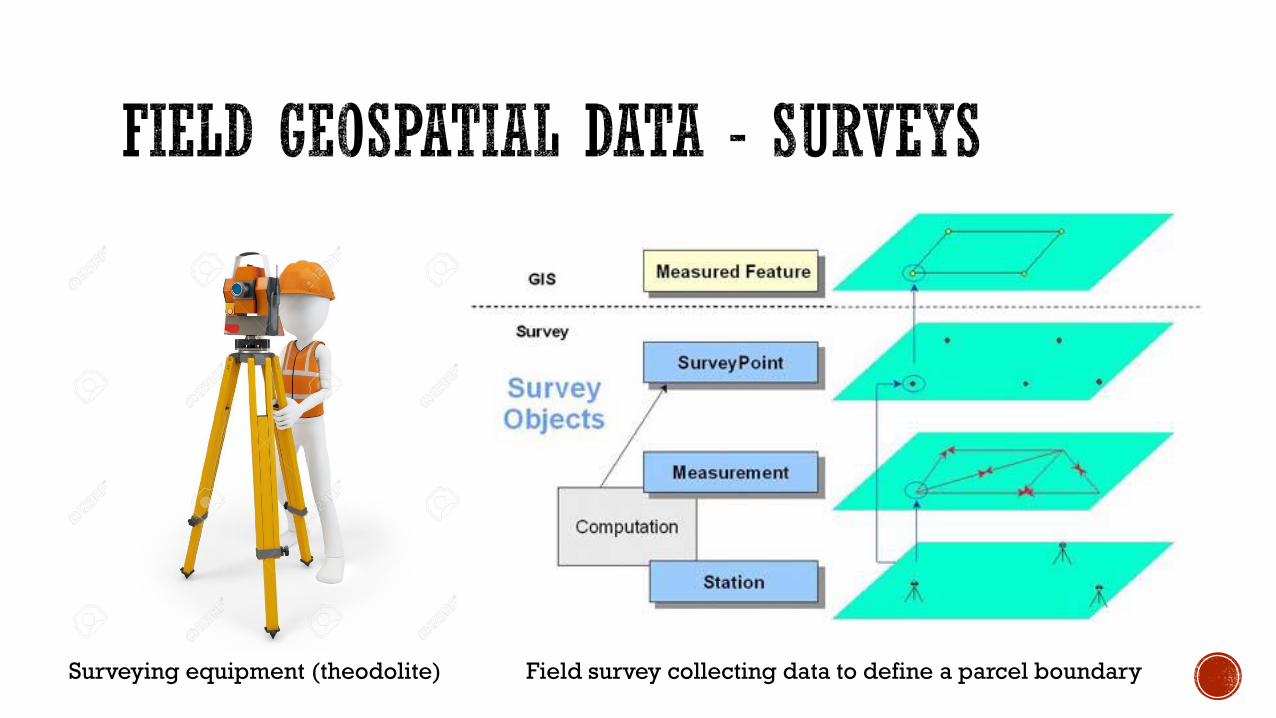
Surveying equipment (theodolite) Field survey collecting data to define a parcel boundary

http://cdn.screenrant.com/wp-content/uploads/James-Bond-Gadget-GPS.jpg
http://jamesbond.wikia.com/wiki/Goldfinger?file=Bon
d_18_Now_Pay_Attention_%28Goldfinger%29
https://www.youtube.com/watch?v=Kns0-V_sXLQ
http://www.pushing-pixels.org/wp-content/uploads/2013/04/skyfall-maps.jpg
https://storyfountain.files.wordpress.com/2012/11/darker-2.jpg

GPS data is collected using a portable device that
can be easily carried around
GPS devices are used for many
purposes and not only to collect field
data
GPS applications can be grouped into
five broad categories:
location, navigation, tracking, timing
and mapping
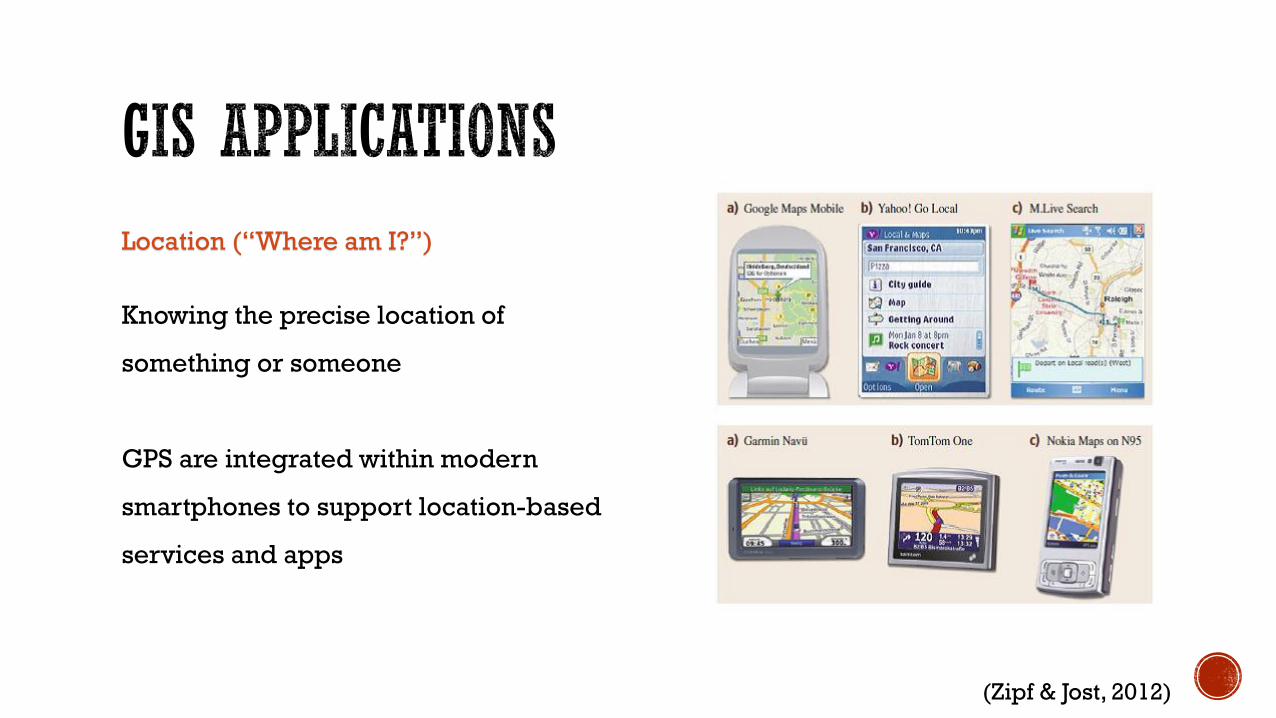
Location (“Where am I?”)
Knowing the precise location of
something or someone
GPS are integrated within modern
smartphones to support location-based
services and apps
(Zipf & Jost, 2012)
Navigation (“Where am I going”?)
GPS technology is broadly used for navigation on water, in the air and on the land.
It provides navigation information to establish routes to reach specific locations.
Tracking (“Where is it going?”)
GPS tracking is the process of monitoring it as it moves along.
GPS used in conjunction with other software can provide the backbone for systems
tailored to applications in agriculture, mass transit, urban delivery, public safety,
and vessel and vehicle tracking
http://www.bbc.co.uk/britainfromabove/stories/visualisations/taxis.shtml

Timing ("When will it all happen?")
GPS is used to disseminate precise time, time
intervals, and frequency. GPS makes the job
of "synchronizing our watches" easy and
reliable.
Mapping (“Where is everything else?”)
Mapping uses geospatial data collected by
GPS to create maps and models of the real
world from “mountains, rivers and forests”, to
“roads, routes and city streets” and even to
“endangered animals, precious minerals and
natural disasters”. http://www.avenza.com/pdf-maps/features

Global Positioning Systems (GPS) use
signals from satellites to uniquely identify
a location anywhere on Earth, 24 hours a
day, in any weather condition
https://doms.csu.edu.au/csu/thumbs/
ae5d79f0-a5e0-4768-8883-
3ba17231e855/1/3cda58d8-da76-437f-
a279-e77274ce7bde
SATELLITES

• Satellite is an artificial body placed in orbit round the Earth to collect location data
• Launched as rockets to a very precise orbit
• Positions are exact and are constantly monitored (by ground stations)
• Powered by solar energy
• Weights approximately 900 kg and is about 5 m across with the solar panels
extended
• Transmit radio signals to communicate with receivers

About 40 years ago, GPS was created as the first
satellite navigation system (NAVSTAR).
It was developed by the US Department of
Defence (it was originally intended for military
applications but, in the 1980s, the government
made the system available for civilian use).
https://doms.csu.edu.au/csu/thumbs/5ea5fd2c-be78-47fd-a24e-b7f655341a1f/1/a5c5d1cb-41c2-4459-8ff2-83a65fa17047
Other additional systems have been developed by
other countries so, today, many other satellites
populate the Earth’s orbits forming a satellite
constellation known as the Global Navigation
Satellite Systems (GNSS).

Multi-constellation GNSS first became widely available in 2010/2011, but only as two
constellations: GPS and GLONASS (the Russian system).
In 2012, the European system Galileo and the Chinese system BeiDou started
operating too.
• More satellites are available to send signals to the receivers therefore increasing
the accuracy of positioning.
• On average there are between 5 and 8 satellites visible in the sky at any time from
any point on Earth.
• With the development of the multi-constellation GNSS we can expect this number
increase to up to 20 satellites by 2020.

Monitor GPS satellites, check their
vitality and exact position in space,
calibrate their signals for time and
place, manage accuracy available
to users
https://doms.csu.edu.au/csu/thumbs/c1d705b7-f478-4b1a-840f-d3e39637acaa/1/7ebc04dd-299c-4bbf-bf31-568ba7052820

https://doms.csu.edu.au/csu/thumbs/cd63f304-04ca-4189-9adf-df92ca692caa/1/20782c83-2def-4096-8e00-5792a29ab66b
• A handheld, or a device mounted on a vehicle, plane,
boat; or a unit displaying position, speed and
navigation.
• Using GPS satellites in space as reference points, a
GPS receiver can determine its precise position on
the Earth’s surface.
• GPS data includes horizontal location based on a
geographic (latitude, longitude) or projected
(eastings, northings) coordinate system and, if
available, the height (z) of the point location.

Satellites and receivers transmit similarly coded radio signals.
The time delay between transmission and receipt of the signals gives the distance between the
satellite and the receiver.
• The time difference tells the GPS receiver how far away the satellite is.
• With distance measurements from a few more satellites, the receiver can determine the
user's position and display it on the unit's electronic map.
• A GPS receiver must be locked on to the signal of at least three satellites to calculate a 2D
position (latitude and longitude).
• With four or more satellites in view, the receiver can determine the user's 3D position
(latitude, longitude and altitude).
• A GPS user will see a position fix displayed on their receiver. The accuracy obtainable from
GPS receivers ranges from 100 m to as little as a few millimetres depending on the type of
technology installed.

https://doms.csu.edu.au/csu/thumbs/ed6ece58-c9a8-47b7-b2ce-8c632303cca6/1/b3f4a506-7b12-43f9-a50a-ecf10820095c
The basis of GPS is triangulation from satellites
(or trilateration - method of determining the
relative positions of objects using the geometry of
triangles)
To "triangulate," a GPS receiver measures distance
using the velocity and travel time of radio signals.
Distance = Velocity * Time
Velocity of light Time it takes for the
signal to arrive at
the receiver
DISTANCE
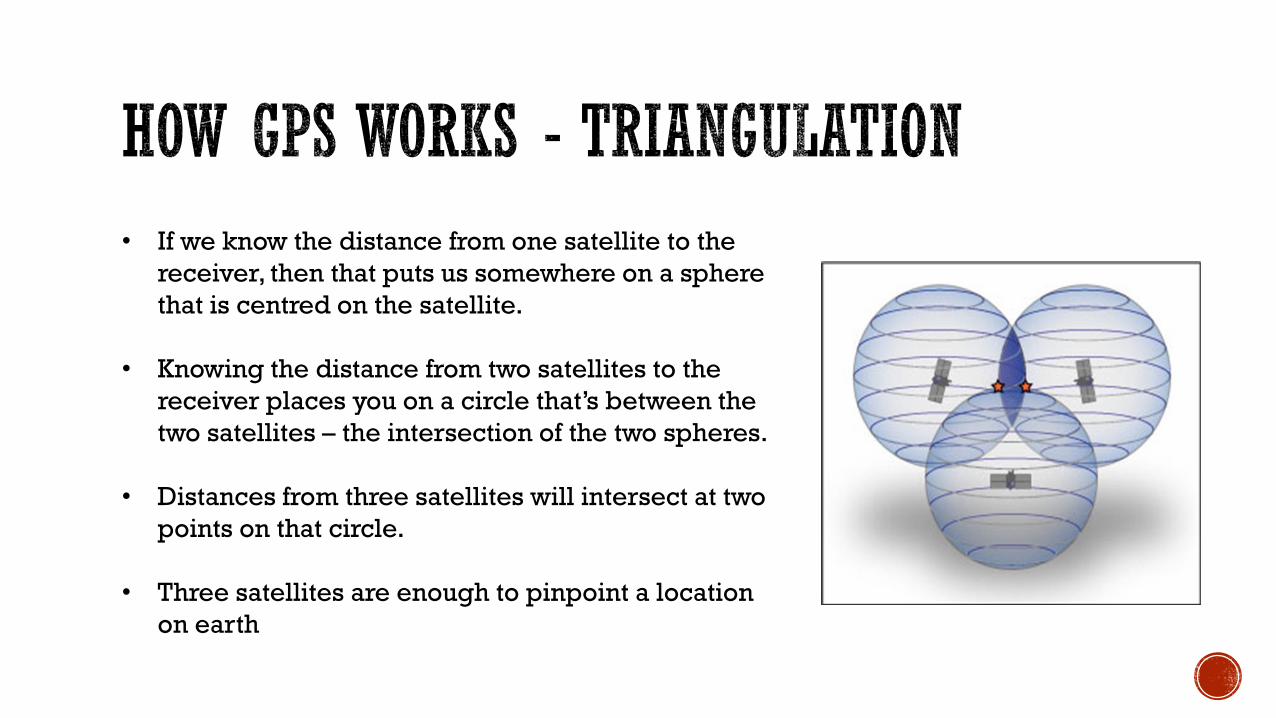
• If we know the distance from one satellite to the
receiver, then that puts us somewhere on a sphere
that is centred on the satellite.
• Knowing the distance from two satellites to the
receiver places you on a circle that’s between the
two satellites – the intersection of the two spheres.
• Distances from three satellites will intersect at two
points on that circle.
• Three satellites are enough to pinpoint a location
on earth

• Both the satellite and the receiver are synchronised – the difference (in sync) of
the receiver time and the satellite time tells us the travel time.
• Each satellite has a unique code (a Pseudo Random Code) – this code is used to
figure out the difference in synchronisation.
• Timing on the satellite side is almost perfect because they have incredibly
precise atomic clocks on-board. Clocks in receivers are less accurate.
• An error of a thousandth of a second translates to 320km.
• Three satellites can locate a unique point on earth. Adding a fourth satellite can
correct for timing errors.

Despite 24-hour global coverage, GPS use can be hampered by certain factors
that can degrade the GPS signal and thus affect accuracy.
• Atmospheric errors
• Signal multipath
• Receiver clock errors
• Orbital errors
• Number of satellites visible
• Satellite geometry/shading
Accuracy errors around 10 m

• Atmospheric errors
The speed of light (velocity) is used to calculate the distance between satellites and
receivers. A GPS signal has to pass through the ionosphere and the troposphere,
which introduce errors in the calculation.
• Signal multipath
The GPS signal is reflected off objects such as tall buildings, trees or large rock
surfaces before it reaches the receiver. This increases the travel time of the signal
thereby causing errors.

• Receiver clock errors
A receiver's built-in clock is not as accurate as the atomic clocks onboard the GPS
satellites which introduces very slight timing errors.
• Orbital errors
These include inaccuracies of the satellite's reported location (to be corrected by
ground stations).
• Number of satellites visible
The more satellites a GPS receiver can "see," the better the accuracy. Buildings,
terrain, electronic interference, or sometimes even dense foliage can block signal
reception, causing position errors or possibly no position reading at all.
• Satellite geometry/shading
This refers to the relative position of the satellites at any given time. Ideal satellite
geometry exists when the satellites are located at wide angles relative to each other.
Poor geometry results when the satellites are located in a line or in a tight grouping

• Many of the errors can be removed or
reduced using Differential GPS (DGPS).
• Differential GPS techniques require two
receivers, one fixed at a known location (the
base station) and the other at an unknown
location (the roving receiver):
one receiver measures the timing errors and
provides correction information to other
receivers that are roving around.
https://doms.csu.edu.au/csu/thumbs/1c21d3a8-0cfe-42a7-b65b-58ccd4ccdede/1/f4457424-7c30-4c01-b518-8d59b37205c8
• Using its known position the reference
receiver can calculate what the travel time of
the GPS signals should be.
• The reference receiver computes error
correction factors for all visible satellites.
These correction factors are then available to
GPS receivers covered by the reference
station
Next lecture:
Geographic coordinate system
Projected coordinate system
Effective maps
- This lecture is included in
Module 2.
- GPS apps for outdoor
activity:
Polaris Navigation GPS
(Android)
GPS Receiver HD (iphone)