lecture 14_2010_niosi impp
TRANSCRIPT

7/28/2019 Lecture 14_2010_Niosi IMPP
http://slidepdf.com/reader/full/lecture-142010niosi-impp 1/19
250 INNOVATION: MANAGEMENT, POLICY & PRACTICE Volume 12, Issue 3, December 2010
E conomic development is primarily depend-ent on the adoption and creation of tech-
nological innovation. The nuts and bolts of
innovation systems are institutions, and morespecifically those institutions that are related tothe production, diffusion and transfer of sci-
ence, technology and innovation. The properfunctioning of these institutions is thus essen-
tial for economic development. However, the
right science, technology and innovation (STI)institutions are not always in place, particularly
in developing countries (LDCs). This paperexamines STI institutions in less developed
countries from the perspective of evolutionary economics, and compares them with those in
industrial countries. The central hypothesis is
that in LDCs these institutions are either absent
or highly inefficient, particularly policy incen-
tives for private R&D. The first section of thispaper recalls some basic notions of evolutionary economics, and introduces the evolutionary
approach to public policy. The second sectionpresents some STI institutions in industrial
nations. The third introduces the corresponding institutions in developing countries, and argues
that they are fairly inefficient and poorly fund-
ed. The public policy implication is that inorder to accelerate growth, developing countries
need to carefully evaluate, revamp and nurturetheir STI institutions.
Copyright © eContent Management Pty Ltd. Innovation: Management, policy & practice (2010) 12: 250–268.
Rethinking science, technology
and innovation (STI) institutionsin developing countries
JORGE NIOSI
Professor, Department of Management and Technology, Université du Québec à Montréal,Canada Research Chair on the Management of Technology, Montréal, Québec, Canada
ABSTRACTDeveloping countries need appropriate science, technology and innovation (STI) policies in order to absorb, diffuse and master advanced knowledge that fosters growth. They also need them inorder to nurture new dynamic sectors. In many developing countries, public expenditures on R&D are invested in university research and public laboratories. Industrial R&D is most often lagging behind, in spite of several government incentives. Business expenditures on R&D (BERD), as a consequence, are small in absolute terms and as a percentage of GDP. The paper suggests that sever-al factors explain this situation, including badly designed incentives, reduced government commit-ment to these incentives, lack of appropriate vertical STI policies, and high levels of causal
ambiguity around specific policy incentives. This paper argues that increased government commit-ment, policy evaluation and the implementation of vertical STI policies aimed at creating new sec-tors can solve the technological stalemate.
Keywords: Science, technology and innovation institutions; development planning and policy;
technological change; research and development; business expenditures; vertical STI policies

7/28/2019 Lecture 14_2010_Niosi IMPP
http://slidepdf.com/reader/full/lecture-142010niosi-impp 2/19
1. EVOLUTIONARY ECONOMICS,COMPLEX ADAPTIVE SYSTEMS,INSTITUTIONS AND LEARNING
Economic development and catching up are lessabout increasing productivity in existing sectors
than about adding new sectors to the economy (Saviotti & Pyka, 2004). Developing countries
will not catch up with rich ones by just produc-ing more minerals or agricultural products, or by
producing them more efficiently; they will needto add other industries to the economy. More
precisely, LDC need to incorporate new andmore dynamic sectors, particularly those based
on advanced technologies, to compensate for
declining non renewable natural resources, as well as for wild fluctuations on the prices of
resources. Also, these resources set a clear limit tothe possible growth of LDC. Today, the only
countries that are converging with developedones are those of South and South East Asia and
they are doing so not by exploiting static com-parative advantages provided by resources, but by
continuously adding new sectors, from software
and automobiles in India to ICT and cars in
Korea, to anything in China.However, market forces alone will not produce
medium and high technology sectors in LDC.
Fairly sophisticated institutions are required toattract high-quality investments, absorb foreign
technology and create human capital and new technology.
Institutions and systems of innovation
Evolutionary economics and management, in allits different schools and currents, has argued thatinstitutions are those regular patterns of behaviour
that constitute the canvass of society (Hodgson,1999; Nelson, 2005). Institutions fulfil important
roles. They gather and process information then
make it accessible to economic agents. They pro-vide rules and norms. At the same time, they con-
strain and enable action because they allow theanticipation of the behaviour of other agents.
National systems of innovation (NSI) are setsof institutions that contribute to the creation,
adoption, diffusion and transfer of new productsand processes. The core of these institutions is
research universities, public laboratories, innova-
tive enterprises, venture capital firms and thoseorganisations, public or private, that support,
finance and regulate the production of scienceand technology (Freeman, 1987; Lundvall, 1992;
Nelson, 1993). National STI policies are a centralcomponent of the NSI.
Yet most NSI are collections of sectoral systemsof innovation (SSI) (Malerba, 2004). These SSI
are the industries, as well as their supporting insti-
tutions, in which each country innovates. Eachadvanced and emergent country is composed of a
small number of innovative sectors. In Finland,telecommunications equipment represents over
50% of the country’s R&D. In Singapore, infor-mation and communication technologies (ICT)
and the bio-pharmaceutical industry representover 90% of the country’s industrial R&D effort1.In Canada, aerospace, pharmaceutical products,
software and telecommunication equipment rep-
resent close to 80% of industrial R&D. As Archibugi and Pianta (1992, 1994) have shown,smaller countries tend to be more specialised than
larger ones, and all industrial countries reinforcetheir specialisation through time. Only very large
countries, such as the United States, need not to
specialise in a few sectors.Most authors bundle together very different
kind of institutions. In this paper, four types of
innovation institutions are to be distinguished. Itis useful to keep the distinction in mind becausethey are fairly different from one another and they
evolve under very different sets of conditions:1. Public policies, first, are rules or norms
designed and implemented by governments, andare thus most often compulsory. Policies evolve
through several patterns and mechanisms. Policy
analysts suggest that policy implementation occursby small additions of policy evolution followed by
251
Rethinking science, technology and innovation (STI) institutions in developing countries
Volume 12, Issue 3, December 2010 INNOVATION: MANAGEMENT, POLICY & PRACTICE
1 It is worth recalling that the median country has a population of around 4.5 million, like Finland, Ireland or Singapore.
7/28/2019 Lecture 14_2010_Niosi IMPP
http://slidepdf.com/reader/full/lecture-142010niosi-impp 3/19

7/28/2019 Lecture 14_2010_Niosi IMPP
http://slidepdf.com/reader/full/lecture-142010niosi-impp 4/19
The government sector is a system in itself, where information keeps flowing in, agents learn,
and novelty occurs in missions, personnel, poli-
cies, and routines. Ideally, policy implementa-tion, including STI policy, occurs through a
four-stage process:I. Identification of system or market failures,
usually by the top levels of bureaucracy andgovernment
II. Determination of goals and prioritiesIII. Policy design and implementation, and even-
tual creation of public bodies or adding mis-sions to existing ones
IV. Policy evaluation and reformulation (Sabatier,
1999)
All these stages require a continuous flow of information in the form of data provided by statis-
tical agencies and departmental studies, bench-marking exercises comparing the specific incentives,
investments and outcomes of different policy schemes, with those in different countries and
regions. Figure 1 summarizes the policy process.
2. STI INSTITUTIONS IN INDUSTRIALCOUNTRIES
In industrial countries, STI institutions have
developed through decades of trial and error,redesigning and tinkering. If one were to pinpoint
a major landmark in government intervention for
the promotion of research in industry, the 1945
253
Rethinking science, technology and innovation (STI) institutions in developing countries
Volume 12, Issue 3, December 2010 INNOVATION: MANAGEMENT, POLICY & PRACTICE
Policy design
Policyimplementation
Institutionaland economic
change
Benchmarking
Benchmarking 2
Problemidentification
Policyevaluation
FIGURE 1: THE POLICY PROCESS
Report to the US President by Vannevar Bush would certainly be close to the top of the list:
The most important ways in which the Gov-
ernment can promote industrial research are toincrease the flow of new scientific knowledge
through support of basic research and to aid inthe development of scientific talent. In addi-
tion, the Government should provide suitableincentives to industry to conduct research.
(Bush, 1945)
The incentives that governments designed werenot optimal, but they attained their goals in a
fairly satisfactory way. History explains why simi-
lar incentives display a particular set of character-istics in one country as opposed to other ones.
Later on, Romer (1986) gave this idea a more ele-gant treatment: scientific and technological
knowledge was the source of increasing returns.Rediscovering Schumpeter, he understood that,
for capitalism to grow, science and technology needed to be internal or endogenous to the busi-
ness enterprise (Rosenberg, 2000).Many authors have underlined the key role of
STI institutions in economic development. In thesystems of innovation current, Crow and Boze-man (1998), Nelson (2005), Mazzoleni and Nel-
son (2007), among others, have studied the key role of public research laboratories and universi-
ties in economic development. Aghion et al.(2009) have related the performance of academic
institutions to their autonomy and competitionfor financial support.
The World Bank (WB) has also emphasized therole of such institutions as contract enforcement,intellectual property rights, and democratic
processes. The WB suggested that there is a uniqueset of institutions (‘one size fits all’) that represents
the pre-condition for development. On the con-trary, other authors have brought evidence against the theory that democratic institutions and therule of law cause economic growth. Conversely,
they argue: (a) human capital is a more basicsource of growth than are (democratic) institu-
tions; (b) ‘poor countries get out of poverty

7/28/2019 Lecture 14_2010_Niosi IMPP
http://slidepdf.com/reader/full/lecture-142010niosi-impp 5/19
through good policies, often pursued by dictators’;and (c) only later do countries improve their polit-
ical institutions (Glaeser et al., 2004). The authors
recall that South Korea, Taiwan and China havegrown rapidly under dictatorships and only then
the first two adopted democratic institutions. Insum, not all institutions support growth, but only
those related to the production, the absorptionand the use of human capital in the public and
private sectors. And innovation systems theory suggests that each developed country has devel-
oped its own set of STI institutions, none of thembeing optimal but just satisfactory and more or
less adapted to the country’s historical conditions.
Each developing country needs to invent its owninstitutional road to economic growth.
These STI institutions, are mainly composedof sets of horizontal and vertical policies, as well
as science and technology organizations such uni-versities and public laboratories, and routines for
the generation of innovation in business firms,academic and research organisation. These insti-
tutions are extremely diverse from country tocountry. Let’s pinpoint some central differences
among industrial countries and their institutions.
2.1 Horizontal and vertical policiesTwo main types of STI policies are to be differen-tiated. Horizontal STI policies are those that
apply equally to all industries, without targeting
any sector. Tax credits for R&D are the archetyp-al horizontal policy. Many public subsidies for
R&D in smaller firms are of a similar nature. The
main advantage of such policies is that they apply to all firms. They are easy to implement and they do not often establish a basis for political corrup-
tion. However, they cannot be used as an incen-tive to support the growth of a particular
industry. If a developing country wants to avoid a dispersion of efforts in many different industries,
and intends to establish comparative advantages
in one or several sectors, it will need to add a setof vertical policies applying to the desired sector.
Vertical (or targeted) policies are those thatapply to a particular industry or sector. A National
Biotechnology Policy (such as those implementedin Canada, in 1983, or Singapore in 1988) may
be a typical example. The principal advantage of a targeted policy is that it concentrates resources in
the sector the country wants to nurture.
Is there a right sequence in STI policy imple-mentation? Are horizontal policies to be imple-
mented before vertical policies, concurrently withthem, or after them? The empirical evidence reveals
different patterns. Sometimes, though not often,governments have a clear idea of sectors whose
growth needs to be stimulated, due to the resources(existing or potentially accessible) and historical
dynamic or static advantages of the country; in
these cases it is possible to develop concurrently horizontal and vertical policies. In the late 1940s
and 1950s, Canada implemented at the same timehorizontal policies (tax credits for R&D and subsi-
dies for SME’s R&D) and vertical policies (giving priority to aerospace, nuclear energy and telecom-
munications). Later on, in the 1980s, it choseadvanced materials, biotechnology and software. In
the 1980s, Ireland chose the software industry, andonly then implemented horizontal policies (i.e., tax
credit for R&D in 2004). In terms of horizontalpolicies, Finland has no R&D tax credits but a
sophisticated grant system. The country selected
communications equipment out of Nokia’s success-ful experience in the industry; it is now trying to
diversify in other industries through its governmentinnovation fund (Sitra) and granting agency (Tekes)
to avoid extreme reliance on one sector. The UnitedStates has no official technology policy, but chose
agriculture and railways in the 19th century, while itprotected its infant manufacturing industry. In thetwentieth century, the US federal government
picked defence technologies, health and space, which have been among the most subsidized sectors
in that country. Federal US tax credits appeared late
(1981) and do not represent a key policy incentivein the United States. State tax credits appeared in
the US in 1982 in Minnesota; by 2005, 32 USstates had implemented some kind of R&D tax
credit. Direct subsidies to targeted sectors representthe unofficial but very active US technology policy.
254
Jorge Niosi
INNOVATION: MANAGEMENT, POLICY & PRACTICE Volume 12, Issue 3, December 2010
7/28/2019 Lecture 14_2010_Niosi IMPP
http://slidepdf.com/reader/full/lecture-142010niosi-impp 6/19
2.2 Governments learn throughevaluation
Market organizations learn through competition
and market signals. Governments do otherwise. Audretsch et al. (2002) have underscored that
public authorities are accountable to tax payers,and they thus must be able to document their
performance through specific indicators and met-rics. Thus, accountability is at the basis of policy
evaluation. However, the processes through which such evaluations take place are extremely
different from one country to the next. Also, thefunctions of evaluation are variegated. They
include legitimating the policies, improving man-
agement and providing transparency (Becher &Kuhlmann, 1995).
Since the early 1990s, in the United States,the General Accounting Office (GAO) and the
Chief Financial Officer have the mission of eval-uating the performance of government programs.
The goal of the Government Performance andResults Act of 1993 is to increase efficiency and
improve management of the federal agencies and
programs through evaluation by GAO. However,
as Audretsch et al. (2002) have emphasized, data are not always available and not always credible,particularly about such key outputs as externali-
ties and other public benefits.In Germany, evaluation pursued similar objec-
tives of accountability, improvement and trans-parency. However, science indicators and peer
reviews seemed more in use for universities andgovernment scientific organizations, while panels
composed of industrialists assessed the usefulnessof more applied government research institutes.Kuhlmann (1998) emphasized the scattered
nature of these efforts in Germany, as differentprograms and organisations are using different
metrics and indicators. The US evaluation proce-dures, though, seemed no better than the German
ones in terms of homogeneity of procedures, regu-larity of assessments and publication of results.
Smits and Kuhlmann (2004) underlined thefact that financial incentives are most frequently
used to promote R&D. Other STI policies
include regulations, procurement, creation of net- works, and building infrastructure.
A major point goes sometimes unnoticed andneeds to be stressed:
These horizontal and vertical technology poli-
cies generate demand for human capital withinthe firms.
Countries with few or inefficient industrial
R&D policies run the risk of not having demand
for scientists and engineers in industry. Businessorganisations thus become ‘illiterate’ in scientific
and engineering matters. Their absorptive capaci-ty is therefore limited. A few major examples of
STI policies follow.
2.3 Horizontal policies: Tax creditsfor R&D
Tax credits are increasingly adopted as incentives
for R&D in OECD countries. They have severaladvantages over direct subsidies. They do not dis-
criminate in favour of any type of firm, sector, or
region. They are easy to manage and to evaluate.They are less prone to political corruption than
outright subsidies. They do not represent dis-
bursements, so they attract less political opposi-tion than direct subsidies for R&D.
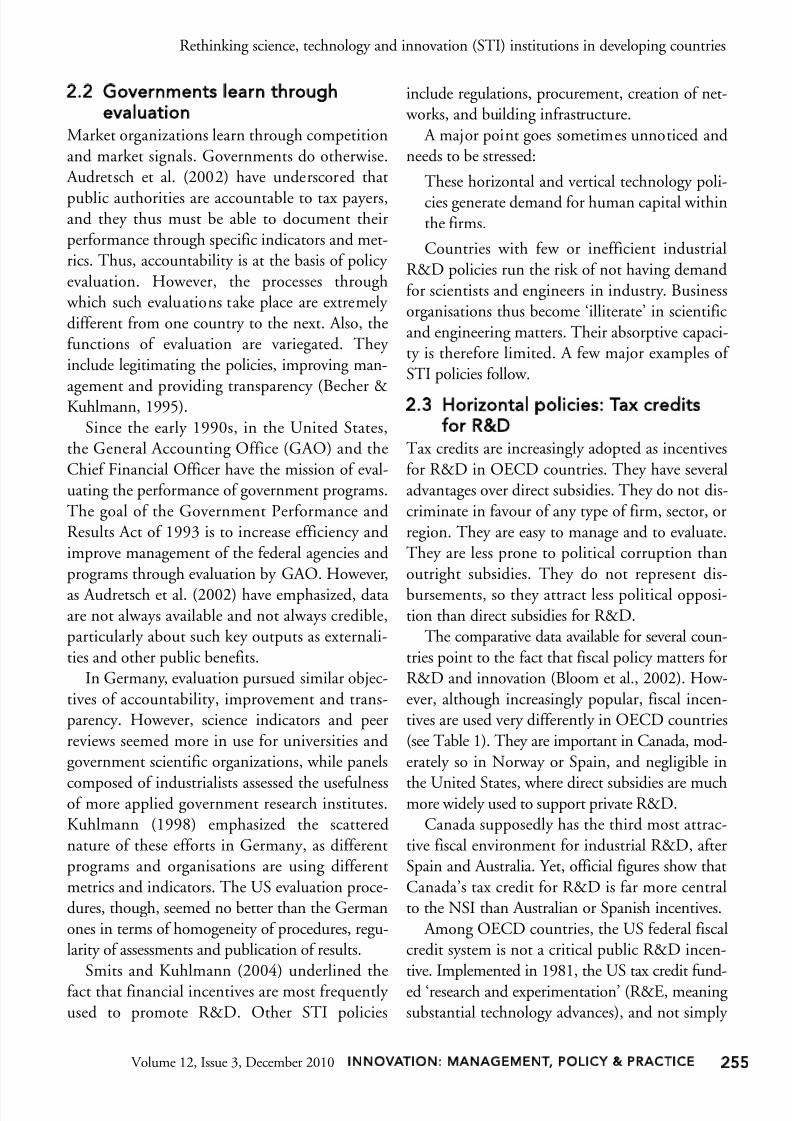
The comparative data available for several coun-
tries point to the fact that fiscal policy matters forR&D and innovation (Bloom et al., 2002). How-
ever, although increasingly popular, fiscal incen-tives are used very differently in OECD countries
(see Table 1). They are important in Canada, mod-
erately so in Norway or Spain, and negligible in
the United States, where direct subsidies are muchmore widely used to support private R&D.
Canada supposedly has the third most attrac-
tive fiscal environment for industrial R&D, afterSpain and Australia. Yet, official figures show that
Canada’s tax credit for R&D is far more centralto the NSI than Australian or Spanish incentives.
Among OECD countries, the US federal fiscalcredit system is not a critical public R&D incen-
tive. Implemented in 1981, the US tax credit fund-
ed ‘research and experimentation’ (R&E, meaning substantial technology advances), and not simply
255
Rethinking science, technology and innovation (STI) institutions in developing countries
Volume 12, Issue 3, December 2010 INNOVATION: MANAGEMENT, POLICY & PRACTICE

7/28/2019 Lecture 14_2010_Niosi IMPP
http://slidepdf.com/reader/full/lecture-142010niosi-impp 7/19
R&D. Besides, the credit only funds up to 20% of any increment over a base R&D figure, not to thetotal R&D expenditure. Thus, if companies do not
increase their expenditure, they have nothing toclaim. Also, during its 25-year history, the law hasbeen changed 11 times making its precise advan-
tages blurrier to innovative companies (Tassey,2007). In addition, the precise calculations of
deductible items are cumbersome for the compa-
nies, and difficult to monitor for the government.Finally, the tax credit is not refundable; it is thus
useless for new small technology firms, such as
biotechnology or semiconductor companies, whichincur losses during several years before turning a profit. On the top of that, the US tax credit system
is not permanent, and has to be renewed every year,therefore it does not help companies wishing to
establish permanent R&D centres in the country.In 2004, over 55% of the credit went to 100 com-
panies and the remaining to slightly more than
10,000 other firms. Tassey (2007) concludes that, at
256
Jorge Niosi
INNOVATION: MANAGEMENT, POLICY & PRACTICE Volume 12, Issue 3, December 2010
TABLE 1: COST OF FISCAL CREDIT FOR R&D I+D,2005, SELECTED COUNTRIES (US$MILLIONS PPP) AND AS % OF GERD
Cost offiscal credit GERD Fiscal credit
(US$ millions (US$ as % of
Country PPP) millions PPP) GERDUSA 5110.0 3,244,664 0.16%
Canada 2290.4 21,777 10.5%
France 1009.9 40,684 2.5%
UK 937.3 35,171 1.13%
Netherlands 419.3 9992 4.2%
Mexico 401.1 5641 7.1%
Australia 355.6 11,751* 3.0%
Belgium 355.4 6434 5.52%
Spain 343.3 13,391 2.56%
Norway 137.0 3396 4.03%Ireland 65.2 2030 3.2%
Argentina** 8.3 854 0.97%
Portugal 3.3 1705 0.19%
Source : OCDE (2007): Science, Technology and Industry Scoreboard , Paris.
* Figures for 2004; ** FONTAR (www.agencia.gov.ar)
best, the federal US tax credit has had a marginaleffect on business expenditures on R&D in the
country. Billings (2003) argues that the ineffective
US tax credit is a deterrent for both foreign anddomestic companies to conduct R&D in the US,
and an incentive for them to conduct R&D abroad.In November 2008, the US President’s Council of
Advisors on Science and Technology recommendedto ‘Update and enhance the R&D tax credit to
make it a more stable and effective incentive forindustry to perform R&D’ (US Council, 2008).
The relative success of Canada’s program for fis-cal credits for R&D, to which close to 20,000
companies of different sizes submit a claim for the
rebate each year, is due to its particular design2
.Large companies may deduct up to 20% of eligible
expenses, and smaller firms are eligible to 35% of up to C$2 million of R&D expenditures. Unused
credits can be carried forward for 20 years andbackwards for three years, and are refundable in
case smaller firms have no tax to pay in a particular
year. The Canadian system is permanent and it hasno limit on the amounts that firms can request,
except for smaller ones, or on the number of firms
that may obtain the credit. Yet the program hasbeen criticised, because smaller companies thatalready entered the stock market are not considered
eligible to the 35% deduction. It was also suggestedthat the C$2 million maximum rebate was too low
for many smaller firms particularly in suchdomains as biotechnology or nanotechnology.
Our short review shows no optimal fiscal credit
programs but many different versions, more or
less adapted to their particular environments. Themuch criticised US tax credit system is partially compensated by more efficient direct subsidies for
R&D, as we see later. To conclude this section, itis worth noting that some countries without any
type of R&D tax credit, such as Finland and Swe-den, rely on direct subsidies for R&D, and are
among the most active in the world in terms of R&D and innovation.
2 In 2004, almost C$ 3.4 billion in assistance was provided to 19,600 companies through the R&D tax credit; 80% of thecompanies were smaller firms and they received some 23% of the tax claims (Canadian Chamber of Commerce, 2007).

7/28/2019 Lecture 14_2010_Niosi IMPP
http://slidepdf.com/reader/full/lecture-142010niosi-impp 8/19
2.4 Horizontal policies: R&D subsidiesfor SMEs
Subsidies for R&D in small firms are a common
STI policy component in all OECD innovationsystems. Their specific policy design varies widely
from one country to the next.In 1962, Canada launched its Industrial
Research Assistance Program (IRAP). Its goal was to‘stimulate wealth creation for Canada through tech-
nological innovation’ and ‘to stimulate innovationin Canadian SMEs’ (NRC, 2010). The program
incorporated several components, including non-refundable R&D subsidies for SMEs, and a tech-
nology counsellor program. Some 260 technology
counsellors visit thousands of SMEs every year andsuggest them technical improvements in products
and processes; they also help SMEs to requestfinancial support either within IRAP or from other
programs, and assist them to find academic or gov-ernment research centres that could conduct collab-
orative R&D with the firms. The latest evaluationof IRAP found that in the 1996–2001 period the
program had funded 12,300 projects that resulted
in over 39,000 innovations; C$11.3 billion of sales
were linked to those IRAP-assisted innovations.In 1982, the US implemented its highly regard-
ed Small Business Innovation Research Act (SBIR)
that launched the SBIR program. The goals of theprogram are ‘to more effectively meet R&D needs
brought on by the utilization of small innovativefirms … and to attract private capital to commer-
cialize the results of Federal Research’ (Wessner,1999: 19). SBIR provides up to US$850,000 for
early stage R&D activities to entrepreneurs or new technology based companies that wish to exploreadvanced technologies. All government depart-
ments with a budget over US$100 million have tocontribute to the program. In fiscal year 2007,
SBIR invested US$1.14 billion, with the Depart-ment of Defence (DoD) representing close to 65%
of all SBIR funds. The requesting companies musthave less than 500 employees, they must conduct
R&D in the United States, be controlled at 50% ormore by their managers or employees (a provision,
though, that makes it difficult to fund SMEs that
have already received venture capital). The programis two-phased. In Phase I, a peer-review committee
assesses the project, and may grant up toUS$100,000 for feasibility studies during 6–12
months. The most promising projects move to
Phase II that funds the primary R&D process fortwo years, the typical grant being $750,000. AfterPhase II, the SMEs are supposed to apply for pri-
vate funds (i.e., venture capital). From 1983–1999,SBIR made 45,000 awards for a total of US$8.4 bil-
lion (1998 dollars). A more recent evaluation, con-
centrated on the DoD, a one billion section, foundthat the program was successful, but did not allow
enough funds for the management and metrics of
the results on a regular basis (RAND Corp, 2006).In 1995, under its worst economic recessionsince World War II, Japan introduced its first law
for the support of innovative SMEs in order to revi-talize the Japanese economy (Eshima, 2003). It was
the Temporary Law concerning Measures forChanging Business in Specific Small and Medium
Enterprises. The program took inspiration from the
US SBIR Program. It encouraged innovationthrough SME cooperation with universities and
public laboratories. Like SBIR, the Japanese pro-gram allocates subsidies in two phases. The main
subsidies are granted in Phase II. In the first threeyears of the program (1995–97), over 3000 SME
were supported, with over ¥61 billion (over US$6billion). These 1995–97 phase II awards included
over US$1 billion for R&D activities in 902 firms,as well as venture capital investments in some 300
SME, for ¥14.2 billion (US$1.4 billion). Japan’s
Small and Medium Enterprise Agency runs theprogram that is now in its 13th year, following sub-stantial improvements, introduced particularly in
1999. The new Law has four goals: promoting business innovation, launching new business start
ups, strengthening the management base of SMEs,
and offering a safety net. By 2007, and thanks tothe government program, over 50% of Japanese
manufacturing SME were conducting R&D and inmost cases it was collaborative R&D, partnering
with universities and public laboratories (JapanSME Agency 2008).
257
Rethinking science, technology and innovation (STI) institutions in developing countries
Volume 12, Issue 3, December 2010 INNOVATION: MANAGEMENT, POLICY & PRACTICE

7/28/2019 Lecture 14_2010_Niosi IMPP
http://slidepdf.com/reader/full/lecture-142010niosi-impp 9/19
2.5 Vertical policies: Biotechnologyand software
Horizontal policies may strengthen existing sec-
tors; they will seldom be a major contributor tothe generation of new ones. For new sectors to
emerge, particularly high-technology ones, scarceresources and sophisticated policies need to be
concentrated in those sectors. Concentration of resources represents, at the same time, investing
in human capital, attracting industrial organisa-tions that will create demand for skilled labour,
and implementing incentives for R&D. At independence, in 1965, Singapore was a poor
South East Asia country, a former British trade
post. With only 310 square miles, and no naturalresources, it may be difficult to understand how it
moved from trading outpost to high-technology manufacturing centre. Since independence, the
government managed to dramatically increase theeducation levels of the population, put English as
the first language of the country, establish a moderninfrastructure and attract overseas industrial compa-
nies. At the beginning, all types of manufacturing
firms from abroad were welcome. By the 1980s,
electronic parts manufacturing emerged as themajor sector in Singapore’s secondary industry. Theindustry required little space and a disciplined and
fairly educated labour force. However, after themid-1980s recession, the government understood
that innovation, R&D and a highly skilled labourforce were essential. Industrial policy turned from
luring MNC’s manufacturing activities to attracting R&D centres and creating national companies in
technology-intensive sectors. Electronic productshad become the leading manufacturing sector.Pharmaceuticals followed suit. While some MNC
were already producing drugs in Singapore, R&D was absent from the country. In 1988, Singapore
launched a National Biotechnology Program, andimplemented a large series of policies to become
one of the major drug development, genetic thera-py and human biotechnology hubs in Asia. New
public laboratories were established and in 2000the Biomedical Sciences Initiative was launched
(Parayil, 2005). Singapore implemented tax holi-
days for MNC establishing drug production and/orR&D in the country. In 2003, Singapore inaugu-
rated the first phase of Biopolis, a major sciencepark dedicated to life sciences, the second phase of
which was completed in 2006. The park is hosting
seven research institutes, legal and patent services,and all types of private firms, from global multina-tionals to emerging start-ups. The total cost of the
Biopolis Park was US$392 million; by the end of 2007, some prominent tenants included Glaxo-
SmithKline (GSK) from Britain, Novartis from
Switzerland, and Takeda (Japan) (JTC, 2007). Atthe end of 2007, Singapore had invested over US$2
billion in these organizations. With a total popula-
tion of 4.5 million, Singapore was also exporting over US$125 billion in high technology products,more than all Latin American countries combined.
In the last 20 years, Israel has become a smallbut active exporter of domestic software products
(Breznitz, 2005). Behind the Israeli software mira-cle one finds a very supportive state, heavily invest-
ing in human capital through education and
attraction of foreign talent. Also, in 1984, the soft- ware industry became eligible to the substantial
direct grants offered by the Office of the Chief Sci-entist. The Israeli government promoted the emer-
gence of a private sector venture capital industry through its 1992–97 Yozma program (Avnimelech
& Teubal, 2005). Israeli venture capital is essen-tially aimed at high-technology new ventures. The
result was a very fast growth of the sector: exportsmoved up from US$90 million in 1990 to US$2.6
billion in 2000 and US$23.6 billion in 2008.
2.6 Horizontal and vertical policies:Public laboratories
In industrial countries, government research labora-tories fulfil many different missions. Some of them
help government in the quest of specific public
missions, such as defence, environment and health(Crow & Bozeman, 1998). Other institutes, such
as particle accelerators or astronomical observato-ries, pursue objectives of basic science. Many are
related to specific industrial sectors such as aero-space, agriculture, biotechnology, energy or tele-
258
Jorge Niosi
INNOVATION: MANAGEMENT, POLICY & PRACTICE Volume 12, Issue 3, December 2010

7/28/2019 Lecture 14_2010_Niosi IMPP
http://slidepdf.com/reader/full/lecture-142010niosi-impp 10/19
communications, and are sometimes part of verticalindustrial policies. The mandates and missions of
these are variegated. At their most basic level, they
include ‘extension’ (the application of agriculturalor industrial best practices through education) such
as teaching farmers how to analyse productionproblems or industrial SMEs how to conduct quali-
ty control. At a higher level, they include conduct-ing R&D on behalf of farmers or manufacturing
firms and transferring the results of the researchproject to them, be it new or improved crops to
farmers or product designs to industry. At its high-est level they could develop entirely new technolo-
gies for government or industry, including satellites,
semiconductor manufacturing processes or chipdesigns, and spin-off new companies for the pur-
pose of transferring them to the private sector.In 2006, federal agencies and federally funded
R&D centres in the United States have spentUS$37 billion in R&D expenditures; this amount
exceeds the total national expenditures of every country in the world except China, Germany and
Japan (National Science Foundation, 2008: 4–12).They accounted for 11% of all US R&D expen-
ditures and were performed in some 800 labo-ratories.
In 2006, Canada’s federal and provincial intra-
mural expenditures on R&D represented some10% of GERD. These more than 100 national
institutes included scientific research organisa-tions (including those working on atomic energy,
defence, health, and space) and more industrially related laboratories such as those working on
biotechnology, communications, construction,and measurement standards.
Also in 2006, in the OECD, the government
sector performed 11% of GERD. Former com-munist countries such as the Czech and Slovak
Republics, Hungary and Poland together withFrance, Italy and Greece were spending well
above the OECD average (OECD, 2008).How did these government institutes perform?
The evaluation of public R&D is not easy and ithas been done using different metrics due to the
very different missions and activities of such
organisations (Georghiou et al., 2000). They go
from counting publication, patents, spin-off com-
panies, new or improved products or processestransferred to companies, as well as networking
activities, to measuring customer satisfaction with
services rendered by the institutes. Also, the evalu-ating agencies vary, from national and internation-al academics, research institutes and consulting
firms (as in Canada or the US), to in-house evalu-ation by the same laboratories, as in Japan.
2.7 ConclusionThrough different horizontal and vertical incen-tives, a set of industrial countries has managed to
attain some level of endogeneity in the produc-tion of innovation. In these countries, business
enterprise normally performs a high percentageof the country’s R&D, usually well over 50% of
the national total. But the set of incentives thatproduced such change in the behaviour of pri-
vate enterprise varies from country to country and is always subject to improvement through
continuous evaluation.
3. STI INSTITUTIONS IN LDCDeveloping countries are not without STI insti-tutions, but these are often poorly funded and
managed, and their evaluation procedures are weak. Also, one hears a frequent complain from
developing country academics about the ‘puz-
zling’ low involvement of industry in R&D (Aro-cena & Sutz, 2001). The evolutionary approach
suggests that developing-country STI institu-
tions, and particularly those that are aimed atincreasing R&D in industry, are flawed, badly funded, and/or were not implemented with the
necessary persistence. Thus they were unable tomake science and technology endogenous to
industry. A few cases can illustrate the pattern.
3.1 Tax credits in Argentina andMexico
Both Argentina and Mexico have implemented
tax credits for R&D. Yet these policies did notproduce the expected outcomes.
259
Rethinking science, technology and innovation (STI) institutions in developing countries
Volume 12, Issue 3, December 2010 INNOVATION: MANAGEMENT, POLICY & PRACTICE

7/28/2019 Lecture 14_2010_Niosi IMPP
http://slidepdf.com/reader/full/lecture-142010niosi-impp 11/19
Mexico
In 1976, Mexico launched its fiscal incentives for
R&D, but put from the start a cap on the total fis-
cal cost of the credit; this is a major differencecompared to Canada, France or the US, where any
company can request such credits almost withoutlimits. In 2006, the Mexican government allowed
some 400 million in tax rebates to 887 companiesover than 3000 projects. Some 30% of expendi-
tures in R&D, including the training of R&D per-sonnel, could be deducted from business taxes. In
2008, Mexico had increased its fiscal budget for tax credits to some 4,500 million pesos (450 million
US dollars approximately). Table 2 shows the evo-
lution of the Mexican fiscal incentives in the2000s. The table shows that, over a five-year peri-
od, only 52% of the fund applications but almost90% of the demands were accepted. Yet the num-
ber of companies is exceedingly small: just 4.5% of the Canadian total of around 20,000 firms obtain-
ing the credit, or ten percent of the US firms. Also,tax credit concentration in large Mexican firms has
been strong: in the 2001–04 period, some 505Mexican companies received the credit, but only
92 companies received some 70% of the fiscalcredit, and 69% of the credit to these large compa-nies went to foreign firms (Foro Consultivo,
2006). An independent study cited in the Forosurvey (2006), calculates that, in the 2001–04
period, only some 1020 companies conductedR&D in Mexico (over 20,000 in Canada). Finally,
contrary to the US or Canadian system where nopublic official has the authority to choose who will
get credit, the Mexican system gives to an inter-institutional committee the power to distribute the
national tax credit. Representatives of the Econom-ics Department and other agencies form the com-
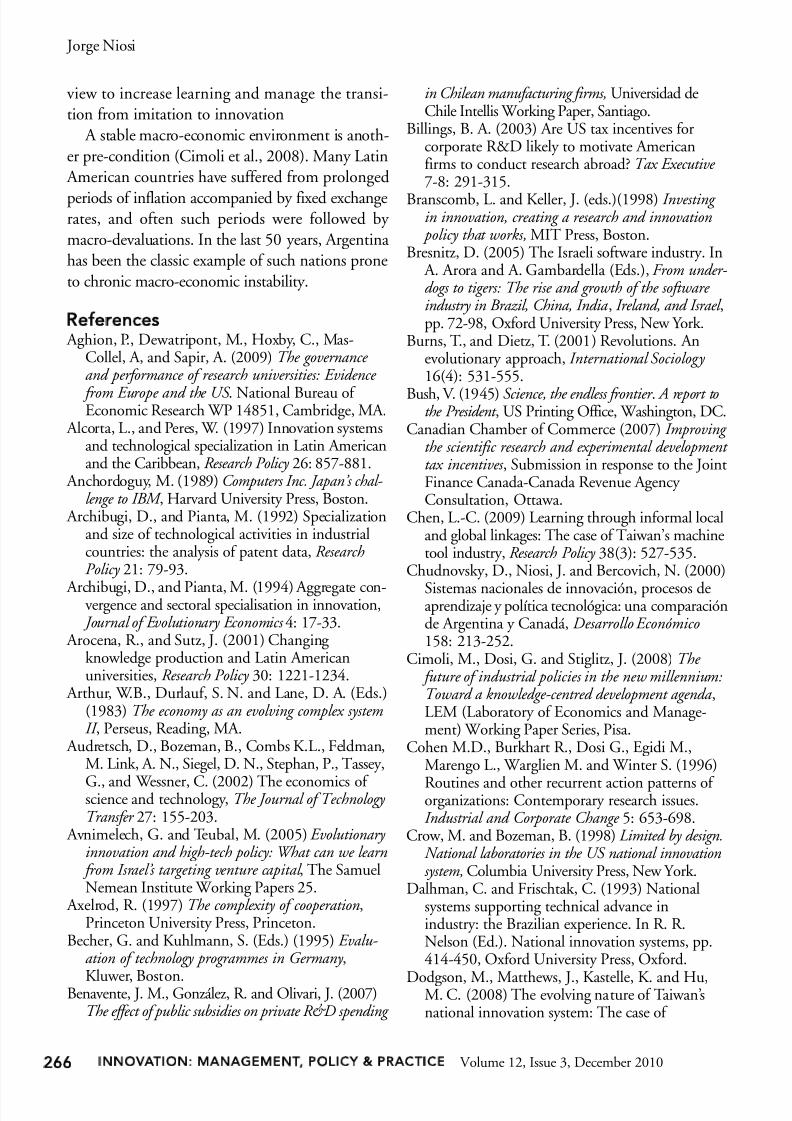
mittee (Foro Consultivo, 2006: p. 57). Another major problem with the Mexican sys-
tem was its high concentration in just one sector,
the auto industry. In 2005, the car industry dwarfed all the others, with a towering 45% of alltax benefits. The 2006 distribution by sectors
appears in Figure 2. The automobile sector still
represents the major portion but new areasappear (including biotechnology and pharmaceu-
ticals) that were absent a few years before.Probably in response to such criticisms, the
2007 version of the Mexican fiscal credit law
reserves 22% of the sums to small firms and forR&D in the area of new energies.Some evaluation is performed in Mexico, and
the Foro Consultivo is a key agent of this evalua-tion. The Foro was created in 2002 as an inde-
pendent consulting organism of the Mexican
government. Its mission includes the analysis of policy incentives for science and technology, and
the proposal of new measures to develop the sci-ence and technology capabilities of the country. It
regularly publishes evaluations of different scienceand technology policies.
In spite of its centrality, the Mexican incentivedoes not change the landscape of the country’s
reduced business expenditure on R&D. In 2005,Mexico’s GERD was only 0.46% of GDP and
BERD represented 41% of that amount.
Argentina
Argentina launched its tax credits on R&D in1997, with a US$20 million cap in 1998 and
260
Jorge Niosi
INNOVATION: MANAGEMENT, POLICY & PRACTICE Volume 12, Issue 3, December 2010
TABLE 2: MEXICAN FISCAL CREDIT FOR R&D DEMAND AND SUPPLY (2001–06)
2001 2002 2003 2004 2005 2006
Companies receiving the credit 192 242 275 398 643 887
Projects supported 679 1067 1197 1606 2361 3155
Credit demanded (M$ m) 735 911 1251 2301 4658 8351
Credit offered (M$ m) 500 500 500 1000 3000 4000
Credit offered as a % of demand 68% 55% 40% 43% 64% 48%
Source : CONACYT (2007): Estímulo fiscal para la investigación y desarrollo tecnológico , Mexico

7/28/2019 Lecture 14_2010_Niosi IMPP
http://slidepdf.com/reader/full/lecture-142010niosi-impp 12/19
1999. The Argentinean Technology Fund
(FONTAR) manages the credit; FONTAR is anoffice of the National Agency for Science and
Technology Promotion of the federal govern-ment. Public servants thus, as in the case of Mexi-
co, distribute the credit, which can represent up
to 50% of eligible costs of the project. The gov-ernment certificates are valid up to three years
after they are emitted, and they serve to cancel
federal government taxes. In the first year, 125companies presented 147 R&D projects; 94 of these projects were considered innovative and
were accepted. They emanated from 79 firms,82% of which were SME. Also, 90% of the funds
were allocated to the manufacturing sector. Atthat time, the Argentinean manufacturing sector
consisted of some 1000 large and medium-sized
companies as well as 14,000 SME. Thus the cred-
it, was beneficial only to 0.5% of Argentineanmanufacturing firms (Chudnovsky et al., 2000).
After the major financial crisis of Argentina in
2001 and 2002, the credit was maintained withsimilar characteristics. The amounts were pre-
served in pesos, but because of the abrupt devalu-ation of 2001–02, they were reduced by 66% in
US dollar terms. In 2007, the allocation wasslightly increased to 25 million pesos (US$8 mil-
lion), and in 2008 the government allocated 45.4
million pesos (or some US$15 million) to thecredit, under similar conditions as in the original
261
Rethinking science, technology and innovation (STI) institutions in developing countries
Volume 12, Issue 3, December 2010 INNOVATION: MANAGEMENT, POLICY & PRACTICE
FIGURE 2: MEXICAN TAX CREDIT FOR R&D 2006 BY
INDUSTRY
Source : CONACYT (2007)
program. With such very modest amounts, it isunderstandable that the business involvement in
R&D of Argentina has not made any particular
progress since the inception of the credit. R&Dexpenditure as a percentage of GDP was stagnant
at 0.45% in 1999 and 0.46% in 2005. BERD was 26% of GERD in 1999 and 31% in 2005.
Considering the fact that in 2005, Argentina’sGDP was US$553 billion, the incentive, as in the
case of Mexico is, to say the least, highly insuffi-cient to stimulate industrial R&D and create
demand for skilled scientists and engineers.
3.2 SME policy in Chile and Argentina
In most developing countries, except in SouthEast Asia, innovative SMEs receive a timid sup-
port from the state. Chile and Argentina are casesin point.
Chile and subsidies for R&D
In Chile, CORFO is the national agency that sup-
ports innovative activities in firms of all sizesthrough many different programs including ven-
ture capital, long-term loans, R&D subsidies and
other. The set of programs is handled by INNOVA Chile, a division of CORFO. In 2007, CORFOhad a total budget of over 5000 million pesos or
US$800 million. One third of this amount comesfrom the accumulated royalties the national gov-
ernment collects from its mineral exports. By theend of 2007, the total amount of funds accumulat-
ed through this royalty was 37,000 Chilean pesos
(or US$6 billion). The price of copper, which fluc-
tuated from US$0.50–1.50/lb (pound), increasedsubstantially in the 2005–08 period, and theChilean government collected major rents. By
December 2008, however, it had gone back to itsupper historical levels of US$1.50/lb.
In the area of support for innovative projectsfor R&D, CORFO has funded 409 projects in
2005 and 798 in 2006; 85% of them were SME.
Yet, in 2006, only 204 Chilean firms representedsome 80% of BERD. Most SMEs requesting
subsidies for R&D are in agriculture, fish pro-duction and other primary activities, and request

7/28/2019 Lecture 14_2010_Niosi IMPP
http://slidepdf.com/reader/full/lecture-142010niosi-impp 13/19
and obtain small amounts. An academic evaluation(Benavente et al., 2007) estimated that Chilean
subsidies for R&D had a positive effect on private
innovative activities. The ‘crowding out hypothesis’ was rejected and a fair level of additional R&D was
found. Yet, in October 2008, the national associa-tion of small firms (CONAPYME)1 requested an
evaluation of CORFO programs for SMEs, man-aged by private banks, under the argument that
banks were not channelling all available funds tosmall firms. At the same time, in September 2008,
a study published by the National Statistical Insti-
tute of Chile found that only 2.4% of the country’sSME use CORFO’s programs. Again the interme-
diary banks were pointed as the main obstacle tomore adequate financial support to SMEs. The
funds are there and the instrument produced somegood results, yet total business expenditure on
R&D remains low: under 30% of GERD.In 2004, Chile invested 0.68% of GDP in
R&D, or some US$635 million. That same year,46% of that amount was the nation’s BERD.
However, during the affluent years, according to
preliminary estimates, the country’s GERD
remained at 0.6–0.7% of GDP. This score isslightly better than in the cases of Argentina andMexico and a minor improvement with respect to
previous years. In spite of favourable conditions,Chile’s R&D effort is far from the average 2.26%
of GDP that OECD countries devote to R&D.
Argentina
In Argentina, FONTAR is the main agency that
distributes fiscal credits, subsidies and loans forR&D. In the latest year available, 2006, FONTAR had supported some 527 projects for a total of
US$50 million; this amount includes fiscal credits,non-reimbursable R&D subsidies and other sup-
ports. The non-reimbursable funds were exclusively
aimed at SMEs. In 2006, these funds amounted tosome US$10 million on 271 projects; in the 2003–
06 period, some 1100 projects were approved forUS$33 million.
262
Jorge Niosi
INNOVATION: MANAGEMENT, POLICY & PRACTICE Volume 12, Issue 3, December 2010
By comparison to IRAP, with annual budgets of
C$150 million dollars, of which some C$65 mil-lion are distributed annually in non-reimbursable
grants for R&D, the Argentinean program seems,once again, poorly funded. Compared to SBIR or
the Japanese programs, even when normalised by population and GDP, the Argentinean effort looks
irrelevant. If Argentina decided to invest the equiv-alent of US$1.4 billion annually (the present SBIR
program), or IRAP, it should spend at least US$50million annually in direct subsidies to R&D.
3.3 Vertical policies
Vertical policies are often implemented in devel-oping countries. Many of them aimed at the cre-ation of advanced technology industries such as
aerospace, electronics or pharmaceutical. With a few exceptions they failed. Alcorta and Peres
(1997) summarized some of the shortcomings of
these policies under the following headings:(a) Lack of clarity . Many developing countries
imposed restrictions on technology transferred to
them by MNC under the rationale that foreignfirms used technology to extract royalties. Thus, they generated obstacles to local learning. In the 1970s,
countries such as Argentina and Brazil createdoffices of intellectual property (IP) or foreign collab-
oration not so much to generate local IP, but to con-trol incoming technology from abroad. India made
a similar move with the India Investment Agency.
(b) Lack of priorities . Too many institutions andpolicies, as well as too many sectors being nur-
FIGURE 3: GERD 1995–2005 SELECTED COUNTRIES
1 www.conapyme.com

7/28/2019 Lecture 14_2010_Niosi IMPP
http://slidepdf.com/reader/full/lecture-142010niosi-impp 14/19
tured at the same time. Brazil intended to pro-mote an electronics industry without any lack of
specialization. Today its list of target sectors
includes 25 industries.(c) Excessive complexity and detail, as well as out-
of-control scope . Brazil New industrial Policy in1988 was to promote too many industries at the
same time through import liberalization formachinery and equipment, under the proviso that
all industries were connected. However, the sectoralimport quotas, market access and equity participa-
tion restrictions generated obstacles to growth.(d) Technology policies and organisations are rarely assessed . Evaluation and particularly independent
evaluation are seldom part of developing coun-tries’ culture.
One may also add lack of persistence and low
investments. Argentina’s promotion of a domes-tic aircraft industry through a government enter-
prise that, with many ups and owns, producedseveral hundred units of different locally
designed models since the 1920s, was revived inthe 1940s and 1950s (with the help of French,
German and Italian immigrant aircraft engi-neers), and knew a short restoration in the 1970sand 1980s. By the mid 1990s, however, the gov-
ernment aircraft manufacturing company wassold to Lockheed Martin. In December 2008,
the company was being nationalised again.In 1984, Brazil implemented import restric-
tions to support the growth of a national phar-maceutical industry. Also, in order to nurture
domestic production the government investedover US$5 million in laboratories in the city of Campinas. However, the weaknesses of the
research infrastructure generated major obstaclesfor a local industry to grow and import restric-
tions were lifted in the 1990s.
3.4 Public labs: Agricultural andindustrial extension versusindustrial promotion
In developing countries, government institutesperform a larger share of GERD than in OECD
countries. This is due partially to the weakness of private sector R&D activities for promoting agri-
culture, health or industry: public laboratories
appear to occupy a major role only because pri-vate R&D is almost non-existent. Most of these
institutes perform basic service and extensionactivities. In a few cases they have succeeded in
managing large research projects as in the case of EMBRAPA, the Brazilian agricultural research
institute (Dalhman & Frischtak, 1993).It was suggested that research in public labora-
tories and universities did not represent a majorfactor in catching up, with a few exceptions in
Brazil (aircraft), Korea and Taiwan (electronics)
(Mazzoleni & Nelson, 2007). Yet, Linsu Kim(1997) thought otherwise in the case of Korea:
Given the inadequacy of Korean university research, the government developed a network
of R&D institutes (GRIs) to play a major rolein advanced industrial R&D. The Korea Insti-
tute of Science and Technology (KIST) spent a
large proportion of the nation’s total R&Dfunds in the early decades, but they suffered
from poor linkages with industries in the1960s and 1970s. (Kim, 1997: 201)
Kim identified two problems: lack of demand
from industry and insufficient manufacturing know-how in the GRIs. In order to establish
linkages, ‘the government coerced large firms toundertake joint research with GRIs’ (Kim, 1997:
202) in the automobile, chemical, electronicsand other industries. These GRIs strengthened
the bargaining power of local firms with foreignmultinationals, reverse engineered technology,and provided prior knowledge to firms in a wide
range of industries. They conducted global tech-nology scanning, educated industrialists, provid-
ed common infrastructure to firms unable toconduct R&D by themselves, and served as cat-
alysts of skills and competencies (Lim, 1999).In Singapore, also, government biotechnology
research institutes have played a major role as ini-tiators and catalysts of local competencies in the
late 1980s and 1990s (Parayil, 2005: 56):
263
Rethinking science, technology and innovation (STI) institutions in developing countries
Volume 12, Issue 3, December 2010 INNOVATION: MANAGEMENT, POLICY & PRACTICE

7/28/2019 Lecture 14_2010_Niosi IMPP
http://slidepdf.com/reader/full/lecture-142010niosi-impp 15/19
Public research institutes and centres weremandated to work closely with firms and to
recover part of their R&D expenditures from
these industrial sources.
Finally, Taiwan’s ITRI has played a key rolenot only in electronics but also in the machinery
industry (Chen, 2009); other laboratories areplaying a similar role in biotechnology (Dodgson
et al., 2008).The point here is that, if not connected to
local industrial partners, and provided with a large set of useful mandates (none of which is the
provision of basic science), as well as adequate
funding, public research organizations (PROs) indeveloping countries will not play a key role in
catching up. The examples of South East Asia show that they can and should play a major role.
PROs should not need to wait from industrialdemand to develop. Through appropriate incen-
tives, governments must promote linkages andcooperative R&D between PROs and industry,
and postpone the advancing of basic science.In 2005, expenditure performed by Latin
American government institutes was much largerthan in the average OECD countries: Argentina (40%), Brazil (21%), Chile (45%) and Mexico
(23%). But this is only due to the reducedinvolvement of industry in R&D and innova-
tion. These countries had fewer governmentinstitutes than industrial countries, and all but a
handful of them were conducting either basicscience or agricultural and industrial extension.
Few vertical institutes in advanced technologiesexisted in the region.
3.5 ConclusionDeveloping countries have arrived later to science
and technology. Many of them have underesti-
mated the key role of institution building. Formany reasons (lack of focus or resilience and/or
adequate investment) their policies and organisa-tions did not produce the expected results. More
often than not, policies were abandoned insteadof being assessed and improved. Government
bureaucracies may also be less competent thanthose in industrial nations. This gives rise to a
vicious circle of underdevelopment: local educa-tion systems produce few high-level graduates
(and attract even less of them from abroad).
Bureaucracies are unable to find highly skilledcivil servants who would design, implement and
assess sophisticated policies that would improvesuch education systems.
4. CONCLUSION AND POLICY
IMPLICATIONS
Science, technology and innovation institutionsmust be revised under the light of evolutionary
economics and learning. Two major issues seemimportant for catching up. First, developing
countries must set up new sectors and for thuspurpose they need both horizontal and vertical
STI policies. Second, in order to make techno-logy endogenous (Rosenberg, 2000), business
enterprise must be stimulated to conduct R&Dand innovate, to hire scientists and engineers. For
that purpose, horizontal policies have to be
redesigned and assessed continuously, and vertical
policies need to be implemented in order tolaunch new, technology-intensive sectors.
This paper has argued several major points:
(1) In STI policies, there is no ‘one size fits all’,universal solution. Different countries apply var-
ious policy solutions to specific economic struc-tures, strategies and local conditions. Also, the
precise way in which these policies are applied is
important, and there are many different ways of
implementing what at arm’s length appears to bethe same program (i.e., grants for R&D insmaller firms) (Lach, 2002).
(2) STI policies, crucial components of thenational and sectoral systems of innovation, are
of variable efficiency and effectiveness. Noclear movement towards optimal or merely
more efficient institutions is in sight. The rea-son is the major and permanent ambiguity
about best practices, incentive designs, out-
comes, evaluation methods and factors thatexplain the results.
264
Jorge Niosi
INNOVATION: MANAGEMENT, POLICY & PRACTICE Volume 12, Issue 3, December 2010

7/28/2019 Lecture 14_2010_Niosi IMPP
http://slidepdf.com/reader/full/lecture-142010niosi-impp 16/19
(3) Benchmarking and evaluation are, however,the key learning mechanisms. There is evidence
that evaluation, particularly independent one,
serves to improve policy designs, through contin-uous improvement. However, a substantial
amount of trial-and-error and tinkering remainsunavoidable.
(4) Horizontal policies are not enough. Verticalpolicies are required to create new sectors. Little
vertical policies were to be found in these Latin American countries, but if found, they are flawed,
poorly funded and badly coordinated.(5) Also, Latin American countries invest little
in business R&D. Their policies are often
inconsistent, which reveals the modest manage-rial capabilities of their public bureaucracies.
Although starting from much lower levels of governance sophistication than Latin America,
several South East Asian countries are muchmore active and successful in all these STI poli-
cy fields.(6) It is critical to plan, at the same time, both
human capital supply (through investment ineducation), and skilled labour demand, the lat-
ter being promoted through increasing businessR&D and stimulating private sector absorptivecapacity. The lack of demand for human capi-
tal produces ‘brain drain’ conditions. An insuf-ficient supply of human capital generates
barriers to innovation in both public and pri-vate sectors.
(7) Because governments design and implementpolicy, the construction of an efficient public
bureaucracy is another major condition towardsthe operation of successful STI policies.(8) STI institutions in OECD countries may
provide models for would be catchers up. But thevirtuous circle of policy execution and learning
also appears in South East Asian countries underfairly different models. Also, one learns not only
from success stories, but also from errors and wrong policy decisions.
If any general conclusion is to be drawn fromthis overview, it is that each developing country,
if it is to catch up, will need to examine previous
successful and unsuccessful paths and policies,
and develop its own road to innovation and
development.The policy implications are straightforward.
Developing country governments need to pay
much more attention to these STI institutions,invest in them, and evaluate them with thegoal of continuously improving them. They
also need to built a professional public bureau-cracy of highly skilled civil servants in these
areas, one that is able to design, implement
and monitor the outcomes of public invest-ments in science, technology and innovation.
And they also need to coordinate human capi-
tal supply with demand, particularly withbusiness sector demand. A final caveat is necessary. Efficient R&D,
science and technology institutions may not besufficient conditions for catching up, without
industrial policies, an intellectual property regime, and a stable macro-economic environ-
ment. Industrial policies include some type of
infant industry protection either through tariffs,quotas and/or currency management. A wise
use of these tools allowed Japan to catch up with the United States in computers (Anchor-
doguy, 1989) or Korea in automobiles (Kim,1997). Currency management is important,
particularly in developing countries such asthose on Latin America where the curse of nat-
ural resources is too often evident: in periods of high resource prices, the value of their currency
increases and industrial as well as sophisticated
services exports become difficult. For decades Asian countries have chosen to maintain a low
exchange rate in order to favour their exports. An appropriate intellectual property rights
regime (IPR) is also required (Mazzoleni & Nel-son, 2007). In most industries, but more acutely
in such sectors as biotechnology and pharmaceu-ticals, semi-conductors or software, the existing
IPR regime in the world economy may restrict
their ability to learn and master existing or in-coming new technology. All Asian developing
countries have chosen weaker IPR regimes with a
265
Rethinking science, technology and innovation (STI) institutions in developing countries
Volume 12, Issue 3, December 2010 INNOVATION: MANAGEMENT, POLICY & PRACTICE
7/28/2019 Lecture 14_2010_Niosi IMPP
http://slidepdf.com/reader/full/lecture-142010niosi-impp 17/19
view to increase learning and manage the transi-tion from imitation to innovation
A stable macro-economic environment is anoth-
er pre-condition (Cimoli et al., 2008). Many Latin American countries have suffered from prolonged
periods of inflation accompanied by fixed exchangerates, and often such periods were followed by
macro-devaluations. In the last 50 years, Argentina has been the classic example of such nations prone
to chronic macro-economic instability.
References Aghion, P., Dewatripont, M., Hoxby, C., Mas-
Collel, A, and Sapir, A. (2009) The governance and performance of research universities: Evidence
from Europe and the US . National Bureau of Economic Research WP 14851, Cambridge, MA.
Alcorta, L., and Peres, W. (1997) Innovation systemsand technological specialization in Latin Americanand the Caribbean, Research Policy 26: 857-881.
Anchordoguy, M. (1989) Computers Inc. Japan’s chal-lenge to IBM , Harvard University Press, Boston.
Archibugi, D., and Pianta, M. (1992) Specializationand size of technological activities in industrialcountries: the analysis of patent data, ResearchPolicy 21: 79-93.
Archibugi, D., and Pianta, M. (1994) Aggregate con-vergence and sectoral specialisation in innovation, Journal of Evolutionary Economics 4: 17-33.
Arocena, R., and Sutz, J. (2001) Changing knowledge production and Latin Americanuniversities, Research Policy 30: 1221-1234.
Arthur, W.B., Durlauf, S. N. and Lane, D. A. (Eds.)(1983) The economy as an evolving complex systemII , Perseus, Reading, MA.
Audretsch, D., Bozeman, B., Combs K.L., Feldman,M. Link, A. N., Siegel, D. N., Stephan, P., Tassey,
G., and Wessner, C. (2002) The economics of science and technology, The Journal of Technology Transfer 27: 155-203.
Avnimelech, G. and Teubal, M. (2005) Evolutionary innovation and high-tech policy: What can we learn from Israel’s targeting venture capital , The SamuelNemean Institute Working Papers 25.
Axelrod, R. (1997) The complexity of cooperation,Princeton University Press, Princeton.
Becher, G. and Kuhlmann, S. (Eds.) (1995) Evalu-ation of technology programmes in Germany ,
Kluwer, Boston.Benavente, J. M., González, R. and Olivari, J. (2007)The effect of public subsidies on private R&D spending
in Chilean manufacturing firms, Universidad deChile Intellis Working Paper, Santiago.
Billings, B. A. (2003) Are US tax incentives forcorporate R&D likely to motivate Americanfirms to conduct research abroad? Tax Executive 7-8: 291-315.
Branscomb, L. and Keller, J. (eds.)(1998) Investing in innovation, creating a research and innovation policy that works, MIT Press, Boston.
Bresnitz, D. (2005) The Israeli software industry. In A. Arora and A. Gambardella (Eds.), From under-dogs to tigers: The rise and growth of the software industry in Brazil, China, India , Ireland, and Israel ,pp. 72-98, Oxford University Press, New York.
Burns, T., and Dietz, T. (2001) Revolutions. Anevolutionary approach, International Sociology 16(4): 531-555.
Bush, V. (1945) Science, the endless frontier . A report tothe President , US Printing Office, Washington, DC.
Canadian Chamber of Commerce (2007) Improving the scientific research and experimental development tax incentives , Submission in response to the JointFinance Canada-Canada Revenue Agency Consultation, Ottawa.
Chen, L.-C. (2009) Learning through informal localand global linkages: The case of Taiwan’s machinetool industry, Research Policy 38(3): 527-535.
Chudnovsky, D., Niosi, J. and Bercovich, N. (2000)
Sistemas nacionales de innovación, procesos deaprendizaje y política tecnológica: una comparaciónde Argentina y Canadá, Desarrollo Económico158: 213-252.
Cimoli, M., Dosi, G. and Stiglitz, J. (2008) The future of industrial policies in the new millennium:Toward a knowledge-centred development agenda ,LEM (Laboratory of Economics and Manage-ment) Working Paper Series, Pisa.
Cohen M.D., Burkhart R., Dosi G., Egidi M.,Marengo L., Warglien M. and Winter S. (1996)
Routines and other recurrent action patterns of organizations: Contemporary research issues.Industrial and Corporate Change 5: 653-698.
Crow, M. and Bozeman, B. (1998) Limited by design.National laboratories in the US national innovationsystem, Columbia University Press, New York.
Dalhman, C. and Frischtak, C. (1993) Nationalsystems supporting technical advance inindustry: the Brazilian experience. In R. R.Nelson (Ed.). National innovation systems, pp.414-450, Oxford University Press, Oxford.
Dodgson, M., Matthews, J., Kastelle, K. and Hu,M. C. (2008) The evolving nature of Taiwan’snational innovation system: The case of
266
Jorge Niosi
INNOVATION: MANAGEMENT, POLICY & PRACTICE Volume 12, Issue 3, December 2010

7/28/2019 Lecture 14_2010_Niosi IMPP
http://slidepdf.com/reader/full/lecture-142010niosi-impp 18/19
biotechnology innovation networks, ResearchPolicy 37: 430-445.
Dosi, G., Llerena, P., and Sylos Labini, M. (2006)The relationships between science, technologiesand their industrial exploitation: An illustrationthrough the myths and realities of the so-called
‘European paradox’, Research Policy 35:1450-1464.Eshima, Y. (2003) Impact of public policy towards
innovative SMEs in Japan, Journal of Small Business Management 41(1): 85-93.
Foro Consultivo Científico y tecnológico (2006)Diagnóstico de la política científica, tecnológica y de fomento de la innovación en México (2000-2006),Mexico D.F.
Freeman, C. (1987) Technology policy and economic performance: Lessons from Japan, Pinter, London.
Georghiou, L. (1998) Issues in the evaluation of inno-
vation and technology policy, Evaluation 4: 37-51.Georghiou, L. and Roessner, D. (2000) Evaluating
technology programs: Tools and methods,Research Policy 29(4-5): 657-678.
Glaeser, E. L., La Porta, R., López de Silanes, F. andShleifer, A. (2004) Do institutions cause growth? Journal of Economic Growth, 9: 271-303.
Hodgson, G. M. (1999) Evolution and institutions ,Elgar, Cheltenham.
Japan Small and Medium Enterprise Agency (2008)White paper on small and medium enterprises in
Japan, Tokyo.Kim, L. (1997) Imitation to innovation. The dynamics
of Korean technological learning , Harvard BusinessSchool Press, Boston.
Kuhlmann, S. (1998) Moderation in policy making?Science and technology policy evaluation beyondimpact measurement: The case of Germany,Evaluation 4(2): 130-148.
Kuran, T. (1997) Islam and underdevelopment: Anold puzzle revisited, Journal of Institutional and Theoretical Economics 153: 41-72.
Lach, S. (2002) Do R&D subsidies stimulate ordisplace private R&D? Evidence from Israel, The Journal of Industrial Economics , L(4): 369-390.
Laranja, M., Uyarra, E. and Flanagan, K. (2008)Policies for science, technology and innovation.Translating rationales into regional policies in a multi-level setting, Research Policy 37(5): 823-35.
Leonard, D. (1996) Wellsprings of knowledge ,Harvard Business School Press, Boston.
Lim, Y. (1999) Technology and productivity, The Korean way of learning and catching up, MIT
Press, Cambridge, MA.Lundvall, B.-A. (1992) National systems of innovation,Pinter, London.
Malerba, F. (Ed.) (2004) Sectoral systems of innovation,Cambridge University Press, Cambridge.
Mazzoleni, R., and Nelson, R.R. (2007) Publicresearch institutions and economic catching up.Research Policy 36(10):1512-1528.
Mohnen, P., and Roeller, L.-H. (2005) Complem-
entarities in innovation policy, EuropeanEconomic Review , 49, 1431-1450.
National Research Council of Canada (NRC): Mandate, mission, values, program goals and strategic objectives , Ottawa. Retrieved from www.nrc-cnrc.gc.ca/eng/ibp/irap/about/mandate.html
National Science Foundation (2008) Science and engineering indicators , Washington DC.
Nelson, R. R., (Ed.) (2003) National innovationsystems , Oxford University Press, New York.
Nelson, R. R. (2005) Technology, institutions and economic growth, Harvard University Press,Cambridge, MA.
Nelson, R. R. and Winter, S. (1982) An evolutionary theory of economic change , Belknap Press, Boston.
Niosi, J., 2002. National systems of innovation arex-efficient. Why some are slow learners, ResearchPolicy 31(2): 291-302.
OECD (2008) Main science and technology indicators ,Volume 1, Paris.
Osman-Gani, A. (2004) Human capital develop-
ment in Singapore: An analysis of national policy perspectives, Advances in developing humanresources 6: 276-289.
Parayil, G. (2005) From ‘Silicon Island to Biopolisof Asia’: Innovation policy and shifting compet-itive strategy in Singapore, California Manage-ment Review 47(2): 50-74.
Pugliese, J. C. (Ed.) (2003) Políticas de estado para la universidad argentina , Ministerio de educación,ciencia y tecnología, Buenos Aires.
RAND Corporation, 2006. Evaluation and recom-
mendations for improvement of the Departmentof Defense SBIR Program. Santa Monica, CA.Romer, P. (1986) Increasing returns and long-run
growth, Journal of Political Economy 94: 1001-1037.
Rosenberg, N. (2000) Schumpeter and the endogeneity of technology , Routledge, London.
Sabatier, P. (Ed.) (1999) Theories of the policy process , Westview Press, Boulder, CO.
Sands, A. 2005. The Irish software industry. In A. Arora and A. Gambardella (Eds.), From underdogs
to tigers. The rise and growth of the software industry in Brazil, China, India, Ireland and Israel , pp. 41-71, Oxford University Press, Oxford.
267
Rethinking science, technology and innovation (STI) institutions in developing countries
Volume 12, Issue 3, December 2010 INNOVATION: MANAGEMENT, POLICY & PRACTICE

7/28/2019 Lecture 14_2010_Niosi IMPP
http://slidepdf.com/reader/full/lecture-142010niosi-impp 19/19
Stability & Change + General sectionSpecial Issue of Journal of Management & Organization
ISBN: 978-1-921348-50-1 ~ Volume 17Issue 6 ~ ii+128 pages ~ November 2011
Editors: Stephane Tywoniak andJennifer Bartlett, QueenslandUniversity of Technology
This special issue aims to widen understanding of theprocesses of stability and change in today's organizations,with a particular emphasis on the contribution of institutional approaches to organizational studies.
The Future of Technical andVocational Education (TVET): Globalchallenges and possibilitiesSpecial Issue of International Journal of Training Research
ISBN: 978-1-921729-10-2 ~ Volume 9Issue 1 ~ ii+126 pages ~ April 2011
Editor: Rupert Maclean, Chair Professorof International Education and Director of the Centrefor Lifelong Learning Research and Development,Hong Kong Institute of Education, and FoundationDirector, UNESCO International Centre for Technicaland Vocational Education and Training, Bonn, Germany
Transformations in Health Care: privati-sation, Corporatisation and the MarketSpecial Issue of Health Sociology Review ISBN: 978-1-921729-04-1 ~ Volume 20Issue 3 ~ September 2011Editors: Kevin White, The AustralianNational University, Fran Collyer, TheUniversity of Sydney and Jane Jones,
Flinders University of South AustraliaThis special issue is devoted to international, regionaland national papers exploring the increasing relianceon markets.
Educating for Sustainability and CSR:What is the role of business schools?Special Issue of Journal of Management & Organization
ISBN: 978-1-921348-76-1 ~ Volume 17Issue 3 ~ ii+142 pages ~ May 2011
Editors: Suzanne Benn and Robin Kramar,Macquarie University, Sydney, Australia
This special issue explores the role of businessschools, higher education and other organisations infostering change for Corporate Social Responsibility(CSR) and Sustainability.
Mixed Methods Research in Businessand ManagementSpecial Issue of International Journal of Multiple Research Approaches
ISBN: 978-1-921348-95-2 ~ Volume 5Issue 3 ~ ii+110 pages ~ October 2011
Editors: Roslyn Cameron, SouthernCross University (Australia) and José F.
Molina-Azorín, University of Alicante (Spain)This special issue is dedicated to Multiple ResearchApproaches and Mixed Methods in Business andManagement Research.
Home-based Business + General sectionSpecial Issue of Small Enterprise Research
Volume 17 Issue 2 ~ ii+128 pages ~December 2010
Editor: Professor Colin Mason, HunterCentre for Entrepreneurship, Universityof Strathclyde, Glasgow, Scotland
This Special Issue seeks to encourage the publicationof new research that expands our understanding of the home-based business sector.
Saviotti, P. P. and Pyka, A. (2004) Economicdevelopment by the creation of new sectors, Journal of Evolutionary Economics , 14: 1-35.
Shapira, P. and Kuhlmann, S. (Ed.) (2003) Learning from science and technology policy evaluation,experiences from the United States and Europe ,
Elgar, Cheltenham.Smits, R. and Kuhlmann, S. (2004) The rise of
systemic instruments in innovation policy,International Journal of Foresight and InnovationPolicy , 1(1-2): 4-32.
Sterman, J. (2002) All models are wrong, SystemDynamics Review 18: 510-531.
Tassey , G. (2007) Tax incentives for innovation:Time to restructure the R&E tax credit, The
Journal of Technology Transfer , 32(6): 605-615.United Nations (UN) (2007/8) UN Human
Development Report , New York.United States President’s Council of Advisors on
Science and Technology (2008) University-private sector research partnerships in the innovation
ecosystem, Office of Science and Technology Policy, Washington DC.
Wessner, C. (Ed.) (1999) The Small Business Inno-vation Research Program: Challenges and oppor-tunities , National Academies Press, WashingtonDC.
Received 29 November 2009 Accepted 28 January 2010
Jorge Niosi
F O R T H C O M I N G F R O M e C O N T E N T
eContent Management Pty Ltd, PO Box 1027, Maleny QLD 4552, AustraliaTel.: +61-7-5435-2900; Fax. +61-7-5435-2911
www.e-contentmanagement.com