lawton smith and ho
TRANSCRIPT

Research Policy 35 (2006) 1554–1568
Measuring the performance of Oxford University, Oxford BrookesUniversity and the government laboratories’ spin-off companies
H. Lawton Smith ∗, K. HoSchool of Management & Organisational Psychology, Birkbeck, University of London, Malet Street, London WC1E 7HX, United Kingdom
Available online 30 October 2006
Abstract
The paper reports on a recent study, which uses various indicators to provide an insight on the performance of spin-off companiesfrom the public sector research base in Oxfordshire (UK). The study builds upon the other studies and fills a gap in the field bygathering empirical information on the performance of technology-based spin-off companies. While the main geographical focus isthe county of Oxfordshire, UK, the findings will also be of value for other researchers and institutions with an interest in assessingthe performance of spin-off firms. The evidence shows that the number of spin-offs in Oxfordshire has increased rapidly over recentyears, as the result of evolving national policy and the entrepreneurial culture of the universities and laboratories. However, the
academics and scientists in Oxfordshire’s institutions were already entrepreneurial in the 1950s, less so in the 1960s, but increasinglyin the 1970s and 1980s, particularly in Oxford University, which is by far the largest generator of spin-offs in the region.© 2006 Elsevier B.V. All rights reserved.JEL classification: 018; 031; 032; 033; 034; 038; 052
Keywords: Academic spin-offs; Performance; Oxfordshire
1. Introduction
The entrepreneurial university (Etzkowitz et al.,2000), which emerged first in the US, followed by theUK and subsequently throughout Europe and the rest ofworld (Rappert et al., 1999), has become the aspirationalnorm. A common rhetoric that lauds academic enterpriseunites universities and governments as a route to politi-cal kudos and income for the former and wealth creationand job generation for the latter. Universities are now
central players in a policy model that Bozeman (2000, p.632) describes as a “cooperative technology paradigm”,prominent in the US in the early 1990s, in which the uni-∗ Corresponding author. Tel.: +44 207 631 6770;fax: +44 207 731 6749.
E-mail addresses: [email protected] (H.L. Smith),[email protected] (K. Ho).
0048-7333/$ – see front matter © 2006 Elsevier B.V. All rights reserved.doi:10.1016/j.respol.2006.09.022
versity role is expanded to encompass technology-basedeconomic development programmes. While Bozeman’swork was referring specifically to the US at a particulartime, this model as a political philosophy can be currentlyrecognised across developed and developing countries.The reality is, however, that some countries are better atcreating spin-offs than others; and in turn some institu-tions are more entrepreneurial than others with spin-outsuccesses in specific sectors (i.e. life sciences). Suchpatterns are revealed by annual national surveys suchas by the Association of University Technology Man-
agers (AUTM) for the United States and Canada and inthe UK by The Higher Education Funding Council forEngland (HEFCE) and UNICO1 (The University Com-1 UNICO was founded in 1994 to represent the technology exploita-tion companies of UK Universities.

rch Pol
p(
soett(vehoTtaipfkn(ia
aUt(atv2iidtte
upocob
fiId
H.L. Smith, K. Ho / Resea
anies Association) and more extensively by the OECD2001).
In analysing the causes of these patterns, academictudies have focused on the impact of national systemsf innovation and legislation on stimulating academicnterprise (Shane, 2004), the ‘entrepreneurial orienta-ion’ of universities (O’Shea et al., 2005), the institu-ional conditions under which spin-offs are incubatedLockett et al., 2005) and the characteristics of indi-idual academics who become entrepreneurs (see forxample Zucker and Darby, 1996). Far fewer, however,ave examined the survival and performance of spin-offsver prolonged periods. This is an important omission.his is both because of the time it takes, especially in
he UK, for companies to grow to any significant sizend because of the priority attached to spin-off activ-ty, especially in biotechnology, which underestimateserformance in other sectors. Moreover, most studiesocus on those companies which have been formed sincenowledge management and technology transfer mecha-isms governing the exploitation of intellectual propertyIP) were instituted, thereby considerably underestimat-ng the longer term contribution of university spin-offctivity.
This paper’s contribution is to examine the numbernd performance of spin-offs of what is arguably theK’s most entrepreneurial university – Oxford2 – and of
he spin-offs from Oxfordshire’s two other universitiesOxford Brookes and Cranfield DCMT at Shrivenham)nd its seven currently government funded and priva-ised public research laboratories (PRLs). It presents sur-ey data collected during the period August 2004–May005. The distinguishing feature of this study is thatt records spin-off activity from the 1950s, thus trac-ng university-based entrepreneurial activity over fiveecades. The paper positions the analysis within bothhe entrepreneurial orientation of UK policy and ofhe Oxfordshire economy, the fastest growing high-techconomy in Europe (Chadwick et al., 2003).
The next section reviews the evidence on rates ofniversity spin-off activity and explanations for thoseatterns. The following section provides a brief overviewf UK policy on academic enterprise. The Oxfordshire
ase study forms the third section. In this the numberf spin-offs and their performance according to a num-er of indicators are discussed. In the last section, some2 Oxford won a competition sponsored by US venture capitalrm Cross Atlantic Capital Partners, beating off competition frommperial College London, and Cambridge—see www.xacp.com/newsetail.asp?news id=82.
icy 35 (2006) 1554–1568 1555
conclusions are drawn on the limitations of this kind ofstudy.
2. Patterns of spin-offs
Although spin-off activity is increasing worldwide,there is considerable variation within that trend (Clarysseet al., 2001). Their study showed that it is more commonin some countries than others, while Di Gregorio andShane (2003) show that spin-offs tend to be formed bythe more research intensive universities. Overall, the netnumber of spin-offs is small and their size, growth rates,revenues, and product generation are modest, at leastin the first decade of their existence (see Lerner, 2005).Studies also show that sector is strongly associated withspin-off activity, i.e. that spin-offs are mainly in thebiomedical and the information technology fields. Theemployment impact tends to be local as most spin-offsstay within the same geographical area as the institutionfrom which they originated (see Shane, 2004).
Numerous explanations for these disparities havebeen given. First, national governments have an impacton spin-off activity in various ways (see Shane, 2004).For example, they determine the degree to which univer-sities have the autonomy to make their own rules regard-ing exploitation of IP; legislation has been passed, forexample, in the US with the Patent and Trademark Act of1980 (the Bayh-Dole Act), which formalised universityownership of IP. The UK provides financial and politi-cal ‘incentive’ structures to encourage entrepreneurshipand has enacted legislation designed to stimulated R&D-based entrepreneurial activity such as R&D tax incen-tives. With respect to university autonomy, in Sweden,Italy and Finland, for example, universities do not ownthe IPR of their staff, while in contrast in the UK, since1985, each institution has been able to set their own ruleson ownership of IP. In France it was only in 1999 thatacademic spin-offs became possible after the passing ofAllegre’s Law, although the national laboratories hadlong been able to do so (see Lawton Smith, 2003).
Second, reputation and research eminence of indi-vidual universities are strongly associated with the rateof spin-off (Di Gregorio and Shane, 2003; Feldman etal., 2002). The argument is that people of higher cali-bre are more likely to form spin-offs to reap the rewardsof their intellectual capital. Reputation also help spin-offs to obtain private funding at times of uncertainty asinvestors will be able to rely on the university’s past abil-
ity to succeed (Di Gregorio and Shane, 2003).Third, institutional factors identified as influencingthe rate of spin-off activity include the culture of theuniversity, its attitude toward spin-offs and the com-

rch Pol
dated to the early 1980s. From 1982 onwards universitiesstarted to open technology transfer offices. Following the
1556 H.L. Smith, K. Ho / Resea
petence of the technology transfer offices (TTOs) (seeSiegel et al., 2003; Lockett and Wright, 2005). Inven-tors are more likely to be interested in creating newfirms to develop their research if there is wide supportfor the process (Nelsen, 1998; Kenny and Goe, 2004).Lockett et al. (2005) summarise the key process issueswith respect to overcoming the organizational knowl-edge gaps that new ventures encounter as opportunityrecognition, the decision to commercialise and due dili-gence, the choice between licensing and spin-off, andthe time period over which TTOs are involved in spin-offs and accessing resources and knowledge. Thus, TTOshave a key role to play in making their ventures ‘investorready’ (Binks et al., 2004). ‘Readiness’ includes thepotential competence of spin-off companies to overcomethe four different critical junctures needed for survival:opportunity recognition, entrepreneurial commitment,credibility and sustainability (Vohora et al., 2004), ideassupported by De Coster and Butler (2005). Kenny andGoe (2004, p. 692) contend that, ‘the involvement ofprofessors in entrepreneurial activity is influenced by thesocial relationships and institutions in which a professoris embedded’. They argue that institutional factors werelikely explanations for why entrepreneurship was morecommon in electrical and electronic engineering facultyin Stanford than at the University of California, Berkeley(UCB) rather than the particular features of the locality,as they find that staff in the two universities in their studyhad equal access to Silicon Valley support mechanisms.
Fourth, the distribution of spin-offs across industrysectors is highly uneven and spin-offs are diverse in theiractivities (Druilhe and Garnsey, 2004). The greatest con-centration is in the life sciences followed closely byinformation technologies (with technological advanceresulting from the combination of both in fields suchas genomics, proteomics and bioinformatics) (PACEC,2003). While the life science or biotech industry is supe-rior at producing spin-offs because research producesmore discrete inventions than other industries, there maybe more barriers in commercialising life science discov-eries than other sectors (e.g. complex regulations). Thissuggests that the high number may be a result of thegreater need for spin-offs to exploit inventions ratherthan greater entrepreneurial opportunities (Meyer andAutio, 2004). Moreover, the emphasis on biotechnologyas a source of wealth generation may be misplaced, atleast in the short-term (Nightingale and Martin, 2004).
Further, it is argued in a number of studies that if
the geographical area in which the university is locatedhas many other high-tech activities in progress, the rateof spin-offs is likely to be increased. Lee and Walshok(2003) find that local spin-off firms are distinguishableicy 35 (2006) 1554–1568
from other firms. Such firms are more likely to have localuniversity advisers, local expertise and local investors.Thus, areas where universities are particularly active willdevelop specialised expertise that understands that par-ticular entrepreneurial process. Moreover, investors suchas venture capitalists are likely to move to the area as theyprefer to make more local investments (Sahlman et al.,1999; Babcock-Lumish, 2004).
With respect to performance of university spin-offcompanies per se, university spin-offs appear to survivelonger relative to other start-ups. In the US, a study byPressman (2002) found that out of the spin-offs formedin 1980–2001, 65% (2514/3870) were still operationalin 2001. In France, only 16% of spin-offs actually fail(Mustar, 1997). These findings contrast with those ofthe UK’s 2003 Lambert Review of University–BusinessInteraction (HM Treasury, 2003), which suggests that thenumber of spin-offs in the UK is rising too quickly withthe corollary that many will not survive in the long-run.On the other hand, estimates of failure rates of new ven-tures have improved with 91.4% of UK VAT-registeredbusinesses in 2000 trading for a year, while the per-centage of UK businesses surviving three or more yearsincreased from 60 to 64% over the period 1994–2003.3
Yet not all university or public research institutionsspin-offs have the same propensity for high growth(Druilhe and Garnsey, 2004). With respect to spin-offsfrom public research institutions, Lockett et al. (2005)develop a knowledge-based view of spin-off formation,which focuses on areas of knowledge gaps to explainwhy some public research institution spin-offs do notgrow rapidly and why it is important to differentiatebetween spin-offs that do not involve the transfer of IPbut are established by PRI employees and those thatdo—a distinction that is equally useful for universityspin-offs. Like Druihle and Garnsey, they are makingthe point that entrepreneurs and the activity of theirenterprises are diverse, hence will not follow the samedevelopmental processes (see also Vohora et al., 2004).
3. The UK context
The UK has one of the most entrepreneurial systems,being in the vanguard of academic capitalism (Slaughterand Leslie, 1999). Academic capitalism in the UK can be
Labour Party’s accession to government in 1997, uni-versities received both a growth in research funding and
3 www.sbs.gov.uk.

H.L. Smith, K. Ho / Research Policy 35 (2006) 1554–1568 1557
Table 1UK government university commercialisation initiatives
Year Initiative Purpose Details
1998 Higher Education Reach outto Business and theCommunity (HEROBaC)
Funding to support activities to improvelinkages between universities and theircommunities
£20 million per year allocated to provide funding forthe establishment of activities such as corporateliaison offices
1999 University Challenge Fund(UCF)
Seed investments to help commercialisationof university IPR
£45 m was allocated in the first round of thecompetition in 1999, (with 15 funds being set up)and £15 million in October 2001. 57 HEIs now haveaccess to this funding
1999 University Science EnterpriseCentres (SEC)
Teaching entrepreneurship to support thecommercialisation of science and technology
SEC initially provided £28.9 million in 99/00 for upto 12 centres. Additional funding of £15 millionincreased the number of HEIs participating to 60
2001 Higher Education InnovationFund 1
Single, long-term commitment to a stream offunding to “support universities’ potential to
e know
HEIF was launched in 2001 to bring together anumber of previously independently administered
S
ii
‘–adniit
elt–a2Rnir2
tonHso
%
Buckinghamshire and Oxfordshire) is the sixth highest
act drivers of growth in theconomy”
ource: Minshall and Wicksteed (2005).
ncreased government support for entrepreneurial activ-ties.
Examples of financial incentives to develop theirthird stream’ activities – or business orientated researchdeveloping commercially orientated services and so onre shown in Table 1. The UK is more ‘efficient’ at pro-ucing university spin-offs than the US, measured by theumber of research dollars. On average one spin-off firms formed for every £15 million of research expendituren the UK, compared with one for every £44 million inhe US (UNICO, 2003).
It is not only universities that are ‘encouraged’ to bentrepreneurial; since the year 2000 government-fundedaboratories have also been given similar incentives tohe universities to be more commercially orientated
patterns also found in the US (Branscomb, 1993),nd in other countries in Europe (see Lockett et al.,005; Lawton Smith, 2003). In 2001, the Public Sectoresearch Exploitation Fund was introduced along withew guidelines on incentives and risk taking for staff. Annitial £25 million was provided, followed by a secondound awards worth £15 million, announced in January004.4
Reflecting political priorities, by 2000 the majority ofhe UK’s universities had dedicated personnel workingn technology transfer, around the time that the rate ofumber of spin-offs began to increase rapidly. The third
EBI survey shows the rapid increase in the number ofpin-off companies from around 70 a year on averagen the previous 5 years, 203 were formed in 1999/2000,
4 www.ost.gov.uk/enterprise/knowledge/#Public20Sector%20Research%20Exploitation%20Fund%20(PSRE).
ledge third stream funding sources. This was thenextended (HEIF2) in 2004 with £185 m awarded
248 in 2000–2001 and 213 in 2001/2002 (DTI, 2004).This is about half the number (450) formed in the sameyear in the US and Canada (AUTM, 2003). UNICO’s2002–2003 survey of 75 institutions, including 25 of thetop 30 UK universities, based on research income, foundthat the number of spin-off companies had remained rel-atively constant with an average of two companies perinstitution formed during 2003, with most activity con-centrated in relatively few universities, that is, as in theUS, the most the most research intensive.
4. The Oxfordshire case study
Oxfordshire’s three universities and seven national/international research laboratories (the research base)are located in one of Europe’s most innovative regions.Not only does the county have a rapidly growing high-tech economy, it also has arguably the most advancedinnovation support system in Europe.5 With respect tothe former, Chadwick et al. (2003) report that Oxford-shire has some 1400 high-tech firms employing 37,000people employing around 12% of the county’s work-force. The county has the third largest high-tech employ-ment amongst UK counties (high-tech as a percentage oftotal employment), and the wider sub-region (Berkshire,
in a European listing almost completely dominated byGerman regions. For high-tech services, the sub-regioneasily tops the European listings. But it is the rate of
5 In 2006, Oxfordshire won its third EU Award of Excellencein Innovation Transfer see http://www.oxin.co.uk/news/newsitem.php?newsid=75.

rch Pol
versity research groups work on genomics. Third, the
1558 H.L. Smith, K. Ho / Resea
growth of activity which is most remarkable. Between1991 and 2000, in percentage terms, Oxfordshire was theUK’s fastest growing county for high-tech employment.Using a narrow Butchart-based definition of high-tech,the rate of growth was 141.0% and using the broaderOECD definition, the rate of growth was 82.5%. Usingthe OECD definition, the rate of growth was 161.7%.With regard to the latter, in 2002, Oxfordshire won itssecond EU Excellence award for innovation.
Unlike in the US, however, UK local innovationsupport systems do not have regional funding of anyscale. Most initiatives have funding from the Depart-ment of Trade and Industry, although in the early days,the main activities for supporting science and tech-nology enterprise were initiated by a local charitabletrust (The Oxford Trust) (see Lawton Smith, 2003).These include networking events, the establishment ofincubators and the Oxfordshire Investment Opportu-nity Network (OION) which matches investors to firms.A number of activities have been dedicated to thebiotech/medical instruments sectors such as the Oxford-shire BiotechNet and DiagnOx, which offers services tothe diagnostics industry (see Lawton Smith et al., 2003).
4.1. The public sector research base
Oxfordshire’s public sector research base comprisesthree universities and seven research laboratories.6 Theinstitutions are:
Universities:Oxford University.Oxford Brookes University.Cranfield University, Defence Science, Technologyand Management (DCMT) at Shrivenham, part ofCranfield University based in Buckinghamshire.
Public research laboratories:Rutherford Appleton Laboratory (RAL): Harwell.United Kingdom Atomic Energy Authority(UKAEA): Harwell.United Kingdom Atomic Energy Authority
(UKAEA): Culham.National Radiological Protection Board (NRPB):Didcot.6 These institutions have different sources of funding and have vary-ing status. RAL forms part of the Council for the Central Laboratoryof the Research Councils (CCLRC) and is funded out of the researchcouncils budget, the UKAEA laboratories are now funded by theDepartment of Trade and Industry – and parts of the UKAEA under-went privatisation in the early 1990s (see Lawton Smith, 2003).
icy 35 (2006) 1554–1568
National Environment Research Council (NERC)Centre for Ecology and Hydrology: Oxford.Medical Research Council (MRC) Units attachedto the Pharmacology Department, Human Anatomyand Genetics Department, Institute of MolecularMedicine and the Department of Biochemistry:Oxford.Joint European Torus (JET): Culham.
All of these institutions have had spin-off compa-nies identified with founders affiliated to them. Four ofthe seven public research laboratories have technologytransfer offices in one form or another. Oxford Univer-sity and RAL have both created companies to managetheir technology transfer. Both Oxford Brookes Univer-sity and Cranfield University have set up specific officesfor the purpose. As Oxford University is the main sourceof spin-offs, more detail is provided by way of back-ground.
4.2. Oxford University
Oxford University is one of the world’s top univer-sities. In a world ranking of universities published in20047 it is rated 9th. On another list produced by theUK’s Times Higher Education Supplement (2004) usinga different set of indicators, Oxford was ranked sixth.Its position in these ranking is due to three distinctivefeatures. These are first, that the university has high con-centration of ‘star scientists’. It has more academic staffworking in world-class research departments (rated 5* or5 in the 2001 Research Assessment Exercise) than anyother UK university (Oxfordshire Bioscience Network,2002). Second, it is ranked the world’s third best biomed-ical university behind Harvard and Cambridge on thebasis of citations per paper (Ince, 2005). The MedicalSciences Division, which broadly covers most of thebiomedical research at Oxford, in 2003–2004 accountedfor 56% of the University’s external research income.The university specialises in genomics - 50% of uni-
University’s position as a centre of academic excellenceis consolidated by its ongoing development of inter-disciplinary research centres (14 in the biomedical field)
7 Institute of Higher Education, Shanghai Jiao Tong Universityed.sjtu.edu.cn/ranking.htm. Universities were ranked by several indi-cators of academic or research performance, including alumni and staffwinning Nobel Prizes and Fields Medals, highly cited researchers,articles published in Nature and Science, articles in Science CitationIndex-expanded and Social Science Citation Index, and academic per-formance with respect to the size of an institution.

rch Pol
ama
tonfctaoemWiagIb£p
oisor
TI
I
I
O
S
H.L. Smith, K. Ho / Resea
nd groups cutting across traditional subject boundaries,any of which collaborate with international academic
nd industrial partners.Oxford University also has an elite commercialisa-
ion system. The main mechanism for university spin-ffs is through Isis Innovation, the university’s tech-ology transfer company. This organisation althoughormed in 1988, did not become the driving force forommercialisation of the university’s research activi-ies until 1997 with the appointment of Dr. Tim Cook,
successful entrepreneur and business angel in hiswn right. Under his leadership, Isis Innovation hasxpanded and now has the largest number of com-ercialisation staff of UK universities (Minshall andicksteed, 2005) and has been very successful in attract-
ng government as well as private funding for spin-offctivities, being awarded funds from all of the majorovernment programmes shown in Table 1. Alongsidesis is the Oxford Science Enterprise Centre (OxSEC)ased in the Said Business School which received500,000 in start-up funding from the DTI under the SECrogramme.
The success of Isis Innovation in managing the spin-ffs process and patenting and licensing activities is
ndicated by Table 2. This shows that Oxford Univer-ity generates three times as many as the UK averagef two university spin-offs a year. Moreover, the successate is very high, very few of the spin-offs supportedable 2sis Innovation record 1999–2003
Year ended march
1999 2000
sis historyUniversity investment £500,000 £1 milliStaff 9 17Projects 243 319Patents filed 51 55Licences/options 18 21New companies 3 6
nvestment in spin-out companiesBusiness Angel Start Up Investment £25 millionVenture Capital Follow on Investment £153 millionTotal Capitalisation of Spin-outs £308 millionCurrent University Equity in Spin-outs £10.8 million
xford University Challenge Seed FundInvestment (Proof of Concept/Seed capital) £4 millionBusiness Angels Co-investment £21.4 millionNumber of Projects 68Licences 4UCSF Equity holding in 21 companies
ource: Isis Innovation.
icy 35 (2006) 1554–1568 1559
by Isis Innovation have failed. The table also shows theinvestment in spin-off companies and licensing activi-ties. Oxford/Isis is an exemplar of Lockett and Wright’s(2005) finding that both the number of spin-out com-panies created and the number of spin-out companiescreated with equity investment are positively associatedwith expenditure on intellectual property protection, thebusiness development capabilities of TTOs and the roy-alty regime of the university.
5. The Research study
5.1. Methodology
The research study conducted between July 2004 andMarch 2005, had four elements: (i) defining spin-offs, (ii)the identification of the total population of technology-based firms that had their origins in the county’s publicsector research base on the basis of that definition, (iii)measurement of performance and (iv) an assessment offactors associated with that performance.
The first task was to define spin-offs. The term ‘spin-off’ is contested and inconsistent, often referring to anynew, initially small, high technology or knowledge inten-
sive company whose intellectual capital has its origins ina university or public research institution. Some defini-tions restrict the term to those firms where the intellectualproperty of the university is formally transferred to the2001 2002 2003 5 years
on £1 million £1 million £1 million21 23 34415 476 62763 82 65 31636 42 71 1888 8 7 33
rch Pol
1560 H.L. Smith, K. Ho / Reseastart-up firm, for example AUTM and academic stud-ies such as those by Shane (2004), Pirnay et al. (2003)and Lockett and Wright (2005). Other studies, includ-ing the majority of OECD countries (OECD, 2001)8
and UNICO (2003) do not use this criterion. UNICOdefines spin-offs as ‘companies set up by the institutionbased upon its IP and people’. Similarly the definition ofspin-offs in the Higher Education Business–Interaction(HEBI) surveys for Higher Education Funding Coun-cil for England (HEFCE) is broad ‘relating to estab-lishing of new legal entities and enterprises createdby the HEI9 or its employees to enable the commer-cial exploitation of knowledge arising from academicresearch. Such companies may or may not be partlyowned by the relevant HEI, or by existing or previousmembers of the HEI. Other start-up companies may beformed by HEI staff or students, without the direct appli-cation of HEI-owned IP’. The usual criterion is that thenew company would not have come into existence with-out intellectual input from the institution.10 Druilhe andGarnsey (2004, p. 274) count only those companies thatwere direct spin-outs, that is, ‘companies drawing onuniversity-based technological and scientific knowledgeand involving academics or students who were still mem-bers or who had just quit the university’. This definitionis necessarily less restrictive than those above becauseCambridge, unlike Oxford which introduced new ruleson the ownership of IP in 1997, does not yet assertthe rights to the IP of its staff, students and visitors,although at the time of writing it was on the verge ofdoing so. Rappert and Webster (1997), Segal Quince andPartners (1985) and Chadwick et al. (2003) use simi-lar but wider set of criteria in order to reflect the rangeof processes by which companies are incubated withinuniversities.
This study takes a similar approach to defining spin-offs to Druilhe and Garnsey (2004) but makes a distinc-tion between spin-offs and founder affiliates. The formerrefers to technology-based company founded by a mem-ber/former member of a university or one of the sevenlaboratories using IP developed in the institution bythe founding individual(s). The latter refers technology-
based companies where the founders were members ofthe institutions concerned. This category includes for-mer students, as is the case with Lindholm Dahlstrand8 OECD surveyed 19 countries on their spin-offs activity, asking fornumber of spin-offs and definitions used to identify them.
9 Higher Education Institute (HEI).10 Establishing of new legal entities and enterprises created by the
HEI.
icy 35 (2006) 1554–1568
(1997), in lists compiled by Stanford University11 as wellas by Druilhe and Garnsey (2004) and Segal Quince andPartners (1985). On this basis, the population includesfirms that pre-date the technology transfer systems estab-lished in the late 1990s. While the study focused pri-marily on technology-based spin-offs, in collecting data,many other companies were identified for example in theservice sector, which are not included in this analysis.
As there are no official records of spin-off compa-nies, the next task was to identify the population of allpossible spin-offs from the 10 institutions and whetherthey were live or had ceased trading, had merged or hadbeen acquired. The main sources of information werethe first author’s doctoral thesis from the 1980s (LawtonSmith, 1990), Isis Innovation, local newspapers datingback to the 1980s, the universities and individual Oxfordcolleges’ alumni associations, the Oxford Trust, depart-ments within the universities, the laboratories and localinnovation centres. Companies House data was used tocheck the status of the companies. Over 200 companieswere investigated over the course of the research, withdata collection in two phases. The first, up till December2004, produced an initial data set of 167 technology-based companies. Further investigation up to the end ofMarch 2005 reduced this number to 114, divided intospin-offs with university/laboratory IP (64 firms) andwith founder affiliation (50)—academics, students andtechnicians.
Standard measures of company performance such asthose based on financial data including turnover, positionin finance cycle, and equity owned by external organi-zations and non-financial measures include number ofpeople employed, number of offices/subsidiaries onlygive a snapshot of performance of the firm. In this study,a small number of performance indicators were chosenbecause of resource constraints. These were employ-ment, turnover, market capitalisation and patent andlicencing activity. And, in order to monitor changes overtime, data were collected for each year dating back to1994 and up to up to and including 2002 as these arethe dates for which most complete information is avail-able. After 2002, a number of companies were subjectto merger or acquisition by firms not located in Oxford-shire. As data is more difficult to obtain on companiespost-acquisition, data is included on firms up to the pointof acquisition or merger. The public limited companies
(Plcs) were studied as a separate group due to the signif-icant differences in the scale of operation between themand limited companies (Ltds).11 www.stanford.edu/group/wellspring/.
H.L. Smith, K. Ho / Research Pol
tcbmfitciasg
tcpTwlEcwctnbr
5
aU
cca
5.3. Age profile and survival rate
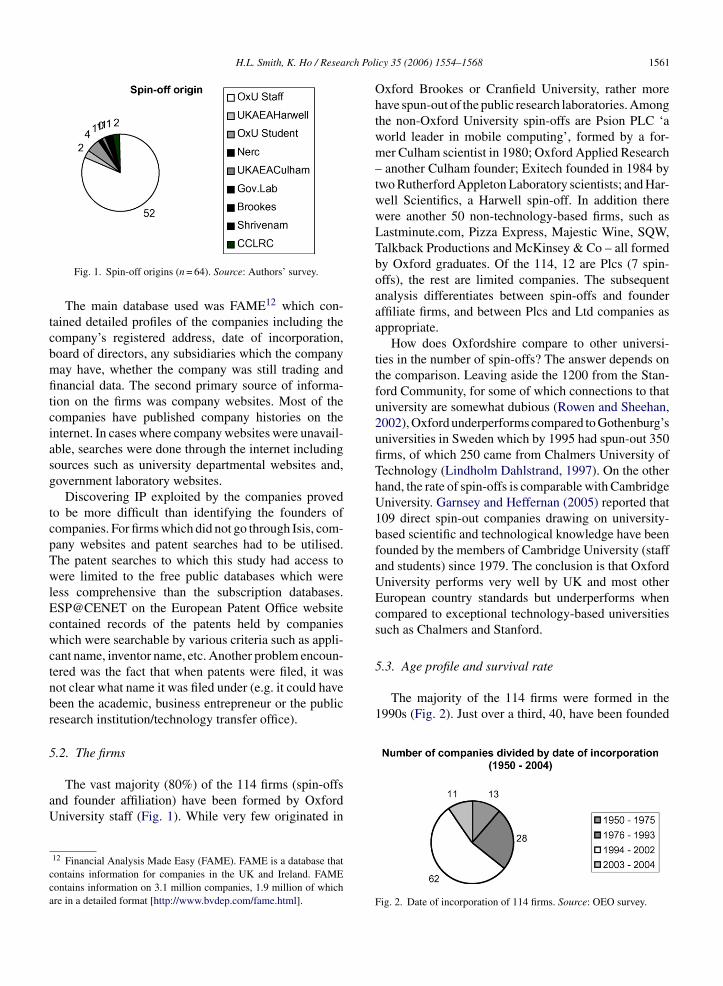
The majority of the 114 firms were formed in the1990s (Fig. 2). Just over a third, 40, have been founded
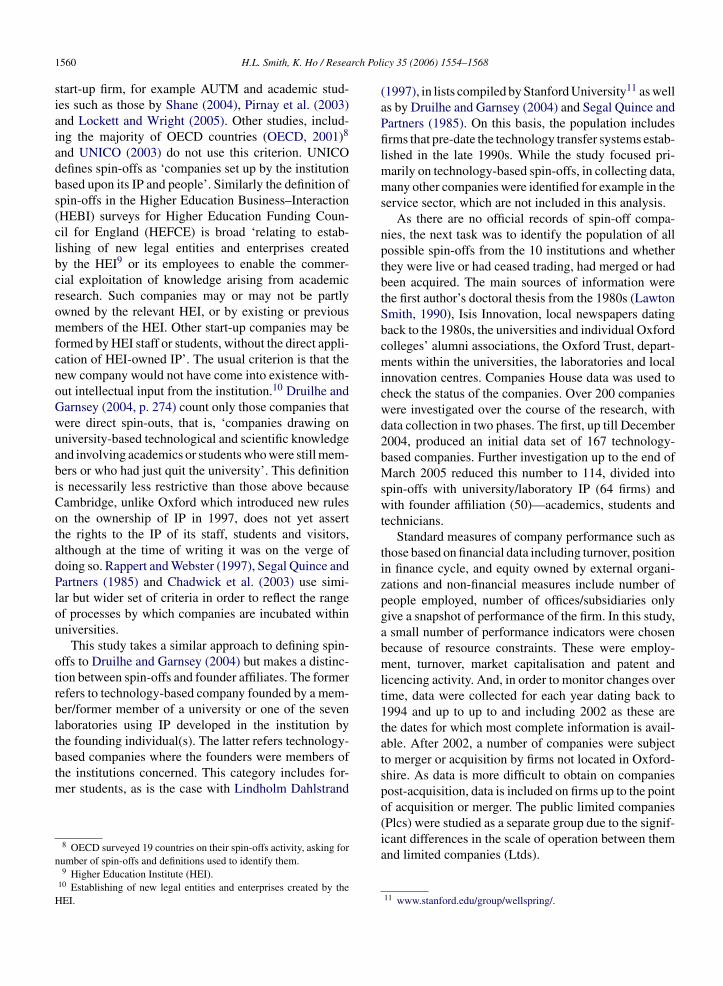
Fig. 1. Spin-off origins (n = 64). Source: Authors’ survey.
The main database used was FAME12 which con-ained detailed profiles of the companies including theompany’s registered address, date of incorporation,oard of directors, any subsidiaries which the companyay have, whether the company was still trading andnancial data. The second primary source of informa-
ion on the firms was company websites. Most of theompanies have published company histories on thenternet. In cases where company websites were unavail-ble, searches were done through the internet includingources such as university departmental websites and,overnment laboratory websites.
Discovering IP exploited by the companies provedo be more difficult than identifying the founders ofompanies. For firms which did not go through Isis, com-any websites and patent searches had to be utilised.he patent searches to which this study had access toere limited to the free public databases which were
ess comprehensive than the subscription databases.SP@CENET on the European Patent Office websiteontained records of the patents held by companieshich were searchable by various criteria such as appli-
ant name, inventor name, etc. Another problem encoun-ered was the fact that when patents were filed, it wasot clear what name it was filed under (e.g. it could haveeen the academic, business entrepreneur or the publicesearch institution/technology transfer office).
.2. The firms
The vast majority (80%) of the 114 firms (spin-offsnd founder affiliation) have been formed by Oxfordniversity staff (Fig. 1). While very few originated in
12 Financial Analysis Made Easy (FAME). FAME is a database thatontains information for companies in the UK and Ireland. FAMEontains information on 3.1 million companies, 1.9 million of whichre in a detailed format [http://www.bvdep.com/fame.html].
icy 35 (2006) 1554–1568 1561
Oxford Brookes or Cranfield University, rather morehave spun-out of the public research laboratories. Amongthe non-Oxford University spin-offs are Psion PLC ‘aworld leader in mobile computing’, formed by a for-mer Culham scientist in 1980; Oxford Applied Research– another Culham founder; Exitech founded in 1984 bytwo Rutherford Appleton Laboratory scientists; and Har-well Scientifics, a Harwell spin-off. In addition therewere another 50 non-technology-based firms, such asLastminute.com, Pizza Express, Majestic Wine, SQW,Talkback Productions and McKinsey & Co – all formedby Oxford graduates. Of the 114, 12 are Plcs (7 spin-offs), the rest are limited companies. The subsequentanalysis differentiates between spin-offs and founderaffiliate firms, and between Plcs and Ltd companies asappropriate.
How does Oxfordshire compare to other universi-ties in the number of spin-offs? The answer depends onthe comparison. Leaving aside the 1200 from the Stan-ford Community, for some of which connections to thatuniversity are somewhat dubious (Rowen and Sheehan,2002), Oxford underperforms compared to Gothenburg’suniversities in Sweden which by 1995 had spun-out 350firms, of which 250 came from Chalmers University ofTechnology (Lindholm Dahlstrand, 1997). On the otherhand, the rate of spin-offs is comparable with CambridgeUniversity. Garnsey and Heffernan (2005) reported that109 direct spin-out companies drawing on university-based scientific and technological knowledge have beenfounded by the members of Cambridge University (staffand students) since 1979. The conclusion is that OxfordUniversity performs very well by UK and most otherEuropean country standards but underperforms whencompared to exceptional technology-based universitiessuch as Chalmers and Stanford.
Fig. 2. Date of incorporation of 114 firms. Source: OEO survey.

rch Policy 35 (2006) 1554–1568
Fig. 3. Sector profile Oxfordshire’s technology-based spin-off firms(spin-offs and founder affiliation). Source: OEO survey. Othersincludes: aerospace (1), nuclear industry (2), crystallography (2), elec-tromagnetic engineering (1), wire chamber technology (1), medical
1562 H.L. Smith, K. Ho / Resea
between 1998 and 2004. However, there was consider-able entrepreneurial activity earlier than that. By 1987,some 35 firms (including consultancy companies notcounted here) had their origins in Oxford University(Lawton Smith, 1990). These include Littlemore Sci-entific Engineering Company (1954) and Oxford Instru-ments (1959) and Oxford Lasers (1977). Nearly 40%had been established by 1993, considerably pre-datingthe 1997 Labour Government’s initiatives, Oxford Uni-versity’s own radical change in policy on technologytransfer and Dr. Cook’s arrival. This suggests that inspite of the adverse university culture in the 1980s (seeLawton Smith, 1990), there was, as in Cambridge anascent pattern of academic entrepreneurship and of asimilar magnitude (Segal Quince and Partners, 1985).
The survival rate is high, 90%, well above the national3-year firm survival rate, in spite of the inherent risks fornew technology ventures (De Coster and Butler, 2005).Of the 8 Ltds which were dissolved, three traded forover 20 years. Another dimension to survival is whetherfirms have been acquired or merged. Of the 114, 9 firmshave been acquired or merged in the last few years, 8biomedical firms, reflecting the much broader trend ofM&A in biotech felt across Europe – but led by the UK(DTI, 2005). The DTI Report concludes that the dis-appearance of such companies was the consequence oftheir failure to translate significant fundamental and clin-ical research into tangible value in the form of advancedproducts. This is not necessarily the case, however, as inOxfordshire two of the fastest growing biotech compa-nies were acquired; Powderject was bought by Chiron in2003, in turn acquired by Novartis in 2005, and Medis-ense bought by Abbott Laboratories in 2002 – whichat the time of acquisition employed 1100. An earliermerger was Oxford Asymmetry formed in 1991, mergedwith Evotech of Germany in 2001, to form Evotech OAIand floated on the stock market in 1998. At the timeof merger, Oxford Asymmetry’s shares were valued at£316 million and the company was making profits of £3.7million a year. Other spin-offs have been subject to hos-tile takeovers. For example two biomedical companies(which predate Isis Innovation), Oxford GlycoSciences(OGS) (formed in 1988) was acquired by Celltech whichwas in turn bought out by the Belgian company UCB,while Oxford Molecular (1989) was acquired by Vernalisin 2003.
There is some evidence that these mergers and acqui-sitions have stimulated recycling intellectual property
that formed the original spin-off company, and have ledto further entrepreneurial activity. For example, post-acquisition by Chiron, PowderMed acquired its powderinjection technology from PowderJect and, followinginstruments (2), glass engineering (1), biology (2), materials (1),robotics (1), scientific consultancy (1).
OGS’s acquisition by Celltech, the proteomics businessemerged in 2004 as a service business called OxfordGenome Sciences after a management buyout. Thisactivity is likely to be made easier by the wealth of localentrepreneurship expertise referred to earlier, whichother studies suggest contributes to the entrepreneurialculture of the county (Lawton Smith, 2003).
5.4. Sector
The diversity of firms is illustrated by Fig. 3 whichshows 8 main sectors and a variety ‘others’. Not surpris-ingly given the research profile of Oxford University, thelargest group within the 114 firms is the biomedical sec-tor: 29 are biotech, 16 pharmaceuticals which togetheraccount for 40% of firms and all are spin-offs. This com-bined figure is very similar to that of biomedical spin-offsin Cambridge and over a similar timeframe (Garnsey andHeffernan, 2005). IT is the largest single sector with 33firms (29%). In 2002, the two sectors employed simi-lar numbers of people (3435 biotech) compared to 3082(IT) and combined account for over two thirds of thetotal employment.
5.5. Employment
The number of employees generated by the compa-nies for which data is available (Table 3) between 1994and 2002 reflects the overall increase in the population
of firms. By 2002 employment stood at just over 9000,approximately 3.5% of total Oxfordshire employment(Fig. 4). Not all firms could be tracked for employ-ment totals, however, hence the data underestimates the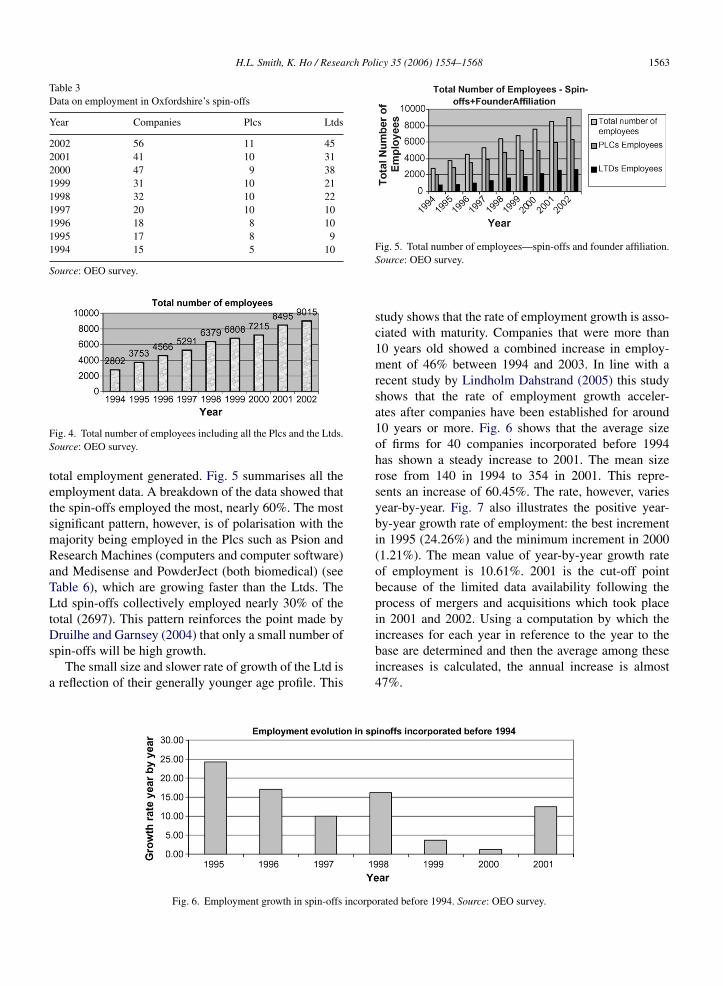
H.L. Smith, K. Ho / Research Policy 35 (2006) 1554–1568 1563
Table 3Data on employment in Oxfordshire’s spin-offs
Year Companies Plcs Ltds
2002 56 11 452001 41 10 312000 47 9 381999 31 10 211998 32 10 221997 20 10 101996 18 8 101995 17 8 91994 15 5 10
Source: OEO survey.
FS
tetsmRaTLtDs
a
ig. 4. Total number of employees including all the Plcs and the Ltds.ource: OEO survey.
otal employment generated. Fig. 5 summarises all themployment data. A breakdown of the data showed thathe spin-offs employed the most, nearly 60%. The mostignificant pattern, however, is of polarisation with theajority being employed in the Plcs such as Psion andesearch Machines (computers and computer software)nd Medisense and PowderJect (both biomedical) (seeable 6), which are growing faster than the Ltds. Thetd spin-offs collectively employed nearly 30% of the
otal (2697). This pattern reinforces the point made by
ruilhe and Garnsey (2004) that only a small number ofpin-offs will be high growth.The small size and slower rate of growth of the Ltd is
reflection of their generally younger age profile. This
Fig. 6. Employment growth in spin-offs incorpo
Fig. 5. Total number of employees—spin-offs and founder affiliation.Source: OEO survey.
study shows that the rate of employment growth is asso-ciated with maturity. Companies that were more than10 years old showed a combined increase in employ-ment of 46% between 1994 and 2003. In line with arecent study by Lindholm Dahstrand (2005) this studyshows that the rate of employment growth acceler-ates after companies have been established for around10 years or more. Fig. 6 shows that the average sizeof firms for 40 companies incorporated before 1994has shown a steady increase to 2001. The mean sizerose from 140 in 1994 to 354 in 2001. This repre-sents an increase of 60.45%. The rate, however, variesyear-by-year. Fig. 7 also illustrates the positive year-by-year growth rate of employment: the best incrementin 1995 (24.26%) and the minimum increment in 2000(1.21%). The mean value of year-by-year growth rateof employment is 10.61%. 2001 is the cut-off pointbecause of the limited data availability following theprocess of mergers and acquisitions which took placein 2001 and 2002. Using a computation by which theincreases for each year in reference to the year to thebase are determined and then the average among these
increases is calculated, the annual increase is almost47%.rated before 1994. Source: OEO survey.

1564 H.L. Smith, K. Ho / Research Policy 35 (2006) 1554–1568
Fig. 7. Average size of spin-offs incorporate
(Oxford Instruments).
Fig. 8. Total turnover of 45 Oxfordshire companies. Source: OEO sur-vey.
5.6. Turnover
Fig. 8 shows turnover data for the years between 1994and 2004. Table 4 shows the number of companies cov-ered for each of those years. Table 5 shows the turnoverdata for a maximum of 45 firms between those dates. Thisdata has the same problem of consistency as the employ-ment data as figures for turnover was not available forall the firms and that the number of firms included in thecalculation increases as the population expands.
Table 4 shows that total turnover for the 45 compa-
nies in 2002 was nearly £1 billion. As would be expected,turnover was dominated by the Plcs (see also Table 6).The largest companies by turnover are two of the old-est, Oxford Instruments (c£214 million in 2002) andTable 4Turnover data availability
Year Companies Ltds Plcs
2002 45 36 92001 40 31 92000 32 24 81999 32 22 101998 24 14 101997 23 13 101996 19 11 81995 16 11 7
Source: OEO survey.
d before 1994. Source: OEO survey.
Research Machines (£197 million) in the same years.There is then a large gap to the third largest, Psion andthe largest biomedical company (PowderJect) and then afurther sharp decreased to the next group of Plcs and thenof course the much smaller Ltds. The average turnoverfor the Ltds is c£564,000.
5.7. Market capitalization
Details of the top 10 performing companies byturnover, seven of them Plcs, are shown in Table 6, withvalues of market capitalization of five of the top sixcompanies, and patents for all of them. The remarkablefeatures of top three are that they are all manufacturingfirms and none have been subject to merger or acquisi-tion. Five of the top 10 are manufacturing companies andfour are in the biomedical sector. The table also showsbig variations in the relationship between turnover andmarket capitalisation, with Medisense, which has beenacquired, having by far the largest market capitalisationvalue on the figures available, whilst the Plc spin-off stillunder original ownership has a value of £121 million
Table 6 also shows that there are five major employersemploying around 1000–1500. There is then a big gapto the next set of companies. This shows that one of
Table 5Turnover of 45 Oxfordshire spin-offs
Total (£) Plcs (£) Ltds (£)
1994 116,720,545.00 66,252,000.00 50,468,545.001995 291,259,336.00 230,337,206.00 60,922,130.001996 437,345,208.00 372,116,355.00 65,228,853.001997 504,020,522.00 420,282,038.00 83,738,484.001998 579,161,388.00 492,611,324.00 86,550,064.001999 602,516,956.00 512,288,697.00 90,228,259.002000 722,487,276.00 586,648,000.00 135,839,276.002001 869,062,933.00 677,839,220.00 191,223,713.002002 985,843,120.00 783,036,000.00 202,807,120.00
Source: OEO survey.

H.L. Smith, K. Ho / Research Policy 35 (2006) 1554–1568 1565
Table 6Top 10 performing Oxfordshire spin-offs and founder affiliation
Name Date ofincorporation
Sector Turnover 2002 Employment2002
Patents Marketcapitalisation
Oxford Instruments Plc 9/30/1963(established1959)
Optoelectronics £213,680,000.00 1773 49 £121.00 million
Research Machines Plc 11/30/1973 InformationTechnologies
£202,158,000.00 1518 25 £170.97 million
PSION PLC 10/3/1980 InformationTechnologies
£137,920,000.00 1054 30 £260.32 million
PowderJect Pharmaceuticals Plc 1/1/1994 Pharmaceuticals £113,000,000.00 984 1 N.A.Medisense Ltd. 10/12/1990 Pharmaceuticals £65,362,000.00 1151 22 £379.81 millionEvotec OAI Plc 12/19/1991 Biotechnology £31,636,000.00 358 13 N.A.Sophos Plc 2/4/1987 Information
Technologies£31,582,000.00 301 1 N.A.
Crystalox Ltd. 10/3/1994 Crystallography £30,924,678.00 75 1 N.A.Penlon Ltd. 7/23/1996 Medical Instruments £20,509,147.00 276 10 N.A.Solid State Logic Ltd. 1/6/1970 Console Manufacturer £19,710,000.00 235 6 N.A.
Source: OEO survey.
Table 7Top 10 spin-offs from Stanford University
Company Revenues(US$ million) 2001
Net income(US$ million) 2001
Market capitalisation(US$ million) on 3/28/2002
Hewlett-Packard 44,211.0 751.0 34,855.0Cisco Systems 18,290.0 −2294.0 123,953.1Sun Microsystems 14,059.0 −563.0 28,651.1Agilent 7,257.0 −241.0 16,216.5SGI 1,684.5 −405.0 836.4Electronic Arts 1,562.2 36.3 8,765.7Atmel 1,472.3 −418.3 4,735.2Cadence Design 1,430.4 141.3 5,664.5IN
S
taoe
SIsrlp3o
a
ntuit 1,372.4vidia 1,371.4
ource: www.stanford.edu/group/wellspring.
he smallest companies by employment, Crystalox, hasproportionately very high turnover. The distribution
f patents is concentrated in the largest firms with thexception of PowderJect which had only 1.
In comparison with the major US universities, such astanford, Oxford University’s spin-offs are small beer.n FY2001, the largest Stanford spin-offs were respon-ible for generating 42% (US$ 106.3 billion) of the totalevenue of The Silicon Valley 150—an annual list of theargest Silicon Valley firms. The Stanford-founded com-anies on the list had a total market capitalization of US$32.5 billion, or 36% of the total market capitalization
f the Silicon Valley 150 firms (Table 7).13Rowen and Sheehan (2002), however, are cautiousbout the Stanford data. Three main problems exist. First,
13 www.stanford.edu/group/wellspring/economic.html.
−48.1 8,158.8177.1 6,413.3
is the definition of Silicon Valley – given the university’sresearch and teaching activities are not geographicallybounded. Second, is defining a “Stanford” startup orproduct. They argue that most companies and ideas forproducts do not originate from just one source. The thirdis causation and whether the high level of entrepreneur-ship by graduates from the Graduate School of Businessduring the 1990s reflects changes in the School, changesin the character of the students, or increased opportu-nities in the Valley. The authors conclude that somecombination of these has been involved.
5.8. Patent data
Patent data is an indicator the technological innova-tive abilities of the company. What happens to techno-logical advance might be more important to society asa whole than job generation (Piva and Colombo, 2005).

rch Pol
1566 H.L. Smith, K. Ho / ReseaThese authors find that academic spin-offs, because theyemphasise technical activities, achieve superior inno-vative performances than other new technology-basedfirms in spite of lower growth performances. In this study,data was available on patenting for a total of 45 compa-nies of the 114 companies for both the US Patent andTrademark Office (25 companies) and European PatentOffice (41). A total of 265 patents are registered withthe former and 373 with the latter. The Plcs dominatethe number of patents in both cases (219 in the formerand 245 in the latter). Some companies have registeredpatents in Europe and not in USA and vice versa. Whilethis suggests a high rate of patenting, we have not beenable to find other studies which have looked at the rateof patenting by university spin-offs.
6. Conclusions
The case study of spin-offs in Oxfordshire illustratesa number of conceptual and empirical issues relatingto the identification of the rate of spin-offs from par-ticular institutions and their performance. Conceptually,academic and PRL spin-offs are a manifestation of par-ticular normative political agenda firmly embedded inlate 20th century and early 21st century liberal philoso-phy about universities’ role in society (Bozeman, 2000).In the UK, the cooperative technology model is drivenby a series of funding mechanisms designed to encour-age out-reach and entrepreneurial activity. In the case ofOxford University, the recent rapid rise in the numberof spin-offs is associated with the business capabilitiesof Isis Innovation (cf. Lockett and Wright, 2005) andrecent government policy. Oxford, like Cambridge, con-siderably outperforms the UK average for the number ofspin-offs.
Isis Innovation, a highly professional operation, isnow achieving its entrepreneurial objectives by appoint-ing Dr. Tim Cook in the first instance, followed bya recognition within the university of the importanceof what Dr. Cook was achieving, which led to furtherresources and a greater willingness invest in spin-offcompanies (institutional change). This change coincidedwith the availability of funds from national initiativessuch as the Universities Challenge Fund (see Table 1)to further support those activities. The ability of theIsis team to draw on local expertise and funds in theform of business angels, who mentor start-ups as well asinvest, and who are part of the entrepreneurial milieu of
the Oxfordshire high-tech economy, further provides theresources that both underpin the rate of spin-off (O’Sheaet al., 2005) and potentially the survival of the new ven-tures (Druilhe and Garnsey, 2004). On the other hand,icy 35 (2006) 1554–1568
many pioneering and surviving companies date back tothe 1950s, 1960s and 1970s, from both Oxford Univer-sity and the laboratories.
Empirically, there are problems in defining spin-offsand in analysing performance. This study has used abroader definition than one specifying that the universityshould own the IP that forms the basis of the com-pany. Using such a restrictive definition would not onlyexclude comparisons with Cambridge University andwith universities in countries such as Sweden and Italy,but would also mean that the overall, long-term extentof university entrepreneurial activity would be underes-timated. The main problem with measuring performanceis the lack of consistent data over a long period of time.Yet we argue that this kind of study is essential, as itdemonstrates both that the survival rate of spin-off com-panies tends to be high but also, as this study shows,it generally takes at least 10 years before their rate ofgrowth begins to accelerate. Thus, spinning out newcompanies is not a ‘quick fix’ for government economicdevelopment strategies.
The evidence from Oxfordshire is that the rate of for-mation has increased rapidly over recent years, therebymaking a significant contribution to the Oxfordshirehigh-tech economy. By 2005, over 9000 people wereemployed by the surviving companies of the total popu-lation of 114 firms, about 3.5% of the county’s employ-ment. The study shows that most firms are in the ITand biomedical sectors and that a few companies, pre-dominately the 12 Plcs, which include manufacturingand biomedical firms, have generated most employment,turnover and patents. None, however, have grown to thesize of some of the companies originating in StanfordUniversity. One of factors explaining this is that thosein engineering and computing tend to be in niche mar-kets, while in the biomedical field, there appear to bestructural problems within the UK and Europe as wholewhich limits their growth and makes leading companiesvulnerable to take-over.
Finally, while this study has focused on thetechnology-based spin-offs, there is an argument forstudying the total pattern of entrepreneurial activity gen-erated by universities and for universities to broaden theirfocus of potential entrepreneurs.
Acknowledgements
The contribution of Saverio Romeo in updating the
data and analysis is gratefully acknowledged. We wouldalso like to thank Tim Cook for his considerable help withthis study, Tim Vorley, two anonymous referees and theeditors for their helpful comments.
rch Pol
R
A
B
B
B
B
C
C
D
D
D
D
D
E
F
G
H
I
K
L
L
H.L. Smith, K. Ho / Resea
eferences
UTM, 2003. AUTM Licensing Survey: FY 2003. Association of Uni-versity Technology Managers, Northbrook, IL.
abcock-Lumish, T., 2004. Beyond the TMT bubble: patterns of inno-vation investment in the US and the UK. Working Paper 4-06,School of Geography & the Environment, Oxford University.
inks, M., Wright, M., Lockett, A., Vohora, A., 2004. Venture CapitalFinance and University Spin-outs. Mimeo, University of Notting-ham Institute for Enterprise and Innovation.
ozeman, B., 2000. Technology transfer and public policy: a reviewof research and theory. Research Policy 29, 627–655.
ranscomb, L.M., 1993. National laboratories: the search for newmissions and structures, Chapter 4. In: Branscomb, L.M. (Ed.),Empowering Technology: Implementing a U.S. Strategy. The MITPress, Cambridge MA, pp. 103–134.
hadwick, A., Glasson, J., Lawton Smith, H., Clark, G., Simmie,J., 2003. Enterprising Oxford: The Anatomy of the Oxford-shire High-tech Economy. Oxford Economic Observatory, OxfordUniversity.
larysse, B., Heinman, A., Degroof, J.J., 2001. An Institutional andResource-based Explanation of Growth Patterns of Research-basedSpin-offs in Europe. In OECD 2001 Fostering High-tech Spin-offs:A Public Strategy for Innovation STI REVIEW No. 26, OECD,Paris, pp. 95–96.
e Coster, R., Butler, C., 2005. Assessment of proposals for new tech-nology ventures in the UK: characteristics of university spin-offcompanies. Technovation 25, 535–543.
i Gregorio, D., Shane, S., 2003. Why so some universities generatemore start-ups than others? Research Policy 32, 209–227.
TI, 2004. Universities mean Business. Higher Education BusinessInteraction Survey, 2001/2 P/2004/64.
TI, 2005. Comparative Statistics for the UK, European and USBiotechnology Sectors: Analysis Year 2003. Report prepared byCritical I Limited for the Department of Trade and Industry. DTI,London.
ruilhe, C., Garnsey, E., 2004. Do academic spin-outs differ and doesit matter? Journal of Technology Transfer 29 (3–4), 269–285.
tzkowitz, H., Webster, A., Gebhardt, C., Cantisano Terra, B.R., 2000.The future of the university and the university of the future: evolu-tion from ivory tower to entrepreneurial paradigm. Research Policy29 (2), 313–330.
eldman, M., Feller, I., Bercovitz, J., Burton, R., 2002. Equity and thetechnology transfer strategies of American Research Universities.Management Science 48 (1), 105–121.
arnsey, E., Heffernan, P., 2005. High tech clustering through spinout and attraction: The Cambridge case. Regional Studies 39 (8),1127–1144.
M Treasury, 2003. Lambert Review of Business-University Collab-oration (the Lambert Report).
nce, M. (2005). ‘World University Rankings’ Times Higher October25 2005.
enny, M., Goe, W.R., 2004. The role of social embeddedness in pro-fessorial entrepreneurship: a comparison of electrical engineeringand computer science at UC Berkeley and Stanford. Research Pol-icy 33, 691–707.
awton Smith, H., 1990. The location and development of advanced
technology in Oxfordshire in the context of the research environ-ment. Unpublished DPhil Thesis. University of Oxford.awton Smith, H., 2003. Knowledge organisations and local economicdevelopment: the cases of Oxford and Grenoble. Regional Studies37 (2), 899–990.
icy 35 (2006) 1554–1568 1567
Lawton Smith, H., Glasson, J., Simmie, J., Chadwick, A., Clark, G.,2003. Enterprising Oxford: The Growth of the Oxfordshire High-tech Economy. Oxford Economic Observatory, Oxford.
Lee, C.B., Walshok, M.L., 2003. Total Links Matter: The Directand Indirect Effects of Research Universities in RegionalEconomies. Paper prepared for University of California’sIndustry-University Cooperative Research Programme, UCSDhttp://globalconnect.ucsd.edu/docs/TotalLinksMatter2003.pdf-.
Lerner, J., 2005. The University and the Start-up: lessons from thepast two decades. Journal of Technology Transfer 30 (1/2) 49–56.
Lindholm Dahlstrand, A., 1997. Growth and inventiveness intechnology-based spin-off firms. Research Policy 26 (3), 331–344.
Lindholm Dahstrand, A., 2005. University knowledge transfer and therole of academic spin-offs Paper prepared for OECD Conference,May 2005.
Lockett, A., Wright, M., 2005. Resources, capabilities, risk capital andthe creation of university spin-out companies. Research Policy 34,1043–1057.
Lockett, A., Siegal, D., Wright, M., Ensley, M.D., 2005. The creationof spin-off firms at public research institutions: managerial andpolicy implications. Research Policy 34, 981–993.
Meyer, M., Autio, E., 2004. Science-based innovation andentrepreneurship: is there a relationship between scientific disci-plines and the utilization of academic inventions in start-up compa-nies? In: R&D Management Conference, Sesimbra, Portugal, July7–9.
Minshall, T., Wicksteed, B., 2005. University spin-out companies:Starting to fill the evidence gap A report on a pilot research projectcommissioned by the Gatsby Charitable Foundation.
Mustar, P., 1997. Spin-off enterprises—how French academics createhigh-tech companies: conditions for success or failure. Science andPublic Policy 24 (1), 37–43.
Nelsen, L., 1998. The rise of intellectual property protection in theAmerican university. Science 279 (5356), 1460–1461.
Nightingale, P., Martin, P., 2004. The myth of the biotech revolution.Trends in Biotechnology 22 (11), 564–569.
OECD, 2001. Fostering High-tech Spin-offs:A Public Strategy forInnovation STI REVIEW No. 26. OECD, Paris.
O’Shea, R.P., Allen, T.J., Chevalier, A., Roche, F., 2005.Entrepreneurial orientation, technology transfer and spin-off per-formance of U.S. Universities. Research Policy 34, 994–1009.
Oxford Bioscience Network, 2002. GROWTH & Sustainability, TheCluster Report 2002. Oxford Bioscience Network, Oxford.
PACEC, 2003. The Cambridge Phenomenon: Fulfilling the Potential.PACEC, Cambridge.
Pirnay, F., Surlemont, B., Nlemvo, F., 2003. Towards a typologyof university spin-offs. Small Business Economics 21 (4), 355–369.
Piva, E., Colombo, M.G., 2005. Academic start-ups and newtechnology-based firms: a matched pair comparison. Paper pre-sented at the 5th Triple Helix conference, Turin May 2005.
Pressman, L (Ed.), 2002. AUTM Licensing Survey: FY. Associationof University Technology Managers, Northbrook, IL.
Rappert, B., Webster, A., 1997. Regimes of ordering: the commercial-isation of intellectual property in industrial-academic collabora-
tion. Technology Analysis and Strategic Management 9 (2), 115–130.Rappert, B., Webster, A., Charles, D., 1999. Making sense of diver-sity and reluctance: academic-industrial relations and intellectualproperty. Research Policy 28, 873–890.

rch Pol
1568 H.L. Smith, K. Ho / ReseaSahlman, W., Stevenson, H., Roberts, M., Bhide, A., 1999. TheEntrepreneurial Venture. Harvard Business School Press, Cam-bridge, MA.
Rowen, H.S., Sheehan, R., 2002. First Quarter Report: TheGBS and Silicon Valley (http://www.stanford.edu/dept/HPS/TimLenoir/Startup/QuarterlyRpts/ProgressReportJan02.pdf).
Segal Quince and Partners, 1985. The Cambridge Phenomenon. SegalQuince and Partners, Cambridge.
Siegel, D.S., Waldman, D., Link, A., 2003. Assessing the impact of
organisational practices on the relative productivity of universitytechnology transfer offices: an exploratory study. Research Policy32 (1), 27–48.Shane, S., 2004. Academic Entrepreneurship: University Spinoffs andWealth Creation. Edward Elgar, Cheltenham.
icy 35 (2006) 1554–1568
Slaughter, S., Leslie, L., 1999. Academic Capitalism: Politics,Policies, and the Entrepreneurial University. Johns Hokpins,Baltimore.
Times Higher Education Supplement, 2004. World University Rank-ings.
UNICO, 2003. UK University Commercialisation Survey: FinancialYear 2003. UNICO, London.
Vohora, A., Wright, M., Lockett, A., 2004. Critical junctures in thedevelopment of university high-tech spinout companies. Research
Policy 33, 147–175.Zucker, L.G., Darby, M.R., 1996. Star scientists and institutional trans-formation: patterns of invention and innovation in the formation ofthe biotech industry. Proceedings of the National Academy of Sci-ence 93 (12), 709–716.