landscape ecology, survival and space …...landscape ecology, survival and space use of lesser...
TRANSCRIPT

LANDSCAPE ECOLOGY, SURVIVAL AND SPACE USE OF
LESSER PRAIRIE-CHICKENS
by
SAMANTHA ROBINSON
B.Sc., University of Connecticut, 2011
A THESIS
submitted in partial fulfillment of the requirements for the degree
MASTER OF SCIENCE
Division of Biology College of Arts and Sciences
KANSAS STATE UNIVERSITY Manhattan, Kansas
2015 Approved by:
Major Professor
David A. Haukos

Copyright
SAMANTHA ROBINSON
2015

Abstract
The lesser prairie-chicken (Tympanuchus pallidicinctus) has experienced range-wide
population declines and range contraction since European settlement. Due to ongoing declines,
lesser prairie-chickens were listed as threatened under the Endangered Species Act in 2014;
however, uncertainty regarding the legal status of the species has developed following a judicial
decision to vacate the listing in September 2015. Regardless, new research is required for
conservation planning, especially for understudied portions and temporal periods of the occupied
range. I evaluated nonbreeding lesser prairie-chicken survival using known-fate models, and
tested for the influence of environmental, landscape and predator effects on weekly survival. I
estimated nonbreeding home-range size using fixed kernel density estimators and Brownian
Bridge movement models for VHF and Satellite tagged lesser prairie-chickens, and measured
habitat use during the 6-month nonbreeding period (16 September – 14 March). I also
determined the influence of lek location on space use intensity within home ranges using
resource utilization functions. Female survival was high (0.75, SE = 0.05) and consistent across
nonbreeding seasons, but not explainable by selected variables. Mean home range size for birds
with GPS transmitters (955 ha, SE = 128.5) was 215% larger than for individuals with VHF
transmitters (303 ha, SE = 24.1) and 136% greater during the 2014-2015 nonbreeding season
than the 2013-2014 season. Males and females were tied to leks throughout the nonbreeding
season, and this relationship was not variable across the months of the nonbreeding season.
Proportions of habitat used differed among study sites, but temporal trends were not evident.
Lesser prairie-chickens exhibited consistency among ecoregions for home-range, space use, and
survival; however, with differing habitat use among regions, management should be on the
regional scale.

Agriculture and energy development have caused fragmentation of the landscape where
lesser prairie-chickens evolved. I used known fate survival models to test if landscape
composition or configuration within sites caused survival to differ by site, as well as within home
ranges to determine if functional relationships exist between weekly survival and landscape
configuration or composition. I used Andersen-Gill models to test whether distance to
anthropogenic features affected hazard rates. Differences in survival rates between sites, with
survival rates 50% greater in Clark County, Kansas compared to Northwestern, Kansas,
corresponded to differences in the amount of grassland habitat on the landscape, but study-site
configuration was not measurably different. Increasing the number of patch types within home
ranges increased survival, indicating positive effects of heterogeneity. In addition, as distance to
fences decreased, lesser prairie-chickens experienced greater risk. Overall, further breakup of
grassland landscapes that lesser prairie-chickens occupy should be avoided, to avoid habitat loss
and fragmentation thresholds that could further affect survival rates. Additionally, fences should
be removed or avoided around active leks.

v
Table of Contents
List of Figures ............................................................................................................................... vii
List of Tables ................................................................................................................................. xi
Acknowledgments........................................................................................................................ xiv
Chapter 1 - Nonbreeding Survival of Female Lesser Prairie-Chickens ......................................... 1
Introduction ................................................................................................................................. 1
Study Area .................................................................................................................................. 5
Methods ...................................................................................................................................... 7
Capture .................................................................................................................................... 7
Monitoring .............................................................................................................................. 8
Point Vegetation Surveys ...................................................................................................... 10
Raptor Surveys ...................................................................................................................... 10
Survival Analysis .................................................................................................................. 11
Results ....................................................................................................................................... 12
Discussion ................................................................................................................................. 15
Management Implications ......................................................................................................... 20
Literature Cited ......................................................................................................................... 21
Chapter 2 - Home-range and Space Use of Nonbreeding Lesser Prairie-Chickens in Southern
Great Plains ............................................................................................................................ 38
Introduction ............................................................................................................................... 38
Study Area ................................................................................................................................ 44
Methods .................................................................................................................................... 47
Capture .................................................................................................................................. 47
Tracking ................................................................................................................................ 48
Home Range .......................................................................................................................... 49
Variation in Home Range ..................................................................................................... 50
Resource Utilization Functions ............................................................................................. 51
Habitat Use ............................................................................................................................ 52
Results ....................................................................................................................................... 52
Discussion ................................................................................................................................. 55
vi
Management Implications ..................................................................................................... 62
Literature Cited ......................................................................................................................... 63
Chapter 3 - Effects of landscape characteristics on survival of female lesser prairie-chickens ... 83
Introduction ............................................................................................................................... 83
Study Area ................................................................................................................................ 87
Methods .................................................................................................................................... 89
Capture .................................................................................................................................. 89
Tracking ................................................................................................................................ 90
Survival Analysis .................................................................................................................. 91
Andersen-Gill Modeling ....................................................................................................... 93
Results ....................................................................................................................................... 94
Study Site Composition and Configuration .......................................................................... 94
Home Range Composition and Configuration ...................................................................... 95
Andersen-Gill ........................................................................................................................ 96
Discussion ................................................................................................................................. 97
Management Implications ................................................................................................... 102
Literature Cited ....................................................................................................................... 102
Appendix A - Weekly Movements of Nonbreeding Lesser Prairie-Chickens ............................ 123
vii
List of Figures
Figure 1.1 Study site locations for female lesser prairie-chicken survival research in 2013 to
2015 in Kansas. The northwestern study site was in Logan and Gove Counties. The Red
Hills study site was in Kiowa and Comanche counties, and the Clark County study site was
in Clark County. Study sites were delineated using a Minimum Convex Polygon around
locations of lesser prairie-chickens that did not exhibit dispersal. ....................................... 26
Figure 1.2 Mortality distribution by week across the 25-week nonbreeding season for three sites
in Kansas (Northwest, Clark County and Red Hills). With all sites combined, there was no
evident trend in when mortalities occurred across the nonbreeding season. ........................ 27
Figure 1.3 Survival rates (with 95% CI) by study site in Kansas for female lesser prairie-chickens
during the 6-month nonbreeding season (16 September-8 March; 25 weeks), pooled across
years (2013-2014 and 2014-2015). Study sites are defined as NW for northwestern Kansas,
RH for the Red Hills, Kansas, and Clark for the Clark County, Kansas. Weekly estimates
were generated in Program MARK, and the delta method was used to generate standard
error for the entire 25-week nonbreeding season. ................................................................. 28
Figure 1.4 Counts of raptors (number of birds/16 km) during weekly surveys conducted at each
of the three Kansas study sites (Northwest, Red Hills, Clark Co.) for the 6-month
nonbreeding season across 2014-2015. Vertical line at week-10 representing the week with
the highest hazard instantaneous hazard rate corresponding to the first high counts of
raptors. Counts were for the entire 16-km survey, where 3-minute point counts were
conducted every 0.8 km. ....................................................................................................... 29
Figure 1.5 Estimates of survival from a Kaplan-Meier survival analysis (with 95% CI), showing
differences between female lesser prairie-chickens marked with SAT-PTT and VHF
transmitters in Kansas separated by the two seasons of data collection for 2013-2014 , 2014-
2015, and both years combined. The 95% confidence intervals around the estimates do not
overlap for 2013-2014 but do for 2014-2015 and combined years. ..................................... 30
Figure 1.6 Kaplan-Meier survival curve (with 95% CI as dashes) illustrating cumulative survival
curves as solid lines for female lesser prairie-chickens in Kansas outfitted with VHF (n =
42) transmitters and SAT-PTT transmitters (n = 52) over the 25-week nonbreeding season
viii
(16 September – 8 March), combining nonbreeding seasons from 2013-2014 and 2014-
2015. ...................................................................................................................................... 31
Figure 1.7 Hazard rate for female lesser prairie-chickens across the 6-month 2013-2014 and
2014-2015 nonbreeding seasons in Kansas. Week 1 corresponds to the 16-22 of September.
Hazard rates indicate the instantaneous hazard rate for each week. A constant smoothing
factor of 1.2 was used. The peak at the end of the curve is due to increased censoring of
individuals during the final months of the nonbreeding season in that year. ....................... 32
Figure 2.1 Defined ecoregions across the lesser prairie-chicken range (McDonald et al. 2014).
States represented in this study were Kansas, Colorado and New Mexico. Kansas contains
portions of the Mixed-Grass, Sand Sagebrush and Shortgrass/CRP Mosaic Prairie. Colorado
contains the Sand Sagebrush Prairie and New Mexico contains the Sand Shinnery Oak
Prairie. ................................................................................................................................... 69
Figure 2.2 Map of study sites across the current lesser prairie-chicken range (shown in light
blue). The Kansas study sites (Northwest, Clark, Red Hills; shown in blue) were located in
Logan, Gove, Kiowa, Comanche and Clark counties. The Colorado study sites were
primarily located in Prowers and Baca counties (shown in purple) and the New Mexico
study site was located in Lea and Roosevelt counties (shown in orange). ........................... 70
Figure 2.3 Examples of home ranges of two lesser prairie-chickens representing differential
space use within their home ranges relative to lek locations. Darker areas indicate areas with
greater intensity of space use, with the white area indicating the 99% isopleth, or
“available” space. .................................................................................................................. 71
Figure 2.4 Beta estimates (with 95% CI) for each study site of distance to lek for nonbreeding
lesser prairie-chickens during 2013-2015 based on Resource Utilization Functions. Distance
to lek was a consistent predictor of space use for Colorado, New Mexico, Northwestern
Kansas, Red Hills, Kansas, but was not a consistent predictor of space use for Clark County,
Kansas. Samples for Kansas and Colorado sites were composed of more females than males
(Clark; 94%, Northwest; 86% and Red Hills; 83%, Colorado; 56%), compared to New
Mexico (13%). ...................................................................................................................... 72
Figure 2.5 Monthly beta estimates (with 95% CI) for distance to lek for all nonbreeding lesser
prairie-chicken in Kansas, Colorado and New Mexico during 2013-2015. Distance to lek
was a significant predictor of space use in the months of October, December, January and

ix
February, but November had a confidence interval overlapping zero, indicating it was not a
significant predictor of space use during that month. Sample sizes are primarily (77%)
composed of female lesser prairie-chickens. ........................................................................ 73
Figure 2.6 Monthly beta estimates for all sites for distance to lek as a predictor of lesser prairie-
chicken space use during 2013-2015 for a) New Mexico, b) Colorado, c) Northwest,
Kansas, d) Clark County, Kansas, and e) Red Hills, Kansas. Beta estimates were considered
significant predictors of space use if their CI did not overlap zero. No differences were
observed among months, within study sites. Samples for Kansas and Colorado sites were
composed of more females than males (Clark; 94%, Northwest; 86% and Red Hills; 83%,
Colorado; 56%), compared to New Mexico (13%). ............................................................. 74
Figure 2.7 Proportion of habitat composition used by lesser prairie-chickens across months for
all sites during the nonbreeding seasons of 2013-2014 and 2014-2015 for Colorado,
Northwest and Red Hills, and just for the nonbreeding season of 2014-2015 for New
Mexico and Clark. Trends indicate a decrease in use of grassland, corresponding to an
increase in use of crop and Conservation Reserve Program (CRP) fields for Clark County,
but not any other site. ............................................................................................................ 75
Figure 2.8 Total precipitation levels in during the growing season (April through September) for
2013 and 2014 across 5 study sites in Kansas, Colorado and New Mexico. ........................ 76
Figure 3.1 Study sites in Kansas and Colorado evaluating the effect of landscape fragmentation
on lesser prairie-chicken survival during 2013-2015. The light blue region represents the
current estimated lesser prairie-chicken range within Kansas and Colorado. Purple
represents the Colorado study sites in Prowers, Baca and Cheyenne counties. Dark blue
represents the Kansas study sites in Gove, Logan, Kiowa, Comanche and Clark counties.
............................................................................................................................................. 109
Figure 3.2 Annual survival estimates and 95% confidence intervals of female lesser prairie-
chickens for three study sites in Kansas (Clark County, Red Hills, Northwest) and Colorado.
Survival rates were estimated using known-fate models in Program Mark, and estimates
represent the cumulative annual survival rate. A year was defined as March 15th-March 14th.
Years of the study were grouped (2013-2014 and 2014-2015). Differences among study site
survival rates were considered statistically significant if confidence intervals do not overlap.
............................................................................................................................................. 110

x
Figure 3.3 Landscape composition of study sites from Clark County Kansas (top), and
northwestern Kansas (Gove and Logan Counties; bottom) illustrating that study sites have
different proportions of landcover types within them, and also different from the
surrounding landscape, which is buffered 50-km from the centroid of the study site. ....... 111
Figure 3.4 Functional relationship from Program Mark of weekly survival of lesser prairie-
chickens and patch richness within individual home ranges during 2013-2015. Patch
richness for this study indicates the number of patch types (1-6) that occurs in each
individual home range. ........................................................................................................ 112
Figure 3.5 Functional relationship from Program Mark of weekly survival of lesser prairie-
chickens and percent crop (a) and percent grassland (b) within individual home ranges
during 2013-2015, for three sites in Kansas. ...................................................................... 113
Figure 3.6 Predicted hazard rate of female lesser prairie-chickens for distance to fence from
Andersen-Gill models for continuous encounter covariates during 2013-2015. Site +
distance to fence (m) predicted curve, with three different study sites in Kansas (Clark
County, Red Hills, and Northwest). Predicted curves only represent hazard rates for distance
to fence that I located mortalities. Hazard rates from this model indicate that lesser prairie-
chickens in northwestern Kansas experience greater risk in relation to fences than lesser
prairie-chicken in the Red Hills and Clark County study sites (Hz = 1.15 ± 0.37). ........... 114

xi
List of Tables
Table 1.1 Studies reporting 6-month survival estimates of lesser prairie-chickens during the
nonbreeding season. Estimates are converted from reported estimates to 6-month rates for
comparisons. ......................................................................................................................... 33
Table 1.2 Total number of female lesser prairie-chickens that survived the breeding season to be
included in the nonbreeding survival study in Kansas. Number of individuals were separated
by year, study site, and transmitter type. Six individuals survived the 2013 and 2014
breeding seasons and 2013-2014 nonbreeding season to be included in the 2014-2015
nonbreeding season. .............................................................................................................. 34
Table 1.3 Model selection table based on AICc rankings for Program MARK analysis of lesser
prairie-chicken survival data, combining encounter histories from 2013-2014 and 2014-
2015 nonbreeding seasons in Kansas. Models included effects of mean percent cover (%) of
grass and forbs, and mean vegetation height (cm) as individual covariates, linear trends with
minimum low and mean low weekly temperatures, study site, year and transmitter type as
well as a priori combinations of site and year ...................................................................... 35
Table 1.4 Model selection table based on AICc rankings for Program MARK analysis of lesser
prairie-chicken survival data from the 2014-2015 nonbreeding season in Kansas. Models
included effects of mean percent cover (%) of grass and forbs, and mean vegetation height
(cm) as individual covariates, linear trends with minimum low and mean low weekly
temperatures, weekly raptor survey counts, study site, year, and transmitter type as well as a
priori combinations of site and year, temperature, and raptor abundance. ........................... 36
Table 1.5 Model selection table based on AICc rankings for Kaplan-Meier analysis of
nonbreeding adult female lesser prairie-chicken survival data in Kansas during 2013-2014
and 2014-2015. Models included effects of age at capture (SY vs ASY), study site
(Northwest, Red Hills, Clark County), season (2013-2014 and 2014-2015), and transmitter
type (VHF vs SAT-PTT) as well as a priori combinations of factors. ................................. 37
Table 2.1 Studies of nonbreeding lesser prairie-chicken home range size, displaying state,
season, home range estimate and method of estimation. ...................................................... 77
Table 2.2 Total number of Males (F) and Females (F), as well as SAT-PTT (SAT) and VHF
marked lesser prairie-chickens during each year, used to estimate home range size for five
xii
sites in Kansas, Colorado and New Mexico, and two nonbreeding seasons (2013-2014,
2014-2014) Kansas study sites include Northwest, Red Hills and Clark County, with one
site each in Colorado and New Mexico. Individuals were included in the overall home range
estimation if they did not disperse outside of the delineated study site and survived at least 2
weeks into the nonbreeding season. ...................................................................................... 78
Table 2.3 95% Kernel Density Estimates (ha) of 95% volume contour home range for VHF
marked, nonbreeding female lesser prairie-chickens in Kansas. The nonbreeding season was
the six-month period between 16 September and 14 March. Home range size was estimated
for individuals that had ≥ 30 points throughout the entire nonbreeding season. .................. 79
Table 2.4: Average 95% isopleth home range (ha) of Satellite-marked lesser prairie-chickens in
Kansas, Colorado and New Mexico during the nonbreeding seasons of 2013-2014 and
2014-2015. Estimates include both male and female lesser prairie-chickens. All satellite
marked individuals had ≥ 100 points with which to estimate home ranges with. ................ 80
Table 2.5 Monthly home range estimates for satellite marked male and female lesser prairie-
chickens in Kansas, Colorado and New Mexico, that had ≥ 100 points available within a
whole months. Home ranges were estimated using Brownian Bridge movement models. .. 81
Table 2.6 Results from simple linear regression assessing trends of habitat use for nonbreeding
lesser prairie-chickens in three study site in Kansas (Northwest, Red Hills, and Clark
County), Colorado, and New Mexico during 2013 – 2015. .................................................. 82
Table 3.1 Total available points for lesser prairie-chickens in Kansas and Colorado with SAT-
PTT and VHF transmitters used to calculate minimum convex polygons during 2013-2015.
Mean values are the mean value per site and overall for each bird used to calculate the
polygons. ............................................................................................................................. 115
Table 3.2 FRAGSTATS metrics calculated within individual home ranges, to use as individual
covariates in known-fate models within Program Mark. Definitions of metrics are adapted
from McGarigal and Marks 1995. ...................................................................................... 116
Table 3.3 Model ranking based on Akaike Information Criterion corrected for small sample size
(AICc) for 12 models testing the effect of landscape configuration on survival of female
lesser prairie-chickens in Kansas and Colorado during 2013-2014 and 2014-2015. Site
models considered the four study sites - Northwestern, Red Hills and Clark County, Kansas,
and Colorado. ...................................................................................................................... 117

xiii
Table 3.4 Model ranking based on Akaike Information Criterion corrected for small sample size
(AICc) for 19 models testing the effect of landscape composition on survival of female
lesser prairie-chickens in Kansas and Colorado during 2013-2014 and 2014-2015. Site
models considered the four study sites - Northwestern, Red Hills and Clark County, Kansas,
and Colorado. ...................................................................................................................... 118
Table 3.5 Model selection table Kaplan-Meier survival analysis, for cumulative annual survival
rates of female lesser prairie-chickens in Kansas and Colorado for 2013-2014 and 2014-
2015. Data from four sites were included in these models, three in Kansas (Clark County,
Red Hills and Northwest) and one in Colorado. ................................................................. 119
Table 3.6 FRAGSTATS metrics calculated within sites for comparison of annual survival of
female lesser prairie-chickens among study sites during 2013-2015. Clark, Northwest and
Red Hills were Kansas study sites, and the Colorado study site consisted of two distinct
areas in eastern Colorado. ................................................................................................... 120
Table 3.7 Comparison of composition of grassland, cropland and CRP between study areas, and
the 50 km radius landscape surrounding these study areas. The 50km buffer represents a
circle with a 50-km radius from the centroid of the study area. Composition metrics were
calculated in the program FRAGSTATS. ........................................................................... 121
Table 3.8 Model ranking for Andersen-Gill models, based on Akaike Information Criterion
corrected for small sample size (AICc) for 26 models determining the effect of distance to
anthropogenic features and landcover type on survival of lesser prairie-chickens in Kansas
during 2013-2015. ............................................................................................................... 122

xiv
Acknowledgments
I am very much in debt to my major advisor David Haukos for giving me the chance to
join this enormous project. I could not have gotten this far without your constant confidence in
my skills and positive greetings every time I walk into your office. You have provided so many
opportunities for me, and I look forward to continuing to work together in the future. I would
also like to thank Brett Sandercock, Mindy Rice and Anne Bartuszevige for their input and
friendly words throughout this process. I also thank Beth Ross, Ginger Winder, Drew Ricketts
and Gene Albanese for being my informal mentors through my time in Kansas, whether it be
conceptual, statistical or geographical, and for always being just an email, phone call, text or
tweet away.
A project this size could not have been accomplished without a horde of graduate
students who usually get along! I am so grateful to have John, Dan, Reid, Joseph and Jonathan to
be constant backboards for my thoughts and for encouraging me along the way with my
struggles. I came into this position knowing absolutely nothing about prairie-chickens or prairies,
and now I know a little bit more. Your patience with me these last two years has been greatly
appreciated. To the remainder of my lab-mates, Sarah, Brian, Tom, Willow and Andy, and to the
rest of my friends at K-State, Emily Williams, Kirsten, Bram, Eunbi, Emily Weiser, Aaron, who
were always available for an evening beer at Tanner’s or Bluestem when graduate school seems
too hard, but we still want to talk about birds! I cannot wait to see where our lives take us!
This project would not have existed without the landowners that we have the pleasure of
working with, and who are gracious enough to allow us on their land. Stacy and Chaston Hoeme
especially, thank you for absolutely everything. It has been a true pleasure.

xv
I am very lucky to have worked with some exceptional technicians (Will, Amber, Ellie,
Geoff, Ian, Blake, Sam L., Sam H., Jenny and Brittany) over the last two years, so thanks for
making my job easier, and for making those early mornings catching chickens a seem a little bit
brighter. I know my early morning perkiness can be draining!!
I also want to thank my friends and future colleagues at Virginia Tech, Dan, Kelsi,
Chelsea, Kayla and Jim, for giving me a reason to work efficiently over the last several months,
and for giving me encouragement for the future. Kelsi and Dan especially, for hiring me nearly
four years ago, and sparking my interest in population demographics. I cannot wait to work with
all of you in the years following!
I could never have been successful in this endeavor and getting to where I am now
without my parents, Theresa, David and Jared or my brother Robbie and my sister Sarah. They
continually support me whenever I move around the country, and believed in me when I decided
to move to the middle of the country, and study a species and ecosystem about which I knew
little.
Last, I would not have had the courage to do any of this without the love and support of
my partner, Shawn, who is always a shoulder to cry on, laugh with or bounce ideas around with.
On my hardest days, you are always there to plan and dream up our future adventures. Yet, you
were the one who told me to keep my options open, and consider experiences outside of my
comfort zone for graduate school. It paid off! I cannot wait to see what the future holds for us,
and where it will take us (after Blacksburg and Long Island, of course).
All of these people made it possible for a girl from coastal Connecticut to live and work
for two years in the Kansas prairie, and to have an experience of a lifetime. Thank you so much.

1
Chapter 1 - Nonbreeding Survival of Female Lesser Prairie-Chickens
Introduction
Demographic rates are a crucial piece of a larger puzzle required to target and prioritize
management decisions for wildlife populations (Sandercock 2006). Although it is important to
estimate population survival, fecundity, and size, these values can be used to develop more
complex models that identify specific limiting vital rates to determine those life stages most
critical for the increase in population numbers (Sandercock 2006). Identifying influential vital
rates is especially important in the case of declining and spatially-limited species, such as the
lesser prairie-chicken (Tympanuchus pallidicinctus). As an indicator species within a declining
grassland ecosystem, conservation of lesser prairie-chicken populations will not only improve
the status of the species, but also provide management tools to conserve western Great Plains
grasslands for all dependent species.
Due to long-term declines of >90% from historical high counts, occupied range
contractions (Taylor and Guthery 1980, Hagen et al. 2004) and a recent decline of >50% from
2012 to 2013 (McDonald et al. 2014), the lesser prairie-chicken was listed as a threatened
species across its entire range in May 2014 (U.S. Fish and Wildlife Service 2014). However, the
listing was vacated by a Texas federal judge in September of 2015, leaving the status of the
lesser prairie-chicken uncertain (Permian Basin Petroleum Association et al. v. Department of
Interior, U.S. Fish and Wildlife Service, [Case 7:14-cv-00050-RAJ, U.S. District Court, Western
District of Texas, Midland-Odessa Division]). The species range is confined to the Southern
Great Plains, including portions of Kansas, Colorado, Texas, New Mexico, and Oklahoma.
Lesser prairie-chickens currently inhabit a fraction of their pre-settlement range (Taylor and
Guthery 1980). The exact area of the pre-settlement range is unclear (Rodgers 2016), but

2
conversion and fragmentation of landscapes within their current estimated range is not (Samson
and Knopf 1994, Coppedge et al. 2001). Due to extensive landscape fragmentation, lesser
prairie-chicken populations occur as a metapopulation with isolated sub-populations delineated
within defined spatially-distinct ecoregions among the five states. Kansas contains portions of
three of the four ecoregions in which lesser prairie-chickens occur, supporting >60% of the
range-wide population (VanPelt et al. 2013, McDonald et al. 2014). Ecoregions are defined by
different spatial location, soil types, species composition, and vegetation structure. These
differences beg the question, are there differences in survival between the ecoregions and how do
we properly recommend management prescriptions for such a system?
Breeding season demographics have generally been the focus of past studies on lesser
prairie-chickens, but few studies have specifically targeted the estimation of survival rates and
other aspects of nonbreeding season ecology (see citations in Table 1.1). The lack of information
about nonbreeding lesser prairie-chickens is especially true for the northern extent of the range.
With a species that goes through distinct population boom and bust fluctuations in numbers,
putatively due to drought periods and other large-scale environmental events, survival rates need
to be measured across space and time to determine and predict the impacts of varying
environmental conditions on population survival rates (Hagen et al. 2009, Grisham et al. 2013).
Further, separating the influence of environmental conditions and habitat quality on survival
rates is critically important for conservation planning.
Conditions experienced during the nonbreeding season may impact future reproductive
potential of lesser prairie-chickens, as individuals in poor body condition entering the breeding
season may be less physically fit to mate, incubate eggs and tend to chicks, leading to
intermittent breeding. A low survival rate during the nonbreeding season would also impact the

3
overall number of individuals who are able to reproduce. Historically, unfortunately, having an
adequate sample size for nonbreeding season studies has been problematic. Small nonbreeding
sample size is primarily due to the main capture period being during the spring lekking season,
requiring individuals to both survive, and transmitters to function for up to six months prior to
data collection during the nonbreeding season. It is difficult to capture female lesser prairie-
chickens during fall and winter due to their cryptic nature and secretive nature while not at leks.
However, the nonbreeding season is possibly an important factor in their overall life-cycle.
Available estimates of female survival in nonbreeding season are consistently greater
than breeding season survival rates. Of the five studies that have provided an estimate of
nonbreeding survival, the lowest rate was 0.63 for six-months (Kukal 2010) and the highest rate
was 0.83 for six-months (Pirius et al. 2013). There was a lack of consistency for the defined
temporal duration of survival estimates among studies, which is important when extrapolating a
daily or weekly survival estimate out to a larger period, so I standardized past estimates to 6-
months (Table 1.1). Nonbreeding estimates for other species of prairie-grouse, namely greater
prairie-chickens (Tympanuchus cupido) and greater-sage grouse (Centrocercus urophasianus),
are equally understudied, with the few finding comparable survival rates to lesser prairie-chicken
studies (Connely et. al 2004, Winder et al. 2014). Additionally, the drivers of nonbreeding
season survival have not been investigated, but overwinter survival could possibly be related to
vegetative conditions, predator abundance, and extreme weather conditions such as extreme low
temperatures. To determine whether nonbreeding survival is influential for lesser prairie-
chickens, relative to breeding season survival, a study between ecoregions with a consistent
temporal extent and method is necessary.

4
Contemporary wildlife research allows for a variety of approaches to estimate survival
rates using individually-marked animals. Known fate models are used when the encounter
probability of an individual is 1.0 and timing of mortality can be determined, such as with
telemetry data. The Kaplan-Meier model is one of the most frequently used know fate
approaches (Kaplan and Meier 1958), which can be implemented in Program MARK (White and
Burnham 1999) and Program R (R Core Team 2014). This method allows for right-censoring of
individuals that are no longer able to be documented during defined encounter periods, as well as
left-censoring when individuals are added to the sample in a staggered manner. The Kaplan-
Meier model does not allow for the explicit use of covariates; thus, it is frequently paired with
Cox Proportional Hazard models to determine the effect of covariates on survival and hazard
rates (Pollock et al. 1989). Several assumptions must be met to proceed with a known-fate
analysis. The sample of individuals, observational periods, and censoring occurrences need to be
random, and marking methods cannot have adverse effects on survival rates (Winterstein et al.
2001). I used Very High-Frequency (VHF) bib-style radios and rump-mounted satellite platform
transmitting terminal GPS (SAT-PTT) transmitters to monitor survival of individuals in this
study. Hagen et al. (2006) determined that VHF radio-transmitters do not affect survival rates of
male lesser prairie-chickens. The breeding season complement to this study found that overall
survival rates were similar between individuals with VHF transmitters and those with SAT-PTT
transmitters (Plumb 2015), but there is the potential for the nonbreeding season to exhibit
different results due to vegetation, weather changes, and changes in bird behavior between the
two periods.
As a portion of the lesser prairie-chicken life-cycle that is understudied, my objectives
were 1) to identify whether nonbreeding survival is influential for lesser prairie-chickens,

5
relative to breeding season survival rates, 2) to assess temporal patterns of mortality across the
nonbreeding season, and determine 3) if nonbreeding survival can be explained by
environmental, landscape or predator effects, and 4) if there is a difference in survival rates
between individuals marked with bib-style VHF transmitters and individuals marked with SAT-
PTT transmitters. I estimated the six-month survival rates of female lesser prairie-chickens for
two nonbreeding seasons (16th of September – 8th of March; 2013-2014 and 2014-2015), at three
sites in Kansas. Additionally, I documented the pattern for mortality events of lesser prairie-
chickens during the nonbreeding season. I hypothesized that survival would be greater for birds
in the southern study sites versus the northern study site due to greater shrub availability and a
milder climate. I hypothesized that lesser prairie-chicken survival will be lower during times of
high raptor abundance, low temperatures will coincide with high mortality events, and lesser
prairie-chickens that spent more of their time in areas with greater grass and forb cover, or in
taller vegetation, will have higher survival rates. I hypothesized that the majority of predation
will be by avian predators and periods of increased raptor abundance will have greater influence
on lesser prairie-chicken mortality than temperature or vegetation characteristics. Last, I
hypothesized that during both years of this study, nonbreeding season survival rates will be
greater than the breeding season survival rates for the preceding season in all study sites.
Study Area
In northwestern Kansas, lesser prairie-chickens are found in the Short-Grass
Prairie/Conservation Reserve Program (CRP) Mosaic Ecoregion (Van Pelt et al. 2013,
McDonald et al. 2014). Presence of lesser prairie-chickens in this ecoregion are the result of a
recent documentation north of the Arkansas River, which has been studied once prior (Bain
2002, Fields et al. 2006, Rodgers 2016). In south-central Kansas, lesser prairie-chickens are

6
found in the Mixed -Grass Prairie and Sand Sagebrush Prairie Ecoregions (Van Pelt et al. 2013,
McDonald et al. 2014). Three study sites were located in these three ecoregions across the lesser
prairie-chicken range in Kansas (Figure 1.1). The northwestern Kansas study site consisted of
private lands in Gove and Logan counties; whereas, in south-central Kansas, there were two
study sites on private lands in Kiowa, Comanche and Clark counties.
In northwest Kansas, the study site was 171,437 ha and located in Gove and Logan
counties on private lands and the Smoky Valley Ranch, owned and managed by The Nature
Conservancy. The primary land uses in this area were livestock grazing, energy extraction and
both dryland and irrigated row-crop agriculture. This study area was in the Shortgrass
Prairie/CRP Mosaic Ecoregion (Van Pelt et al. 2013, McDonald et al. 2014), with CRP
grasslands and row-crop agriculture on silt-loam soils. Mixed-grass prairie plants and structure
occurred with certain soils. Dominant vegetation in the region included blue grama (Bouteloua
gracilis), hairy grama (B. hirsute), buffalograss (B. dactyloides), little bluestem (Schizachyrium
scoparium), sideoats grama (B. curtipendula), big bluestem (Andropogon gerardii), Illinois
bundleflower (Desmanthus illinoensis), prairie sunflower (Helianthus petiolaris), annual
buckwheat (Eriogonum annum), sand milkweed (Asclepias arenaria), nine-anther dalea (Dalea
enneandra), and western ragweed (Ambrosia psilostachya; Lauver et al. 1999). Native grass
species planted in CRP fields included little bluestem, sideoats grama, big bluestem, switchgrass
(Panicum virgatum), blue grama, buffalograss, and Indian grass (Sorghastrum nutans) (Fields
2004). The CRP fields were interseeded with forbs in the 1990s; and the seed mixture included
white sweet clover (Melilotus alba), yellow sweet clover (Melilotus officinalis), Maximillian
sunflower (Helianthus maximiliani), Illinois bundleflower, purple prairie clover (Dalea
7
purpurea), and prairie coneflower (Ratibida columnifera; Fields 2004). Wheat (Triticum
aestivum), sorghum (Sorghum bicolor), and corn (Zea mays) were the major crops in the region.
In south-central Kansas, the Red Hills study site was 49,111 ha and centered on private
lands in Kiowa and Comanche counties within the Mixed-Grass Prairie Ecoregion (Van Pelt et
al. 2013, McDonald et al. 2014). The Red Hills site consisted of mixed-grass prairie on loamy
soils. Primary land uses for this area included livestock grazing and oil and gas extraction and
exploration, with row-crop and dryland agriculture interspersed throughout the region. Dominant
vegetation in south-central Kansas included little bluestem, blue grama, hairy grama, sideoats
grama, buffalograss, sand dropseed (Sporobolus cryptandrus), Louisiana sagewort (Artemisia
ludiviciana), western ragweed (Ambrosia psilostachya), sand sagebrush (Artemisia filiafolia),
and eastern red cedar (Juniperus virginiana; Lauver et al. 1999).
The Clark County site within south-central Kansas was 71,209 ha and located at the
Mixed-Grass Prairie Ecoregion and Sand Sagebrush Prairie Ecoregion boundary (McDonald et
al. 2014). Land use was dominated by livestock grazing, oil and gas extraction, and row-crop
agriculture. Dominant vegetation in the area included: little bluestem, sideoats grama, blue
grama, hairy grama, big bluestem, alkali sacaton (Sporobolous airoides), invasive Russian thistle
(Salsola kali), kochia (Kochia scoparia), annual sunflower (Helianthus annuus), and sand
sagebrush. This study site also had large areas of alkali flats along drainages.
Methods
Capture Lesser prairie-chickens were captured at leks in spring (March – May) during 2013 and
2014. Birds were trapped using walk-in drift traps, magnetic dropnets, and rope-trigger dropnets
(Haukos et al. 1990, Silvy et al. 1990, Schroeder and Braun 1991). These capture methods do not
decrease survival probabilities of individuals (Grisham et al. 2015). Captured individuals were

8
aged using the degree of spotting on the 9th and 10th primaries; second-year birds had spotting
within 3.8 cm from the feather tip and after-second-year birds had spotting ≥3.8 cm from the tip
(Copelin 1963). I also used the amount of wear of the feather tips as juvenile grouse do not molt
those primaries until their second year, and thus, have more frayed feather tips (Copelin 1963).
The sex of individuals was determined using tail feather color; females had barred tail feathers
and male prairie-chickens had mainly black tail feathers (Copelin 1963).
Each individual was marked with individual color band combinations using size-4 color
bands (Avinet, Dryden, New York, USA) and individually numbered butt-end aluminum bands
(National Band and Tag Company, Newport, USA). Female lesser prairie-chickens were
outfitted with either 12-15-g bib-style VHF transmitters (A3960, Advanced Telemetry System,
Isanti, USA) or a rump-mounted 22-g Satellite Platform Transmitting Terminal (PTT) GPS
transmitter (PTT-100, Microwave Telemetry, Columbia, USA). SAT-PTT transmitters were
attached on the rump using leg harnesses made of Teflon® ribbon, and elastic at the front of the
harness for flexibility (Bedrosian and Craighead 2010, Dzialak et al. 2011). All capture and
handling procedures were approved by the Kansas State University Institutional Animal Care
and Use Committee protocol (3241) and Kansas Department of Wildlife, Parks and Tourism
scientific wildlife permits (SC-042-2013 and SC-079-2014).
Monitoring Female lesser prairie-chickens outfitted with VHF transmitters were located via
triangulation 3-4 times per week during the nonbreeding season (16 September – 14 March).
Individuals were located using an Advanced Telemetry Systems Receiver (R4000 or R4500,
Advanced Telemetry Systems, Isanti, USA) or a Communications Specialists Receiver (R-1000,
Communications Specialists, Orange, USA). If individuals could no longer be located due to
dispersal from the study site, attempts were made to locate birds using a fixed-wing Cessna

9
aircraft. If a mortality signal was obtained, homing was used to locate the bird and an attempt
was made to determine fate.
Birds that were outfitted with a Satellite-PTT transmitter recorded up to eight GPS
positions a day, with ±18 m accuracy, during the nonbreeding season between the hours of 06:00
and 22:00. Points were uploaded to the Argos satellite system, and downloaded weekly for
locations and mortality assessments. As soon as a bird was determined to have died based on the
satellite data, I searched within a 50 m radius surrounding the point of mortality until the
transmitter and carcass were located.
The specific cause of mortality was evaluated, if possible. If there were bite marks on the
carcass or transmitter, or if the carcass was cached, the predator was identified as mammalian
(Hagen et al. 2007). Potential mammalian predators include American badger (Taxidea taxus),
coyote (Canis latrans), swift fox (Vulpes velox) and bobcat (Lynx rufus). If the carcass was
decapitated, the breast muscle is removed, raptorial scat or pellets were found around the carcass,
or there was evidence of feather plucking, the predator was identified as avian (Hagen et al.
2007). Raptor species observed during the nonbreeding season are swainson’s hawk (Buteo
swainsoni), northern harrier (Circus cyaneus), prairie falcon (Falco mexicanus), red-tailed hawk
(B. jamaicensis), rough-legged hawk (B. lagopus), bald eagle (Haliaeetus leucocephalus), broad-
winged hawk (B. platypterus), great-horned owl (Bubo virginianus), short-eared owl (Asio
flammeus), and golden eagle (Aquila chrysaetos). Other evidence, such as feces, dens or
burrows were used as evidence to identify cause of mortality. If cause of mortality was not
identifiable by information at the carcass site, I classified it as unknown fate. If there was no
evidence of mortality, such as with a possible dropped collar, I right-censored that individual.
10
Point Vegetation Surveys Vegetation surveys were conducted at two randomly selected female lesser prairie-
chicken point locations per week during the nonbreeding seasons of 2013-2014 and 2014-2015. I
estimated the percent cover of litter, grass, forbs, and bare ground within percentile ranges using
a 60 x 60 cm modified Daubenmire frame (Daubenmire 1959). Within the Daubenmire frame, I
also measured tallest vegetation height (cm). Percent grass cover, percent forb cover, and tallest
vegetation were averaged for each bird across the 6-month study period and each measure was
used as a single individual covariate in Program MARK to represent the average vegetation that
an individual was selecting throughout the season. If data were not collected for an individual for
a season, such as if a bird left the study site or permission could not be obtained to access
locations (7% of individuals), I used the average vegetation data for all of the birds within that
study site as the individual covariate for that season (Mark Manual Citation).
Raptor Surveys Weekly raptor surveys were conducted across all study sites starting in March of 2014 for
an index of raptor abundance patterns, due to a concurrent research objective beginning the
second year of this study (# raptors/transect). During the nonbreeding season, surveys were
conducted 1-2 times a week. If two surveys were conducted in a given week, then the average
value was used. Occasionally a raptor survey was missed entirely for a week, in which case I
used the average for the weeks on either side of the missed week for the missing data.
Raptor surveys were conducted on a 16-km route, passing through portions of cropland,
grassland, and CRP tracts. Routes were chosen systematically, to assure inclusion of all three
landcover types on the transect. Three-minute point counts were conducted at 0.8-km intervals.
Surveys were restricted to between 09:00 and 13:00 to standardize across study sites. Surveys
were not conducted during days with rainfall. Detection of all raptors was recorded with the

11
number of individuals, estimated distance from the survey route, and whether the raptor was
flying or perched. For the purposes of this analysis, I only used raptors likely to prey on lesser
prairie-chickens based on size and past observations. These raptors included bald eagle, northern
harrier, prairie falcon, rough legged-hawk, red-tailed hawk and ferruginous hawk.
Survival Analysis Known-fate models were used in Program MARK (White and Burnham 1999) to test the
factors of site, year, low temperatures, and raptor abundance as predictors for nonbreeding
season survival of female lesser prairie-chickens. Survival was modeled on a weekly time-step
for the six month nonbreeding season (September 16th – March 8th). Factors examined for this
analysis were year, transmitter type, percent grass and forb cover, average vegetation height,
differences among study sites and differences between years. Starting date of weeks were held
consistent between the two nonbreeding seasons.
As raptor abundance was not collected the first year of the study, I tested this effect in a
separate model set for the 2014-2015 nonbreeding season. Temperature data were retrieved from
the Kansas State University Weather Data Library (KState Research and Extension 2014). As
covariates in survival models, I used the average temperature lows within a week and the
minimum low temperature within each week. Weather stations were in Quinter (146637),
Coldwater (141704), and Ashland (140365), Kansas, for the northwestern, Red Hills and Clark
County field sites, respectively. I developed 12 potential models for both years combined, and 11
potential models for just the second year of the study (2014-2015). Models were ranked using the
Akaike Information Criterion for small sample sizes (AICc; Burnham and Anderson 2002).
Models with a ΔAICc ≤ 2 were considered competing models (Burnham and Anderson 2002).
The average weekly survival rate was raised to the 25th power to extrapolate over the 25-week
12
nonbreeding season, and the delta method was used to determine the standard error for Sweek25
(Powell 2007).
Kaplan-Meier functions were analyzed with the survival package (Therneau 2014) in
Program R version 3.1.1 (R Core Team 2014). Cox proportional hazard functions were used to
test for differences between transmitter types, age at capture, and/or among sites to determine if
these effects had a significant impact on nonbreeding survival. Model diagnostics were tested
with the cox.zph function to determine if the data met the assumptions of proportional hazards
(Fox 2002). Log-rank tests were used to determine if there was a significant difference between
transmitter type, site, year or age. Models were ranked using AICc, and models with ΔAICc ≤ 2
were considered competing models. Survival estimates with overlapping confidence intervals
were considered not statistically different. I examined weekly patterns of mortality using hazard
functions in Program R with the gss package. These functions fit smoothing splines to weekly
survival data, to identify weeks in which there is a greater instantaneous risk to female lesser
prairie-chickens (DelGiudice et al. 2006, Gu 2014). A smoothing factor of 1.2 was used to
display the hazard functions.
Results
A total of 88 individual female lesser prairie-chicken bird-years survived the 2013 and
2014 breeding seasons prior to being included as part of the nonbreeding season; 6 individuals
survived both breeding seasons (n = 94 bird-years; Table 1.2). Of these, 52 individuals were
outfitted with Satellite-PTT transmitters, and 42 individuals were outfitted with VHF transmitters
(Table 1.2). A total of 22 mortalities were recorded during the nonbreeding season, across both
years of the study. Of these 22 mortalities, four were due to avian predation (18%), eight to
mammalian predation (36%) and 10 (46%) were unknown events. Mortality events were
13
relatively evenly spaced across the nonbreeding season (0-2 mortalities/week) except for a single
week in 2014 (November 17 – 23) with three mortality events (Figure 1.2).
There was no single dominant model for the Program MARK analysis testing the
influence of temporal and vegetative covariates on survival across the nonbreeding season (Table
1.3). Instead, there were eight competing models with a ΔAICc of ≤ 2. Top models included
linear trends in percent grass (β = -0.03,SE = 0.22, 95% CI = -0.073, 0.012), minimum low
temperature (β = 1.97, SE = 1.39, 95% CI = -0.76, 4.70), mean low temperatures (β = 1.91, SE =
1.51, 95% CI = -1.05, 4.88), and percent forb (β = 0.15, SE = 0.26, 95% CI = -0.35, 0.066).
Other top models included quadratic trends in minimum (β = -3.86, SE = 7.33, 95% CI = -18.23,
10.51) and mean low temperatures (β = -6.43, SE = 8.57, 95% CI = -23.23, 10.36), as well as the
constant model. Based on model weight, percent grass, minimum low temperature, mean low
temperature and the null model all had almost double the weight of the other four top models
(Table 1.3). None of the regression coefficients differed from zero, as the 95% confidence
intervals of all beta estimates overlap zero. Thus, hypothesized functional relationships among
vegetation covariates and survival did not explain variation in survival. Year was not included in
a top ranking model for this set, and confidence intervals of estimates overlapped zero, so I did
not separate out survival rates by year.
A model for differences in survival among the three sites was one of the top ranked
models, but confidence intervals of survival rates overlapped among all study sites (Figure 1.3).
Mean survival rates in the southern Kansas study sites (Red Hills: 0.83 and Clark County: 0.80)
were 22.1% and 17.7% greater than northwestern Kansas (0.68) with both years combined
(Figure 1.3).
14
The null model was used instead of model averaging to estimate nonbreeding survival
because none of the tested variables in the models that ranked higher in this set were significant.
This model represents the overall survival rate, for all years and sites, without taking into
account any of the covariates, as none were significant. The null model resulted in an overall
nonbreeding, 25-week survival estimate of 0.75 (95% CI = 0.66-0.84). This estimate represents
the overall nonbreeding survival rate among the three field sites in Kansas.
Relative raptor abundance increased across the 25-week nonbreeding season from mid-
September to mid-March (Figure 1.4). The most abundant species observed in all study sites
were northern harriers (31%, 15% and 26% of observations for northwestern, Clark County and
Red Hills. respectively), with red-tailed hawk being common in the south-central study sites
(78% and 44% of observations for Clark County and Red Hills respectively), and rough-legged
hawk being common in the northwestern site (12% of observations). Adding the results of raptor
surveys to the 2014-2015 model set did not change model ranking or fit of the models; the slope
of the linear trend did not differ from zero (β = 0.52, SE = 1.72; Table 1.4).
Model selection from the Kaplan-Meier survival analysis, used to test differences in
survival between SAT-PTT and VHF marked individuals, indicated that there was a lack of
support for a single model in this set (Table 1.5). The top three models (Transmitter, Transmitter
+ Year, Transmitter * Year) all had a ΔAICc ≤ 2 with a transmitter effect included, which was
the only variable with a significant term in the model set (Z = -2.31, P = 0.021). The difference
in survival rates between the two transmitters was only evident in the first year of the study, with
a significantly higher survival rate for VHF individuals relative to SAT-PTT individuals (2013-
2014; Figure 1.5). The second year of the study shows confidence intervals that overlapped

15
(Figure 1.5). Combining both years, confidence intervals for the transmitter type overlap for the
cumulative survival function (Figure 1.6) and overall survival rates (Figure 1.5).
Estimated hazard rates were low (0.025 per week) across the 25-week nonbreeding
season (Figure 1.7). However, there was a peak in instantaneous risk of mortality corresponding
to week 10 in 2014 in which three mortalities were recorded. This week also corresponds to the
first peak in relative raptor abundance from raptor surveys in 2014. I did not separate hazard
rates by year, as this was not a significant term in the Kaplan-Meier survival model.
Discussion
Yearly variation in weather and subsequent vegetative response are hypothesized to be
the main drivers of prairie-grouse vital rates (Flanders-Wanner et al. 2004). I used seasonal
survival rates and individual average vegetation characteristics to test this hypothesis for the non-
breeding season. From this analysis, there were no clear trends or factors in nonbreeding season
survival of female lesser prairie-chickens for any of the variables that I selected, including year,
weather, vegetation characteristics, or relative predator abundance. In addition, there was no
temporal trend across the nonbreeding season survival for female lesser prairie-chickens,
suggesting that mortality was a random event during the nonbreeding season. With mortality
during the nonbreeding season acting as a random event, it is likely not additively contributing to
population declines, and conservation goals cannot be set to increase this rate and subsequently
effect population growth.
My overall estimate of nonbreeding survival was within the range of past studies of
nonbreeding lesser prairie-chickens. The study most comparable to mine is Hagen et al. (2007),
because his sample was comprised of females and conducted in Kansas in a region west and
south of my study sites. Their estimate of survival was 0.77 for November to February, and
16
converted to a six-month rate, the estimate is 0.68, which is lower than my nonbreeding estimate
of 0.75, but within the range of survival estimates spanned by my three sites. My estimate was
also in a similar range to the remainder of nonbreeding lesser prairie-chicken survival studies
where the range of survival estimates was from 0.63 to 0.77 (Jamison 2000, Lyons et al. 2009,
Kukal 2010, Pirius et al. 2013; Table 1.1). The evidence for a consistent overwinter survival
across the lesser prairie-chicken range suggests that this period is not contributing to the long-
term population decline or differences in persistence among populations across the species range.
The 6-month survival estimates did not differ between the two years across all study
sites. I hypothesized an increase in survival from the first year of the study (2013-2014) to the
second year of the study (2014-2015) because of the alleviation of extreme drought that occurred
across much of the Southern Great Plains from 2011-2013, including the 2013 breeding season.
Decreased precipitation, coupled with increased grazing pressure, should have left less residual
vegetation for lesser prairie-chicken cover during the 2013-2014 nonbreeding season compared
to 2014-2015 season. During 2014, breeding season rain started in late May in all study sites and
continued consistently across the remainder of the growing season, resulting in an increase in
residual vegetation for the 2014-2015 nonbreeding season across all study sites in Kansas (S.
Robinson unpubl. data). However, with differences not evident in survival between these years,
nonbreeding survival does not appear to be related to precipitation characteristics of the
preceding breeding season.
Additionally, survival rates did not statistically differ among study sites. However, a
lower mean survival was evident for northwestern Kansas compared to the south-central sites.
Several differences exist between these sites that have the possibility of explaining this
difference. The southern study sites had a mixed-grass vegetation community, which includes an

17
increased shrub cover relative to the northwest Kansas study site. Shrubs provide increased cover
for improved thermoregulation and predator avoidance during the nonbreeding period (Patten et
al. 2005a). The southern study sites were also centered on more intact grasslands. Intact
grasslands with low fence, road, and power-line density should correspond to less potential
hazards for prairie-chickens. Power lines, fences, and roads act as areas for avian perching and
predator corridors; an absence of these could correspond to a decrease in mortality (Patten et al.
2005b). I would expect lesser prairie-chicken survival to be greater in areas with higher habitat
quality and lower population density, but this research was conducted on some of the best
remaining lesser prairie-chicken habitat in Kansas, which could explain why survival rates were
not significantly different among populations.
My prediction that survival during the nonbreeding season would be greater than that for
the breeding season for the preceding year was supported. The seasonal survival rates estimated
for the breeding season (March 15-September 15) in 2013 and 2014 were 0.42 (95% CI = 0.31 –
0.52) and 0.48 (95% CI = 0.38 – 0.58), respectively (Plumb 2015). The estimates were 39 to
44% lower than the corresponding nonbreeding survival rate from this study. Reduced survival
in the breeding season relative to the nonbreeding season is intuitive as female lesser prairie-
chickens should have reduced predation risk during the nonbreeding season because they do not
have to exert extra energy or risk exposure to visit leks, locate nesting sites, incubate eggs, or
protect broods. Additionally, over the years of this study, no extreme weather events (blizzards
or ice storms) occurred at my study sites, which could have additively increased mortality risk to
lesser prairie-chickens.
The observed increase in hazard rate for the single week in the 2014-2015 nonbreeding
season corresponded with the arrival of fall migrants in counts of raptors. However, I was unable

18
to determine whether avian mortality represented an overall greater proportion of mortality
during any time period due to the difficulty of assigning cause-specific mortality resulting in
assigning 46% of mortalities to unknown causes. One study within the lesser prairie-chicken
range has documented an increased abundance of raptors during the nonbreeding season as well,
concluding that the nonbreeding season had the greatest risk of predation from avian predators
(Behney et al. 2012). However, the Behney et al. (2012) study occurred in the southern portion
of the lesser prairie-chicken range. My study may not have detected this same trend, as in the
northern portion of the range, some populations of raptors are only migratory. Additional years
of raptor surveys should add more information to this analysis, as the raptors surveys did not
begin until the second year of the study.
Hagen et al. (2006) found that a similar number of VHF transmittered and banded male
lesser prairie-chickens returned to leks the next year, indicating that VHF transmitters do not
have an effect survival of male lesser prairie-chickens. My analysis indicates that SAT-PTT
individuals had a lower survival rate than VHF marked individuals in the 2013-2014
nonbreeding season. Plumb (2015) also found SAT-PTT individuals with a decreased survival
rate relative to VHF individuals during a single breeding season, but there was no difference
between transmitter types during other seasons or for his entire study. However, the estimated
survival rates for SAT-PTT transmittered birds were within the bounds of past lesser prairie-
chicken nonbreeding studies. The VHF survival rate from the first year of this study was 20%
higher than past studies. This inflated survival rate was likely due to the censoring of many of the
VHF marked individuals from the study due to transmitter failure or bird dispersal, although
mortalities likely occurred. It is possible that the birds dispersing outside of tracking range are
succumbing to greater mortality than the birds who remain in the study area. We can record

19
mortalities with the SAT-PTT tags, but not with the VHF transmitters during long distance
mortalities. Potentially missing mortalities of censored birds would have increased the survival
rate for VHF lesser prairie-chickens, as those individuals would have been censored at time of
dispersal or transmitter failure. It is likely that some of these individuals died, but they are
recorded as alive within the data set. With SAT-PTT individuals, I was able to document all
mortalities, so this survival rate is likely to be more representative than the high VHF estimate.
Further, the same attachment method, with transmitters of proportional weight, survival
estimates of SAT-PTT and VHF transmitters were tested on greater sage-grouse and no
difference was detected between survival rates of the two transmitters (Bedrosian and Craighead
2010). Thus, although I found differences in survival rates for SAT-PTT marked individuals and
VHF marked between years, over the course of the study, survival estimates were similar
between transmitter types and to previous studies.
Survival rates during the nonbreeding season are also understudied in other prairie-grouse
species relative to the proportion of breeding season studies. Nonbreeding season estimates of
survival of greater prairie-chickens are nearly double that of the breeding season (Augustine and
Sandercock 2011, Winder et al. 2014). Populations of greater sage-grouse generally have high
survival rates during the winter, but can be greatly reduced by harsh and extreme winters (Wik
2002, Connely et. al 2004, Moynahan et al. 2006). Severe weather events affecting overwinter
mortality is also likely the case for lesser prairie-chickens, as a severe blizzard in Colorado in
2011 greatly reduced populations of lesser prairie-chickens (J. Reitz, Colorado Parks and
Wildlife, pers. comm). Many species of grouse are experiencing population declines (Storch
2007), but for prairie-grouse, survival rates for the nonbreeding season do not seem to be
influential on population growth relative to breeding survival and recruitment. My conclusion
20
regarding nonbreeding survival is additionally corroborated by a sensitivity analysis for lesser
prairie-chickens in south-west Kansas, where breeding season survival, nest survival and chick
survival were the most influential vital rates contributing to lesser prairie-chicken population
growth rates (Hagen et al. 2009). Future research should examine lag effects of weather
conditions and the potential impact cross-seasonal effects have on the survival, fitness and
condition of females to determine if nonbreeding season conditions affect breeding conditions
and success differently among years. My results do not suggest that nonbreeding season survival
rates are greatly reducing population numbers for future reproductive potential of populations,
with relatively high and consistent survival rates. Management should focus on improving
survival rates of adults, nests and broods during the breeding season over concerns with
nonbreeding season survival.
Management Implications
My results indicate that mortality during the six month nonbreeding season is an
unpredictable, random occurrence. Lesser prairie-chicken survival was constant at all levels of
used grass cover, forb cover and vegetation height. Maintaining quality grasslands, with high
amounts of grass and forb cover during the year should provide adequate habitat for lesser
prairie-chickens during the nonbreeding season. As nonbreeding mortality was similar among
three sites within Kansas, between years and across studies, future management to enhance
population growth rates should focus on management that can improve vital rates of lesser
prairie-chickens that are variable and influential, such as nesting and brooding.

21
Literature Cited
Augustine, J. K. and B. K. Sandercock. 2011. Demography of female greater prairie-chickens in
unfragmented grasslands in Kansas. Avian Conservation and Ecology 6:2. <http://dx.doi.org/10.5751/ACE-00429-060102>.
Bain, M. R. 2002. Male-male competition and mating success on leks attended by hybrid prairie-
chicken. Thesis, Fort Hays State University, Fort Hays, Kansas, USA. Bedrosian, B., & Craighead, D. J. 2010. Solar powered GPS transmitter use on sage-grouse:
methods of attachment, influences on survival, and success rate of the transmitters. Unpublished report at: <http://www.fs.fed.us/td/programs/im/satellite_gps_telemetry/_assets/Grouse% 20GPS% 20Attachment_Craighead, 20.> Accessed 30 June 2015.
Behney, A. C., C. W. Boal, H. A. Whitlaw, and D. R. Lucia. 2012. Raptor community
composition in the Texas Southern High Plains lesser prairie-chicken range. Wildlife Society Bulletin 36:291-296.
Burnham, K. P., and D. R. Anderson. 2002. Model selection and multimodel inference: a
practical information-theoretic approach. Springer Science, New York, New York, USA. Connelly, J. W., S. T. Knick, M. A. Schroeder, and S. J. Stiver. 2004. Conservation assessment
of greater sage-grouse and sagebrush habitats. Western Association of Fish and Wildlife Agencies. Cheyenne, Wyoming, USA. <http://sagemap.wr.usgs.gov/ConservationAssessment.aspx>. Accessed 19 Jun 2015.
Copelin, F. F. 1963. The lesser prairie chicken in Oklahoma. Technical Bulletin No. 6,
Oklahoma Department of Wildlife Conservation, Oklahoma City, OK. Coppedge, B. R., D. M. Engle, R. E. Masters, and M. S. Gregory. 2001. Avian response to
landscape change in fragmented southern Great Plains grasslands. Ecological Applications 11:47-59.
Daubenmire, R. 1959. A canopy-coverage method of vegetational analysis. Northwest Science
33:43–64. DelGiudice G. D., J. Fieberg, M. R. Riggs, M. C. Powell and W. Pan. 2006. A long-term age-
specific survival analysis of female white-tailed deer. Journal of Wildlife Management 7: 1556-1568.
Dzialak, M. R., C. V. Olson, S. M. Harju, S. L. Webb, J. P. Mudd, J. B. Winstead, and L.
Hayden-Wing. 2011. Identifying and prioritizing greater sage-grouse nesting and brood rearing habitat for conservation in human-modified landscapes. PloS One 6:e26273.

22
Fields, T. L. 2004. Breeding season habitat use of Conservation Reserve Program (CRP) land by lesser prairie-chickens in west central Kansas. Thesis. Colorado State University, Fort Collins, USA.
Fields, T. L., G. C. White, W. G. Gilgert, and R. D. Rodgers. 2006. Nest and brood survival of
lesser prairie-chickens in west central Kansas. Journal of Wildlife Management 70:931-938.
Flanders-Wanner, B. L, G. C. White and L. L. McDaniel. 2004. Weather and prairie grouse:
dealing with effects beyond our control. Wildlife Society Bulletin 32:22-34. Fox, J. 2002 Cox proportional-hazards regression for survival data. Pages 1-18 in J. Fox, editor.
An Appendix to An R and S-Plus Companion to Applied Regression. Sage Publications, Inc., Thousand Oaks, California, USA.
Grisham, B. A., C. W. Boal, D. A. Haukos, D. M. Davis, K. K. Boydston, C. Dixon and W. R.
Heck. 2013. The predicted influence of climate change on lesser prairie-chicken reproductive parameters. PLoS ONE doi:10.1371/journal.pone.0068225.
Grisham, B. A., C. W. Boal, D. A. Haukos and C. Dixon. 2015. Evaluation of capture techniques
on lesser prairie-chicken trap injury and survival. Journal of Fish and Wildlife Management doi:10.3996/032015-JFWM-022.
Gu, C. 2014. Gss: General smoothing splines. R Package Version 2.1-3 <http://cran.r-
project.org/web/packages/gss/index.html> Hagen, C. A., B. E. Jamison, K. M. Giesen, and T. Z. Riley. 2004. Guidelines for managing
lesser prairie-chicken populations and their habitats. Wildlife Society Bulletin 32:69-82. Hagen, C. A., B. K. Sandercock, J. C. Pitman, R. J. Robel, and R. D. Applegate. 2006.
Radiotelemetry survival estimates of lesser prairie-chickens in Kansas: are there transmitter biases? Wildlife Society Bulletin 34:1064-1069.
Hagen, C. A., J. C. Pitman, B. K. Sandercock, R. J. Robel and R. D. Applegate. 2007. Age-
specific survival and probable causes of mortality in female lesser prairie-chickens. Journal of Wildlife Management 71:518-525.
Hagen, C. A., B. K. Sandercock, J. C. Pitman, R. J. Robel, and R. D. Applegate. 2009. Spatial
variation in lesser prairie-chicken demography: a sensitivity analysis of population dynamics and management alternatives. Journal of Wildlife Management 73:1325-1332.
Haukos, D. A., L. M. Smith, and G. S. Broda. 1990. Spring trapping of lesser prairie-chickens.
Journal of Field Ornithology 61:20-25.

23
Jamison, B. E. 2000. Lesser prairie-chicken chick survival, adult survival, and habitat selection and movements of males in fragmented rangelands of southwestern Kansas. Thesis, Kansas State University, Manhattan, USA.
Kaplan, E. L. and P. Meier. 1958. Nonparametric estimation from incomplete observations.
Journal of the American Statistical Association 53:457-481. KState Research and Extension. 2015. Weather Data Library. <https://www.ksre.ksu.edu/wdl/>.
Accessed 15 Jun 2015. Kukal, C. A. 2010. The over-winter ecology of lesser prairie-chickens (Tympanuchus
pallidicinctus) in the northeast Texas Panhandle. Thesis, Texas Tech University, Lubbock, USA.
Lauver, C. L., K. Kindscher, D. Faber-Langendoen, and R. Schneider. 1999. A classification of
the natural vegetation of Kansas. Southwestern Naturalist 44:421-443. Lyons, E. K., B. A. Collier, N. J. Silvy, R. R. Lopez, B. E. Toole, R. S. Jones and S.J. DeMaso.
2009. Breeding and non-breeding survival of lesser prairie-chickens Tympanuchus pallidicinctus in Texas, USA. Wildlife Biology 15:89-96.
McDonald, L., G. Beauprez, G. Gardner, J. Griswold, C. Hagen, F. Hornsby, D. Klute, S. Kyle,
J. Pitman, T. Rintz, D. Schoeling, and B. Van Pelt. 2014. Range-wide population size of the lesser prairie-chicken: 2012 and 2013. Wildlife Society Bulletin 38:536-546.
Moynahan, B. J., M. S. Lindberg, and J. W. Thomas. 2006. Factors contributing to process
variance in annual survival of female greater sage-grouse in Montana. Ecological Applications 16:1529-1538.
Patten, M. A., D. H. Wolfe, E. Schochat, and S. K. Sherrod. 2005a. Effects of microhabitat and
microclimate selection on adult survivorship of the lesser prairie-chicken. Journal of Wildlife Management 69:1270-1278.
Patten, M. A., D. H. Wolfe, E. Schochat, and S. K. Sherrod. 2005b. Habitat fragmentation, rapid
evolution and population persistence. Evolutionary Ecology Research 7:235-249. Pirius, N. E., C. W. Boal, D. A. Haukos, and M. C. Wallace. 2013. Winter habitat use and
survival of lesser prairie-chickens in West Texas. Wildlife Society Bulletin 37:759-765. Plumb, R. T. 2015. Lesser prairie-chicken movement, space use, survival, and response to
anthropogenic structures in Kansas and Colorado. Thesis, Kansas State University, Manhattan, USA.
Pollock, K. H., S. R. Winterstein, and M. J. Conroy. 1989. Estimation and analysis of survival
distributions for radio-tagged animals. Biometrics 45:99-109.
24
Powell, L. A. 2007. Approximating variance of demographic parameters using the delta method: a reference for avian biologists. Condor 109:949-954.
R Core Team. 2014. R: A Language and Environment for Statistical Computing. R Foundation
for Statistical Computing 3.1.1 <http://www.R-project.org/>. Rodgers, R. D. 2016. A History of Lesser Prairie-Chickens. In Press In D.A. Haukos and C.W.
Boal, editors. Ecology and Conservation of Lesser Prairie-Chickens. Studies in Avian Biology. CRC Press, Boca Raton, Florida, USA.
Samson, F., and F. Knopf. 1994. Prairie conservation in North America. Bioscience 6:418-421. Sandercock, B. K. 2006. Estimation of demographic parameters from live-encounter data: a
summary review. Journal of Wildlife Management 70:1504-1520. Schroeder, M. A., and C. E. Braun. 1991. Walk-in traps for capturing greater prairie-chickens on
leks. Journal of Field Ornithology 62:378-385. Silvy, N., M. Morrow, E. Shanley, and R. Slack. 1990. An improved drop net for capturing
wildlife. Proceedings of the Annual Conference of the Southeastern Association of Fish and Wildlife Agencies 44:374-378.
Storch, I. 2007. Conservation status of grouse worldwide: an update. Wildlife Biology 13: 5-12. Taylor M. A. and F. S. Guthery. 1980. Status, Ecology and Management of the Lesser Prairie
Chicken. US For. Serv. Gen. Tech. Rep. RM-77. Rocky Mountain Forest and Range Experiment Station, Fort Collins, Colorado, USA.
Therneau, T. M. 2014. Package 'survival'.
http://Cran.RProject.Org/Web/Packages/Survival/Survival.Pdf 2.37-7. United States Fish and Wildlife Service. 2014. Endangered and threatened wildlife and plants;
determination of threatened status for the lesser prairie-chicken. Federal Register 79:19974-20071.
White, G. C., and K. P. Burnham 1999. Program MARK: survival estimation from populations
of marked animals. Bird Study 46:S120-S139. Wik, P. A. 2002. Ecology of greater sage-grouse in south-central Owyhee County, Idaho. Thesis,
University of Idaho, Moscow, USA. Winder, V. L., L. B. McNew, A. J. Gregory, L. M. Hunt, S. M. Wisely, and B. K. Sandercock.
2014. Effects of wind energy development on survival of female greater prairie-chickens. Journal of Applied Ecology 51:395-405.

25
Winterstein, S. R., K. H. Pollock, and C. M. Bunck. 2001. Analysis of survival data from radiotelemetry studies. Pages. 351–380 in J. J. Millspaugh and J. M. Marzluff, editors. Radio tracking and animal populations. Academic Press, Sand Diego, California, USA.
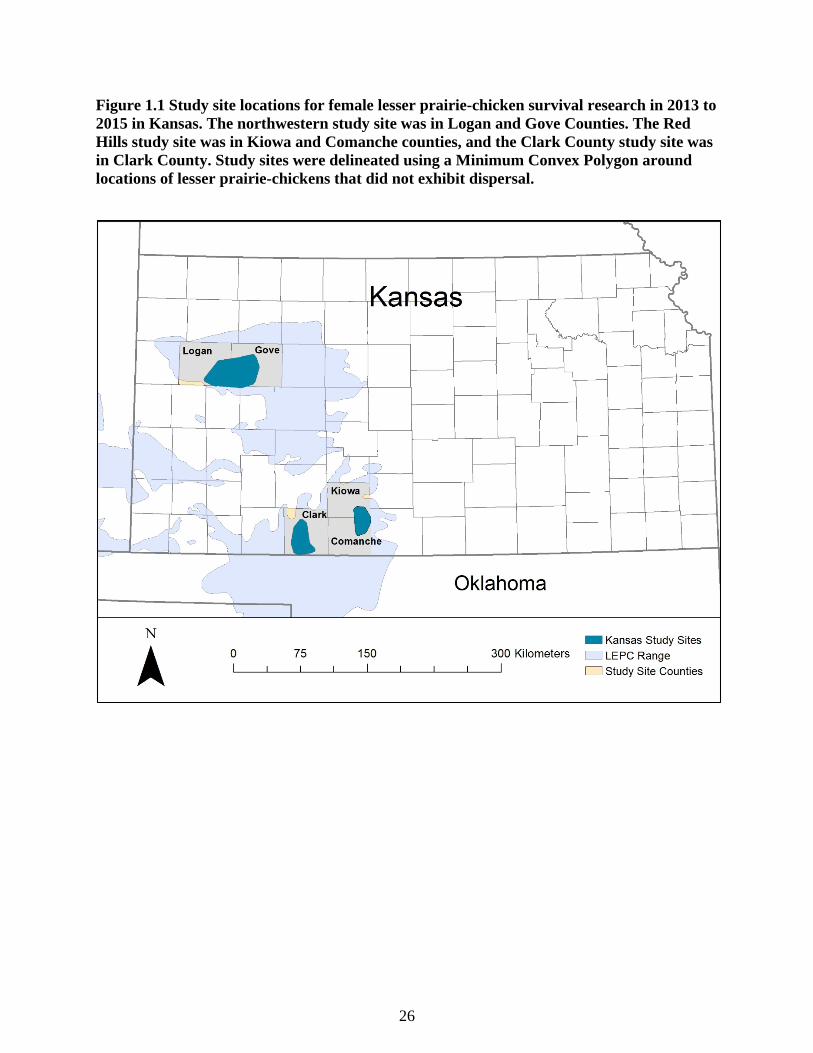
26
Figure 1.1 Study site locations for female lesser prairie-chicken survival research in 2013 to 2015 in Kansas. The northwestern study site was in Logan and Gove Counties. The Red Hills study site was in Kiowa and Comanche counties, and the Clark County study site was in Clark County. Study sites were delineated using a Minimum Convex Polygon around locations of lesser prairie-chickens that did not exhibit dispersal.
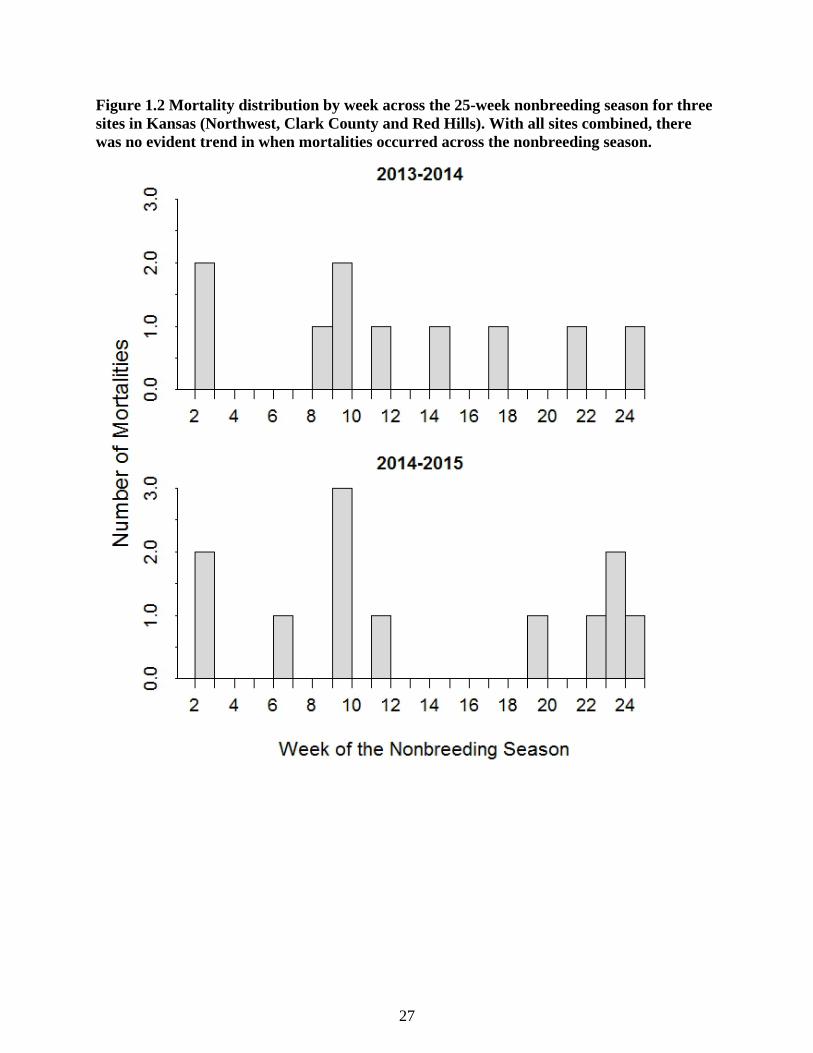
27
Figure 1.2 Mortality distribution by week across the 25-week nonbreeding season for three sites in Kansas (Northwest, Clark County and Red Hills). With all sites combined, there was no evident trend in when mortalities occurred across the nonbreeding season.

28
Figure 1.3 Survival rates (with 95% CI) by study site in Kansas for female lesser prairie-chickens during the 6-month nonbreeding season (16 September-8 March; 25 weeks), pooled across years (2013-2014 and 2014-2015). Study sites are defined as NW for northwestern Kansas, RH for the Red Hills, Kansas, and Clark for the Clark County, Kansas. Weekly estimates were generated in Program MARK, and the delta method was used to generate standard error for the entire 25-week nonbreeding season.

29
Figure 1.4 Counts of raptors (number of birds/16 km) during weekly surveys conducted at each of the three Kansas study sites (Northwest, Red Hills, Clark Co.) for the 6-month nonbreeding season across 2014-2015. Vertical line at week-10 representing the week with the highest hazard instantaneous hazard rate corresponding to the first high counts of raptors. Counts were for the entire 16-km survey, where 3-minute point counts were conducted every 0.8 km.
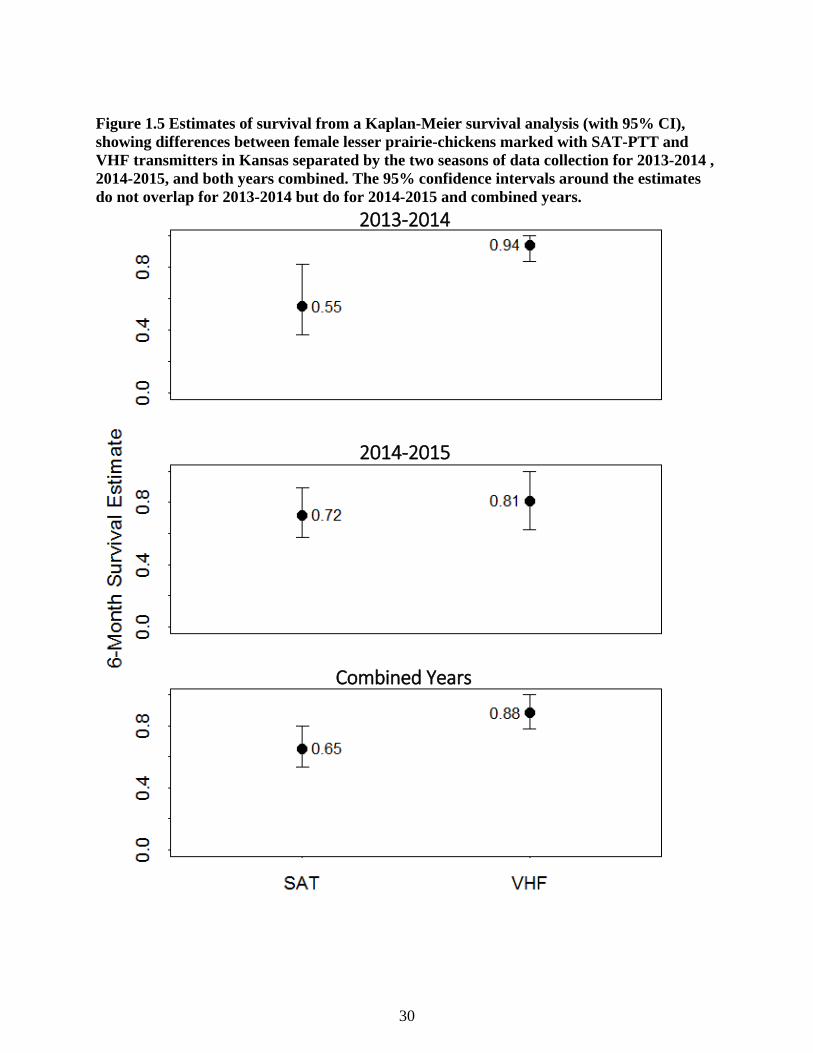
30
Figure 1.5 Estimates of survival from a Kaplan-Meier survival analysis (with 95% CI), showing differences between female lesser prairie-chickens marked with SAT-PTT and VHF transmitters in Kansas separated by the two seasons of data collection for 2013-2014 , 2014-2015, and both years combined. The 95% confidence intervals around the estimates do not overlap for 2013-2014 but do for 2014-2015 and combined years.
2013-2014
2014-2015
Combined Years

31
Figure 1.6 Kaplan-Meier survival curve (with 95% CI as dashes) illustrating cumulative survival curves as solid lines for female lesser prairie-chickens in Kansas outfitted with VHF (n = 42) transmitters and SAT-PTT transmitters (n = 52) over the 25-week nonbreeding season (16 September – 8 March), combining nonbreeding seasons from 2013-2014 and 2014-2015.
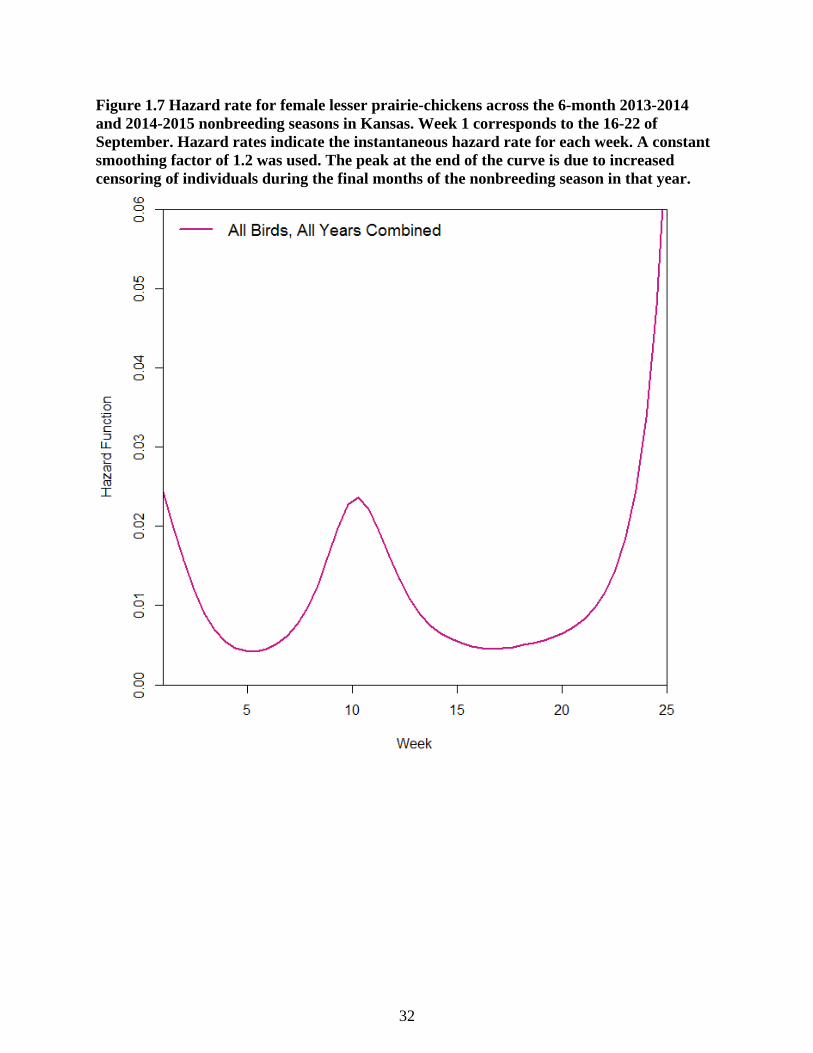
32
Figure 1.7 Hazard rate for female lesser prairie-chickens across the 6-month 2013-2014 and 2014-2015 nonbreeding seasons in Kansas. Week 1 corresponds to the 16-22 of September. Hazard rates indicate the instantaneous hazard rate for each week. A constant smoothing factor of 1.2 was used. The peak at the end of the curve is due to increased censoring of individuals during the final months of the nonbreeding season in that year.

33
Table 1.1 Studies reporting 6-month survival estimates of lesser prairie-chickens during the nonbreeding season. Estimates are converted from reported estimates to 6-month rates for comparisons.
Author and Year Study Area Survival Rate Sample Size
Hagen et al. 2007 Kansas 0.68 220 females
Jamison 2000 Kansas 0.74 160 both sexes
Kukal 2010 Texas 0.63 41 both sexes
Pirius et al. 2013 Texas 0.72 53 both sexes
Hagen et al. 2006 Kansas 0.65 216 males
Lyons et al. 2009 Texas 0.72 187 both sexes
Robinson 2015 Kansas 0.75 88 females

34
Table 1.2 Total number of female lesser prairie-chickens that survived the breeding season to be included in the nonbreeding survival study in Kansas. Number of individuals were separated by year, study site, and transmitter type. Six individuals survived the 2013 and 2014 breeding seasons and 2013-2014 nonbreeding season to be included in the 2014-2015 nonbreeding season.
Year Site Total # #VHF #SAT
2013 Northwest 25 13 12 Red Hills 17 9 8
2014 Northwest 22 9 13 Red Hills 15 7 8
Clark 15 4 11
Total 94 42 52

35
Table 1.3 Model selection table based on AICc rankings for Program MARK analysis of lesser prairie-chicken survival data, combining encounter histories from 2013-2014 and 2014-2015 nonbreeding seasons in Kansas. Models included effects of mean percent cover (%) of grass and forbs, and mean vegetation height (cm) as individual covariates, linear trends with minimum low and mean low weekly temperatures, study site, year and transmitter type as well as a priori combinations of site and year
Model Statistic Model Name K Deviance AICc ΔAICc wi
S % grass 2 246.98 250.99 0.16 S min temp 2 247.04 251.05 0.06 0.16 S constant 1 249.16 251.16 0.17 0.15 S mean low temp 2 247.47 251.48 0.49 0.13 S % forb 2 248.77 252.77 1.79 0.07 S min low temp2 3 246.78 252.79 1.80 0.07 S site 3 246.80 252.81 1.82 0.06 S mean low temp2 3 246.94 252.96 1.97 0.06 S vegetation height 2 249.11 253.12 2.13 0.06 S year 2 249.13 253.14 2.15 0.06 S site + year 4 246.54 254.56 3.58 0.03 S site x year 5 246.00 256.03 5.04 0.01 K = Number of parameters wi = Model weight

36
Table 1.4 Model selection table based on AICc rankings for Program MARK analysis of lesser prairie-chicken survival data from the 2014-2015 nonbreeding season in Kansas. Models included effects of mean percent cover (%) of grass and forbs, and mean vegetation height (cm) as individual covariates, linear trends with minimum low and mean low weekly temperatures, weekly raptor survey counts, study site, year, and transmitter type as well as a priori combinations of site and year, temperature, and raptor abundance.
Model Statistic Model Name K Deviance AICc ΔAICc wi S % grass 2 137.22 141.24 0.20
S mean low temp 2 137.91 141.92 0.69 0.14
S constant 1 140.09 142.10 0.86 0.13
S mean low temp 2 138.27 142.28 1.05 0.12
S % forb 2 139.13 143.14 1.90 0.08
S # raptor + mean low temp 3 137.19 143.21 1.98 0.08
S site 3 137.20 143.23 1.99 0.07
S # raptor + min low temp 3 137.62 143.64 2.41 0.06
S # raptor 2 140.00 144.01 2.78 0.05
S veg height 2 140.09 144.10 2.86 0.05
S #raptor2 3 139.90 145.93 4.69 0.02 K = Number of parameters wi = Model weight
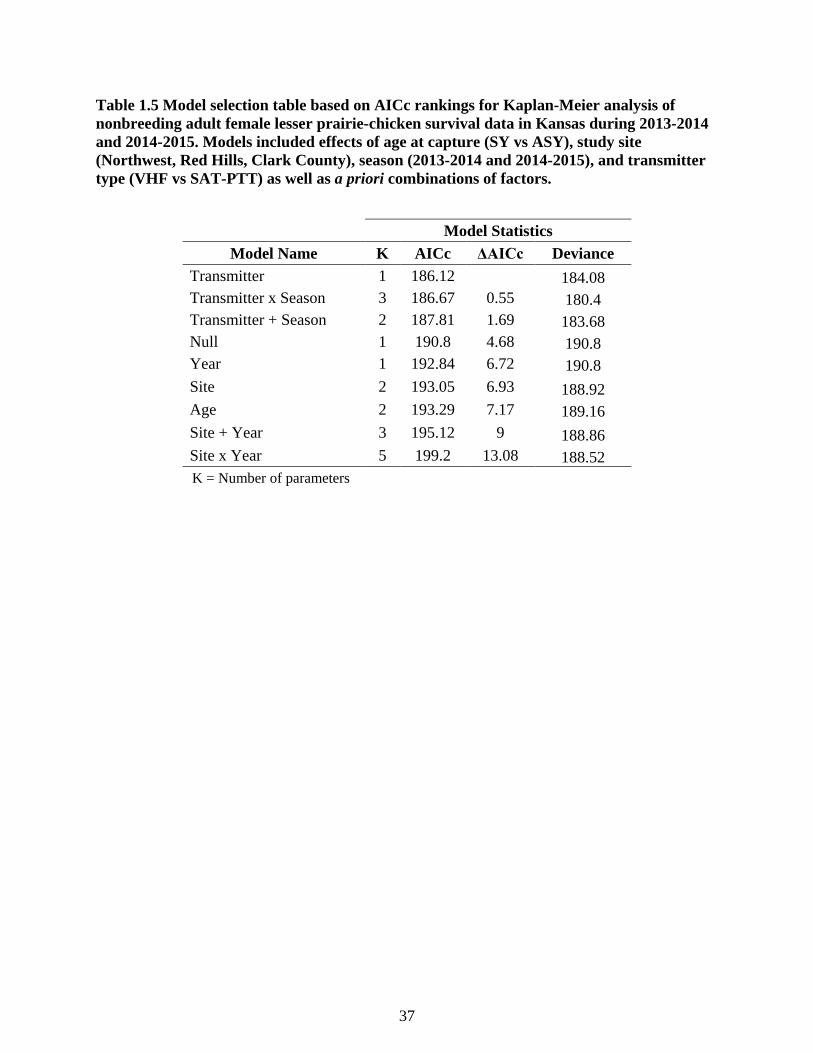
37
Table 1.5 Model selection table based on AICc rankings for Kaplan-Meier analysis of nonbreeding adult female lesser prairie-chicken survival data in Kansas during 2013-2014 and 2014-2015. Models included effects of age at capture (SY vs ASY), study site (Northwest, Red Hills, Clark County), season (2013-2014 and 2014-2015), and transmitter type (VHF vs SAT-PTT) as well as a priori combinations of factors.
Model Statistics Model Name K AICc ΔAICc Deviance
Transmitter 1 186.12 184.08 Transmitter x Season 3 186.67 0.55 180.4 Transmitter + Season 2 187.81 1.69 183.68 Null 1 190.8 4.68 190.8 Year 1 192.84 6.72 190.8 Site 2 193.05 6.93 188.92 Age 2 193.29 7.17 189.16 Site + Year 3 195.12 9 188.86 Site x Year 5 199.2 13.08 188.52 K = Number of parameters
38
Chapter 2 - Home-range and Space Use of Nonbreeding Lesser Prairie-Chickens in Southern Great Plains
Introduction
Understanding how wildlife species move and use space is crucial to developing
meaningful conservation strategies. A home-range can be defined as the cumulative depiction of
space used based on decisions an individual makes during stages of their life cycle to maximize
fitness (Powell 2000). The home range should contain all of the necessary resources to meet the
ecological needs of an individual including reproductive opportunities, forage, and cover
(Mitchell and Powell 2004, Powell and Mitchell 2012). To both survive and reproduce, an
individual needs to be able to minimize energy expenditure and mortality risk. Thus, measuring
variation in and individual’s home range size and placement across time and space can be a
useful representation of how a species perception of the landscape influences space use within
the constraints of resource availability. The ability to understand and predict the cumulative
space that specific populations of species will use can also be useful in the implementation of
management and conservation strategies to determine size and location of management actions.
Grasslands have experienced one of the greatest declines of all ecosystems within the
United States, with some areas having lost as much as 99% of the pre-European settlement area
(Samson and Knopf 1994). The loss of grassland has been attributed to conversion of crops,
suppression of natural fire, and climate change, which is affecting the timing and intensity of
drought across the Great Plains (Samson and Knopf 1994, Askins et al. 2007, Trenberth et al.
2014). The conversion of prairie to cropland has fragmented existing prairie into smaller blocks
of less contiguous land. Additionally, remaining prairie is often managed for livestock
production and may represent a lack of quality for species that need robust vegetative structure
for central life stages. Incumbent with the loss and degradation of grassland is the decline of bird
39
species that rely entirely upon large, relatively intact tracts of prairie (Brennan and Kuvlesky
2005). Specifically, within the southern Great Plains, the lesser prairie-chicken (Tympanuchus
pallidicinctus) is a representative umbrella species that has experienced long-term declines
(Hagen and Giesen 2005, Pruett et al. 2009).
Lesser prairie-chickens are a species of prairie-grouse found in the southern Great Plains
of Kansas, Colorado, New Mexico, Oklahoma and Texas. Lesser prairie-chickens have been a
species of conservation concern for many years, as both their abundance and occupied range
have declined since pre-European settlement (Hagen et al. 2004). The population decline has
been attributed to extensive land conversion from native prairie to cropland, unmanaged
livestock grazing, invasive species, and increasing energy infrastructure (Woodward et al. 2001,
Hagen and Giesen 2005). Due to ongoing declines, lesser prairie-chickens were listed as
threatened in May, 2014 under the U.S. Endangered Species Act (U.S. Fish and Wildlife Service
2014). Although the listing was vacated by a federal judge in September of 2015 (Permian Basin
Petroleum Association et al. v. Department of Interior, U.S. Fish and Wildlife Service, [Case
7:14-cv-00050-RAJ, U.S. District Court, Western District of Texas, Midland-Odessa Division]),
populations remain low, and require a conservation strategy to restore lesser prairie-chickens
back to a sustainable population level. Despite knowledge that decline and degradation of
grasslands have reduced habitat quality for lesser prairie-chickens, a better understanding of each
portion of their life-cycle, including those that may have been previously overlooked, such as
their nonbreeding ecology, is needed to develop successful conservation strategies. Current
management prescriptions are being advised range wide, but lesser prairie-chickens occupy four
distinct ecoregions across their range (Sand Shinnery Oak Prairie, Sand Sagebrush Prairie,
Mixed-Grass Prairie and Short-Grass Prairie/CRP Mosaic), which differ in vegetation
40
composition, structure and soil types (Van Pelt et al. 2013, McDonald et al. 2014). An increased
understanding of the differences and similarities among the four ecoregions, and across the lesser
prairie-chicken annual life-cycle, is required to reverse the decline of lesser prairie-chickens.
As an obligate grassland bird, placement of home ranges by lesser prairie-chickens
depends partially on the configuration of the grassland landscape, such as the size and
connectedness of grassland patches (Taylor and Guthery 1980). Lesser prairie-chickens require a
habitat matrix in which grassland habitat patches are connected to facilitate movement, dispersal,
and access to forage and cover (Pruett et al. 2009). However, due to landscape changes in the
southern Great Plains, available habitat for the lesser prairie-chicken has decreased from pre-
settlement availability (Rodgers 2016). The amount of habitat does not appear to be decreasing
rapidly in many areas, but lesser prairie-chicken populations remain low relative to long-term
averages and are continuing to decline in some regions (McDonald et al. 2014, Spencer 2014).
Overall grassland loss has not drastically changed throughout the northern portion of their
range since at least the 1950s and drivers of the recent declines of lesser prairie-chickens remain
unclear (Spencer 2014). Ecological studies of a declining species need to determine the target
areas for conservation, and whether those areas remain consistent spatially and temporally across
inhabited ecoregions (Sanderson et al. 2002, Pressey et al. 2007). The time of year when prairie-
chickens are the least studied is the nonbreeding season. The nonbreeding period has been
defined for lesser prairie-chickens as the portion of the year when females are not attending leks,
nests or broods. If nonbreeding season habitat requirements are not included in conservation
plans and strategies, then central life-stages may be overlooked. Nonbreeding season ecology can
have an effect on breeding ecology by cross-seasonal effects, such as providing quality habitat to
maintain body quality; thus, improving individual survival and fitness rates (Norris and Marra
41
2007). Additionally, additive mortality during the nonbreeding season can effectively reduce the
reproductive potential of an entire population during the breeding season (Norris and Marra
2007). Cross-seasonal interactions are not well understood and their potential importance have
been overlooked in resident species such as lesser prairie-chickens. A better understanding of
nonbreeding lesser prairie-chicken ecology is required to determine if management objectives
are addressing all of the habitat needs for their annual cycle, as opposed to just the needs of
nesting and brooding females.
One of the gaps in nonbreeding season ecology is home range and space use (Table 2.1).
Addressing this gap in knowledge is necessary, as the possibility exists that use of the landscape
in the non-breeding season is fundamentally different than the breeding season due to differences
in how time is spent, and the lack of limitations in space use that are implicit during the breeding
season. The central difference between the two seasons is that females do not constrain their
space use by attending nests, leks, and broods (Plumb 2015). Individual breeding season home
ranges can be driven by sex, as females attend nests and broods and both sexes attend leks, but
information is lacking as to whether males and females use space differentially during the
nonbreeding season. Home range size can also be driven by time, as different weather conditions
alter the landscape to be more or less favorable to lesser prairie-chickens and by ecoregion, as
each region is defined by different characteristics that affect lesser prairie-chicken use.
Nonbreeding season studies, which are limited to the southern portions of the lesser prairie-
chicken range, reported larger home ranges and greater movements than during the breeding
season (Candelaria 1979, Jones 2009, Lyons et al. 2009, Kukal 2010, Pirius 2011). Estimates of
average nonbreeding home range size vary between 62 and 1946 ha; however, most estimates are
hampered by low sample size of radio-marked birds (Haukos and Zavaleta 2016). Constraints on

42
home range size for the nonbreeding season are largely unknown during this time period. One
hypothesis is that despite the time of year, female prairie-chickens are tied to leks and will use
space in areas close to leks, as the location of these central display areas are due to placement in
the best available habitat (Schroeder and White 1992, Gibson 1996).
The lek is a feature on the landscape that all prairie-chickens need to attend at some point
in their life-cycle; thus, it is included in their overall home range. During the breeding season,
females need to be in some proximity of leks for reproduction but typically remain close to leks
throughout their life cycle (Giesen 1994, Winder et al. 2015). This could be due to lek placement
in high quality lesser prairie-chicken habitat, which supports the recommendation that areas
around lekking sites need to be conserved (Woodward et al. 2001). The area around leks must
also consist of nesting and brooding habitat, as well as adequate habitat for concealment and
forage (Ahlborn 1980, Applegate and Riley 1998). Male lesser prairie-chickens are known to lek
during the months that the photoperiod is similar to that of the spring lekking period (Jones
1964), but influence leks having on nonbreeding female lesser prairie-chicken space use is not
well understood. To further understand whether leks remain important to lesser prairie-chickens
during the nonbreeding season, intensity of use within the home range can be used.
In addition to the lek being a potential driver of intensity of space use during the
nonbreeding season, finer scale habitat use may also vary across the nonbreeding season as
grassland structure and composition are altered by grazing and weather, decreasing the ability of
vegetation to act as cover or food for lesser prairie-chickens. When this degradation of habitat
occurs, it may be necessary for lesser prairie-chickens to find alternate sources of food and
cover. One possible place to access increased cover is in fields enrolled in the Conservation
Reserve Program (CRP), which are former croplands planted to perennial vegetation cover that is

43
generally not grazed or burned within the northern range of lesser prairie-chickens. Overall lack
of management of CRP fields creates areas with denser cover than grazed grasslands (Delisle and
Savidge 1997). Last, lesser prairie-chickens could spend an increased amount of time in crop
fields foraging for waste grain. Changes in habitat use through time could also drive broad-scale
changes in home range size and space use, as prairie-chickens need to increase the overall space
used to incorporate sufficient habitat to meet resource needs. Furthermore, with lesser prairie-
chickens located in four ecoregions across the Southern Great Plains, understanding differential
habitat use across the nonbreeding season can assist in the identification of differences among
ecoregions and whether or not these differences must be accounted in population management
range-wide.
A study of lesser prairie-chicken space use and habitat use on the landscape requires the
use of radio-transmitters to track these secretive birds with large space requirements through
space and time. Past studies have mainly used Very High Frequency (VHF) transmitters to locate
lesser prairie-chickens on the landscape. However, this method is limited by the amount of effort
put into finding individual birds and variation in transmitter range, due to transmitters and
topography. Recent technological advances have made GPS Satellite Platform Transmitting
Terminal (SAT-PTT) tags that are small enough (≤ 5% of mass) to attach to birds such as lesser
prairie-chickens. The transmitters provide a finer scale of data, both spatially and temporally, and
can be used to ask and answer fine-scale space and habitat use questions. However, the standard
method of estimating home range with these two transmitter types are different, with data from
VHF transmitters analyzed using fixed kernel density estimators, and GPS data analyzed using
models that account for temporal autocorrelation, such as Brownian Bridge movement models
(Bullard 1999, Horne et al. 2007, Walter et al. 2015). My project is the first study to utilize these
44
transmitters on nonbreeding lesser prairie-chickens, a comparison of space use resulting from
these two transmitter types, and the techniques to analyze these data should be done.
My objectives were to 1) compare estimates of home range size among sexes, ecoregions
and seasons, 2) evaluate nonbreeding lesser prairie-chicken space use relative to lek locations,
and 3) document temporal changes in habitat use across the nonbreeding season. A secondary
objective of this research was to 4) compare home range size between VHF individuals with
fixed-kernel density estimators and SAT-PTT home individuals calculated with Brownian Bridge
movement models. I predict that females have larger home ranges than males, and that and males
will use space closer to leks within home ranges relative to females, because male lek-mating
grouse visit leks in the fall. I predict that if lek locations influence lesser prairie-chickens home
range placement during the nonbreeding season, relative influence will decrease during the
central months of the nonbreeding season (November, December and January) compared to
October and February, as breeding season space use will have less influence during these
months. I also hypothesized an increasing trend in use of CRP and cropland over the
nonbreeding season, as birds move to areas with increased cover such as CRP fields and areas
with increased food such as waste grain.
Study Area
Within the current five-state range that lesser prairie-chickens occupy there are four
different ecoregions. In Kansas, there are sections of the Sand Sagebrush Prairie Ecoregion, the
Mixed-Grass Prairie Ecoregion and the Short-Grass Prairie/CRP mosaic Ecoregion, Colorado
contains portions of the Sand Sagebrush and the Short-Grass/CRP ecoregions, and New Mexico
is in of the Sand Shinnery Oak Prairie Ecoregion (SSO; Figure 2.1). The different ecoregions
support different densities of lesser prairie-chickens, with the greatest densities of birds
45
occurring in the SCRP and MGR of Kansas (McDonald et al. 2014). Lower densities were found
in the SSB and SSO ecoregions.
Study sites were delineated by creating a Minimum Convex Polygon using the Minimum
Bounding Geometry tool in ArcGIS 10.2 (ESRI Inc., 2013, Redlands, USA) around all of the
bird points for each site, excluding dispersal events. The study sites were located in three areas of
Kansas, eastern Colorado, and eastern New Mexico (Figure 2.2). The study area in Kansas
included two sites within the Short-Grass Prairie/CRP Mosaic Ecoregion dominated by CRP
grasslands and row-crop agriculture on silt-loam soils (McDonald et al. 2014). The study site in
Northwestern Kansas was 171,437 ha, and located in Gove and Logan counties, on private land
and the Smoky Valley Ranch, owned and managed by The Nature Conservancy. The primary
land uses in this area were livestock grazing, energy extraction and both center-pivot and row-
crop agriculture. Mixed-grass prairie species occurrence increased from west to east in this
region. Dominant vegetation in the region included: blue grama (Bouteloua gracilis), hairy
grama (B. hirsute), buffalograss (B. dactyloides), little bluestem (Schizachyrium scoparium),
sideoats grama (B. curtipendula), big bluestem (Andropogon gerardii), Illinois bundleflower
(Desmanthus illinoensis), prairie sunflower (Helianthus petiolaris), annual buckwheat
(Eriogonum annum), sand milkweed (Asclepias arenaria), nine-anther dalea (Dalea enneandra),
and western ragweed (Ambrosia psilostachya; Lauver et al. 1999). Grass species planted in CRP
fields included little bluestem, sideoats grama, big bluestem, switchgrass (Panicum virgatum),
blue grama, buffalograss, and Indian grass (Sorghastrum nutans, Fields 2004). The CRP fields
were interseeded with forbs in the 1990s; those planted included white sweet clover (Melilotus
alba), yellow sweet clover (Melilotus officinalis), Maximillian sunflower (Helianthus
maximiliani), Illinois bundleflower, purple prairie clover (Dalea purpurea), and prairie

46
coneflower (Ratibida columnifera; Fields 2004). Wheat (Triticum aestivum), sorghum (Sorghum
bicolor), and corn (Zea mays) were the major crops in the region.
The Red Hills Kansas study site was 49,111 ha and centered on private lands in Kiowa
and Comanche counties within the Mixed-Grass Prairie Ecoregion (McDonald et al. 2014). The
south-central Kansas site consisted of mixed-grass prairie on loamy soils. Primarily land uses for
the Red Hills included livestock grazing, oil and gas extraction, and row-crop agriculture.
Dominant vegetation in south-central Kansas included little bluestem, blue grama, hairy grama,
sideoats grama, buffalograss, sand dropseed (Sporobolus cryptandrus), Louisiana sagewort
(Artemisia ludiviciana), western ragweed (Ambrosia psilostachya), sand sagebrush (Artemisia
filiafolia), and eastern red cedar (Juniperus virginiana; Lauver et al. 1999).
The Clark County study site within south-central Kansas was 71,209 ha and located at the
Mixed-Grass Prairie Ecoregion and Sand Sagebrush Prairie Ecoregion boundary (McDonald et
al. 2014). Land use was dominated by livestock grazing, oil and gas extraction, and row-crop
agriculture. Dominant vegetation in the area included: little bluestem, sideoats grama, blue
grama, hairy grama, big bluestem, alkali sacaton (Sporobolous airoides), Russian thistle (Salsola
kali), kochia (Kochia scoparia), annual sunflower (Helianthus annuus), and sand sagebrush. This
study site also had considerable alkali flats along drainages.
Within eastern Colorado, the study site was located on private lands in Cheyenne, Baca,
and Prowers counties totaling 28,388 ha. Two disjointed study areas were combined into a single
area due to low sample size. All study sites were within the Sand Sagebrush Prairie Ecoregion
(McDonald et al. 2014; Figure 2.1). Land use within the study site included livestock grazing,
row-crop agriculture, and CRP grasslands. Dominant vegetation in the region included: blue
grama, hairy grama, sideoats grama, buffalograss, little bluestem, big bluestem, sand sagebrush,

47
kochia, and Russian thistle. Major crops within the region included wheat, sorghum, and corn.
Oil and gas development was infrequent in this site.
The New Mexico study site was 63,756 ha located in Lea and Roosevelt counties of the
Southern High Plains within the Sand Shinnery Oak Prairie Ecoregion. Birds were trapped on the
Milnesand Prairie and North Bluit Prairie Chicken Areas owned by the New Mexico Department
of Game and Fish. Plants that dominate this ecoregion include sand dropseed, hairy grama, little
bluestem, big bluestem, silver bluestem, yellow bluestem and sideoats grama. Common forbs
include silverleaf nightshade (Solanum elaeagnifolium), spectacled pod (Dimorphocarpa
wislizenii), Indian blanket (Gaillardia pulchella), wooly locoweed (Astragalus ollissimus),
annual sunflower scarlet gaura (Gaura coccinea), and halfshrub sundrop (Calylophus serrulatus,
Grisham 2012). Shrubs in this region include sand shinnery oak (Quercus havardii) and sand
sagebrush. Land use was dominated by livestock grazing, oil and gas production, and center-
pivot agriculture (Grisham 2012).
Methods
Capture Lesser prairie-chickens were captured at leks in spring (March – May) during 2013 and
2014 in Northwest and Red Hills, Kansas as well as Colorado. Lesser prairie-chickens were only
captured at leks in the spring of 2014 in Clark County, Kansas and New Mexico. Birds were
trapped using walk-in drift traps, magnetic dropnets, and rope-trigger dropnets (Haukos et al.
1990, Silvy et al. 1990, Schroeder and Braun 1991). Captured individuals were aged using the
degree of spotting on the 9th and 10th primaries; second-year birds had spotting within 3.8 cm
from the feather tip, and after-second-year birds had spotting ≥3.8 cm from the feather tip. I also
used the amount of wear of the feather tips as juvenile grouse do not molt those primaries until
their second year; thus, have frayed feather tips (Copelin 1963). I sexed individuals using tail

48
feather color; females had barred tail feathers and male prairie-chickens had mainly black tail
feathers (Copelin 1963).
Female lesser prairie-chickens were outfitted with either 12-15-g bib-style VHF
transmitters (A3960, Advanced Telemetry System, Isanti, USA), or a rump-mounted 22-g
Satellite Platform Transmitting Terminal GPS transmitter (PTT-100, Microwave Telemetry,
Columbia, Maryland, USA). SAT-PTT transmitters were attached on the rump using leg
harnesses made of Teflon® ribbon, with elastic at the front of the harness for flexibility
(Bedrosian and Craighead 2010, Dzialak et al. 2011). Male lesser prairie-chickens were
opportunistically fit with the remaining SAT-PTT transmitters after females stopped attending
leks in May.
Female lesser prairie-chickens are difficult to capture during the nonbreeding season, and
the sample size for my study was comprised of individuals that survived from the previous
spring trapping season. For this study, the nonbreeding season was defined as the six-month
period between the 16th of September and the 14th of March. All capture and handling procedures
were approved by the Kansas State University Institutional Animal Care and Use Committee
under protocol #3241, the Kansas Department of Wildlife, Parks and Tourism scientific
collection permits (SC-042-2013 and SC-079-2014), and the Colorado Parks and Wildlife
scientific collection licenses (13TRb2053 and 14TRb2053). New Mexico birds were captured by
researchers from New Mexico State University under permits from New Mexico Game and Fish.
Tracking Female prairie-chickens outfitted with VHF transmitters were located three to four times
per week during the nonbreeding season. We triangulated individuals from three to five locations
using a three-piece hand-held Yagi antenna and either an Advanced Telemetry Systems Receiver
(R4000, R4500, Advanced Telemetry Systems, Isanti, USA) or a Communications Systems

49
Receiver (R1000, Communications Specialists, Orange, USA). Bearings of locations were ≥15
degrees apart and taken within 20 minutes to decrease error from bird movement. Bearings and
Universal Transverse Mercator (UTM) positions for birds with VHF radios were entered into the
program Location of a Signal (LOAS; Ecological Software Solutions LLC, Hegymagas,
Hungary) to determine the estimated UTM location of the individual and estimate an error
polygon around the point. I attempted to limit error polygons to 0.1 ha, but used locations with
error polygons up to 1ha for birds with a limited number of locations (~22%).
Birds outfitted with a Satellite-PTT transmitter recorded up to eight positions a day, with
±18 m accuracy, every two hours between 06:00 – 22:00 during the nonbreeding season.
Locations were uploaded to the Argos satellite, downloaded every three days into the Argos
System, and compiled weekly.
Home Range A utilization distribution is a probability distribution of an animal’s locations throughout
the time period of monitoring (Van Winkle 1975). Home ranges for Satellite-PTT marked
individuals were estimated by calculating a utilization distribution using Brownian Bridge
Movement Models (Horne et al. 2007). The program adehabitatHR, and function kernelbb was
used to calculate the utilization distributions (Calenge 2006). Utilization distributions (UD) for
SAT-PTT individuals were estimated for the entire nonbreeding season, as well as monthly
estimates from October - February. Brownian Bridge Movement Models take into account the
time lag between successive locations, the path between the two locations, and temporal
autocorrelation, which represents a refinement over the use of fixed kernel density estimators for
these type of data (Bullard 1991, Walter et al. 2011). Home ranges for the entire nonbreeding
season (September 16-March 14) were estimated for SAT-PTT individuals that had at least 100
50
points (alive about 13 days) within the season. Monthly home ranges were calculated for SAT-
PTT individuals that had at least one point per day throughout an entire month.
Home ranges for VHF-marked individuals were estimated using a fixed kernel density
estimator and least squares cross validation (LSCV) for smoothing with the function kernelUD
(Calenge 2006). Home ranges were estimated for birds that had ≥30 locations for one
nonbreeding season (Seaman et al. 1999). Due to the tendency for about half of the individuals
during the nonbreeding season to disperse from the area we captured them (S. Robinson unpubl.
data), LSCV could not converge across the gap between where they were last detected and where
individuals were located again using aircraft. I used the average smoothing parameter from all
individuals for which LSCV was able to converge for, to calculate the kernel density estimate of
individuals with a gap in tracking times. These home ranges ended up as two main areas with a
gap in-between as no information was known about the movement between the time of dispersal
and the time of relocation. As a maximum of four points per week were obtained for VHF birds,
there were no birds that had enough points to estimate monthly home ranges.
Variation in Home Range Welch’s two-sample t-tests using Program R were used to test for differences in average
home-range size between transmitter types (VHF and SAT-PTT), sexes, and seasons. If a
difference existed between VHF and SAT-PTT home range sizes, they were separated and
differences between site and season were tested separately. I used one-way Analysis of Variance
(ANOVA) to compare home range size among study sites. Analysis among study sites were
separated by season because the New Mexico and Clark County study sites were not present for
comparisons for the first season. If site was a significant main effect in the model (P < 0.05), I
used a post-hoc Tukey’s HSD test to determine differences in mean home range sizes among
study sites. I used a one-way ANOVA to test for differences in mean home range size among
51
months. I used simple linear regression to test for a temporal trend in proportion of locations in
crop, CRP or grassland habitat types by site across the seven months of the nonbreeding season.
Resource Utilization Functions The probability distribution of use within the utilization distribution can be used to relate
space use to features on the landscape. Home ranges were used from both nonbreeding male and
female lesser prairie-chickens to test us by lesser prairie-chicken of space in relation to leks
during the nonbreeding season with resource utilization functions in the package ruf.fit in
Program R (Handcock 2007, R Core Team 2014). Resource utilization functions use a multiple
regression framework. The intensity of use from the utilization distribution serves as the
dependent variable (Marzluff et al. 2004). The 99% isopleth defined the extent of the available
habitat within each individual’s home range (Kertson and Marzluff 2011). I related intensity of
use to distance from all known leks. Lek locations used were located by surveys within each
study site. I also used Kansas leks from the Kansas Department of Wildlife, Parks, and Tourism
from lek surveys across the study sites and aerial surveys performed by WEST Inc. (McDonald
et al. 2014). Distance rasters for lek locations at each site were created using the Euclidean
Distance tool in ArcGIS 10.2 (ESRI Inc., 2013, Redlands, USA). Resource utilization functions
produce standardized beta estimates for each individual, which are then averaged across all
individuals for a population level estimate of space use (Marzluff et al. 2004). A negative beta
estimate for distance to lek would indicate an increase in space use closer to leks, because as
distance to lek increases, use would decrease. Resource utilization functions were analyzed for
the entire nonbreeding season and separately for the months of October, November, December,
January and February to determine if space was being used closer to leks than expected by
chance and if space use in relation to known leks varied across the nonbreeding season, between
males and females, and among sites.
52
Habitat Use The landscape of study sites within the ecoregions was characterized using the 2009
Playa Lakes Joint Venture land cover layer and a 2014 layer of all properties enrolled in CRP
across the range of lesser prairie-chicken provided under agreement with the U.S. Department of
Agriculture, Farm Service Agency (Playa Lakes Joint Venture 2009). The Playa Lakes Joint
Venture layer and the CRP layer each had a resolution of 30 m x 30 m. An accuracy assessment
was conducted on these landcover layers, and found that grassland was overall classified
correctly, but confusion could arise as to what type of grassland (McLachlan 2012). For habitat
use analysis, all native grassland and shrubland classes were grouped into a single grassland
habitat type to avoid any misclassification. In New Mexico, agricultural land (i.e., wheat) was
often confused with short-grass prairie, so it may be overrepresented (McLachlan 2012). All bird
points from the nonbreeding season were imported into ArcGIS version 10.2, and I used the
Identity tool to determine the habitat type for each bird point. The majority of locations (97.8%)
were from SAT-PTT locations, which had an error of 18 m, allowing for accurate habitat type
identification from the landcover layers. Categories used for reporting habitat use were grouped
into Grassland, CRP, Cropland, and Other. Grassland habitat types were short-grass, mixed-
grass, sand sagebrush and sand shinnery oak prairie. Crop types included wheat, sorghum, corn,
alfalfa, and fallow. Classes that comprised the “Other” group were riverine systems, river,
channel, wet meadow, secondary roads, 4-lane roads, saline, stock pond, emergent marsh, and
playas.
Results
Nonbreeding home ranges were estimated for 87 individual lesser prairie-chickens (Table
2.2). During the 2014-2015 nonbreeding season, six SAT-PTT transmitters malfunctioned. The
six individuals did not have enough consecutive points to calculate utilization distributions with
53
Brownian Bridge movement models correctly and were censored. Additionally, over the course
of the study, five individuals dispersed outside of my defined study areas. The 95% home ranges
for these individuals were not included in the home range size comparison, as these movements
were considered natal dispersal and not within-season home ranges.
Average home range size for lesser prairie-chickens outfitted with SAT-PTT transmitters
(x̄ = 954.7 ha, SE = 128.5) were 215% larger than home ranges for lesser prairie-chickens fitted
with VHF transmitters (x̄ = 303.5 ha, SE = 24.1; t71 = -4.98, P < 0.001). Mean home range size
did not differ among sites (F2,14 = 0.45, P = 0.65) or seasons (F1,14 = 0.03, P = 0.87, Table 2.3)
for VHF marked lesser prairie-chickens. Male prairie-chickens were only outfitted with SAT-
PTT transmitters (Table 2.2), so I tested for home range size between sexes just for SAT-PTT
individuals. Average home range sizes did not differ between female (x̄ = 986 ha, SE = 185.4)
and male lesser prairie-chickens (x̄ = 904.7 ha, SE = 112.4; t65 = -0.37, P = 0.72). Average home
range size was about three times smaller during the 2013-2014 nonbreeding season (x̄ = 536.1
ha, SE = 67.4) than the 2014-2015 nonbreeding season (x̄ = 1264.9 ha, SE = 205.7; t46 = -3.66, P
< 0.001). During the 2013-2014 nonbreeding season, average home range size was ~50% smaller
in the northwestern study site compared to the Red Hills and Colorado study sites (F2,34 = 3.68, P
= 0.017; Table 2.4). Tukey’s HSD test indicated that the difference was between northwestern
Kansas (x̄ = 336.9 ha, SE = 69.7) and Colorado (x̄ = 694.7 ha, SE = 149.4). In the 2014-2015
nonbreeding season, with two additional sites (Clark County and New Mexico), there was no
difference in home range size among study sites for SAT-PTT marked lesser prairie-chickens
(F4,34 = 0.90 , P = 0.47).
I had a total of 285 bird-months, from 69 individuals that had at least 100 points within a
month, across October-February, with sexes combined, for comparing average monthly home

54
range size of SAT-PTT birds (Table 2.5). There were no differences in home range size among
months (F4,280 = 0.81, P = 0.52). The overall mean monthly home range across all sites was 600.8
ha (SE = 50.0).
The resource utilization function using distance to lek as a variable indicated that lesser
prairie-chickens used space closer to leks (β = -0.15, SE = 0.028, 95% CI = -0.2055, -0.0958)
within their home range than expected by chance (Figure 2.3). The mean beta between sexes
showed that males spent more time closer to leks (β = -0.37, 95% CI = -0.50, -0.25) than female
lesser prairie-chickens (β = -0.074, 95% CI = -0.12, -0.026).
Across the entire nonbreeding season, birds in northwestern and Red Hills Kansas,
Colorado and New Mexico sites used space within their home ranges closer to leks than expected
(Figure 2.4). Lesser prairie-chickens in Clark County, Kansas, displayed a pattern of avoidance
of space in relation to lek locations, but confidence intervals of population beta estimates
overlapped zero. With all sites combined, monthly space use in relation to leks did not change
among the months of the nonbreeding season, as beta estimates of all months overlapped, and
space was used closer to leks in all months except November (Figure 2.5). Space use in relation
to leks by month varied by site, with no consistent pattern among sites (Figure 2.6). Birds in the
Red Hills study site used space close to leks in all months whereas all other sites had some
overlap with zero (Figure 2.6e). In October, lesser prairie-chickens in Colorado and New Mexico
also used space closer to leks, but in November only New Mexico lesser prairie-chickens used
space close to leks (Figure 2.6a,b). In December and January, birds in northwest Kansas and
Colorado used space close to leks, but in February this relationship was only seen in northwest
Kansas (Figure 2.6b,c).

55
Components of habitat use varied overall and monthly among study sites during the
nonbreeding season (Figure 2.7). Grassland comprised the majority of habitat use at all sites
except Colorado, for which CRP consisted of the majority of habitat use. In the Clark County
study site, there was an increase in use of both CRP and Cropland with a decrease in Grassland
use across the nonbreeding season (Figure 2.7). At the Red Hills study site, there was a
decreasing trend in CRP use over the nonbreeding season (Figure 2.7). This decrease was from
about 2% to zero. However, this was likely not a biologically relevant change in habitat use, as it
represented the use of a CRP field by a single bird and ceased when she died. Lesser prairie-
chickens in northwestern Kansas exhibited a pattern of increasing Cropland and CRP use as the
nonbreeding season progressed, but this trend was not statistically significant (Table 2.6). I
observed a relatively large proportion of the “other” habitat type used by birds in the Clark
County and Red Hills study sites (Figure 2.7). I classified wet meadow and lowlands as “Other”
for these study sites, representing the variable nature of habitat use among the study sites.
Discussion
Nonbreeding season ecology of lesser prairie-chickens is a necessary portion of the life-
cycle to study for understanding the relative importance of habitat areas, required spatial extents,
cross-seasonal effects, and informing conservation planning for this species of conservation
concern. Unfortunately, due to sample size constraints from difficulty of catching females after
the spring lekking season and lack of interest by assuming that this period is not affecting
population growth, the nonbreeding season is an understudied portion of lesser prairie-chicken
space use. The lack of information regarding nonbreeding season space use is especially true in
the northern extent of the lesser prairie-chicken range, north of the Arkansas River in Kansas and
Colorado. A better understanding of the full life-cycle of species is necessary to determine

56
whether nonbreeding lesser prairie-chickens are using space differently than breeding lesser
prairie-chickens. I found 1) the mean home range size estimated for VHF transmitters is much
less than those estimated from SAT-PTT transmitters. I also found that, 2) home range size is
variable between nonbreeding seasons, 3) male and female lesser prairie-chickens remain close
in space to leks throughout the nonbreeding season, and 4) although proportions of habitat
components used among ecoregions is different, there is little change in use across the
nonbreeding season for most sites.
Home range size of lesser prairie-chickens with SAT-PTT transmitters was three times
greater than for lesser prairie-chickens with VHF transmitters. Methods for home range
estimation of lesser prairie-chickens in the past have typically used either minimum convex
polygons or fixed kernel density estimators with location data from VHF transmitters. VHF
transmitters provide a coarser temporal scale of data compared to the SAT-PTT transmitters used
(3-4 points/week vs. 50+ points/week). Lesser prairie-chickens outfitted with VHF transmitters
often cannot be located during movement events away from the area birds were captured in until
relocated by aircraft or from extensive ground-based searching. Conversely, the SAT-PTT
individuals were tracked throughout their entire movement process even when dispersing from
core study sites, which allowed for location of individuals when they are out of range from
convenient receiver locations. The possibility also exists that the differences observed between
the transmitter types are because of low sample size from VHF transmittered individuals,
coupled with the large variation in home ranges of SAT-PTT individuals. This difference in
home range size between transmitter types does not allow for comparison between my estimates
of home range size for SAT-PTT transmittered lesser prairie-chickens to past studies, which only
used VHF technology.

57
The estimated home range size of nonbreeding lesser prairie-chickens estimated with
kernel density estimators in this study (x̄ = 303.5 ha) is within the range of estimates from past
studies estimated from both kernels and minimum convex polygons. The single study that
reported nonbreeding home range size in Kansas reported a range of 229 to 409 ha for October
(Jamison 2000). Pirius (2011) reported nonbreeding home range estimates for VHF birds in
Texas that were greater than my study by about 200 ha. Taylor (1978), using minimum convex
polygons, found a wide array of home range sizes across months, with a peak in December (1946
ha) and a large decrease by February (62 ha). With estimates for VHF individuals similar to past
studies, but much larger estimates for SAT-PTT individuals, it is likely that previous VHF
studies underestimated the spatial extent of lesser prairie-chicken use during the nonbreeding
season. As SAT-PTT transmitters are constantly decreasing in cost and size, with a 17-g
transmitter already available at the time of writing this, future studies interested in space use
should use these transmitters to better understand species that have the propensity to use space
on the landscape scale, such as lesser prairie-chickens.
For SAT-PTT home range estimates, nonbreeding season home ranges were 181% larger
than the breeding season home ranges for the counterpart to this study. Plumb (2015) found an
average home range size of breeding female lesser prairie-chickens in Kansas and Colorado to be
340 ha ± 53, using the same methods with SAT-PTT individuals and Brownian Bridge
Movement Models. The increased size of home ranges during the nonbreeding season indicates
that estimates obtained for the breeding season do not accurately represent the amount of space
required for lesser prairie-chickens on an annual basis. With the capability to triple their home
range size without dispersing out of the study site, coupled with increased survival rates during
the nonbreeding season (Chapter I), it is likely that during the breeding season home range size is
58
not limited by available habitat, as lesser prairie-chickens can use a greater amount of space
without impacting survival rates. Home range size limitations during the breeding season are
more likely explained by reproductive activities that limit the extent of movement from a central
location, such as tending nests and broods (Plumb 2015). Combining the breeding and
nonbreeding locations for these birds to calculate annual home ranges will indicate whether the
amount of annual space used increases or remains consistent in comparison to the nonbreeding
season.
Home range size varied by site only in the first nonbreeding season, with the mean home
range estimate in northwestern Kansas site being 50% smaller than that for Colorado and the Red
Hills. Home range sizes were not statistically different among sites for the 2014-2015
nonbreeding season, but the same pattern was observed; northwestern Kansas had a smaller
home range size than all other sites. However, overall, home range size did not differ among
sites or ecoregions between the two seasons of this study. One of the likely reasons for the lack
of difference in home range size among study sites was the large amount of variability in home
range size among individuals within study sites, which can be observed in large standard errors
for home ranges, especially in the Red Hills and Clark County. The variation in home range size
is due to individual variation, with some individuals moving a great deal over the course of the
year and others remaining in a comparatively small area. That a difference in home range size
was not observed among study sites in different ecoregions, such as New Mexico in the Sand
Shinnery Oak Prairie Ecoregion and the Red Hills in the Mixed-Grass Prairie Ecoregion, or
between areas with different lesser prairie-chicken densities, indicates that lesser prairie-chickens
have similar nonbreeding space requirements across their range. The next step to understanding
this relationship could be to separate birds that exhibit different life-cycle strategies, such as

59
extensive versus limited movement, and try to understand why birds are behaving in different
ways, such as genetic differentiation.
Mean home range size during the 2013-2014 nonbreeding season was 136% greater than
that for the 2014-2015 nonbreeding season. During the 2013 growing season, the entire Southern
Great Plains region remained in a severe drought, but the 2014 growing season brought more
rain across all study sites (KState Research and Extension 2014, Figure 2.8). Increased
precipitation during the growing season alters the landscape to increase habitat quality for lesser
prairie-chickens, relative to drought years. This increase in habitat quality could increase the
perspective of available habitat on the landscape by lesser prairie-chickens, as well as increase
functional connectivity (Hodgson et al. 2011). Additional years of data for the nonbreeding
season may determine whether this pattern of increasing home range size with increasing habitat
quality remains consistent. While home range size may be different in years with different
amounts of precipitation, yearly differences in home range size did not have an effect on survival
of nonbreeding lesser prairie-chickens (Chapter I). As increased home range size during the
nonbreeding season does not decrease survival or coincide with differences among ecoregions,
seasons with more movement could allow for the potential colonization of new habitat; thus,
increasing the probability of population persistence.
Nonbreeding season space use is understudied in other species of prairie-grouse, with
only a single study that explicitly estimated nonbreeding home range size (Winder et al. 2014).
The estimated nonbreeding season home ranges using VHF transmitters for greater prairie-
chickens (Tympanuchus cupido) in eastern Kansas were 7.1-7.8 km2 (710-780 ha; Winder et al.
2014). These home range estimates are 148% larger than my VHF estimates of home range size;
however, a direct comparison cannot be made between the studies, due to the lack of SAT-PTT

60
individuals in Winder et al. (2014). They reported that home range size increased with
increasing levels of fragmentation: however, I did not find mean home range differences between
study sites with differing levels of relative fragmentation (Chapter III).
Contrary to my prediction, home range size did not differ between males and females for
the nonbreeding season. Lesser prairie-chickens congregate into mixed sex wintering flocks after
the breeding season (Riley et al. 1993), which could lead to males and females moving in a
similar fashion. However, despite the similarity in home range size, intensity of space use within
home ranges in relation to leks differed between males and females. Differential space use
between sexes was likely due to the tendency of males to use leks more often throughout the
year. For example, males visited leks during the months of September and October, when the
photoperiod was similar to that of the photoperiod in the spring lekking season, and will move
back to leks in late February (Applegate and Riley 1998).
Overall, lesser prairie-chickens used space in their home range closer to leks than areas
within their home range that were further away from leks throughout the nonbreeding season. A
relationship with leks would be expected for the breeding season, when lesser prairie-chickens
are all visiting leks for reproductive purposes. Nonbreeding season use of space around leks
could be explained by leks forming in areas where females are already most likely to be located,
due to higher quality nesting and brooding habitat (Schroeder and White 1992, Gibson 1996). If
leks are already placed in the highest quality available habitat for lesser prairie-chickens, then
there would be little reason for males or females to leave the vicinity of the lek during the
nonbreeding season. Such a relationship for the nonbreeding season was unexpected, adding
increasing evidence that landscapes around existing leks should be prioritized for conservation
and mitigation. The notion of lek importance is already well understood for breeding lesser
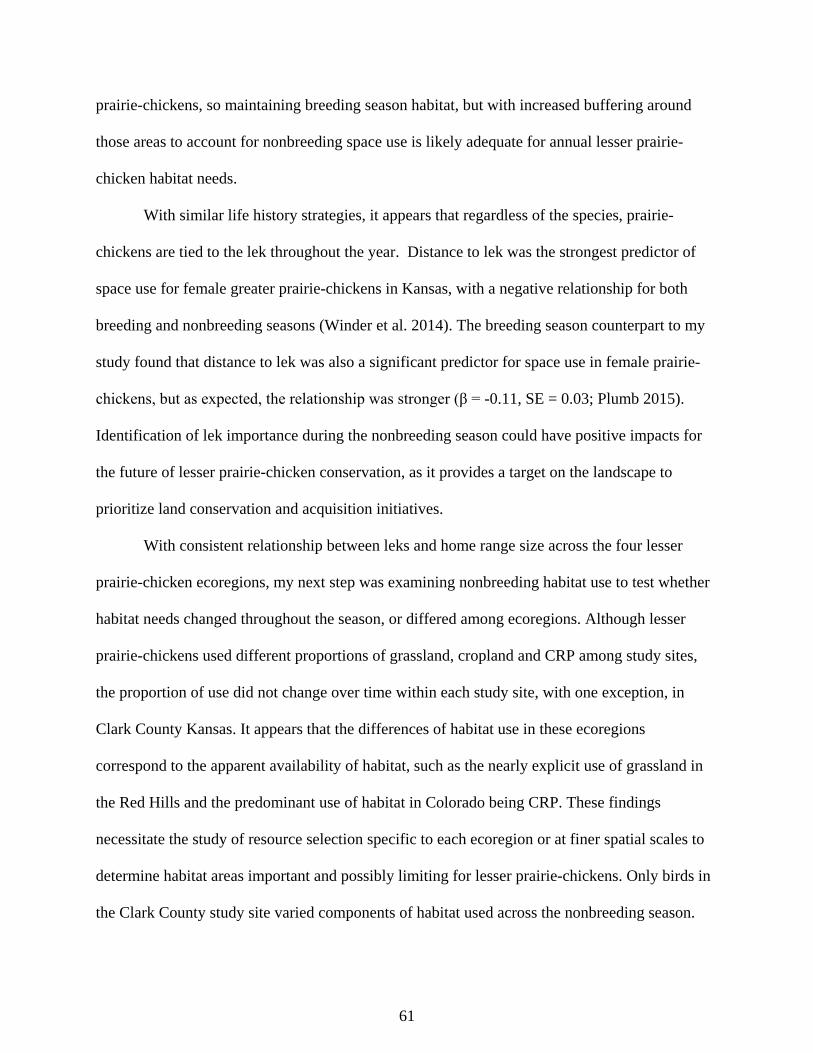
61
prairie-chickens, so maintaining breeding season habitat, but with increased buffering around
those areas to account for nonbreeding space use is likely adequate for annual lesser prairie-
chicken habitat needs.
With similar life history strategies, it appears that regardless of the species, prairie-
chickens are tied to the lek throughout the year. Distance to lek was the strongest predictor of
space use for female greater prairie-chickens in Kansas, with a negative relationship for both
breeding and nonbreeding seasons (Winder et al. 2014). The breeding season counterpart to my
study found that distance to lek was also a significant predictor for space use in female prairie-
chickens, but as expected, the relationship was stronger (β = -0.11, SE = 0.03; Plumb 2015).
Identification of lek importance during the nonbreeding season could have positive impacts for
the future of lesser prairie-chicken conservation, as it provides a target on the landscape to
prioritize land conservation and acquisition initiatives.
With consistent relationship between leks and home range size across the four lesser
prairie-chicken ecoregions, my next step was examining nonbreeding habitat use to test whether
habitat needs changed throughout the season, or differed among ecoregions. Although lesser
prairie-chickens used different proportions of grassland, cropland and CRP among study sites,
the proportion of use did not change over time within each study site, with one exception, in
Clark County Kansas. It appears that the differences of habitat use in these ecoregions
correspond to the apparent availability of habitat, such as the nearly explicit use of grassland in
the Red Hills and the predominant use of habitat in Colorado being CRP. These findings
necessitate the study of resource selection specific to each ecoregion or at finer spatial scales to
determine habitat areas important and possibly limiting for lesser prairie-chickens. Only birds in
the Clark County study site varied components of habitat used across the nonbreeding season.

62
The Clark County study site also exhibited increased mean weekly movement relative to the
other study sites (Table A.1). However, home range size in Clark County was not significantly
different from other sites, and despite not using space close to leks within their home range. If
bird density is greater in this region, it could explain the use of space away from leks and the
change in habitat use, as a spillover effect from the prime habitat surrounding leks, but this
possibility would need to be tested by estimating lesser prairie-chicken density among study
sites. Alternatively, the trend with decreased habitat use of grassland may correspond to a
decrease of habitat quality around the leks, which would lead birds to require cropland and CRP
to meet their cover and food requirements. I only had one year of data from this site for the
purpose of this analysis, and an additional year of data could determine that differences are not
as apparent as these initial results suggest.
If the Clark County, Kansas, study site is considered an outlier in regards to nonbreeding
lesser prairie-chicken space and habitat use, we see consistency among lesser prairie-chickens in
all ecoregions. My data fill knowledge gaps in relation to habitat use and space use for
nonbreeding lesser prairie-chickens, which can be used in the future to inform managers how to
assimilate nonbreeding ecology into overall management objectives. Future researchers need to
consider availability in relation to use to determine how important habitat types across the
different ecoregions.
Management Implications Management should be taking into account nonbreeding or annual home range size
estimates, not just breeding season, when trying to determine the proper amount of space
required for a sustainable lesser prairie-chicken population. Future habitat management should
focus on preserving habitat around leks to maintaining habitat quality sufficient for lek
placement. Past recommendations of area around leks required for lek persistence were ≥2000 ha

63
tracts of grassland (Hagen et al. 2004); this area recommendation fits with my results to conserve
existing habitat around leks. If these areas are already conserved, acquiring and improving
habitat outward from lek locations will aid in the functional connectivity of the landscape and aid
in future population persistence. Specific habitat requirements need to be developed by
ecoregion to realistically and more beneficially manage for lesser prairie-chicken habitat in the
future, such as keeping CRP available to birds in the Shortgrass/CRP Prairie, Sand Sagebrush
and Shinnery Oak Prairies, but contiguous grassland patches in the Mixed-Grass prairie.
Literature Cited
Ahlborn, G. G. 1980. Brood-rearing habitat and fall-winter movements of lesser prairie chickens in eastern New Mexico. Thesis, New Mexico State University, Las Cruces, USA.
Applegate, R. D. and T. Z. Riley. 1998. Lesser prairie-chicken management. Rangelands 20:13-
15. Askins, R. A., F. Chávez-Ramírez, B. C. Dale, C. A. Haas, J. R. Herkert, F. L. Knopf and P. D.
Vickery. 2007. Conservation of grassland birds in North America: Understanding ecological processes in different regions: “Report of the AOU Committee on Conservation”. Ornithological Monographs. 64:1-46.
Bedrosian, B., and Craighead, D. J. 2010. Solar powered GPS transmitter use on sage-grouse:
methods of attachment, influences on survival, and success rate of the transmitters. Unpublished report at:< http://www. fs. fed. us/td/programs/im/satellite_gps_telemetry/_assets/Grouse% 20GPS% 20Attachment_Craighead, 20.> Accessed 30 June 2015.
Brennan, L. A., and W. P. Kuvlesky, JR. 2005. North American grassland birds: an unfolding
conservation crisis? Journal of Wildlife Management 69:1-13. Bullard, F. 1991. Estimating the home range of an animal: a Brownian bridge approach.
Dissertation, the University of North Carolina, Chapel Hill, USA. Calenge, C. 2006. The package adehabitat for the R software: a tool for the analysis of space and
habitat use by animals. Ecological Modelling 197:516-519. Candelaria, M. A. 1979. Movements and habitat-use by lesser prairie chickens. Thesis, New
Mexico State University, Las Cruces, USA.
64
Copelin, F. F. 1963. The lesser prairie chicken in Oklahoma. Oklahoma Wildlife Conservation
Department Technical Bulletin 6, Oklahoma City, Oklahoma. Delisle, J. M., and J. A. Savidge. 1997. Avian use and vegetation characteristics of conservation
reserve program fields. Journal of Wildlife Management 61:318-325. Dzialak, M. R., C. V. Olson, S. M. Harju, S. L. Webb, J. P. Mudd, J. B. Winstead, and L.
Hayden-Wing. 2011. Identifying and prioritizing greater sage-grouse nesting and broodrearing habitat for conservation in human-modified landscapes. PloS One 6(10). DOI: 10.1371/journal.pone.0026273
Fields, T. L. 2004. Breeding season habitat use of conservation reserve program (CRP) land by
lesser prairie-chickens in west central Kansas. Thesis, Colorado State University, Fort Collins, USA.
Gibson, R. M. 1996. A re-evaluation of hotspot settlement in lekking sage grouse. Animal
Behaviour 52:993-1005. Giesen, K. M. 1994. Movements and nesting habitat of lesser prairie-chicken hens in Colorado.
Southwestern Naturalist 39:96-98. Grisham B. A. 2012. The ecology of lesser prairie-chickens in shinnery oak-grassland
communities in New Mexico and Texas with implications toward habitat management and future climate change. Dissertation, Texas Tech University, Lubbock, USA.
Hagen, C. A., B. E. Jamison, K. M. Giesen, and T. Z. Riley. 2004. Guidelines for managing
lesser prairie-chicken populations and their habitats. Wildlife Society Bulletin 32:69-82. Hagen, C. A., and K. M. Giesen. 2005. Lesser Prairie-Chicken (Tympanuchus pallidicinctus). in
A. Poole, editor. The birds of North America. Ithaca: Cornell Lab of Ornithology; Retrieved from the birds of North America Online: http://bna.birds.cornell.edu/bna/species/364doi:10.2173/bna.364
Handcock, M. S. 2007. Estimates of the resource utilization function. <http://CRAN.R-
project.org/package=RUF>. Haukos, D. A., L. M. Smith, and G. S. Broda. 1990. Spring trapping of lesser prairie-chickens.
Journal of Field Ornithology 61:20-25. Haukos, D.A., and J. C. Zavaleta 2016. Habitat. In Press In D. A. Haukos and C. W. Boal,
editors. Ecology and Conservation of Lesser Prairie-Chickens. Studies in Avian Biology. CRC Press, Boca Raton, Florida, USA.

65
Hodgson, J. A., A. Moilanen, B. A. Wintle, and C. D. Thomas. 2011. Habitat area, quality and connectivity: striking the balance for efficient conservation. Journal of Applied Ecology 48:148-152.
Horne, J. S., E. O. Garton, S. M. Krone, and J. S. Lewis. 2007. Analyzing animal movements
using Brownian bridges. Ecology 88:2354-2363. Jamison, B. E. 2000. Lesser prairie-chicken survival, adult survival, and habitat selection and
movements of males in fragmented rangelands of southwestern Kansas. Thesis, Kansas State University, Manhattan, USA.
Jones, R. E. 1964. The specific distinctness of the greater and lesser prairie-chickens. Auk 81:65-
73. Jones, R. S. 2009. Seasonal survival, reproduction, and use of wildfire areas by lesser prairie
chickens in the northeastern Texas Panhandle. Thesis, Texas A&M University, College Station, USA.
Kertson, B. N., and J. M. Marzluff. 2011. Improving studies of resource selection by
understanding resource use. Environmental Conservation 38:18-27. KState Research and Extension. 2015. Weather Data Library. <https://www.ksre.ksu.edu/wdl/>.
Accessed 15 Jun 2015. Kukal, C. A. 2010. The over-winter ecology of lesser prairie-chickens (Tympanuchus
pallidicinctus) in the northeast Texas Panhandle. Thesis, Texas Tech University, Lubbock, USA
Lauver, C. L., K. Kindscher, D. Faber-Langendoen, and R. Schneider. 1999. A classification of
the natural vegetation of Kansas. Southwestern Naturalist 44:421-443. Lyons, E. K., B. A. Collier, N. J. Silvy, R. R. Lopez, B. E. Toole, R. S. Jones and S. J. DeMaso.
2009. Breeding and non-breeding survival of lesser prairie-chickens Tympanuchus pallidicinctus in Texas, USA. Wildlife Biology 15:89-96.
Marzluff, J. M., J. J. Millspaugh, P. Hurvitz, and M. S. Handcock. 2004. Relating resources to a
probabilistic measure of space use: forest fragments and Steller’s jays. Ecological Society of America 85:1411-1427.
McDonald, L., G. Beauprez, G. Gardner, J. Griswold, C. Hagen, F. Hornsby, D. Klute, S. Kyle,
J. Pitman, T. Rintz, D. Schoeling, and B. Van Pelt. 2014. Range-wide population size of the lesser prairie-chicken: 2012 and 2013. Wildlife Society Bulletin 38:536-546.
McLachlan, M. 2012. Playa Lakes Joint Venture landcover accuracy assessment report. Playa Lakes Joint Venture. Lafayette, CO, USA.

66
Mitchell, M. S., and R. A. Powell. 2004. A mechanistic home range model for optimal use of spatially distributed resources. Ecological Modelling 177:209-232.
Norris, D. R., and P. P. Marra. 2007. Seasonal interactions, habitat quality and population
dynamics in migratory birds. Condor 109:535-547. Pirius, N. E. 2011. The non-breeding ecology of lesser prairie-chickens (Tympanuchus
pallidicinctus) in the southern high plains of Texas. Texas Tech University, Texas Tech Unversity, Lubbock, USA.
Playa Lakes Joint Venture. 2009. PLJV Implementation Planning Guide and PLJV Landcover
Layer. Playa Lakes Joint Venture. Lafayette, CO, USA. Plumb, R. T. 2015. Lesser prairie-chicken movement, space use, survival, and response to
anthropogenic structures in Kansas and Colorado. Thesis, Kansas State University, Manhattan, USA.
Powell, R. A. 2000. Animal home ranges and territories and home range estimators. L. Boitani
and T. K. Fuller, editors. Research Techniques in Animal Ecology: Controversies and Consequences. Columbia University Press, New York.
Powell, R. A., and M. S. Mitchell. 2012. What is a home range? Journal of Mammalogy 93:948-
958. Pressey, R. L., M. Cabeza, M. E. Watts, R. M. Cowling and K. A. Wilson. 2007. Conservation
planning in a changing world. Trends in Ecology and Evolution 22:583-592. Pruett, C. L., M.A. Patten and D. H. Wolfe. 2009. It’s not easy being green: wind energy and a
declining grassland bird. Bioscience 59:257-262. R Core Team. 2014. R: A Language and Environment for Statistical Computing. R Foundation
for Statistical Computing 3.1.1 <http://www.R-project.org/>. Riley, T. Z., C. A. Davis, and R. A. Smith. 1993. Autumn-winter habitat use of lesser prairie-
chickens (Typanuchus pallidicinctus, tetraonidae). Great Basin Naturalist 53:409-411. Rodgers, R. D. 2016. A History of Lesser Prairie-Chickens. In Press In D. A. Haukos and C. W.
Boal, editors. Ecology and Conservation of Lesser Prairie-Chickens. Studies in Avian Biology. CRC Press, Boca Raton, Florida.
Samson, F., and F. Knopf. 1994. Prairie conservation in North America. Bioscience 6:418-421. Sanderson, E. W., K. H. Redford, A. Vedder, P. B. Coppolillo, and S. E. Ward. 2002. A
conceptual model for conservation planning based on landscape species requirements. Landscape and Urban Planning 58:41-56.
67
Schroeder, M. A., and C. E. Braun. 1991. Walk-in traps for capturing greater prairie-chickens on leks. Journal of Field Ornithology 62:378-385.
Schroeder, M. A., and G. C. White. 1992. Dispersion of greater prairie chicken nests in relation
to lek location: evaluation of the hot-spot hypothesis of lek evolution. Behavioral Ecology 4:266-270.
Seaman, D. E., J. J. Millspaugh, B. J. Kernohan, G. C. Brundige, K. J. Raedeke, and R. A.
Gitzen. 1999. Effects of sample size on kernel home range estimates. Journal of Wildlife Management 63:739-747.
Silvy, N., M. Morrow, E. Shanley, and R. Slack. 1990. An improved drop net for capturing
wildlife. Proceedings of the Annual Conference of the Southeastern Association of Fish and Wildlife Agencies 44:374-378.
Spencer, D. A. 2014. A historical record of land cover change of the lesser prairie-chicken range
in Kansas. Thesis, Kansas State University, Manhattan, USA. Taylor, M. A. 1978. Fall and winter movements and habitat use of lesser prairie chickens.
Thesis, Texas Tech University, Lubbock, USA. Taylor, M. A., and F. S. Guthery. 1980. Status, Ecology and Management of the Lesser Prairie
Chicken. US For. Serv. Gen. Tech. Rep. RM-77. Rocky Mountain Forest and Range Experiment Station, Fort Collins, Colorado, USA.
Trenberth K. E., A. Dai, G. van der Schrier, P. D. Jones, J. Barichivich, K. R. Briffa and J.
Sheffield. 2014. Global warming and changes in drought. Nature Climate Change 4:17–22.
USFWS. 2014. Endangered and threatened wildlife and plants; determination of threatened
status for the lesser prairie-chicken. Federal Register 79:19974-20071. Van Winkle, W. 1975. Comparison of several probabilistic home-range models. Journal of
Wildlife Management 39:118-123. Walter, W. D., J. W. Fischer, S. Baruch-Mordo, and K. C. Vercauteren. 2011. What is the proper
method to delineate home range of an animal using today’s advanced GPS telemetry systems: the initial step. USDA National Wildlife Research Center - Staff Publications. Paper 1375.
Walter, W. D., D. P. Onorado and J. W. Fischer. 2015. Is there a single best estimator? Selection
of home range estimators using area-under-the-curve. Movement Ecology DOI 10.1186/s40462-015-0039-4.

68
Winder, V. L., L. B. McNew, A. J. Gregory, L. M. Hunt, S. M. Wisely, and B. K. Sandercock. 2014. Space use by female greater prairie-chickens in response to wind energy development. Ecosphere 5(1): doi:10.1890/ES13-00206.1
Woodward, A. J. W., S. D. Fuhlendorf, D. M. Leslie and J. Shackford. 2001. Influence of
landscape composition and change on lesser prairie-chicken (Tympanuchus pallidicinctus) populations. American Midland Naturalist 145:261-274.
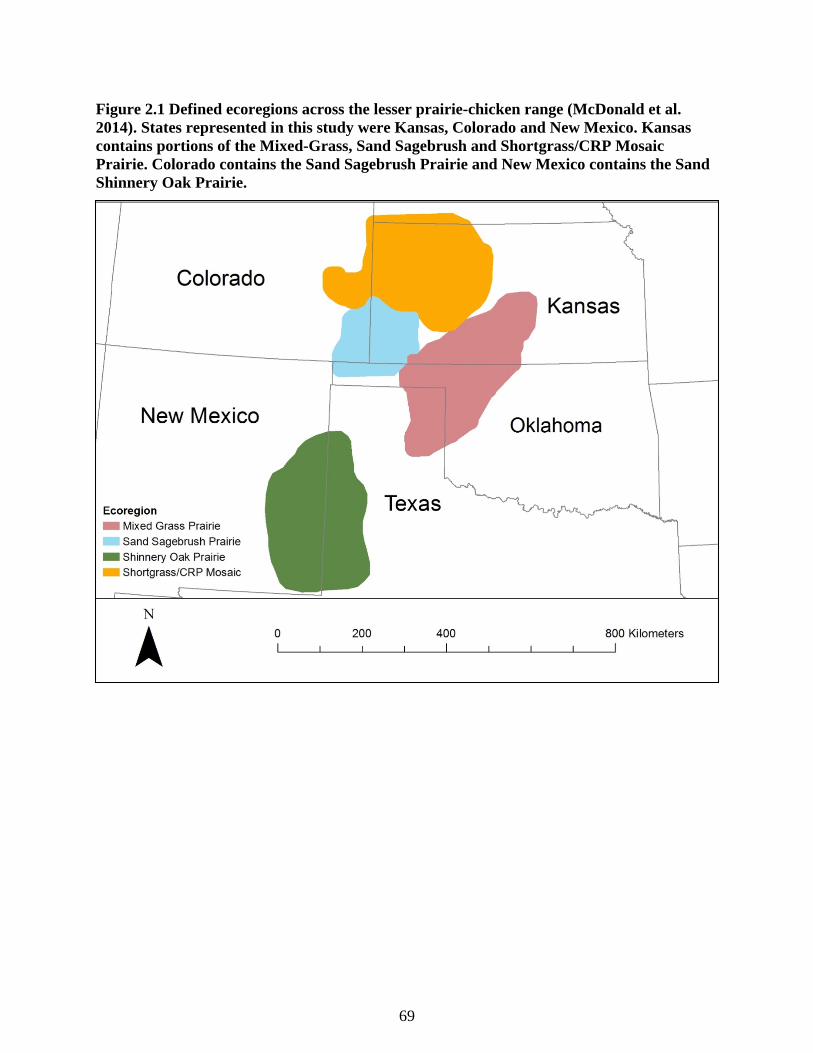
69
Figure 2.1 Defined ecoregions across the lesser prairie-chicken range (McDonald et al. 2014). States represented in this study were Kansas, Colorado and New Mexico. Kansas contains portions of the Mixed-Grass, Sand Sagebrush and Shortgrass/CRP Mosaic Prairie. Colorado contains the Sand Sagebrush Prairie and New Mexico contains the Sand Shinnery Oak Prairie.

70
Figure 2.2 Map of study sites across the current lesser prairie-chicken range (shown in light blue). The Kansas study sites (Northwest, Clark, Red Hills; shown in blue) were located in Logan, Gove, Kiowa, Comanche and Clark counties. The Colorado study sites were primarily located in Prowers and Baca counties (shown in purple) and the New Mexico study site was located in Lea and Roosevelt counties (shown in orange).

71
Figure 2.3 Examples of home ranges of two lesser prairie-chickens representing differential space use within their home ranges relative to lek locations. Darker areas indicate areas with greater intensity of space use, with the white area indicating the 99% isopleth, or “available” space.
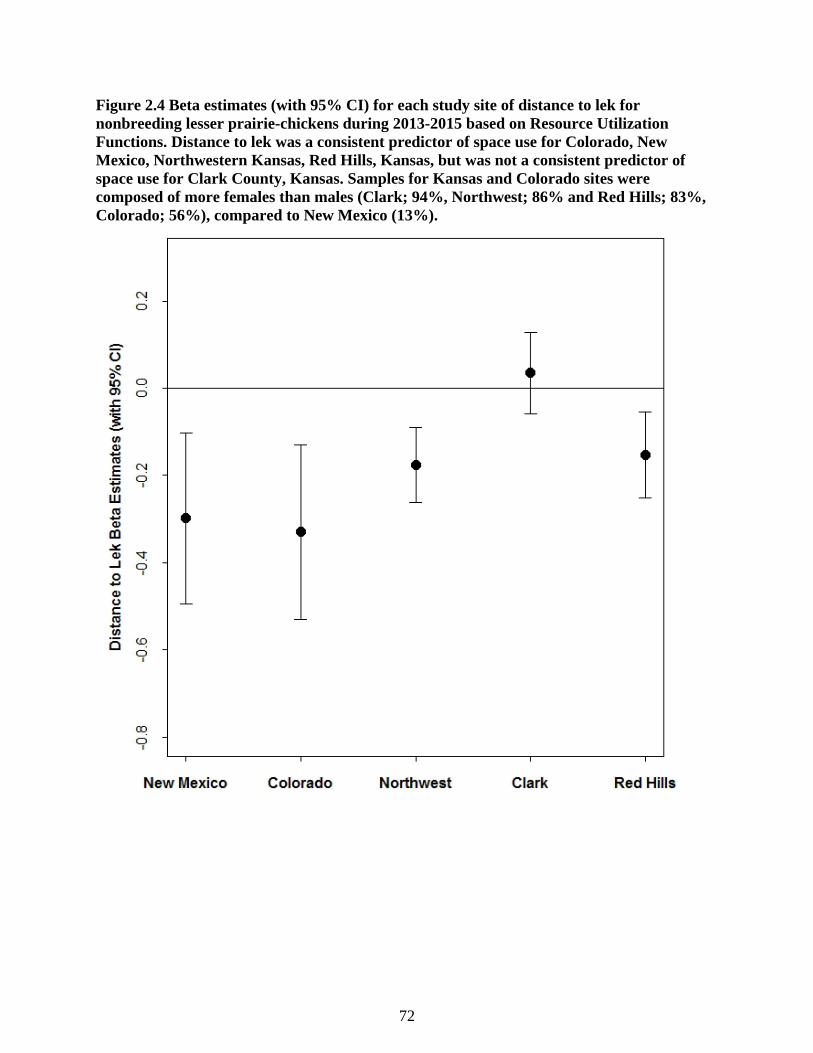
72
Figure 2.4 Beta estimates (with 95% CI) for each study site of distance to lek for nonbreeding lesser prairie-chickens during 2013-2015 based on Resource Utilization Functions. Distance to lek was a consistent predictor of space use for Colorado, New Mexico, Northwestern Kansas, Red Hills, Kansas, but was not a consistent predictor of space use for Clark County, Kansas. Samples for Kansas and Colorado sites were composed of more females than males (Clark; 94%, Northwest; 86% and Red Hills; 83%, Colorado; 56%), compared to New Mexico (13%).

73
Figure 2.5 Monthly beta estimates (with 95% CI) for distance to lek for all nonbreeding lesser prairie-chicken in Kansas, Colorado and New Mexico during 2013-2015. Distance to lek was a significant predictor of space use in the months of October, December, January and February, but November had a confidence interval overlapping zero, indicating it was not a significant predictor of space use during that month. Sample sizes are primarily (77%) composed of female lesser prairie-chickens.

74
Figure 2.6 Monthly beta estimates for all sites for distance to lek as a predictor of lesser prairie-chicken space use during 2013-2015 for a) New Mexico, b) Colorado, c) Northwest, Kansas, d) Clark County, Kansas, and e) Red Hills, Kansas. Beta estimates were considered significant predictors of space use if their CI did not overlap zero. No differences were observed among months, within study sites. Samples for Kansas and Colorado sites were composed of more females than males (Clark; 94%, Northwest; 86% and Red Hills; 83%, Colorado; 56%), compared to New Mexico (13%).
b a
c d
e

75
Figure 2.7 Proportion of habitat composition used by lesser prairie-chickens across months for all sites during the nonbreeding seasons of 2013-2014 and 2014-2015 for Colorado, Northwest and Red Hills, and just for the nonbreeding season of 2014-2015 for New Mexico and Clark. Trends indicate a decrease in use of grassland, corresponding to an increase in use of crop and Conservation Reserve Program (CRP) fields for Clark County, but not any other site.

76
Figure 2.8 Total precipitation levels in during the growing season (April through September) for 2013 and 2014 across 5 study sites in Kansas, Colorado and New Mexico.
New Mexico Colorado Northwest Clark Red Hills
Tota
l Gro
win
g Se
ason
Pre
cipi
tatio
n (c
m)
0
10
20
30
40
5020132014
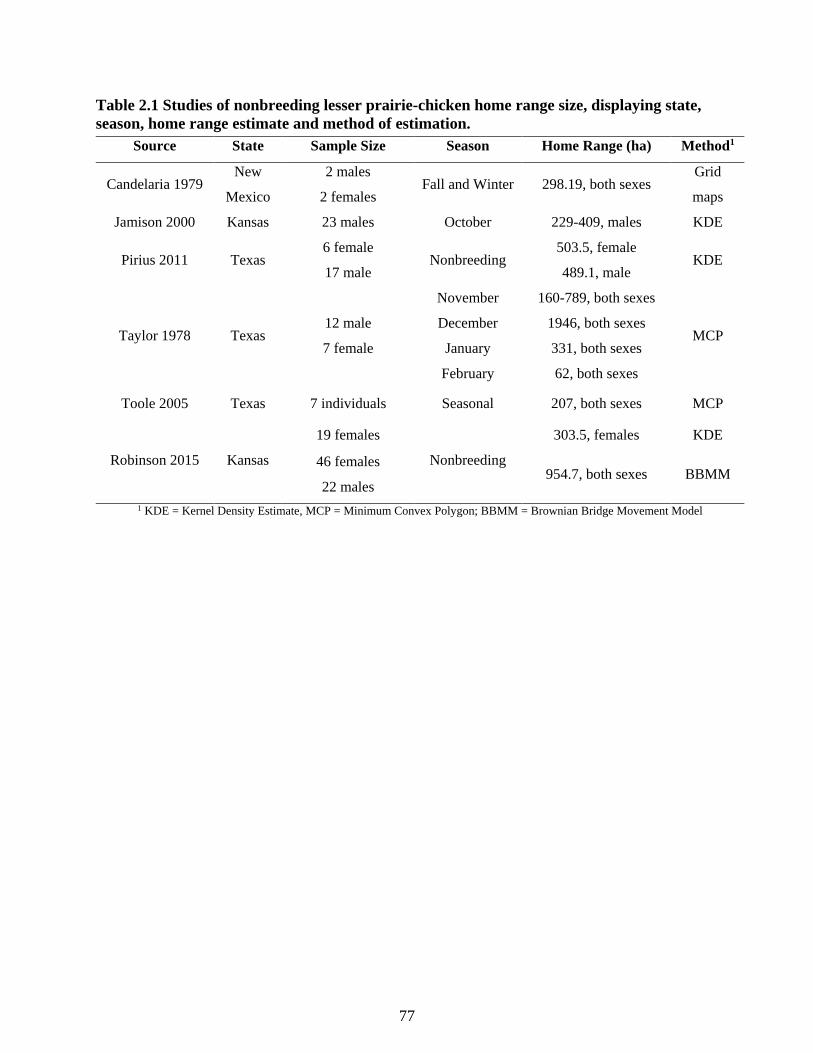
77
Table 2.1 Studies of nonbreeding lesser prairie-chicken home range size, displaying state, season, home range estimate and method of estimation.
Source State Sample Size Season Home Range (ha) Method1
Candelaria 1979 New
Mexico
2 males
2 females Fall and Winter 298.19, both sexes
Grid
maps
Jamison 2000 Kansas 23 males October 229-409, males KDE
Pirius 2011 Texas 6 female
17 male Nonbreeding
503.5, female
489.1, male KDE
Taylor 1978 Texas 12 male
7 female
November 160-789, both sexes
MCP December 1946, both sexes
January 331, both sexes
February 62, both sexes
Toole 2005 Texas 7 individuals Seasonal 207, both sexes MCP
Robinson 2015 Kansas
19 females
Nonbreeding
303.5, females KDE
46 females
22 males 954.7, both sexes BBMM
1 KDE = Kernel Density Estimate, MCP = Minimum Convex Polygon; BBMM = Brownian Bridge Movement Model

78
Table 2.2 Total number of Males (F) and Females (F), as well as SAT-PTT (SAT) and VHF marked lesser prairie-chickens during each year, used to estimate home range size for five sites in Kansas, Colorado and New Mexico, and two nonbreeding seasons (2013-2014, 2014-2014) Kansas study sites include Northwest, Red Hills and Clark County, with one site each in Colorado and New Mexico. Individuals were included in the overall home range estimation if they did not disperse outside of the delineated study site and survived at least 2 weeks into the nonbreeding season. Study Site 2013-2014 2014-2015 M F SAT VHF Total M F SAT VHF Total Northwest 2 15 12 5 17 3 11 10 4 14 Red Hills 3 11 11 3 14 2 9 8 3 11 Clark Co. - - - - - 1 13 10 4 14 Colorado 2 4 6 - 6 2 1 3 - 3 New Mexico - - - - - 7 1 8 - 8 Total 37 50
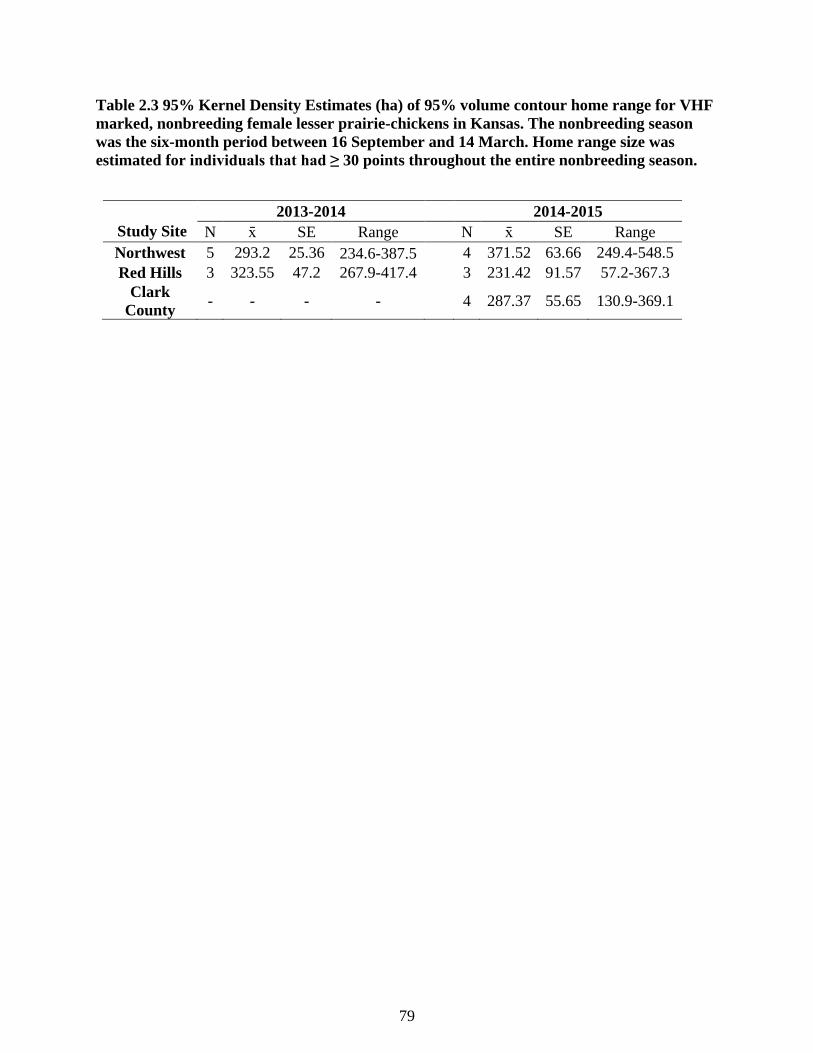
79
Table 2.3 95% Kernel Density Estimates (ha) of 95% volume contour home range for VHF marked, nonbreeding female lesser prairie-chickens in Kansas. The nonbreeding season was the six-month period between 16 September and 14 March. Home range size was estimated for individuals that had ≥ 30 points throughout the entire nonbreeding season.
2013-2014 2014-2015 Study Site N x̄ SE Range N x̄ SE Range Northwest 5 293.2 25.36 234.6-387.5 4 371.52 63.66 249.4-548.5 Red Hills 3 323.55 47.2 267.9-417.4 3 231.42 91.57 57.2-367.3
Clark County - - - - 4 287.37 55.65 130.9-369.1
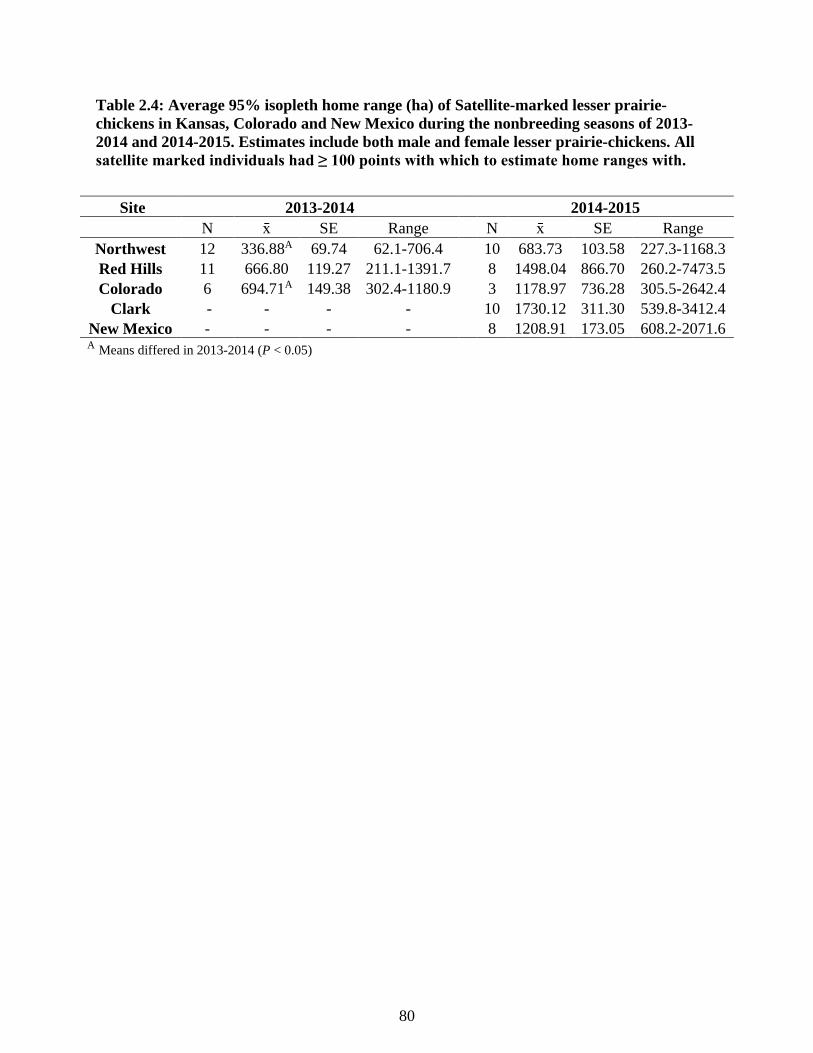
80
Table 2.4: Average 95% isopleth home range (ha) of Satellite-marked lesser prairie-chickens in Kansas, Colorado and New Mexico during the nonbreeding seasons of 2013-2014 and 2014-2015. Estimates include both male and female lesser prairie-chickens. All satellite marked individuals had ≥ 100 points with which to estimate home ranges with.
Site 2013-2014 2014-2015 N x̄ SE Range N x̄ SE Range
Northwest 12 336.88A 69.74 62.1-706.4 10 683.73 103.58 227.3-1168.3 Red Hills 11 666.80 119.27 211.1-1391.7 8 1498.04 866.70 260.2-7473.5 Colorado 6 694.71A 149.38 302.4-1180.9 3 1178.97 736.28 305.5-2642.4
Clark - - - - 10 1730.12 311.30 539.8-3412.4 New Mexico - - - - 8 1208.91 173.05 608.2-2071.6 A Means differed in 2013-2014 (P < 0.05)

81
Table 2.5 Monthly home range estimates for satellite marked male and female lesser prairie-chickens in Kansas, Colorado and New Mexico, that had ≥ 100 points available within a whole months. Home ranges were estimated using Brownian Bridge movement models.
Month Number of Bird-Months Mean SE
October 63 703.0 174.4 November 61 674.4 108.2 December 58 596.0 77.6 January 52 449.6 51.8 February 51 546.2 68.4
Total 285 600.8 50.1

82
Table 2.6 Results from simple linear regression assessing trends of habitat use for nonbreeding lesser prairie-chickens in three study site in Kansas (Northwest, Red Hills, and Clark County), Colorado, and New Mexico during 2013 – 2015.
Site Habitat Type r2 ≤ F1,5 ≤ P ≤ Northwest Grassland 0.26 1.78 0.24
CRP 0.48 4.67 0.083 Crop 0.02 0.1 0.76
Red Hills Grassland 0.038 0.2 0.68 CRP 0.64 8.74 0.032* Crop 0.001 0.001 0.98
Clark County Grassland 0.86 31.45 0.0025** CRP 0.9 46.16 0.0011** Crop 0.72 12.92 0.016*
Colorado Grassland 0.012 0.063 0.81 CRP 0.012 0.062 0.81 Crop 0.001 0.001 0.99
New Mexico Grassland 0.064 0.34 0.58 CRP 0.12 0.69 0.45 Crop 0.0012 0.006 0.94

83
Chapter 3 - Effects of landscape characteristics on survival of female lesser prairie-chickens
Introduction
Settlement of the Southern Great Plains by early pioneers caused wide-spread change of
grassland landscapes (Coppedge et al. 2001). Landscape fragmentation in the plains, namely loss
of grasslands with an increase in grassland patch isolation (Fahrig 2003), has resulted from direct
conversion of land from native prairie to agriculture uses, such as row-cropping or livestock
grazing, but has also been caused by the addition of anthropogenic objects on the landscape.
Power lines, fences and infrastructure of oil and gas can affect species distribution and space use
by creating barriers to movement, discrete area of species avoidance, and creating new places for
predators to traverse and perceive the landscape (Robel et al. 2004, Pruett et al. 2009). With a
growing demand for energy, food, and infrastructure as the human population grows, impacts on
grassland species are going to increase through the addition of anthropogenic features and
changes in landscape structure.
Lesser prairie-chickens (Tympanuchus pallidicinctus) are an umbrella species in
grasslands for which conservation could be beneficial to many species on the landscape. This
species is able to traverse large areas of the landscape, and requires a heterogeneous landscape
configuration with varying habitat characteristics for nesting, brooding, cover, and foraging
(Fuhlendorf and Engle 2001). Lesser prairie-chickens have experienced population declines
since the settlement of the Southern Great Plains in the late 1800s, with the most recent
population peak in the 1980s, and additional sharp declines documented since 2012 (McDonald
et al. 2014,Garton et al. 2016). Declines of lesser prairie-chickens have been attributed to large-
scale conversion of grassland to crops, drought, and increase in energy infrastructure across the
landscape (Hagen and Giesen 2005). Quantifying the effect of variations in habitat amount,

84
habitat configuration, and anthropogenic features on the landscape is necessary to further
understand factors driving population declines. Lesser prairie-chickens in Kansas and Colorado
persist in three ecoregions with distinct soil and vegetative characteristics and varying degrees of
perceptual fragmentation (McDonald et al. 2014). The existence of populations of birds in
landscapes with different patterns of configuration, and variable amounts of habitat loss, can
allow for an assessment of population vital rates as a function of landscape fragmentation and
configuration.
Studies in landscape ecology predict the existence of a threshold at which habitat loss is
too great for populations to persist (Fahrig and Marriam 1985, Fahrig 2001, Fahrig 2003). The
response of population persistence to habitat loss needs to be considered on a species-basis, as
the specific mechanisms of a species life-history that would dictate responses to fragmentation
(Dooley and Bowers 1998). As populations begin to reach this threshold, it would be expected
that vital rates of populations would begin to decline as a warning sign of the approaching
population decline and eventual extinction. For example, if mortality outweighs reproduction due
to lack of available habitat, populations will inevitably decline (Fahrig 2002). Changes in
population dynamics can be driven by the configuration of the landscape, composition of the
landscape, and heterogeneity of the impacts of anthropogenic features on the landscape.
However, to understand the influence on these processes, habitat loss and habitat fragmentation
need to be measured and interpreted separately, as fragmentation impacts may be less influential
relative to habitat loss (Fahrig 2003). We need to understand the processes that affect this
threshold and potential localized extinction that can occur once it is reached. Additionally, the
relationships among population dynamics and landscape effects need to be identified at multiple
scales, from the effect on individuals to effects on populations (Fahrig and Marriam 1985,

85
Dooley and Bowers 1998). If relationships exist among lesser prairie-chicken vital rates and
landscape structure, understanding the direct and indirect drivers of these relationships can also
assist mitigation to target areas on the landscape for habitat mitigation (Fahrig 2002).
Habitat loss, increased patch isolation and anthropogenic development, have the potential
to negatively affect lesser prairie-chicken females through several mechanisms, such as an
increase in edge habitat between habitat types increasing predator occupancy and increased
barriers to movement away from areas lacking key survival requirements (Patten et al. 2005).
Energy development also has the potential to increase stress and reduce body condition in upland
game birds; thus, reducing survival and future reproductive output (Lima 1986, Blickley et al.
2012). Past studies have determined patterns of avoidance of power lines, buildings, and, to a
lesser extent, paved roads and oil wells by lesser prairie-chickens (Hagen et al. 2011).
Thresholds have also been identified for habitat selection around anthropogenic landscape
features (Plumb 2015). The effect of landscape change on the persistence of leks and overall
population growth has been addressed indicating that increasing landscape fragmentation
decreases the probability of lek persistence (Woodward et al. 2001). To my knowledge, studies
have not yet investigated the relationship between landscape change and lesser prairie-chicken
survival.
Survival rates of female lesser prairie-chickens have been identified as having one of the
greatest effects on the finite rate of population change in Kansas (Hagen et al. 2009). A study of
greater sage-grouse (Centrocercus urophasianus) found that there was a negative association
between female survival and powerline density (Dinkins et al. 2014). Fences and powerlines
could also decrease lesser prairie-chickens survival through their availability as perches for avian
predators. Although seasonal variation in raptor abundance from a one year study did not directly
86
affect nonbreeding survival of female lesser prairie-chickens (Chapter I), the effect on survival
may be indirect, such as through increased abundance of raptor perches (Ellis 1984, Dinkins et
al. 2014). Noise from oil wells and roads could influence mortality due to increased sound
affecting body condition and foraging rates (Ware et al. 2015); roads could influence hazards
through direct mortality from car strikes (Case 1978). These relationships need to be investigated
for lesser prairie-chickens; thus, research designed to determine the effect of landscape features,
habitat composition and configuration on survival can help inform future management and
conservation actions. Using survival across the annual cycle of lesser prairie-chickens, from the
lekking through the nonbreeding seasons, will allow for a better understanding of the overall
effect that landscape characteristics can have on lesser prairie-chicken survival. This information
will be the first step in the design of an optimal landscape to maximize the lesser prairie-chickens
probability of population persistence.
My objectives were to 1) estimate annual lesser prairie-chicken survival and assess
differences in landscape composition and configuration among study sites in Kansas and
Colorado, 2) determine if landscape composition and configuration within home ranges have an
effect on lesser prairie-chicken survival rates, and 3) determine if distance to anthropogenic
features and landcover type influence lesser prairie-chicken hazard rates. I hypothesized that
annual survival rates will be lower for sites, and individuals with less grassland habitat, and a
more fragmented landcover configuration. I also expected to find that anthropogenic features that
can act as perches for predators (powerlines, fences, oil wells) will increase hazard rates for
female lesser prairie-chickens.

87
Study Area
Four study sites were located in three ecoregions across the range of lesser prairie-
chickens in Kansas and Colorado (Figure 3.1). In northwestern Kansas, lesser prairie-chickens
are found in the Short-Grass Prairie/Conservation Reserve Program (CRP) Mosaic Ecoregion
(Van Pelt et al. 2013, McDonald et al. 2014). This population of lesser prairie-chickens may
have recently expanded north of the Arkansas River (Bain 2002, Fields et al. 2006, Rodgers
2016). In south-central Kansas, lesser prairie-chickens are found in the Mixed-Grass Prairie and
Sand Sagebrush Prairie Ecoregions (Van Pelt et al. 2013, McDonald et al. 2014). The Short-
Grass/CRP, Mixed-Grass and Sand Sagebrush ecoregions were characterized by different soil
types, plant assemblages, management regimes, and vegetation conditions. The northwestern
Kansas study site consisted of private lands in Gove and Logan counties. Whereas, in south-
central Kansas, I had two study sites, which consisted of private lands in Kiowa, Comanche, and
Clark counties. The Colorado study site was primarily located in Cheyenne and Prowers
counties.
The northwestern Kansas study site was 171,437 ha, and located in Logan and Gove
Counties. The primary land uses in this area were livestock grazing, energy extraction, and both
dryland and row-crop agriculture. The northwestern study site was located in the Shortgrass
Prairie/Conservation Reserve Program (CRP) Mosaic Ecoregion (Van Pelt et al. 2013,
McDonald et al. 2014), with CRP grasslands and row-crop agriculture on silt-loam soils.
Dominant vegetation in the region included blue grama (Bouteloua gracilis), hairy grama (B.
hirsute), buffalograss (B. dactyloides), little bluestem (Schizachyrium scoparium), sideoats
grama (B. curtipendula), big bluestem (Andropogon gerardii), Illinois bundleflower
(Desmanthus illinoensis), prairie sunflower (Helianthus petiolaris), annual buckwheat

88
(Eriogonum annum), sand milkweed (Asclepias arenaria), nine-anther dalea (Dalea enneandra),
and western ragweed (Ambrosia psilostachya; Lauver et al. 1999). Mixed-grass prairie species
occurred on certain soil types. Grass species planted in CRP fields included little bluestem,
sideoats grama, big bluestem, switchgrass (Panicum virgatum), blue grama, buffalograss, and
Indian grass (Sorghastrum nutans) (Fields 2004). The CRP fields were interseeded with forbs in
the 1990s; forbs included white sweet clover (Melilotus alba), yellow sweet clover (Melilotus
officinalis), Maximillian sunflower (Helianthus maximiliani), Illinois bundleflower, purple
prairie clover (Dalea purpurea), and prairie coneflower (Ratibida columnifera; Fields 2004).
Wheat (Triticum aestivum), sorghum (Sorghum bicolor), and corn (Zea mays) were the major
crops in the region.
In south-central Kansas, I had two study sites in mixed-grass prairie on loamy soils. The
Red Hills, Kansas study site was 49,111 ha and centered on private lands in Kiowa and
Comanche counties within the Mixed-Grass Prairie Ecoregion (Van Pelt et al. 2013, McDonald
et al. 2014). Primary land uses for this area included livestock grazing, oil and gas extraction and
exploration, with row-crop agriculture interspersed throughout the region. Dominant vegetation
in south-central Kansas included little bluestem, blue grama, hairy grama, sideoats grama,
buffalograss, sand dropseed (Sporobolus cryptandrus), Louisiana sagewort (Artemisia
ludiviciana), western ragweed (Ambrosia psilostachya), sand sagebrush (Artemisia filiafolia),
and eastern red cedar (Juniperus virginiana; Lauver et al. 1999). The Clark County study site
within south-central Kansas was 71,209 ha and located at the boundary of the Mixed-Grass
Prairie and Sand Sagebrush Prairie Ecoregions (Van Pelt et al. 2013, McDonald et al. 2014).
Land use was dominated by livestock grazing, oil and gas extraction, and row-crop agriculture.
Dominant vegetation in the area included: little bluestem, sideoats grama, blue grama, hairy

89
grama, big bluestem, alkali sacaton (Sporobolous airoides), Russian thistle (Salsola kali), kochia
(Kochia scoparia), annual sunflower (Helianthus annuus), and sand sagebrush. The Clark
County site also had considerable alkali flats along drainages.
Within eastern Colorado, study sites were located on private lands in Cheyenne and
Prowers counties totaling 28,388 ha. All study sites were within the Sand Sagebrush Prairie
Ecoregion (Van Pelt et al. 2013, McDonald et al. 2014; Figure 1.1). Land use within the study
site was livestock grazing, row-crop agriculture, and CRP grasslands. Dominant vegetation in the
region included blue grama, hairy grama, sideoats grama, buffalograss, little bluestem, big
bluestem, sand sagebrush, kochia, and Russian thistle. Major crops within the region were wheat,
sorghum, and corn.
Methods
Capture Lesser prairie-chickens were captured at leks in spring (March – May) during 2013 and
2014. Birds were trapped using walk-in drift traps, magnetic dropnets, and rope-trigger dropnets
(Haukos et al. 1990, Silvy et al. 1990, Schroeder and Braun 1991). Captured individuals were
aged using the degree of spotting on the 9th and 10th primaries; second-year birds had spotting
within 3.8 cm from the feather tip and after-second-year birds had spotting ≥ 3.8 cm from the tip
(Copelin 1963). I also used the amount of wear of the feather tips as juvenile grouse do not molt
those primaries until their second year, and thus, have more frayed feather tips (Copelin 1963).
The sex of individuals was determined using tail feather color; females had barred tail feathers
and male lesser prairie-chickens had mainly black tail feathers (Copelin 1963).
Female lesser prairie-chickens were outfitted with either 12-15-g bib-style VHF
transmitters (A3960, Advanced Telemetry System, Isanti, USA) or a rump-mounted 22-g
Satellite Platform Transmitting Terminal GPS transmitter (PTT-100, Microwave Telemetry,
90
Columbia, USA). SAT-PTT transmitters were attached on the rump using leg harnesses made of
Teflon® ribbon with elastic at the front of the harness for flexibility (Bedrosian and Craighead
2010, Dzialak et al. 2011). All capture and handling procedures were approved by the Kansas
State University Institutional Animal Care and Use Committee (protocol 3241), Kansas
Department of Wildlife, Parks and Tourism scientific collection permits (SC-042-2013 and SC-
079-2014), and Colorado Parks and Wildlife scientific collection licenses (13TRb2053 and
14TRb205).
Tracking Female prairie-chickens outfitted with VHF transmitters were located via triangulation 3-
4 times per week. Once individuals were detected they were triangulated from 3-5 locations to
estimate location. A three-piece hand-held Yagi antenna and either an Advanced Telemetry
Systems Receiver (R4000, R4500, Advanced Telemetry Systems, Isanti, USA) or a
Communications Systems Receiver (R-1000, Communications Specialists, Orange, USA) were
used to take bearings on individuals. Bearings were ≥ 15 degrees apart and taken within 20
minutes to decrease error from bird movement. Bearings and Universal Transverse Mercator
(UTM) positions were entered into the program Location of a Signal (LOAS; Ecological
Software Solutions LLC, Hegymagas, Hungary) to determine the estimated UTM location of the
individual and calculate an error polygon around the point. I attempted to limit error polygons to
0.1ha, but used locations up to one ha (~21%). If individuals could no longer be located due to
dispersal from the study site, fixed wing aircraft was used locate them.
Birds outfitted with a Satellite-PTT transmitter had up to ten locations recorded per day,
with ±18 m accuracy, between the hours of 06:00 and 22:00. Points were uploaded to the Argos
satellite and downloaded weekly for mortality assessments.

91
Survival Analysis Study sites were delineated by creating a Minimum Convex Polygon (MCP) using the
Minimum Bounding Geometry tool in ArcGIS 10.2 (ESRI Inc., 2013, Redlands, USA) around all
of the bird points for each site, excluding dispersal events of greater than five km in less than one
week. To describe fragmentation levels in each study site, I used the program FRAGSTATS
(McGarigal et al. 2012). The contagion metric, mean patch size and the standard deviation of
mean patch size were calculated within each study site as a measures of landscape configuration.
The contagion metric uses the proportional abundance of a landcover class, and the proportion of
like adjacencies, and unlike adjacencies for a patch type. A greater contagion value represents a
less fragmented landscape, such that a value of zero equates to a landscape in which there are no
like adjacencies, and a value of 100 is a landscape of a single patch type. This metric is inversely
related to edge density, such that a greater edge density will result in a lower contagion value
(McGarigal and Marks 1995). I also calculated habitat composition within each study site, and
within a 50-km buffer around the centroid of each study site, to determine whether or not study
sites were representative of the overall landscape, or if survival rates were representative of the
overall landscape rather than the study site.
I used Kaplan-Meier models in the survival package (Therneau 2014) in Program R (R
Core Team 2014) to estimate cumulative annual survival for female lesser prairie-chickens at
each study site for two years (March 15 – March 14, 2013-2014 and 2014-2015). Kaplan-Meier
models tested the annual survival rate between sites and years using all birds following a one-
week censoring period. I tested four models, including a null model, a site model, a site and year
additive model as well as a site and year interactive model. Cox proportional hazard models were
ranked using Akaike’s Information Criterion corrected for small sample size (AICc; Burnham
and Anderson 2002). Models with a ΔAICc ≤ 2 were considered competing models.
92
I calculated MCPs for all individuals that had ≥3 points available as an estimate of home
range (Table 3.1). Each bird-year (March 15th – March 14th) was treated as an independent period
due to variation between years in weather and land use. MCPs were used to have a single,
contiguous landscape potentially available for each individual, as kernel density estimates and
Brownian Bridge Movement Models used for some birds in the past had several disjointed core
areas that were not attached (Chapter II, Plumb 2015).
Using the Playa Lakes Joint Venture landcover class layer joined with a CRP layer from
the Farm Service Agency within the lesser prairie-chicken range (Playa Lakes Joint Venture
2009), I clipped the landcover layer including six landcover classes (Grassland, Crop, CRP,
Urban, Water/Wet, and Other), using the Clip tool in ArcGIS 10.2, within the MCP of each bird.
Landscape metrics were calculated using FRAGSTATS to measure habitat composition and
configuration within the home range of each bird. Landscape metrics calculated within home
ranges were Total Area, Mean Patch Size, Contagion, Interspersion/Juxtaposition, and Patch
Richness (Table 3.2; McGarigal and Marks 1995) I also calculated the percentage of each home
range that was Grassland, Crop or CRP. I tested for correlation among the configuration metrics
using Pearson’s correlation coefficient.
I modeled survival, using the LD format, known-fate model in Program Mark. Encounter
histories were compiled using weekly encounter histories across the 52-week annual cycle.
FRAGSTATS metrics of configuration were used as individual covariates in one model set, and
FRATSTATS metrics of composition were used as individual covariates in a second model set to
derive functional relationships (White and Burnham 1999). I created 12 a priori models using
individual FRAGSTATS configuration metrics, and additive site by FRAGSTATS metrics, and
93
ranked the models using AICc (Table 3.3). I also created 19 a priori models using composition
metrics, including site and quadratic terms (Table 3.4).
Andersen-Gill Modeling I used an Andersen-Gill modeling framework to determine how continuous, encounter
specific covariates affect hazard rates for lesser prairie-chickens (Dinkins et al. 2014).
Andersen-Gill models use Cox proportional hazard models, but instead of having an entry date,
exit date, and event for each individual, this approach models entry, exit, and event for each
encounter per individual (Andersen and Gill 1982). Use of Andersen-Gill models allows for time
periods that individuals were not present in the study, such as dispersal from the study site,
transmitter malfunctions, or lack of daily monitoring, such as with VHF individuals. The
Andersen-Gill framework also allows for left-censoring of individuals with staggered entry into
the data set (Johnson et al. 2004).
To obtain a covariate for the encounters of each individual bird, separate distance rasters
were created of each study site for distance to road, fence, distribution power line, oil well and
lek using the Euclidean Distance tool in ArcGIS 10.2 and 30 m x 30 m grid cells. Oil well and
road layers were obtained from the Kansas GIS and Data Support Center
(http://www.kansasgis.org/). I delineated 2-, 3-, 4-, 5-, and 6-strand, permanent livestock fences
by hand, and distribution power line layers were from Kansas distribution lines were from the
Kansas Corporation Commission (http://www.kcc.state.ks.us/). Each cell of these rasters has a
value that identifies the distance that cell is from the nearest feature. For each use point bird
location, I extracted the distance to each feature using the Extract Multi Values tool. The
landcover type for each point was extracted using a spatial join in ArcGIS 10.2 from the Playa
Lakes Joint Venture/Farm Service Agency CRP layer. I used Pearson’s correlation coefficient to
determine if any of the variables were correlated.

94
For VHF birds, all available points were used for encounters. For satellite birds I
randomly selected one point per bird per day, as I modeled survival on a daily encounter history,
and the SAT-PTT birds had as many as 10 points a day available. I chose the point for the day
using the r.sample command in Geospatial Modeling Environment for a random selection of one
of the points within a day (Beyer 2012). Only points and mortalities within the delineated study
sites were used. I did not include Colorado lesser prairie-chickens due to lack of anthropogenic
layer availability.
I built 26 a priori models, which represented each variable alone, additive models of site
and variable combinations, and additive models of each combination of two variables. Model
diagnostics were tested with the cox.zph function to determine if the data met the assumptions of
proportional hazards (Fox 2002). Using the coxph function in the survival package (Therneau
2014), I determined the relative effect of covariates on annual survival from regression
coefficients. All models with ΔAICc ≤ 2 were considered competing models. If the hazard ratio
from the top models was different from zero (coefficient values ≠ 0; 95% confidence intervals of
the beta estimate did not overlap zero), then I determined that the variable was significant and
plotted the predicted risk curve.
Results
Study Site Composition and Configuration A total of 200 bird years and 111 mortality events were included in the overall annual
survival model. There were two top models in the model set with ΔAICc ≤ 2 (Table 3.5). The top
model represented differences among study sites. Northwest Kansas exhibited a lower survival
estimate than any of the other sites (Figure 3.2). The only significant trend in annual survival
rates was between Clark County and Northwest Kansas. The northwestern Kansas survival rate
was 50% lower than in Clark County, Kansas (Figure 3.2). The second top model was a constant

95
survival rate over all of the study sites. The overall annual survival rate of female lesser prairie-
chickens across all study sites was 0.369 (SE = 0.038, 95% CI = 0.30-0.45).
FRAGSTATS contagion metrics calculated within each of the study sites indicated that
there was not a difference in contagion among Clark County and Northwestern Kansas (Table
3.6). Mean patch size was greatest in northwestern Kansas, and lowest in Colorado but the
standard deviation of mean patch size of all sites was much larger than the mean, indicating no
clear difference in mean patch size among sites (Table 3.6). For habitat composition, differences
were evident between Clark County and Northwestern Kansas in terms of both the study site and
the 50-km buffer around the centroid of the study site (Figure 3.3). The Clark County study site,
and the surrounding landscape around the Clark County site had more grassland than the
Northwest study site, by 15.9% and 41.8% respectively. Additionally, the Clark County site was
more representative of the overall landscape, compared to the Northwestern study site, which
had 74.4% more grassland than the surrounding landscape (Table 3.7).
Home Range Composition and Configuration To estimate functional relationships among weekly survival of lesser prairie-chickens and
home-range scale habitat configuration and composition, 177 total bird-years were used, as I
only used individuals for which there were ≥3 locations and an error of one ha. Home range size
was not correlated with the total number of points used to calculate the MCP, nor were either
correlated with the configuration metrics within home ranges. There were no correlated metrics
among the FRAGSTATS configuration metrics, thus all were used to relate landscape
configuration to weekly survival. The sample of individuals for which survival was calculated
included 98 mortality events. There was a single top model in the configuration metric model set
with ΔAICc ≤ 2, which was Site + Patch Richness (β = 0.51, 95% CI = 0.32, 0.69; Table 3.3).

96
For all sites, there was a significant trend of increasing survival as the number of patch types
within home ranges increased (Figure 3.4).
There were two equally parsimonious models in the home-range composition model set,
and the top models were the Site + %Crop2 model, and the Site + %Grassland2 model. Slope
estimates for both models were significant (β = -0.0013, SE = 0.00053) and (β = -0.00074, SE =
0.00018), and indicate a peak in weekly survival when proportion of crop within a lesser prairie-
chicken’s home range is about 30%, and when proportion of grassland within a lesser prairie-
chickens home range is about 40-70% (Figure 3.5).
Andersen-Gill To model the effect of distance to anthropogenic features on hazard rates, 189 total bird
years were used, with 96 total mortality events, as I only used Kansas birds that had ≥2 locations,
one of which being the mortality location. Sample size for these models included 79 and 110
individuals in the 2013-2014 and 2014-2015 seasons, respectively. There was a single top model
in the model set with a ΔAICc ≤ 2, which was site + distance to fence (Table 3.8). This model
accounted for 71% of the weight of the model set. The regression coefficients in this model show
an increased risk relative to decreased distance from fences for birds in northwestern Kansas
(hazard rate = 1.15, SE = 0.38) compared to the Red Hills and Clark County, Kansas. Across all
Kansas study sites, hazard rates for female lesser prairie-chickens increased as distance to fence
decreased (Figure 3.6).
To determine whether this relationship was caused by mortality due to collision with
fences, I calculated the average distance to fence for mortalities among the study sites. The
average distance to fence for mortalities overall was 321.64 m (SE = 29.24). By site, average
distance to fence for mortalities for Clark, Northwest, and Red Hills was 207.99 m (SE = 72.66),
315.57 m (SE = 39.72) and 378.31 m (SE = 38.76), respectively. Additionally, the fence
97
densities for the three Kansas sites were 1.69 km/km2, 1.76 km/km2, and 1.53 km/km2 for
Northwest, Red Hills and Clark, respectively.
Discussion
I investigated the effect of landscape fragmentation on annual survival of female lesser
prairie-chickens in Kansas and Colorado through three different frameworks and four scales. I
found that differences in survival rates were evident between two study sites in Kansas, and that
this difference can be explained by differences in study site habitat composition, with greater
survival corresponding to a greater proportion of grassland habitat both within the study site and
across the greater landscape area. However, I found that landscape configuration, measured with
the contagion metric in FRAGSTATS was not different between these regions. Additionally, I
was able to identify optimum habitat composition amounts within home ranges to maximize
weekly survival, but found that a more fragmented landscape composition does not negatively
affect weekly survival rates. Results alternatively indicated that a landscape with more landscape
types had a positive effect on survival. Finally I found that hazard rates for lesser prairie-
chickens increased as distance to fences decreased.
From four study sites in Kansas and Colorado, I was able to document significant
differences in annual survival between two of the study sites. Survival rates were lowest in
northwestern Kansas, with 95% confidence intervals that did not overlap with Clark County,
Kansas, which had nearly double the survival estimate. I was not able to find differences
between these sites in terms of landscape configuration with the contagion metric, but there were
differences in the proportion of grassland habitat between these two sites. This difference in
habitat proportions was evident at both the study site scale, as well as within the larger, 50 km
buffered landscape. As landscape fragmentation results from the combination of habitat loss, and

98
the resulting changes in landscape configuration from grassland patch isolation, it may be
possible to attribute these differences in survival to the differences in habitat loss alone. While
differences in habitat proportions may not necessarily mean habitat loss in all landscapes, the
Southern Great Plains were entirely grassland before the arrival of European settlers and the
onset of agriculture in this region. Additionally, differences in landscape configuration between
these two study sites may not have been detectable due to the way contagion is calculated.
Contagion uses the proportion of like adjacencies, among cells, for all cover classes, and the
northwestern study site has sizable areas that are unfragmented grassland, as well as areas that
are unfragmented cropland, which contributes to the overall metric.
Similarly, the results of the individual-level (i.e., home range) analysis were inconclusive
in returning results for the actual configuration of the landscape, based on the metrics chosen to
represent fragmentation. However, I did find a positive, significant relationship with an increase
in survival corresponding with an increase in the number of patch types within home ranges.
This relationship does not necessarily mean that increased fragmentation increases survival, as
contagion and interspersion/juxtaposition metrics did not explain survival. Instead, this may
indicate that lesser prairie-chickens experience increased survival when they have a variety of
habitat options available. This relationship is intuitive, as habitat heterogeneity benefits lesser
prairie-chickens, and other grassland birds, because they require different habitat types
throughout different life stages (Fuhlendorf and Engle 2001, Sandercock et al. 2015). The
composition analysis within home ranges was also able to identify that there is an ideal amount
of crop within a home range (30%), and an ideal amount of grassland within home ranges (40-
70%). These results are congruent with past studies that identified that occupied lesser prairie-
chicken habitat was in areas with up to 37% cultivation, with the remainder of landcover in

99
grassland (Crawford and Bolen 1976). It is likely CRP makes up the majority of any gaps
between grassland and cropland within these landscapes, but future analyses will be required to
determine the true importance of this landcover class on the landscape.
The effect of distance to anthropogenic features on annual survival of lesser prairie-
chickens indicated that the closer an individual was to a fence, the greater risk of mortality. A
past study on lesser prairie-chickens in Oklahoma found that fence collision was a primary and
influential source of mortality (Patten et al. 2005, Wolfe et al. 2007). However, other studies
that investigated cause-specific mortality of lesser prairie-chickens did not find fence collision to
occur or be an influential cause of mortality (Merchant 1982, Haukos 1988, Jamison 2000, Fields
2004, Hagen et al. 2007, Kukal 2010, Pirius 2011, Grisham 2012, Holt 2012). Studies on other
grouse species, such as red grouse (Lagopus lagopus scoticus) and greater sage-grouse have also
found that collision is an important source of mortality (Baines and Andrew 2003, Beck et al.
2006, Stevens et al. 2012). However, similarly to lesser prairie-chickens, many greater sage-
grouse studies did not find fences to be an important source of mortality (e.g., Blomberg 2013,
Davis et al. 2014). From this study, the increased hazard rate relative to fences is unlikely to be
attributed to collision mortality, as average distance to fence for mortalities was greater than 200
m at each site. Additionally, a concurrent study investigated whether fence collision was a
significant cause of mortality for lesser prairie-chickens in Kansas and Colorado. Greater than
2800 km of fences were walked across all of the study sites, and only 12 traces of collision
mortality were documented. Additionally, from all of the mortalities of transmittered birds
during this study, there was only evidence found of a single collision as a cause of mortality (D.
Haukos, unpublished data). The increased rate of fence collisions found in Oklahoma may be due
to a higher fence density relative to Kansas, with fence densities of 1.53-1.76 km/km2 in Kansas,

100
compared to 3.8 linear km/km2 in Oklahoma (Wolfe et al. 2009). Instead of collision risk, the
increased hazard rate in relation to fences could be a relationship with predator density. Fences
are frequently used as perches by raptors, one of the most common lesser prairie-chicken
predators (Hagen et al. 2007, Behney et al. 2012), and it may be that the closer a lesser prairie-
chicken comes to a fence, there is an increased likelihood of an encounter with an avian predator.
There was not support in these models for an effect on survival of distance to distribution line,
oil well or road on lesser prairie-chicken mortality rates, despite a past study finding that these
anthropogenic features negatively affected both survival rates and lek persistence for greater
prairie-chickens (Hovick et al. 2014). Lesser prairie-chickens have already been shown to exhibit
avoidance behavior of anthropogenic features such as power lines (Hagen et al. 2011, Plumb
2015), so if avoidance is already occurring, that may preclude an effect on survival rates.
It is possible that survival is not the proper vital rate from which to analyze the effects of
fragmentation through differences in landscape configuration. It has been proposed that the
response to fragmentation may be on the overall finite growth rate rather than annual survival or
reproductive potential alone (Henle et al. 2004). Effects from fragmentation are also likely a
function of dispersal power, individual area requirements, and interaction with environmental
changes that come about from fragmentation (Henle et al. 2004). In the future, it would benefit
this analysis to calculate these metrics for different classifications of the landscapes, especially a
landscape layer that was classified from on-the-ground collected data. These analyses are
sensitive to both the grain and extent of landcover data, as well as how the landscape is
represented, in terms of patch delineation and classification (O’Neill et al. 1996, Hargis et al.
1998, Wu 2004). My results indicate that survival rates are instead representative of the overall
quantity of habitat, which has been the case in past studies investigating the effect of

101
fragmentation on biodiversity (Fahrig 2003). It is also possible that the landscape configuration
of my study sites is not yet fragmented enough to significantly alter lesser prairie-chicken annual
survival, as these data were collected on some of the best lesser prairie-chicken remaining
available habitat across the range of the species. Each study site was comprised of more
grassland and less cropland than the overall landscape, indicating that lesser prairie-chickens can
occupy these areas that represent the prime habitat for them in Kansas and Colorado, rather than
the surrounding area. Instead, this depressed survival rate documented in Northwestern Kansas
may be from decreased functional connectivity, rather than structural connectivity (Taylor et al.
1993). Without the ability to disperse out of the core study area and locate habitat that is both
large enough and of adequate quality, birds who attempt to disperse will either die, or return to
the study area unsuccessful and possibly in reduced body condition. A depressed survival rate,
which is related to a lack in overall grassland habitat indicates that it is crucial to preserve the
grassland habitat in the areas represented by our study sites, especially in northwestern Kansas
where survival rates are lowest. Further loss of habitat within the areas occupied by lesser
prairie-chickens could cause further reduction in survival rates, and eventually result in
population extirpation.
Chick and nest survival have been shown to have the greatest impact on lesser prairie-
chicken growth rates (Hagen et al. 2009), so the next step for this analysis is to determine the
effect of landscape configuration and composition on these vital rates. Past studies of lesser
prairie-chickens have documented an effect of anthropogenic features on the placement of nests,
but little effect on nest survival (Pitman et al. 2005). Future analyses could also use vegetation
characteristics within home ranges to determine if vegetation height or different varieties of
cover have an effect on survival rates of lesser prairie-chickens. This study will also need to
102
include resource selection and comparing fragmentation within actual home ranges to random
home ranges within the study sites. Pairing results from the Andersen-Gill model with a full
analysis of resource selection will allow for the creation of a predicted map that indicates where
lesser prairie-chickens will select habitat and where their hazards will be reduced. The resulting
map could identify areas on the landscape to focus management for lesser prairie-chickens.
Management Implications Lesser prairie-chicken are exposed to a greater predation risk closer to fences. This risk
begins to level out at > 1 km. Past studies have also identified that both male and female lesser
prairie-chickens are using space close to leks throughout the annual cycle. I would recommend
that fences be removed within 1 km of leks or perch prevention devices be installed to reduce the
presence of raptors on fences close to leks. Caution should also be employed before adding new
fences to areas of the lesser prairie-chicken range. Additionally, maintaining landscape
heterogeneity within the lesser prairie-chicken range will be beneficial to lesser prairie-chicken
survival as was evidenced by the increase in survival rates as patch richness increased. Current
landscape configurations do not yet seem to be fragmented enough to negatively affect lesser
prairie-chicken survival; however, continued land conversion should be avoided to maintain
landscapes persist to allow at least 40-70% grassland on the landscape.
Literature Cited
Andersen, P.K., and R.D. Gill. 1982. Cox’s regression model for counting processes: a large sample study. Annals of Statistics 10:1100-1120.
Andrén, H., and P. Angelstam. 1988. Elevated predation rates as an edge effect in habitat islands:
experiemental evidence. Ecology 69:544-547. Bain, M. R. 2002. Male-male competition and mating success on leks attended by hybrid prairie-
chicken. Thesis, Fort Hays State University, Fort Hays, Kansas, USA.

103
Bains, D., and M. Andrew. 2003. Marking of deer fences to reduce frequency of collisions by woodland grouse. Biological Conservation 110:169-176.
Beck, J. L., K. P. Reese, J. W. Connelly, and M. B. Lucia. 2006. Movements and survival of
juvenile greater sage-grouse in southeastern Idaho. Wildlife Society Bulletin 34:1070-1078.
Bedrosian, B., and Craighead, D. J. 2010. Solar powered GPS transmitter use on sage-grouse:
methods of attachment, influences on survival, and success rate of the transmitters. Unpublished report at: <http://www.fs.fed.us/td/programs/im/satellite_gps_telemetry/_assets/Grouse% 20GPS% 20Attachment_Craighead, 20.> Accessed 30 June 2015.
Behney, A. C., C. W. Boal, H. A. Whitlaw, and D. R. Lucia. 2012. Raptor community
composition in the Texas Southern High Plains lesser prairie-chicken range. Wildlife Society Bulletin 36:291-296.
Beyer, H. L. 2012. Geospatial Modelling Environment (Version 0.7.3.0).
<http://www.spatialecology.com/gme>. Blickley, J. L., D. Blackwood and G. L. Patricelli. 2012. Experimental evidence for the effects of
chronic anthropogenic noise on abundance of greater sage-grouse at leks. Conservation Biology 26:461-471.
Blomberg, E. J., D. Gibson, J. S. Sedinger, M. L. Casazza and P. S. Coates. 2013. Intraseasonal
variation in survival and probable causes of mortality in greater sage-grouse Centrocercus urophasianus. Wildlife Biology 19:347-357.
Burnham, K. P., and D. R. Anderson. 2002. Model selection and multimodel inference: a
practical information-theoretic approach. Springer Science, New York, New York, USA.
Case, R. M. 1978. Interstate highway road-killed animals: a data source for biologists. Wildlife Society Bulletin 6:8-13.
Copelin, F. F. 1963. The lesser prairie chicken in Oklahoma. Technical Bulletin No. 6,
Oklahoma Department of Wildlife Conservation, Oklahoma City, OK. Coppedge, B. R., D. M. Engle, R. E. Masters, and M. S. Gregory. 2001. Avian response to
landscape change in fragmented southern Great Plains grasslands. Ecological Applications 11:47-59.
Davis, D. M., K. P. Reese, and S. C. Gardner. 2014. Demography, Reproductive Ecology, and
Variation in Survival of Greater Sage-Grouse in Northeastern California. Journal of Wildlife Management 78:1343-1355.
104
Dijak, W. D. and F. R. Thompson. 2000. Landscape and edge effects on the distribution of mammalian predators in Missouri. Journal of Wildlife Management 64: 209-216.
Dinkins, J. B., M. R. Conover, C. P. Kirol, J. L. Beck, and S. N. Frey. 2014. Greater sage-grouse
(Centrocercus urophasianus) hen survival: effects of raptors, anthropogenic and landscape features, and hen survival. Canadian Journal of Zoology 92:319-330.
Dooley, J. L., and M. A. Bowers. 1998. Demographic responses to habitat fragmentation:
experimental tests at the landscape and patch scale. Ecology 79:969-980. Dzialak, M. R., C. V. Olson, S. M. Harju, S. L. Webb, J. P. Mudd, J. B. Winstead, and L.
Hayden-Wing. 2011. Identifying and prioritizing greater sage-grouse nesting and broodrearing habitat for conservation in human-modified landscapes. PloS One 6:e26273
Ellis, K. L. 1984 Behavior of lekking sage grouse in response to a perched golden eagle. Western
Birds 15:37-43. Fahrig, L. 2001. How much habitat is enough? Biological Conservation 100:65-74. Fahrig, L. 2002. Effect of habitat fragmentation on the extinction threshold: a synthesis.
Ecological Applications 12:346-353. Fahrig, L. 2003. Effects of fragmentation on biodiversity. Annual Review of Ecology, Evolution
and Systematics 34:487-515. Fahrig, L and G. Merriam. 1985. Habitat patch connectivity and population survival. Ecology
66:1762-1768, Fields, T. L. 2004. Breeding season habitat use of Conservation Reserve Program (CRP) land by
lesser prairie-chickens in west central Kansas. Thesis. Colorado State University, Fort Collins, USA.
Fields, T. L., G. C. White, W. G. Gilgert, and R. D. Rodgers. 2006. Nest and brood survival of
lesser prairie-chickens in west central Kansas. Journal of Wildlife Management 70:931-938.
Fox, J. 2002 Cox proportional-hazards regression for survival data. Pages 1-18 in J. Fox, editor.
An Appendix to An R and S-Plus Companion to Applied Regression. Sage Publications, Inc., Thousand Oaks, California, USA.
Fuhlendorf, S. D., and D. M. Engle. 2001. Restoring heterogeneity on rangelands: ecosystem
management based on evolutionary grazing patterns. BioScience 51:625-632. Garton, E. O., C. A. Hagen, G. M. Beauprez, S. C. Kyle, J. C. Pitman, D. S. Schoeling and W. E.
Van Pelt. 2016. Population dynamics of the lesser prairie-chicken. In Press In D.A.

105
Haukos and C.W. Boal, editors. Ecology and Conservation of Lesser Prairie-Chickens. Studies in Avian Biology. CRC Press, Boca Raton, Florida, USA.
Grisham, B. A. 2012. The ecology of lesser prairie-chickens in shinnery oak-grassland
communities in New Mexico and Texas with implications toward habitat management and future climate change. Dissertation, Texas Tech University, Lubbock, USA.
Hagen, C. A., and K. M. Giesen. 2005. Lesser Prairie-Chicken (Tympanuchus pallidicinctus). in
A. Poole, editor. The birds of North America. Ithaca: Cornell Lab of Ornithology; Retrieved from the birds of North America Online: http://bna.birds.cornell.edu/bna/species/364doi:10.2173/bna.364
Hagen, C. A., J. C. Pitman, B. K. Sandercock, R. J. Robel and R. D. Applegate. 2007. Age-
specific survival and probable causes of mortality in female lesser prairie-chickens. Journal of Wildlife Management 71:518-525.
Hagen, C. A., B. K. Sandercock, J. C. Pitman, R. J. Robel, and R. D. Applegate. 2009. Spatial
variation in lesser prairie-chicken demography: a sensitivity analysis of population dynamics and management alternatives. Journal of Wildlife Management 73:1325-1332.
Hagen, C. A., J. C. Pitman, T. M. Loughin, B. K. Sandercock, R. Robel, and R. D. Applegate. 2011.
Impacts of anthropogenic features on habitat use by lesser prairie-chickens. Pages 63 - 76 in B. K. Sandercock, K. Martin, and G. Segelbacher, editors. Ecology, Conservation, and Management of Grouse: Published for the Cooper Ornithological Society. University of California Press, Berkeley, California, USA.
Hargis, C. D., J. A. Bissonette, and J. L. David. 1998. The behavior of landscape metrics
commonly used in the study of habitat fragmentation. Landscape Ecology 13:167-186. Haukos, D. A. 1988. Reproductive ecology of lesser prairie-chickens in west Texas. Thesis,
Texas Tech University, Lubbock, USA. Haukos, D. A., L. M. Smith, and G. S. Broda. 1990. Spring trapping of lesser prairie-chickens.
Journal of Field Ornithology 61:20-25. Henle, K., K. F. Davies, M. Kleyer, C. Margules, and J. Settele. 2004. Predictors of species
sensitivity to fragmentation. Biodiversity and Conservation 13:207-251. Holt, R. D. 2012. Breeding season demographics of a lesser prairie-chicken (Tympanuchus
pallidicinctus) population in the northeastern Texas panhandle. Dissertation, Texas Tech University, Lubbock, USA.
Hovick, T. J., R. D. Elmore, D. K. Kahlgren, S. D. Fuhlendorf, and D. M. Engle. 2014. Evidence
of negative effects of anthropogenic structures on wildlife: a review of grouse survival and behaviour. Journal of Applied Ecology 51:1680-1689.

106
Jamison, B. E. 2000. Lesser prairie-chicken chick survival, adult survival, and habitat selection and movements of males in fragmented rangelands of southwestern Kansas. Thesis, Kansas State University, Manhattan, USA.
Johnson, C. J., M. S. Boyce, C. C. Schwarts, M. A. Haroldson. 2004. Modeling survival:
application of the Andersen-Gill model to Yellowstone grizzly bears. Journal of Wildlife Management 64:966-978.
Kukal, C. A. 2010. The over-winter ecology of lesser prairie-chickens (Tympanuchus
pallidicinctus) in the northeast Texas Panhandle. Thesis, Texas Tech University, Lubbock, USA.
Lauver, C. L., K. Kindscher, D. Faber-Langendoen, and R. Schneider. 1999. A classification of
the natural vegetation of Kansas. Southwestern Naturalist 44:421-443. Lima, S. L. 1986. Predation risk and unpredictable feeding conditions: Determinants of body
mass in birds. Ecology 67:377-385. McDonald, L., G. Beauprez, G. Gardner, J. Griswold, C. Hagen, F. Hornsby, D. Klute, S. Kyle,
J. Pitman, T. Rintz, D. Schoeling, and B. Van Pelt. 2014. Range-wide population size of the lesser prairie-chicken: 2012 and 2013. Wildlife Society Bulletin 38:536-546.
McGarigal, K., and B. J. Marks. 1995. Spatial pattern analysis program for quantifying landscape
structure. Gen. Tech. Rep. PNW-GTR-351. US Department of Agriculture, Forest Service, Pacific Northwest Research Station. 141 pages.
McGarigal, K., S. A Cushman, and E. Ene. 2012. FRAGSTATS v4: Spatial Pattern Analysis Program for Categorical and Continuous Maps. Computer software program produced by the authors at the University of Massachusetts, Amherst. http://www.umass.edu/landeco/research/fragstats/fragstats.html
McNew, L. B., L. M. Hunt, A. J. Gregory, S. M. Wisely, and B. K. Sandercock. 2014. Effects of
wind energy development on nesting ecology of greater-prairie-chickens in fragmented grasslands. Conservation Biology 28:1089-1099.
Merchant, S. S. 1982. Habitat-use, reproductive success, and survival of female lesser prairie
chickens in two years of contrasting weather. Thesis, New Mexico State University, Las Cruces, USA.
O’Neill, R. V., C. T. Hunsaker, S.P. Timmins, B. L. Jackson, K. B. Jones, K. H. Riitters and J.
D. Wickham. 1996. Scale problems in reporting landscape patter at the regional scale. Landscape Ecology 11:169-180.
Patten, M. A., D.H. Wolfe, E. Schocat and S. K. Sherrod. 2005. Habitat fragmentation, rapid
evolution and population persistence. Evolutionary Ecology Research 7:235-249.

107
Pirius, N. E. 2011. The non-breeding season ecology of lesser prairie-chickens (Tympanuchus pallidicinctus) in the Southern High Plains of Texas. Thesis, Texas Tech University, Lubbock, USA.
Pitman, J. C., C. A. Hagen, R. J. Robel, T. M. Loughin, and R. D. Applegate. 2005. Location and
success of lesser prairie-chicken nests in relation to vegetation and human disturbance. Journal of Wildlife Management 69:1259-1269.
Playa Lakes Joint Venture. 2009. PLJV Implementation Planning Guide and PLJV Landcover
Layer. Playa Lakes Joint Venture. Lafayette, USA. Plumb, R. T. 2015. Lesser prairie-chicken movement, space use, survival, and response to
anthropogenic structures in Kansas and Colorado. Thesis, Kansas State University, Manhattan, USA.
Pruett, C. L., M. A. Patten, and D. H. Wolfe. 2009. Avoidance behavior by prairie grouse:
implications for development of wind energy. Conservation Biology 23:1253-1259. R Core Team. 2014. R: A Language and Environment for Statistical Computing. R Foundation
for Statistical Computing 3.1.1 <http://www.R-project.org/>. Robel, R. J., J. A. Harrington, Jr., C. A. Hagen, J. C. Pitman, and R. R. Reker. 2004. Effect of
energy development and human activity on the use of sand sagebrush habitat by prairie-chickens in southwestern Kansas. Transactions of the North American Wildlife and Natural Resource Conference 69:251–266.
Rodgers, R. D. 2016. A History of Lesser Prairie-Chickens. In Press In D.A. Haukos and C.W.
Boal, editors. Ecology and Conservation of Lesser Prairie-Chickens. Studies in Avian Biology. CRC Press, Boca Raton, Florida, USA.
Sandercock, B. K., M. Alfaro-Barrios, A. E. Casey, T. N. Johnson, T. W. Mong, K. J. Odom, K.
M. Strum and V. L. Winder. 2015. Effects of grazing and prescribed fire on resource selection and nest survival of upland sandpipers in an experimental landscape. Landscape Ecology 30:325-337.
Schroeder, M. A., and C. E. Braun. 1991. Walk-in traps for capturing greater prairie-chickens on
leks. Journal of Field Ornithology 62:378-385. Silvy, N., M. Morrow, E. Shanley, and R. Slack. 1990. An improved drop net for capturing
wildlife. Proceedings of the Annual Conference of the Southeastern Association of Fish and Wildlife Agencies 44:374-378.
Slater, S. J., and J. P. Smith. 2010. Effectiveness of raptor perch deterrents on an electrical
transmission line in southwestern Wyoming. Journal of Wildlife Management 74:1080-1088.
108
Stevens, B. S., J. W. Connelly, and K. P. Reese. 2012. Multi-scale assessment of greater sage-grouse fence collision as a function of site and broad scale factors. Journal of Wildlife Management. 76:1370-1380.
Taylor, P. D., L. Fahrig, K. Henein and G. Merriam. 1993. Connectivity is a vital element of
landscape structure. Oikos 68:571-573. Therneau, T. M. 2014. Package 'survival'.
Http://Cran.RProject.Org/Web/Packages/Survival/Survival.Pdf 2.37-7. Van Pelt, W. E., S. Kyle, J. Pitman, D. Klute, G. Beauprex, D. Schoeling, A. Janus, and J.
Haufler. 2013. The Lesser Prairie-chicken Range-wide Conservation Plan. Western Association of Fish and Wildlife Agencies: 1-367.
Walker, B. L., D. E. Naugle, and K. E. Doherty. 2010. Greater sage-grouse population response
to energy development and habitat loss. Journal of Wildlife Management 71:2644-2654. White, G. C., and K. P. Burnham 1999. Program MARK: survival estimation from populations
of marked animals. Bird Study 46:S120-S139. Wilcove, D. S., C. H. McLellan, and A. P. Dobson. 1986. Habitat fragmentation in the temperate
zone. Pages 237-256 in M. E. Soulé, editor. Conservation biology. The science of scarcity and diversity. Sinauer Associates, Sunderland, Massachusetts, USA.
Winder, V. L., L. B. McNew, A. J. Gregory, L. M. Hunt, S. M. Wisely, and B. K. Sandercock.
2014. Effects of wind energy development on survival of female greater prairie-chickens. Journal of Applied Ecology 51:395-405.
Wolfe, D. H., M. A. Patten, E. Shochat, C. L. Pruett, and S. K. Sherrod. 2007. Causes and
patterns of mortality in lesser prairie-chickens Tympanuchus pallidicinctus and implications for management. Wildlife Biology 13(Supp 1):95-104.
Wolfe, D. H., M. A. Patten, and S. K. Sherrod. 2009. Reducing grouse collision by marking
fences (Oklahoma). Ecological Restoration 27:141-143. Woodward, A. J. W., S. D. Fuhlendorf, D. M. Leslie and J. Shackford. 2001. Influence of
landscape composition and change on lesser prairie-chicken (Tympanuchus pallidicinctus) populations. American Midland Naturalist 145:261-274.
Wu, J. 2004. Effects of changing scale on landscape pattern analysis: scaling relations.
Landscape Ecology 19: 125-138.
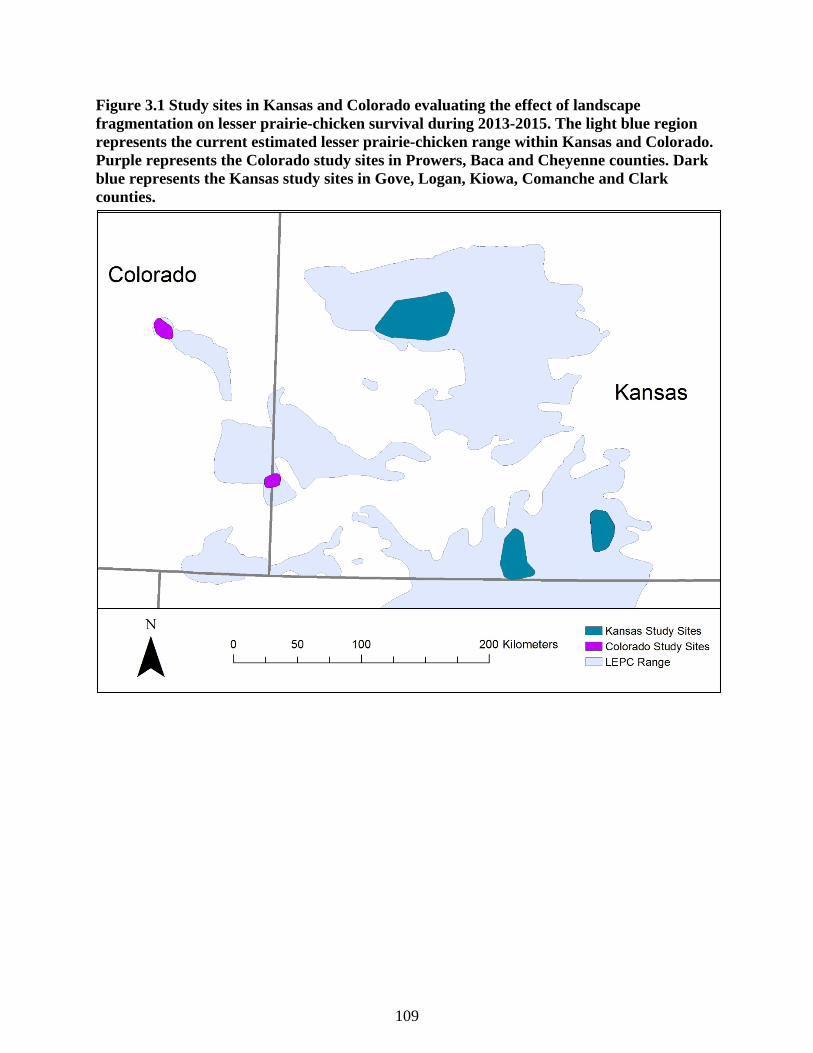
109
Figure 3.1 Study sites in Kansas and Colorado evaluating the effect of landscape fragmentation on lesser prairie-chicken survival during 2013-2015. The light blue region represents the current estimated lesser prairie-chicken range within Kansas and Colorado. Purple represents the Colorado study sites in Prowers, Baca and Cheyenne counties. Dark blue represents the Kansas study sites in Gove, Logan, Kiowa, Comanche and Clark counties.

110
Figure 3.2 Annual survival estimates and 95% confidence intervals of female lesser prairie-chickens for three study sites in Kansas (Clark County, Red Hills, Northwest) and Colorado. Survival rates were estimated using known-fate models in Program Mark, and estimates represent the cumulative annual survival rate. A year was defined as March 15th-March 14th. Years of the study were grouped (2013-2014 and 2014-2015). Differences among study site survival rates were considered statistically significant if confidence intervals do not overlap.
Colorado Northwest Clark Red Hills
Annu
al S
urvi
val E
stim
ate
(w/ 9
5% C
I)
0.0
0.2
0.4
0.6
0.8
1.0
0.48
0.27
0.560.48

111
Figure 3.3 Landscape composition of study sites from Clark County Kansas (top), and northwestern Kansas (Gove and Logan Counties; bottom) illustrating that study sites have different proportions of landcover types within them, and also different from the surrounding landscape, which is buffered 50-km from the centroid of the study site.
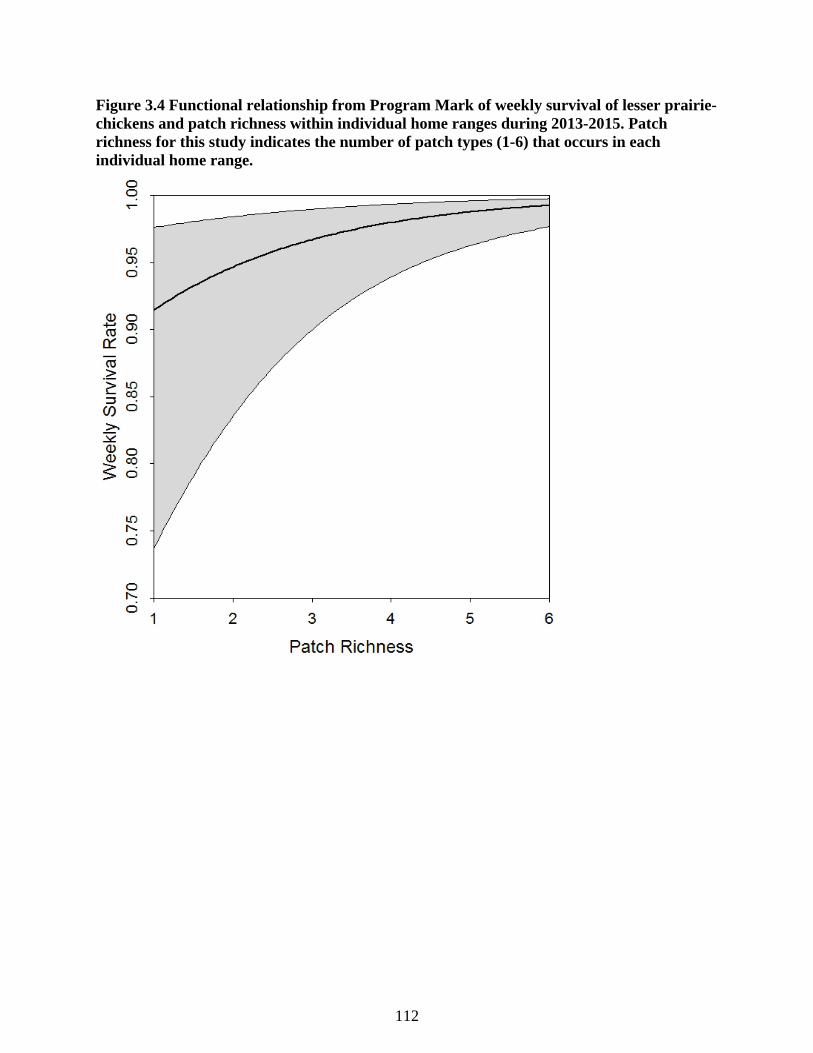
112
Figure 3.4 Functional relationship from Program Mark of weekly survival of lesser prairie-chickens and patch richness within individual home ranges during 2013-2015. Patch richness for this study indicates the number of patch types (1-6) that occurs in each individual home range.

113
Figure 3.5 Functional relationship from Program Mark of weekly survival of lesser prairie-chickens and percent crop (a) and percent grassland (b) within individual home ranges during 2013-2015, for three sites in Kansas.
a
b
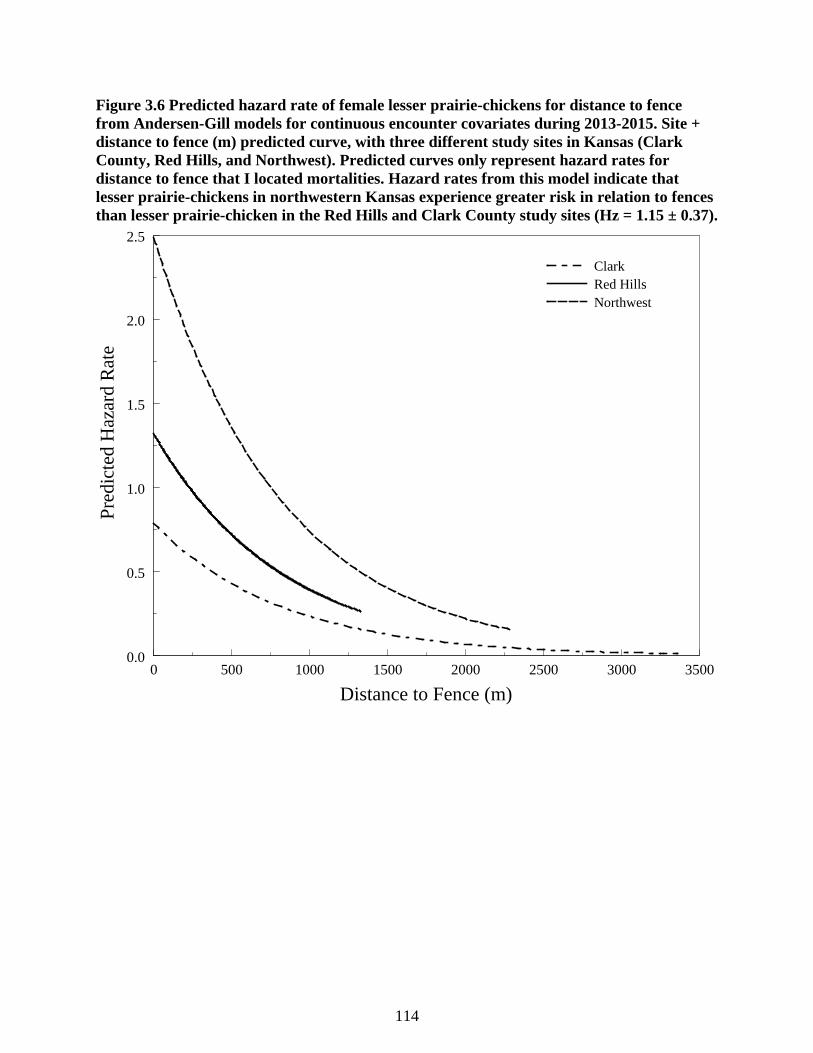
114
Figure 3.6 Predicted hazard rate of female lesser prairie-chickens for distance to fence from Andersen-Gill models for continuous encounter covariates during 2013-2015. Site + distance to fence (m) predicted curve, with three different study sites in Kansas (Clark County, Red Hills, and Northwest). Predicted curves only represent hazard rates for distance to fence that I located mortalities. Hazard rates from this model indicate that lesser prairie-chickens in northwestern Kansas experience greater risk in relation to fences than lesser prairie-chicken in the Red Hills and Clark County study sites (Hz = 1.15 ± 0.37).
Distance to Fence (m)0 500 1000 1500 2000 2500 3000 3500
Pred
icte
d H
azar
d Ra
te
0.0
0.5
1.0
1.5
2.0
2.5
ClarkRed HillsNorthwest

115
Table 3.1 Total available points for lesser prairie-chickens in Kansas and Colorado with SAT-PTT and VHF transmitters used to calculate minimum convex polygons during 2013-2015. Mean values are the mean value per site and overall for each bird used to calculate the polygons.
SAT-PTT VHF
Site Total Number
of Points Mean SE Site Total Number
of Points Mean SE Clark 30497 1794 6 Clark 503 72 2
Northwest 69693 1223 4 Northwest 1464 38 1 Red Hills 40536 1308 4 Red Hills 1252 57 1 Colorado 13954 1993 11 Colorado - - -
All 154680 1381 27 All 3219 47 1

116
Table 3.2 FRAGSTATS metrics calculated within individual home ranges, to use as individual covariates in known-fate models within Program Mark. Definitions of metrics are adapted from McGarigal and Marks 1995.
FRAGSTATS Metric Definition
Total Area (ha) The total area of the landscape
Mean Patch Size (ha) The total area of the landscape, divided by the total number of
patches
Contagion (%)
The degree of clumping of patches on the landscape, based on cell adjacencies, inversely
related to edge density.
Interspersion/Juxtaposition Index (%)
The degree to which patches are intermixed, based on patch
adjacencies
Patch Richness The number of different patch types represented within the
landscape.
PLAND (%) The total area of a patch type, divided by the total area of the
landscape

117
Table 3.3 Model ranking based on Akaike Information Criterion corrected for small sample size (AICc) for 12 models testing the effect of landscape configuration on survival of female lesser prairie-chickens in Kansas and Colorado during 2013-2014 and 2014-2015. Site models considered the four study sites - Northwestern, Red Hills and Clark County, Kansas, and Colorado.
Model K Deviance ΔAICc wi Site + Patch Richness 5 952.44 0 0.92
Patch Richness 2 965.20 6.76 0.03 Interspersion/Juxtaposition 2 966.36 7.92 0.02
Site + Interspersion/Juxtaposition 5 960.55 8.11 0.02 Total Area 2 968.39 9.94 0.01
Site + Total Area 5 963.66 11.23 0 Site 4 977.55 23.11 0
Site + Mean Patch Size 5 976.69 24.25 0 Site + Contagion 5 977.19 24.76 0
Constant 1 985.60 25.16 0 Mean Patch Size 2 985.02 26.58 0
Contagion 2 985.59 27.15 0 K = Number of parameters wi = Akaike model weight AICc = 962.45 for the best fit model
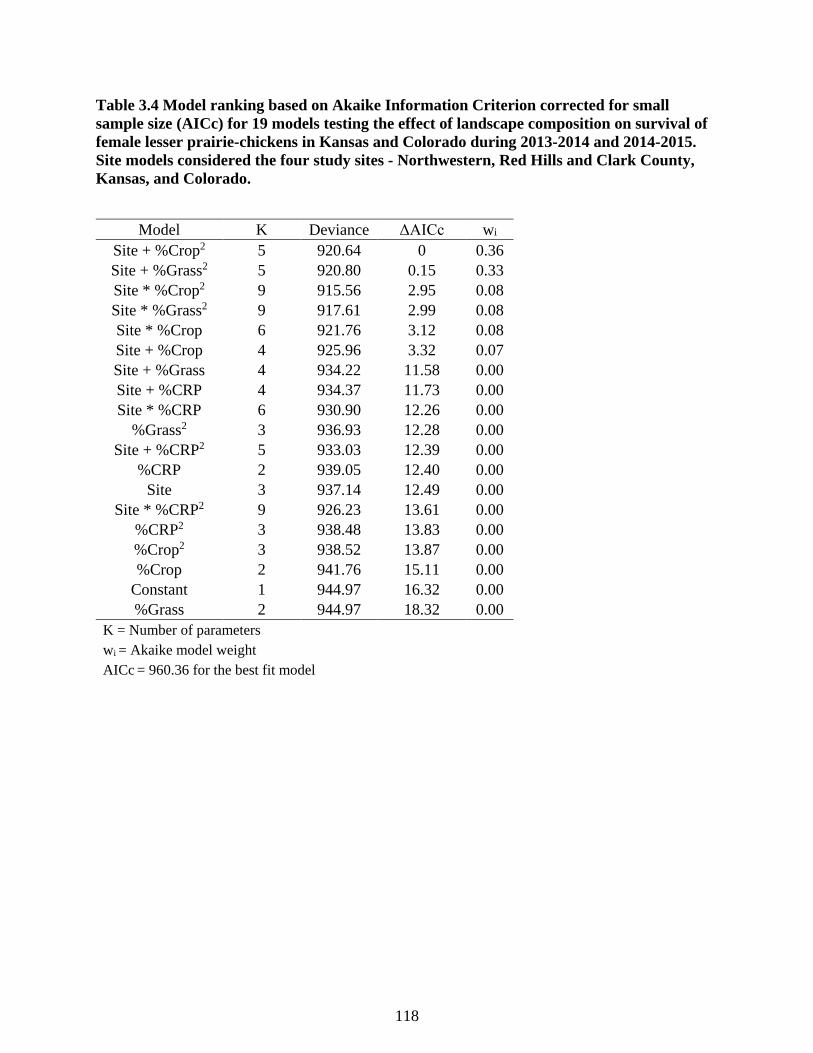
118
Table 3.4 Model ranking based on Akaike Information Criterion corrected for small sample size (AICc) for 19 models testing the effect of landscape composition on survival of female lesser prairie-chickens in Kansas and Colorado during 2013-2014 and 2014-2015. Site models considered the four study sites - Northwestern, Red Hills and Clark County, Kansas, and Colorado.
Model K Deviance ΔAICc wi
Site + %Crop2 5 920.64 0 0.36 Site + %Grass2 5 920.80 0.15 0.33 Site * %Crop2 9 915.56 2.95 0.08 Site * %Grass2 9 917.61 2.99 0.08 Site * %Crop 6 921.76 3.12 0.08 Site + %Crop 4 925.96 3.32 0.07 Site + %Grass 4 934.22 11.58 0.00 Site + %CRP 4 934.37 11.73 0.00 Site * %CRP 6 930.90 12.26 0.00
%Grass2 3 936.93 12.28 0.00 Site + %CRP2 5 933.03 12.39 0.00
%CRP 2 939.05 12.40 0.00 Site 3 937.14 12.49 0.00
Site * %CRP2 9 926.23 13.61 0.00 %CRP2 3 938.48 13.83 0.00 %Crop2 3 938.52 13.87 0.00 %Crop 2 941.76 15.11 0.00
Constant 1 944.97 16.32 0.00 %Grass 2 944.97 18.32 0.00
K = Number of parameters wi = Akaike model weight
AICc = 960.36 for the best fit model

119
Table 3.5 Model selection table Kaplan-Meier survival analysis, for cumulative annual survival rates of female lesser prairie-chickens in Kansas and Colorado for 2013-2014 and 2014-2015. Data from four sites were included in these models, three in Kansas (Clark County, Red Hills and Northwest) and one in Colorado.
Model Name K Deviance ΔAICc wi Site 3 1053.1 0 0.48
Constant 1 1060.68 1.45 0.23 Site + Year 4 1053.04 2.02 0.17
Year 1 1060.07 2.77 0.11 K = Number of parameters wi = Akaike model weight
AICc = 1059.23 for the best fit model

120
Table 3.6 FRAGSTATS metrics calculated within sites for comparison of annual survival of female lesser prairie-chickens among study sites during 2013-2015. Clark, Northwest and Red Hills were Kansas study sites, and the Colorado study site consisted of two distinct areas in eastern Colorado.
Site Total Area (ha)
Contagion (%)
Mean Patch Size (ha)
St. Dev of Mean
Patch Size (ha)
Clark 71209 60.25 34.94 231.74 Northwest 129762 59.67 39.52 288.42 Red Hills 49111 66.28 32.05 387.32 Colorado 28428 64.09 29.44 231.74

121
Table 3.7 Comparison of composition of grassland, cropland and CRP between study areas, and the 50 km radius landscape surrounding these study areas. The 50km buffer represents a circle with a 50-km radius from the centroid of the study area. Composition metrics were calculated in the program FRAGSTATS.
Study Site % Grass % Crop % CRP
Clark 50 km buffer 52.34 32.27 7.43 Study Area 64.05 17.35 5.53 Difference 18.28 -86.02 -34.26
Northwest 50 km buffer 25.90 65.17 4.28 Study Area 45.16 43.90 7.44 Difference 74.35 -32.63 73.73
Red Hills 50 km buffer 50.98 33.74 4.78 Study Area 76.51 8.47 2.19 Difference 50.09 -74.91 -54.25
Colorado 50 km buffer 43.97 38.87 13.59 Study Area 60.27 26.51 9.75 Difference 37.06 -31.81 -28.25

122
Table 3.8 Model ranking for Andersen-Gill models, based on Akaike Information Criterion corrected for small sample size (AICc) for 26 models determining the effect of distance to anthropogenic features and landcover type on survival of lesser prairie-chickens in Kansas during 2013-2015.
Model Statistics Model Name K Deviance ΔAICc wi site + fence 3 784.44 0 0.71 site * fence 5 782.52 2.07 0.25 site + lek 3 792.44 7.99 0.01 site + oil 3 794.16 9.72 0.01 site * lek 5 790.58 10.14 0
site + powerline 3 795.2 10.75 0 site + road 3 795.34 10.9 0
site + landcover 3 795.5 11.05 0 fence 1 800.22 11.77 0
fence + road 2 800.04 13.6 0 site * oil 5 794.12 13.68 0
site * landcover 5 794.42 13.98 0 site * powerline 5 794.46 14.02 0
site * road 5 794.58 14.14 0 lek 5 794.68 14.25 0
fence * road 3 799 14.56 0 lek 1 805.4 16.95 0
powerline 1 806.5 18.05 0 constant 1 809.94 19.5 0 road +
powerline 2 806.5 20.05 0
road 1 809.02 20.57 0 oil 1 809.44 21 0
landcover 1 809.48 21.03 0 road *
powerline 3 805.9 21.46 0
road + oil 2 808.86 22.42 0 road * oil 3 808.34 23.91 0
K = Number of parameters wi = Akaike model weight AICc = 790.45 for the best fit model

123
Appendix A - Weekly Movements of Nonbreeding Lesser Prairie-Chickens
Table A.1 Mean cumulative weekly movements (m) of satellite platform transmitting terminal marked nonbreeding lesser prairie-chickens in three sites in Kansas (Northwest, Red Hills, Clark County), Colorado and New Mexico. Nonbreeding season was considered the 6-month period between 16 September and 14 March, for 2013-2014 and 2014-2015.
2013 2014 n x̄ SE n x̄ SE Northwest 271 9.16 0.3 296 9.46 0.4 Red Hills 187 7.61 0.4 169 8.32 0.36 Clark - - - 254 13.54 0.58 Colorado 103 8.16 0.48 75 9.17 0.58 New Mexico - - - 165 9.99 0.38