land cover trends dataset, 1973–2000 · a. drummond, benjamin m. sleeter, daniel g. sorenson,...
TRANSCRIPT
U.S. Department of the InteriorU.S. Geological Survey
Data Series 844
Land Cover Trends Dataset, 1973–2000

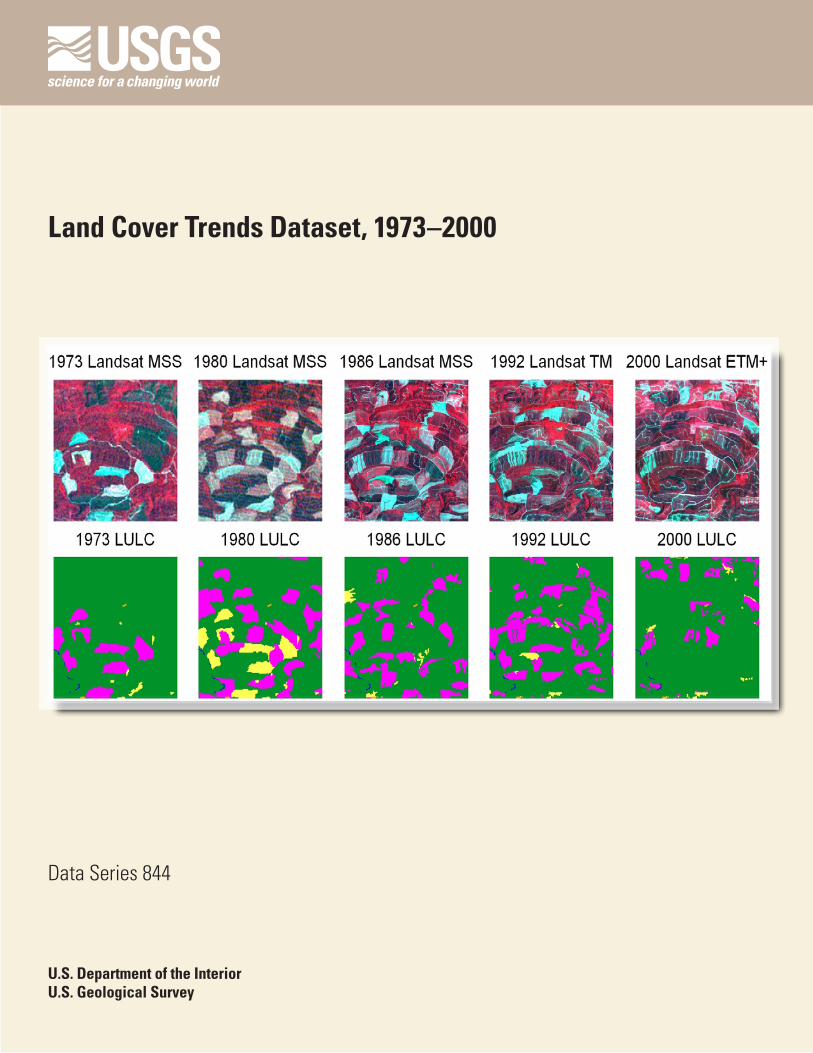
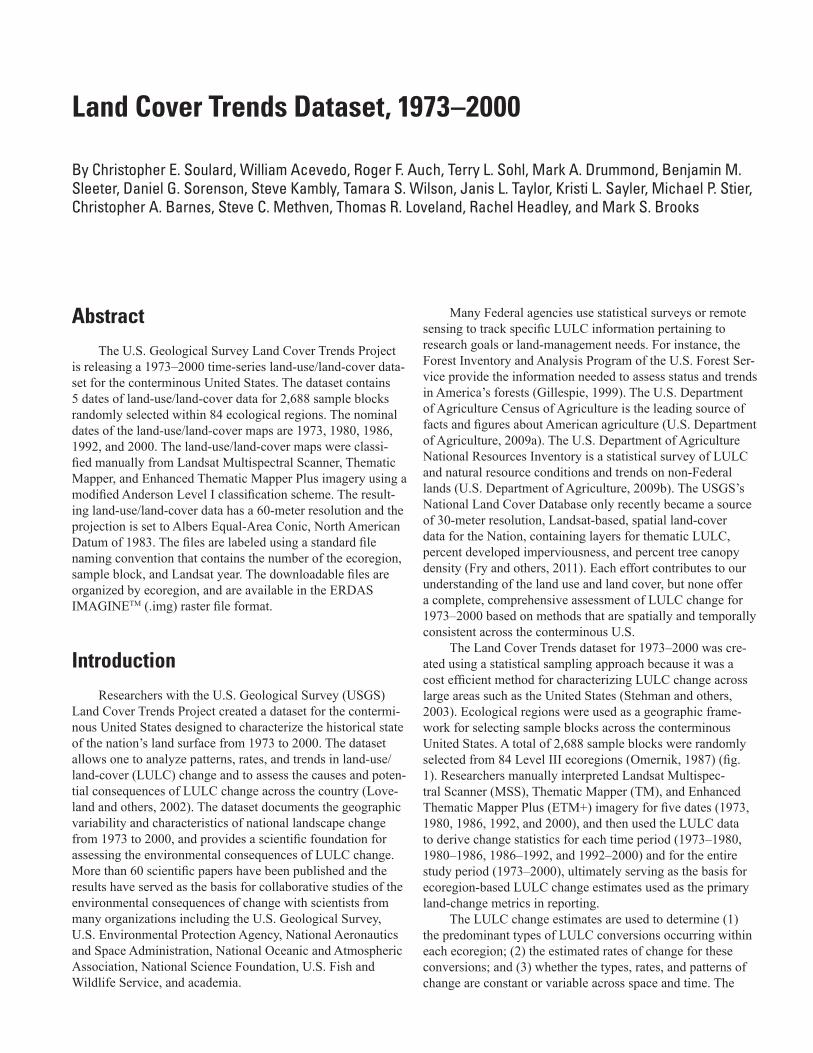
COVERAn example of the five dates of Landsat imagery and corresponding land-use/land-cover data available for each sample block. The example sample block is located in the Ouachita Mountains Ecoregion (samp36_0180), and shows forest cutting from 1973 to 2000 (green, forest/woodland; yellow, grassland/shrubland; magenta, mechanical disturbance; blue, water).
Land Cover Trends Dataset, 1973–2000
By Christopher E. Soulard, William Acevedo, Roger F. Auch, Terry L. Sohl, Mark A. Drummond, Benjamin M. Sleeter, Daniel G. Sorenson, Steve Kambly, Tamara S. Wilson, Janis L. Taylor, Kristi L. Sayler, Michael P. Stier, Christopher A. Barnes, Steve C. Methven, Thomas R. Loveland, Rachel Headley, and Mark S. Brooks
Data Series 844
U.S. Department of the InteriorU.S. Geological Survey

U.S. Department of the InteriorSALLY JEWELL, Secretary
U.S. Geological SurveySuzette M. Kimball, Acting Director
U.S. Geological Survey, Reston, Virginia: 2014
For more information on the USGS—the Federal source for science about the Earth, its natural and living resources, natural hazards, and the environment—visit http://www.usgs.gov or call 1–888–ASK–USGS
For an overview of USGS information products, including maps, imagery, and publications, visit http://www.usgs.gov/pubprod
To order this and other USGS information products, visit http://store.usgs.gov
Any use of trade, firm, or product names is for descriptive purposes only and does not imply endorsement by the U.S. Government.
Although this information product, for the most part, is in the public domain, it also may contain copyrighted materials as noted in the text. Permission to reproduce copyrighted items must be secured from the copyright owner.
Suggested citation: Soulard, C.E., Acevedo, W., Auch, R.F., Sohl, T.L., Drummond, M.A., Sleeter, B.M., Sorenson, D.G., Kambly, S., Wilson, T.S., Taylor, J.L., Sayler, K.L., Stier, M.P., Barnes, C.A., Methven, S.C., Loveland, T.R., Headley, R., and Brooks, M.S., 2014, Land cover trends dataset, 1973–2000: U.S. Geological Survey Data Series 844, 10 p., http://dx.doi.org/10.3133/ds844. ISSN 2331-1258 (online)
iii
AcknowledgmentsDevelopment of this dataset was supported by the U.S. Geological Survey (USGS) Geo-
graphic Analysis and Monitoring Program, USGS Climate and Land Use Change Research and Development Program, U.S. Environmental Protection Agency, and National Aeronautics and Space Administration. The creation of the Land Cover Trends Dataset could not have been completed without the significant contributions of the following team members: Randy Alex-ander, J.D. Cox, Keith Landgraf, Amy Mathie, Robert Glover, Barry Middleton, Alisa Gallant, Bev Friesen, Leila Gass, Michelle Knuppe, Brad Lodge, John Vogel, Pam Waisanen, Jana Ruhl-man, Jerry Griffith, Christian Raumann, Steve Blauer, Rachel Sleeter, Glenn Griffith, Christy Ryan, Greg Zylstra, Leslie Lansberry, Carl Rich, Leslie Milheim, Brian Fiehler, Tom Moreland, Jim Vaughn, Susan Maxwell, Danielle Aiello, Jeanne Jones, Lori Baer, and Paul Martin.
iv
Contents
Abstract ...........................................................................................................................................................1Introduction.....................................................................................................................................................1Methods...........................................................................................................................................................3
Ecoregion Framework ..........................................................................................................................3Sampling Strategy.................................................................................................................................3Landsat Source Data ............................................................................................................................3Classification System ...........................................................................................................................6Interpretation Process .........................................................................................................................6
Data Download ...............................................................................................................................................8References Cited............................................................................................................................................8
Figures1. Map showing locations of 2,688 sample blocks within 84 EPA Level III ecoregions across
the conterminous United States that comprise the Land Cover Trends Dataset ...............22. Flow diagram depicting block interpretation procedure used to develop Land Cover
Trends Dataset ..............................................................................................................................83. Example of five dates of LULC data available for each sample block ...........................................9
Tables1. Ecoregion number, name, number of randomly selected sample blocks, total blocks in
each ecoregion, and percentage of ecoregion mapped .......................................................42. Landsat data used to develop Land Cover Trends Dataset .............................................................63. LULC classification system used to develop data for the Land Cover Trends Dataset ..............74. Data sources and dates of ancillary data acquired to aid researchers in manually
delineating land use and land cover from Landsat imagery .................................................7

v
Conversion Factors
SI to Inch/Pound
Multiply By To obtain
Lengthmeter (m) 3.281 foot (ft) kilometer (km) 0.6214 mile (mi)
Horizontal coordinate information is referenced to the North American Datum of
1983 (NAD 83).
Acronyms and Abbreviations
EPA U.S. Environmental Protection Agency
ETM+ Enhanced Thematic Mapper Plus
LULC land-use/land-cover
MRLC Multi-Resolution Land Characteristics Consortium
MSS Multispectral Scanner
NALC North American Landscape Characterization
NLCD National Land Cover Dataset
TM Thematic Mapper
USGS U.S. Geological Survey

Land Cover Trends Dataset, 1973–2000
By Christopher E. Soulard, William Acevedo, Roger F. Auch, Terry L. Sohl, Mark A. Drummond, Benjamin M. Sleeter, Daniel G. Sorenson, Steve Kambly, Tamara S. Wilson, Janis L. Taylor, Kristi L. Sayler, Michael P. Stier, Christopher A. Barnes, Steve C. Methven, Thomas R. Loveland, Rachel Headley, and Mark S. Brooks
AbstractThe U.S. Geological Survey Land Cover Trends Project
is releasing a 1973–2000 time-series land-use/land-cover data-set for the conterminous United States. The dataset contains 5 dates of land-use/land-cover data for 2,688 sample blocks randomly selected within 84 ecological regions. The nominal dates of the land-use/land-cover maps are 1973, 1980, 1986, 1992, and 2000. The land-use/land-cover maps were classi-fied manually from Landsat Multispectral Scanner, Thematic Mapper, and Enhanced Thematic Mapper Plus imagery using a modified Anderson Level I classification scheme. The result-ing land-use/land-cover data has a 60-meter resolution and the projection is set to Albers Equal-Area Conic, North American Datum of 1983. The files are labeled using a standard file naming convention that contains the number of the ecoregion, sample block, and Landsat year. The downloadable files are organized by ecoregion, and are available in the ERDAS IMAGINETM (.img) raster file format.
IntroductionResearchers with the U.S. Geological Survey (USGS)
Land Cover Trends Project created a dataset for the contermi-nous United States designed to characterize the historical state of the nation’s land surface from 1973 to 2000. The dataset allows one to analyze patterns, rates, and trends in land-use/land-cover (LULC) change and to assess the causes and poten-tial consequences of LULC change across the country (Love-land and others, 2002). The dataset documents the geographic variability and characteristics of national landscape change from 1973 to 2000, and provides a scientific foundation for assessing the environmental consequences of LULC change. More than 60 scientific papers have been published and the results have served as the basis for collaborative studies of the environmental consequences of change with scientists from many organizations including the U.S. Geological Survey, U.S. Environmental Protection Agency, National Aeronautics and Space Administration, National Oceanic and Atmospheric Association, National Science Foundation, U.S. Fish and Wildlife Service, and academia.
Many Federal agencies use statistical surveys or remote sensing to track specific LULC information pertaining to research goals or land-management needs. For instance, the Forest Inventory and Analysis Program of the U.S. Forest Ser-vice provide the information needed to assess status and trends in America’s forests (Gillespie, 1999). The U.S. Department of Agriculture Census of Agriculture is the leading source of facts and figures about American agriculture (U.S. Department of Agriculture, 2009a). The U.S. Department of Agriculture National Resources Inventory is a statistical survey of LULC and natural resource conditions and trends on non-Federal lands (U.S. Department of Agriculture, 2009b). The USGS’s National Land Cover Database only recently became a source of 30-meter resolution, Landsat-based, spatial land-cover data for the Nation, containing layers for thematic LULC, percent developed imperviousness, and percent tree canopy density (Fry and others, 2011). Each effort contributes to our understanding of the land use and land cover, but none offer a complete, comprehensive assessment of LULC change for 1973–2000 based on methods that are spatially and temporally consistent across the conterminous U.S.
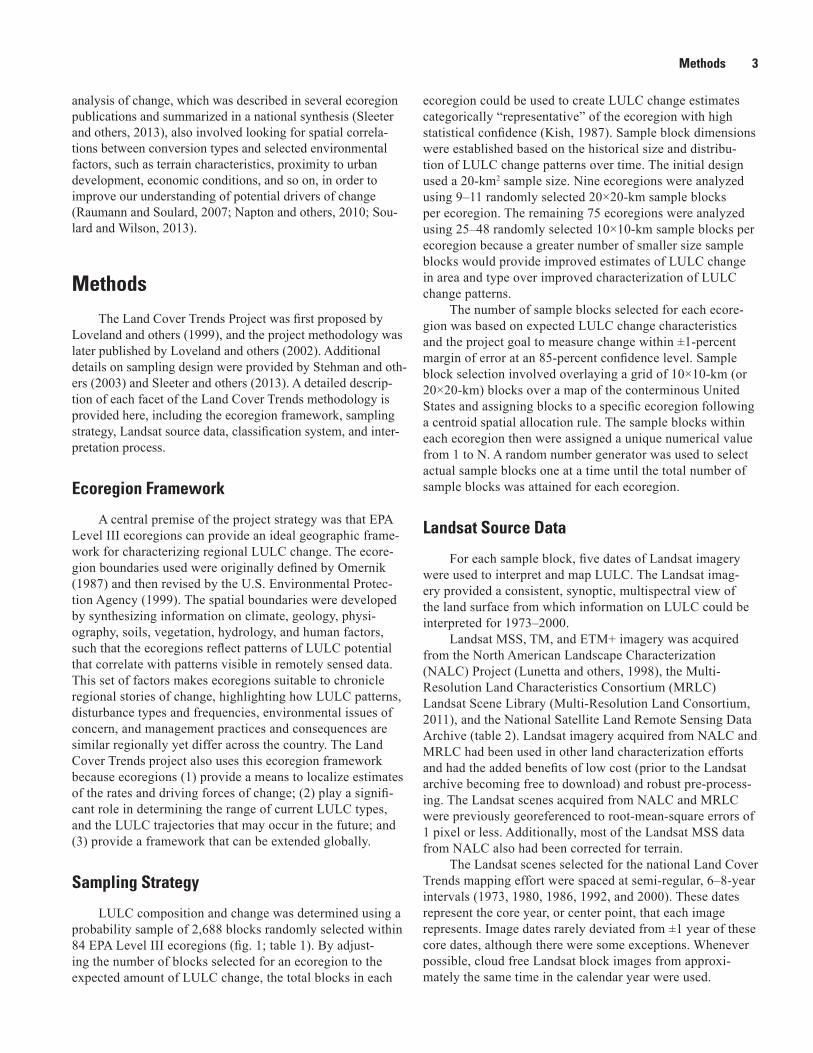
The Land Cover Trends dataset for 1973–2000 was cre-ated using a statistical sampling approach because it was a cost efficient method for characterizing LULC change across large areas such as the United States (Stehman and others, 2003). Ecological regions were used as a geographic frame-work for selecting sample blocks across the conterminous United States. A total of 2,688 sample blocks were randomly selected from 84 Level III ecoregions (Omernik, 1987) (fig. 1). Researchers manually interpreted Landsat Multispec-tral Scanner (MSS), Thematic Mapper (TM), and Enhanced Thematic Mapper Plus (ETM+) imagery for five dates (1973, 1980, 1986, 1992, and 2000), and then used the LULC data to derive change statistics for each time period (1973–1980, 1980–1986, 1986–1992, and 1992–2000) and for the entire study period (1973–2000), ultimately serving as the basis for ecoregion-based LULC change estimates used as the primary land-change metrics in reporting.
The LULC change estimates are used to determine (1) the predominant types of LULC conversions occurring within each ecoregion; (2) the estimated rates of change for these conversions; and (3) whether the types, rates, and patterns of change are constant or variable across space and time. The

2 Land Cover Trends Dataset, 1973–2000
1 Coast Range 22 AZ/NM Plateau 43 Northwestern Great P lains 64 Northern Piedmont
2 Puget Lowland 23 AZ/NM M ountains 44 Nebraska Sand Hills 65 Southeastern Plains
3 Willamette Valley 24 Chihuahuan Deserts 45 Piedmont 66 Blue Ridge M ountains
4 Cascades 25 Western High Plains 46 Northern Glaciated Plains 67 Ridge and Valley
5 Sierra Nevada 26 Southwestern Tablelands 47 Western Corn Belt P lains 68 Southwestern Appalachians
6 CA Chaparral/Oak Woodlands 27 Central Great P lains 48 Lake Agassiz Plain 69 Central Appalachians
7 Central California Valley 28 Flint Hills 49 Northern M innesota Wetlands 70 Western Allegheny Plateau
8 Southern California M ountains 29 Central OK/TX Plains 50 Northern Lakes and Forests 71 Interior P lateau
9 E. Cascades Slopes/Foothills 30 Edwards Plateau 51 North Central Hardwood Forests 72 Interior River Lowland
10 Columbia Plateau 31 Southern Texas Plains 52 Driftless Area 73 M ississippi A lluvial P lain
11 Blue M ountains 32 Texas Blackland Prairies 53 SW Wisconsin Till P lains 74 M ississippi Valley Loess Plains
12 Snake River Basin 33 East Central Texas Plains 54 Central Corn Belt P lains 75 Southern Coastal P lain
13 Central Basin and Range 34 Western Gulf Coastal P lain 55 Eastern Corn Belt P lains 76 Southern Florida Coastal P lain
14 M ojave Basin and Range 35 South Central P lains 56 S. M ichigan/N. Indiana Drift 77 North Cascades
15 Northern Rockies 36 Ouachita M ountains 57 Huron/Erie Lake Plain 78 Klamath M ountains
16 M ontana Valley/Foothill Prairies 37 Arkansas Valley 58 Northeastern Highlands 79 M adrean Archipelago
17 M iddle Rockies 38 Boston M ountains 59 Northeastern Coastal Zone 80 Northern Basin and Range
18 Wyoming Basin 39 Ozark Highlands 60 N. Appalachian Plateau/Uplands 81 Sonoran Basin and Range
19 Wasatch and Uinta M ountains 40 Central Irregular P lains 61 Erie Drift P lains 82 Laurentian Plains and Hills
20 Colorado Plateaus 41 Canadian Rockies 62 North Central Appalachians 83 E. Great Lakes/Hudson Lowlands
21 Southern Rockies 42 NW Glaciated Plains 63 M iddle Atlantic Coastal P lain 84 Atlantic Coastal P ine Barrens
Ecoregion number Ecoregion name
Ecoregion number Ecoregion name
Ecoregion number Ecoregion name
Ecoregion number Ecoregion name
43
13
65
27
47
22
25
24
45
42
26
15
6
35
5046
21
73
14
20
71
75
18
40
67
81
9 80
39
1
5
29
547
72
58
104
83
70
55
23
51
56
11
12 17
34
16
69
30
44
31
7852
74
19
82
33
63
79
32
48
66
8
59
68
60
6461
53
3
77
28
3736
49
76
62
41
38
57 84
2
6
25
5850
42
17
23
63
63
26
22
¯
0 500 1,000KILOMETERS
Albers Equal-Area Conic projection
Base map is the 2001 National Land CoverDataset (Homer and others, 2004)
Sample blocksLevel III Ecoregion boundary
0 300 600MILES
Figure 1. Map showing locations of 2,688 sample blocks within 84 EPA Level III ecoregions across the conterminous United States that comprise the Land Cover Trends Dataset.
Ecoregion number Ecoregion name Ecoregion
number Ecoregion name Ecoregionnumber Ecoregion name Ecoregion
number Ecoregion name
1 Coast Range 22 Arizona/New Mexico Plateau 43 Northwestern Great Plains 64 Northern Piedmont1
2 Puget Lowland 23 Arizona/New Mexico Mountains 44 Nebraska Sand Hills 65 Southeastern Plains1
3 Willamette Valley 24 Chihuahuan Deserts 45 Piedmont1 66 Blue Ridge Mountains1
4 Cascades 25 Western High Plains 46 Northern Glaciated Plains 67 Ridge and Valley
5 Sierra Nevada 26 Southwestern Tablelands 47 Western Corn Belt Plains 68 Southwestern Appalachians
6 California Chaparral and Oak Woodlands 27 Central Great Plains 48 Lake Agassiz Plain 69 Central Appalachians
7 Central California Valley 28 Flint Hills 49 Northern Minnesota Wetlands 70 Western Allegheny Plateau
8 Southern California Mountains 29 Central Oklahoma/Texas Plains 50 Northern Lakes and Forests 71 Interior Plateau
9 Eastern Cascades Slopes and Foothills 30 Edwards Plateau 51 North Central Hardwood Forests 72 Interior River Lowland
10 Columbia Plateau 31 Southern Texas Plains 52 Driftless Area 73 Mississippi Alluvial Plain
11 Blue Mountains 32 Texas Blackland Prairies 53 Southeastern Wisconsin Till Plains 74 Mississippi Valley Loess Plains
12 Snake River Basin 33 East Central Texas Plains 54 Central Corn Belt Plains 75 Southern Coastal Plain
13 Central Basin and Range 34 Western Gulf Coastal Plain 55 Eastern Corn Belt Plains 76 Southern Florida Coastal Plain
14 Mojave Basin and Range 35 South Central Plains 56 Southern Michigan/Northern Indiana Drift 77 North Cascades
15 Northern Rockies 36 Ouachita Mountains 57 Huron/Erie Lake Plain 78 Klamath Mountains
16 Montana Valley and Foothill Prairies1 37 Arkansas Valley 58 Northeastern Highlands 79 Madrean Archipelago1
17 Middle Rockies 38 Boston Mountains 59 Northeastern Coastal Zone 80 Northern Basin and Range
18 Wyoming Basin 39 Ozark Highlands 60 Northern Appalachian Plateau and Uplands 81 Sonoran Basin and Range
19 Wasatch and Uinta Mountains 40 Central Irregular Plains 61 Erie Drift Plains 82 Laurentian Plains and Hills
20 Colorado Plateaus 41 Canadian Rockies 62 North Central Appalachians1 83 Eastern Great Lakes and Hudson Lowlands
21 Southern Rockies 42 Northwestern Glaciated Plains 63 Middle Atlantic Coastal Plain1 84 Atlantic Coastal Pine Barrens1
Methods 3
analysis of change, which was described in several ecoregion publications and summarized in a national synthesis (Sleeter and others, 2013), also involved looking for spatial correla-tions between conversion types and selected environmental factors, such as terrain characteristics, proximity to urban development, economic conditions, and so on, in order to improve our understanding of potential drivers of change (Raumann and Soulard, 2007; Napton and others, 2010; Sou-lard and Wilson, 2013).
MethodsThe Land Cover Trends Project was first proposed by
Loveland and others (1999), and the project methodology was later published by Loveland and others (2002). Additional details on sampling design were provided by Stehman and oth-ers (2003) and Sleeter and others (2013). A detailed descrip-tion of each facet of the Land Cover Trends methodology is provided here, including the ecoregion framework, sampling strategy, Landsat source data, classification system, and inter-pretation process.
Ecoregion Framework
A central premise of the project strategy was that EPA Level III ecoregions can provide an ideal geographic frame-work for characterizing regional LULC change. The ecore-gion boundaries used were originally defined by Omernik (1987) and then revised by the U.S. Environmental Protec-tion Agency (1999). The spatial boundaries were developed by synthesizing information on climate, geology, physi-ography, soils, vegetation, hydrology, and human factors, such that the ecoregions reflect patterns of LULC potential that correlate with patterns visible in remotely sensed data. This set of factors makes ecoregions suitable to chronicle regional stories of change, highlighting how LULC patterns, disturbance types and frequencies, environmental issues of concern, and management practices and consequences are similar regionally yet differ across the country. The Land Cover Trends project also uses this ecoregion framework because ecoregions (1) provide a means to localize estimates of the rates and driving forces of change; (2) play a signifi-cant role in determining the range of current LULC types, and the LULC trajectories that may occur in the future; and (3) provide a framework that can be extended globally.
Sampling Strategy
LULC composition and change was determined using a probability sample of 2,688 blocks randomly selected within 84 EPA Level III ecoregions (fig. 1; table 1). By adjust-ing the number of blocks selected for an ecoregion to the expected amount of LULC change, the total blocks in each
ecoregion could be used to create LULC change estimates categorically “representative” of the ecoregion with high statistical confidence (Kish, 1987). Sample block dimensions were established based on the historical size and distribu-tion of LULC change patterns over time. The initial design used a 20-km2 sample size. Nine ecoregions were analyzed using 9–11 randomly selected 20×20-km sample blocks per ecoregion. The remaining 75 ecoregions were analyzed using 25–48 randomly selected 10×10-km sample blocks per ecoregion because a greater number of smaller size sample blocks would provide improved estimates of LULC change in area and type over improved characterization of LULC change patterns.
The number of sample blocks selected for each ecore-gion was based on expected LULC change characteristics and the project goal to measure change within ±1-percent margin of error at an 85-percent confidence level. Sample block selection involved overlaying a grid of 10×10-km (or 20×20-km) blocks over a map of the conterminous United States and assigning blocks to a specific ecoregion following a centroid spatial allocation rule. The sample blocks within each ecoregion then were assigned a unique numerical value from 1 to N. A random number generator was used to select actual sample blocks one at a time until the total number of sample blocks was attained for each ecoregion.
Landsat Source Data
For each sample block, five dates of Landsat imagery were used to interpret and map LULC. The Landsat imag-ery provided a consistent, synoptic, multispectral view of the land surface from which information on LULC could be interpreted for 1973–2000.
Landsat MSS, TM, and ETM+ imagery was acquired from the North American Landscape Characterization (NALC) Project (Lunetta and others, 1998), the Multi-Resolution Land Characteristics Consortium (MRLC) Landsat Scene Library (Multi-Resolution Land Consortium, 2011), and the National Satellite Land Remote Sensing Data Archive (table 2). Landsat imagery acquired from NALC and MRLC had been used in other land characterization efforts and had the added benefits of low cost (prior to the Landsat archive becoming free to download) and robust pre-process-ing. The Landsat scenes acquired from NALC and MRLC were previously georeferenced to root-mean-square errors of 1 pixel or less. Additionally, most of the Landsat MSS data from NALC also had been corrected for terrain.
The Landsat scenes selected for the national Land Cover Trends mapping effort were spaced at semi-regular, 6–8-year intervals (1973, 1980, 1986, 1992, and 2000). These dates represent the core year, or center point, that each image represents. Image dates rarely deviated from ±1 year of these core dates, although there were some exceptions. Whenever possible, cloud free Landsat block images from approxi-mately the same time in the calendar year were used.

4 Land Cover Trends Dataset, 1973–2000
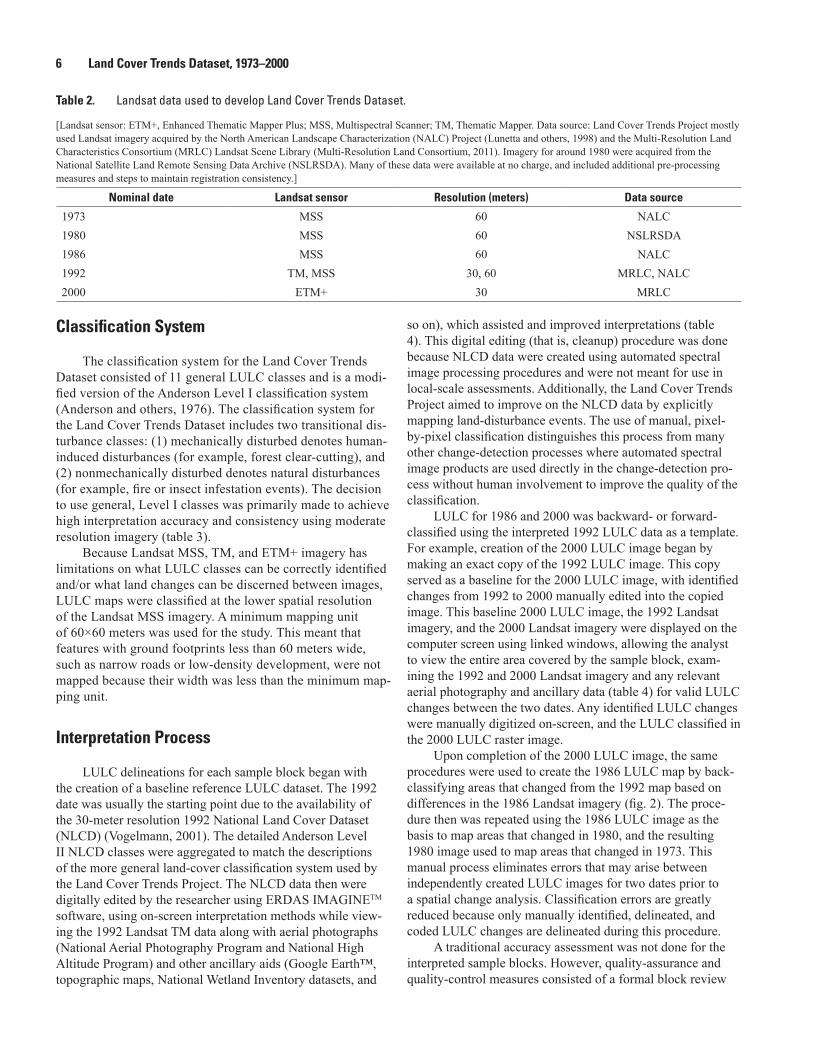
Table 1. Ecoregion number, name, number of randomly selected sample blocks, total blocks in each ecoregion (population), and percentage of ecoregion mapped.
[Sample blocks for each Level III ecoregion were randomly selected based on the ecoregion size and how much change was expected over the study period.]Ecoregion number Ecoregion name Sample size Total blocks Eco mapped (percent)
1 Coast Range 30 550 5.52 Puget Lowland 32 164 19.53 Willamette Valley 32 144 22.24 Cascades 40 466 8.65 Sierra Nevada 36 532 6.86 California Chaparral and Oak Woodlands 40 1,011 4.07 Central California Valley 48 458 10.58 Southern California Mountains 30 178 16.99 Eastern Cascades Slopes and Foothills 32 658 4.910 Columbia Plateau 36 897 4.011 Blue Mountains 30 652 4.612 Snake River Basin 36 571 6.313 Central Basin and Range 36 3,418 1.114 Mojave Basin and Range 40 1,304 3.115 Northern Rockies 36 1,637 2.216 Montana Valley and Foothill Prairies1 10 161 6.217 Middle Rockies 40 898 4.518 Wyoming Basin 30 1,284 2.319 Wasatch and Uinta Mountains 32 440 7.320 Colorado Plateaus 30 1,291 2.321 Southern Rockies 36 1,383 2.622 Arizona/New Mexico Plateau 32 1,921 1.723 Arizona/New Mexico Mountains 36 1,080 3.324 Chihuahuan Deserts 32 1,755 1.825 Western High Plains 45 2,876 1.626 Southwestern Tablelands 32 1,593 2.027 Central Great Plains 45 2,721 1.728 Flint Hills 28 278 10.129 Central Oklahoma/Texas Plains 36 1,030 3.530 Edwards Plateau 32 584 5.531 Southern Texas Plains 32 544 5.932 Texas Blackland Prairies 40 503 8.033 East Central Texas Plains 40 439 9.134 Western Gulf Coastal Plain 40 653 6.135 South Central Plains 36 1,549 2.336 Ouachita Mountains 32 264 12.137 Arkansas Valley 32 265 12.138 Boston Mountains 32 170 18.839 Ozark Highlands 42 1,079 3.940 Central Irregular Plains 28 1,221 2.341 Canadian Rockies 30 185 16.242 Northwestern Glaciated Plains 30 1,614 1.9
1Indicates ecoregion that had 20×20-kilometer sample blocks instead of 10×10-kilometer sample blocks.

Methods 5
Ecoregion number Ecoregion name Sample size Total blocks Eco mapped (percent)
43 Northwestern Great Plains 40 3,455 1.244 Nebraska Sand Hills 28 603 4.645 Piedmont1 11 412 2.746 Northern Glaciated Plains 30 1,415 2.147 Western Corn Belt Plains 40 2,155 1.948 Lake Agassiz Plain 28 414 6.849 Northern Minnesota Wetlands 28 244 11.550 Northern Lakes and Forests 32 1,834 1.751 North Central Hardwood Forests 36 884 4.152 Driftless Area 36 474 7.653 Southeastern Wisconsin Till Plains 40 307 13.054 Central Corn Belt Plains 40 984 4.155 Eastern Corn Belt Plains 36 832 4.356 Southern Michigan/Northern Indiana Drift 36 717 5.057 Huron/Erie Lake Plain 40 247 16.258 Northeastern Highlands 36 1,266 2.859 Northeastern Coastal Zone 30 347 8.660 Northern Appalachian Plateau and Uplands 30 298 10.161 Erie Drift Plains 30 305 9.862 North Central Appalachians1 10 76 13.263 Middle Atlantic Coastal Plain1 11 198 5.664 Northern Piedmont1 10 75 13.365 Southeastern Plains1 11 837 1.366 Blue Ridge Mountains1 10 119 8.467 Ridge and Valley 40 1,106 3.668 Southwestern Appalachians 25 352 7.169 Central Appalachians 32 595 5.470 Western Allegheny Plateau 40 844 4.771 Interior Plateau 40 1,273 3.172 Interior River Lowland 40 929 4.373 Mississippi Alluvial Plain 36 1,328 2.774 Mississippi Valley Loess Plains 32 436 7.375 Southern Coastal Plain 35 1,249 2.876 Southern Florida Coastal Plain 30 222 13.577 North Cascades 32 303 10.678 Klamath Mountains 32 476 6.779 Madrean Archipelago1 10 103 9.780 Northern Basin and Range 32 1,096 2.981 Sonoran Basin and Range 40 1,159 3.582 Laurentian Plains and Hills 30 452 6.683 Eastern Great Lakes and Hudson Lowlands 30 580 5.284 Atlantic Coastal Pine Barrens1 9 37 24.3
Table 1. Ecoregion number, name, number of randomly selected sample blocks, total blocks in each ecoregion (population), and percentage of ecoregion mapped.—Continued
[Sample blocks for each Level III ecoregion were randomly selected based on the ecoregion size and how much change was expected over the study period.]
1Indicates ecoregion that had 20×20-kilometer sample blocks instead of 10×10-kilometer sample blocks.
6 Land Cover Trends Dataset, 1973–2000
Table 2. Landsat data used to develop Land Cover Trends Dataset.
[Landsat sensor: ETM+, Enhanced Thematic Mapper Plus; MSS, Multispectral Scanner; TM, Thematic Mapper. Data source: Land Cover Trends Project mostly used Landsat imagery acquired by the North American Landscape Characterization (NALC) Project (Lunetta and others, 1998) and the Multi-Resolution Land Characteristics Consortium (MRLC) Landsat Scene Library (Multi-Resolution Land Consortium, 2011). Imagery for around 1980 were acquired from the National Satellite Land Remote Sensing Data Archive (NSLRSDA). Many of these data were available at no charge, and included additional pre-processing measures and steps to maintain registration consistency.]
Nominal date Landsat sensor Resolution (meters) Data source
1973 MSS 60 NALC1980 MSS 60 NSLRSDA1986 MSS 60 NALC1992 TM, MSS 30, 60 MRLC, NALC2000 ETM+ 30 MRLC
Classification System
The classification system for the Land Cover Trends Dataset consisted of 11 general LULC classes and is a modi-fied version of the Anderson Level I classification system (Anderson and others, 1976). The classification system for the Land Cover Trends Dataset includes two transitional dis-turbance classes: (1) mechanically disturbed denotes human-induced disturbances (for example, forest clear-cutting), and (2) nonmechanically disturbed denotes natural disturbances (for example, fire or insect infestation events). The decision to use general, Level I classes was primarily made to achieve high interpretation accuracy and consistency using moderate resolution imagery (table 3).
Because Landsat MSS, TM, and ETM+ imagery has limitations on what LULC classes can be correctly identified and/or what land changes can be discerned between images, LULC maps were classified at the lower spatial resolution of the Landsat MSS imagery. A minimum mapping unit of 60×60 meters was used for the study. This meant that features with ground footprints less than 60 meters wide, such as narrow roads or low-density development, were not mapped because their width was less than the minimum map-ping unit.
Interpretation Process
LULC delineations for each sample block began with the creation of a baseline reference LULC dataset. The 1992 date was usually the starting point due to the availability of the 30-meter resolution 1992 National Land Cover Dataset (NLCD) (Vogelmann, 2001). The detailed Anderson Level II NLCD classes were aggregated to match the descriptions of the more general land-cover classification system used by the Land Cover Trends Project. The NLCD data then were digitally edited by the researcher using ERDAS IMAGINETM software, using on-screen interpretation methods while view-ing the 1992 Landsat TM data along with aerial photographs (National Aerial Photography Program and National High Altitude Program) and other ancillary aids (Google Earth™, topographic maps, National Wetland Inventory datasets, and
so on), which assisted and improved interpretations (table 4). This digital editing (that is, cleanup) procedure was done because NLCD data were created using automated spectral image processing procedures and were not meant for use in local-scale assessments. Additionally, the Land Cover Trends Project aimed to improve on the NLCD data by explicitly mapping land-disturbance events. The use of manual, pixel-by-pixel classification distinguishes this process from many other change-detection processes where automated spectral image products are used directly in the change-detection pro-cess without human involvement to improve the quality of the classification.
LULC for 1986 and 2000 was backward- or forward-classified using the interpreted 1992 LULC data as a template. For example, creation of the 2000 LULC image began by making an exact copy of the 1992 LULC image. This copy served as a baseline for the 2000 LULC image, with identified changes from 1992 to 2000 manually edited into the copied image. This baseline 2000 LULC image, the 1992 Landsat imagery, and the 2000 Landsat imagery were displayed on the computer screen using linked windows, allowing the analyst to view the entire area covered by the sample block, exam-ining the 1992 and 2000 Landsat imagery and any relevant aerial photography and ancillary data (table 4) for valid LULC changes between the two dates. Any identified LULC changes were manually digitized on-screen, and the LULC classified in the 2000 LULC raster image.
Upon completion of the 2000 LULC image, the same procedures were used to create the 1986 LULC map by back-classifying areas that changed from the 1992 map based on differences in the 1986 Landsat imagery (fig. 2). The proce-dure then was repeated using the 1986 LULC image as the basis to map areas that changed in 1980, and the resulting 1980 image used to map areas that changed in 1973. This manual process eliminates errors that may arise between independently created LULC images for two dates prior to a spatial change analysis. Classification errors are greatly reduced because only manually identified, delineated, and coded LULC changes are delineated during this procedure.
A traditional accuracy assessment was not done for the interpreted sample blocks. However, quality-assurance and quality-control measures consisted of a formal block review

Methods 7
Table 3. LULC classification system used to develop data for the Land Cover Trends Dataset.
[The classification system for the Land Cover Trends Dataset consisted of 11 general LULC classes and is a modified version of the Anderson Level I classifica-tion system (Anderson and others, 1976).]
Class Description
1 - Water Areas persistently covered with water, such as streams, canals, lakes, reservoirs, bays, or oceans.2 - Developed/urban Areas of intensive use with much of the land covered with structures (for example, high-density residen-
tial, commercial, industrial, transportation, mining, confined livestock operations), or less-intensive uses where the land-cover matrix includes both vegetation and structures (for example, low-density residential, recreational facilities, cemeteries, and so on), including any land functionally attached to the urban or built-up activity.
3 - Mechanically disturbed1 Land in an altered and often non-vegetated state that is in transition from one cover type to another because of disturbances by mechanical means. Mechanical disturbances include forest clear-cutting, earthmoving, scraping, chaining, reservoir drawdown, and other similar human-induced changes.
4 - Barren Land comprised of natural occurrences of soils, sand, or rocks where less than 10 percent of the area is vegetated.
5 - Mining Areas with extractive mining activities that have a significant surface expression. This includes (to the extent that these features can be detected) mining buildings, quarry pits, overburden, leach, evapora-tive, tailing, or other related components.
6 - Forests/woodlands Tree-covered land where the tree-cover density is greater than 10 percent. Cleared forest land (that is, clear-cut logging) will be mapped according to current cover (for example, disturbed or transitional, shrubland/grassland).
7 - Grassland/shrubland Land predominantly covered with grasses, forbs, or shrubs. The vegetated cover must comprise at least 10 percent of the area.
8 - Agriculture Cropland or pastureland in either a vegetated or non-vegetated state used for the production of food and fiber. Forest plantations are considered as forests or woodlands regardless of the use of the wood products.
9 - Wetland Lands where water saturation is the determining factor in soil characteristics, vegetation types, and animal communities. Wetlands are comprised of water and vegetative cover.
10 - Nonmechanically disturbed1 Land in an altered and often non-vegetated state that is in transition from one cover type to another because of disturbances by nonmechanical means. Nonmechanical disturbances are caused by wind, floods, fire, insects, and other similar phenomenon.
11 - Ice/snow Land where the accumulation of snow and ice does not completely melt during the summer period.1Indicates class included to capture anthropogenic or natural disturbance events.
Table 4. Data sources and dates of ancillary data acquired to aid researchers in manually delineating land use and land cover from Landsat imagery.
[Aerial photography was acquired for each sample block to provide a high-resolution data source to aid in difficult interpretations. Availability of ancillary data varied, yet many datasets covered large spatial extents.]
Data source Data provider Dates
7.5 Minute Topographic Maps U.S. Geological Survey VariableNational Wetland Inventory (NWI) U.S. Fish and Wildlife Service VariableMonitoring Trends in Burn Severity (MTBS) U.S. Geological Survey 1984–presentNational High Altitude Program (NHAP)1 U.S. Geological Survey 1978–1980sNational Aerial Photography Program (NAPP)1 U.S. Geological Survey 1987–1990sNational Land Cover Dataset (NLCD) U.S. Geological Survey 1992, 2000Google Earth™ imagery1 Google 1990s–present
1Indicates aerial photography or satellite imagery.

8 Land Cover Trends Dataset, 1973–2000
conducted by the national research team. During the block review, the national research team visually inspected each LULC date for each sample block by comparing interpreted maps to Landsat scenes and ancillary geospatial data. An examination of LULC adjacency also was conducted where blocks bordered one another. Review comments were com-piled by the national research team and the researcher respon-sible for the interpretation was required to reconcile all errors following the block review and to document the corrections that were made.
1972 Landsat MSS 1980 Landsat MSS 1986 Landsat MSS
1972LULC
1980LULC
1986LULC
1992 Landsat TM
1992LULC
2000 Landsat ETM+
2000LULC
Figure 2. Flow diagram depicting block interpretation procedure used to develop Land Cover Trends Dataset. Manual interpretation process starts with development of 1992 baseline LULC. Resulting LULC map then was used to forward- and backward-classify areas that changed.
Data Download
Five dates of LULC maps (1973, 1980, 1986, 1992, and 2000) are available for each of the 2,688 sample blocks dis-tributed across the conterminous United States (fig. 3). The dataset includes a total of 13,440 images that are provided in a compressed file format by ecoregion. Each individual LULC map file is available in the ERDAS IMAGINETM (.img) raster file format. The file name contains the ecoregion number, followed by the sample block number and the year of the Landsat used in the interpretation. The actual Landsat scenes are not available for download as part of this dataset.
The dataset is available for downloading at http://pubs.usgs.gov/ds/844/.
References Cited
Anderson, J.R., Hardy, E.E., Roach, J.T., and Witmer, D.E., 1976, A land use and land cover classification system for use with remote sensor data: U.S. Geological Survey Pro-fessional Paper 964, 28 p., http://pubs.er.usgs.gov/publica-tion/pp964.
Fry, J., Xian, G., Jin, S., Dewitz, J., Homer, C., Yang, L., Barnes, C., Herold, N., and Wickham, J., 2011, Completion of the 2006 National Land Cover Database for the conter-minous United States: Photogrammetric Engineering and Remote Sensing, v. 77, no. 9, p. 858–864.
Gillespie, A.J.R., 1999, Rationale for a national annual forest inventory program: Journal of Forestry, v. 97, no. 12, p. 16–20.
Homer, C. C. Huang, L. Yang, B. Wylie and Coan, M., 2004, Development of a 2001 National Landcover Database for the United States. Photogrammetric Engineering and Remote Sensing, v. 70, no. 7, 829–840.

References Cited 9
Figure 3. Example of five dates of LULC data available for each sample block. Data shown here are for sample 74_0134 in the Mississippi Valley Loess Plains Ecoregion on the northeastern edge of Memphis, Tennessee. Landsat scenes are not available for download as part of this dataset.
Kish, L., 1987, Statistical design for research: New York, Wiley, 296 p.
Loveland, T.R., Sohl, T.L., Sayler, K., Gallant, A., Dwyer, J., Vogelmann, J.E., and Zylstra, G.J., 1999, Land cover Trends—Rates, causes, and consequences of late-twentieth century U.S. land cover change: Environmental Pro-tection Agency, Research Plan EPA-IAG Project No. DW14938108-01-0, p. 1–52.
Loveland, T.R., Sohl, T.L., Stehman, S.V., Gallant, A.L., Say-ler, K.L., and Napton, D.E., 2002, A strategy for estimating the rates of recent United States land-cover changes: Photo-grammetric Engineering and Remote Sensing, v. 68, no. 10, p. 1091–1099.
Lunetta, R.S., Lyon, J.G., Guindon, B., and Elvidge, C.D., 1998, North American landscape characterization dataset development and data fusion issues: Photogrammetric Engi-neering and Remote Sensing, v. 64, no. 8, p. 821–829.
Multi-Resolution Land Characteristics Consortium, 2011, MRLC Landsat Scene Library: Web site, accessed July 20, 2012, at http://www.mrlc.gov/download_data.php.
Napton, D.E., Auch, R.F., Headley, R., and Taylor, J.L., 2010, Land changes and their driving forces in the Southeastern United States: Regional Environmental Change, v.10, no. 1, p.37–53.
Omernik, J.M., 1987, Ecoregions of the conterminous United States: Annals of the Association of American Geographers, v. 77, no. 1, p. 118–125.
Raumann, C.G., and Soulard, C.E., 2007, Land-cover trends of the Sierra Nevada Ecoregion, 1973–2000: U.S. Geological Survey Scientific Investigations Report 2007-5011, 29 p, http://pubs.usgs.gov/sir/2007/5011/.
Sleeter, B.M., Sohl, T.L., Loveland, T.R., Auch, R.F., Acev-edo, W., Drummond, M.A., Sayler, K.L., and Stehman, S.V., 2013, Land-cover change in the conterminous United States from 1973 to 2000: Global Environmental Change, v. 23, p. 733–748.
Soulard, C.E., and Wilson, T.S., 2013, Recent land-use/land-cover change in the Central California Valley: Journal of Land Use Science, doi:10.1080/1747423X.2013.841297.
Stehman, S.V., Sohl, T.L., and Loveland, T.R., 2003, Statisti-cal sampling to characterize recent United States land-cover change: Remote Sensing of Environment, v. 86, p. 517–529.
U.S. Environmental Protection Agency, 1999, Level III ecore-gions of the continental United States (revision of Omernik, 1987): U.S. Environmental Protection Agency National Health and Environmental Effects Research Laboratory, scale 1:7,500,000, Western Ecology Division, Corvallis, Oregon.

10 Land Cover Trends Dataset, 1973–2000
U.S. Department of Agriculture, 2009a, 2007 Census of agriculture—United States summary and State data, Volume 1, Geographic Area Series, Part 51: U.S. Department of Agriculture, 639 p. plus appendixes.
U.S. Department of Agriculture, 2009b, Summary report—2007 National resources inventory: U.S. Depart-ment of Agriculture Natural Resources Conservation Ser-vice, and Iowa State University Center for Survey Statistics and Methodology, Ames, Iowa, 123 p.
Vogelmann, J.E., Howard, S.M., Yang, L., Larson, C.R., Wylie, B.K., and van Driel, N., 2001, Completion of the 1990s National Land Cover Data Set for the conterminous United States from Landsat Thematic Mapper data and ancillary data sources: Photogrammetric Engineering and Remote Sensing, v. 67, p. 650–662.

Menlo Park and Tacoma Publishing Service Centers, California and WashingtonManuscript approved for publication April 30, 2014Edited by John OsiasLayout by Cory Hurd

Soulard and others—Land Cover Trends D
ataset, 1973–2000—Data Series 844
http://dx.doi.org/10.3133/ds844
ISSN 2331-1258 (online)