sorenson - palmer capital - sorenson research park.pdf · sorenson research park offers investors...
TRANSCRIPT

Confidential Offering Memorandum
SORENSONRESEARCH PARK
Salt Lake City, Utah

Palmer Capital, Inc. (“Palmer Capital”) and the seller (“Seller”) of the property referenced herein (“Property”) present this Confidential Offering Memorandum (“Memorandum”) to assist the recipient(s) (“You” or “Your”) in evaluating the Property and it is intended for Your use only. This Memorandum contains brief, selected information pertaining to the Property and should not be considered all-inclusive or permanent. The information in this Memorandum has been obtained from sources believed to be reliable, but has not been verified and is not guaranteed. You should independently verify each item of information and have the same reviewed by Your tax advisor and/or legal counsel. Assumptions, projections, estimates and/or opinions are provided as examples only and all information is subject to change, error, omissions and/or withdrawal without notice. Palmer Capital and Seller assume no responsibility for and make no warranty as to the accuracy or completeness of any information in this Memorandum. Palmer Capital and Seller expressly disclaim any implied or expressed warranties of merchantability, fitness for a particular purpose or non-infringement of intellectual property relating to this Memorandum. In no event shall Palmer Capital or Seller be liable for any damages resulting from the reliance on or use of any information in this Memorandum, including but not limited to direct, special, indirect, consequential or incidental damages. By accepting receipt of this Memorandum, You agree to the following: (a) This Memorandum is of a highly confidential nature, will be held in the strictest confidence and shall be returned to Palmer Capital upon request; (b) You shall not contact any property manager, employee or tenant of the Property regarding the Property or this Memorandum, without prior approval of Palmer Capital or Seller; and (c) You understand and agree that Palmer Capital represents Seller and not You. Neither Palmer Capital nor Seller shall have any obligation to pay any commission, finder’s fee, or any other compensation to any broker or other person. You may provide information to persons retained to evaluate the Property only after first obtaining a signed confidentiality agreement from such persons and providing a copy of such agreement to Palmer Capital. By accepting receipt of this Memorandum, you agree to defend, indemnify and hold harmless Palmer Capital and Seller (including all of their agents, employees, subsidiaries, affiliated entities, successors and assigns) from and against any and all claims, disputes, litigation, demands, damages, liabilities, losses, judgments, expenses, fines, contributions, charges, injuries and/or costs and expenses, including reasonable attorneys’ fees, arising or resulting from acts by You. The Owner expressly reserves the right, at its sole discretion, to reject any or all expressions of interest or offers to purchase the Property, and/or to terminate discussions with any entity at any time with or without notice which may arise as a result of review of this Memorandum. The Owner shall have no legal commitment or obligation to any entity reviewing this Memorandum or making an offer to purchase the Property unless and until written agreement(s) for the purchase of the Property have been fully executed, delivered and approved by the Owner and any conditions to the Owner's obligations therein have been satisfied or waived.
Copyright © 2012 Palmer Capital, Inc.All use, disclosure and/or reproduction not specifically authorized is prohibited. All rights reserved. 00963368
(916) 446-8700 • www.palmercapital.com
SORENSONRESEARCH PARK

IntroductIon
ProPerty SPecIfIcS
fInancIal analySIS
tenant/leaSe InformatIon
market InformatIon
4 ExecutiveSummary
9 InvestmentHighlights
14 AdjacentOwners
20 ParcelMap
21 FloorPlans
28 DueDiligence
30 CashFlowAnalysis
32 RentRoll
34 RentRollComments
40 LeaseRollover
44 ReplacementCost
45 TenantProfiles
47 City/CountyInterviews
49 MarketAnalysis
58 Comparables
60 Maps&DrivingDirections
Table of ConTenTs | 3

SORENSONRESEARCH PARK
the offerIng:Palmer Capital is pleased to present the opportunity to acquire the 100% fee simple interest in Sorenson Research Park (the “Property”). Sorenson Research Park is located in the heart of Salt Lake within minutes from virtually anywhere in the Salt Lake Valley. This dynamic campus is comprised of six, office buildings that are 88.91% leased to a strong and diverse tenant roster, as well as one five acre parcel of land.
Sorenson Research Park offers investors the unique opportunity to acquire in one of the most stable and fastest growing economies in the Country. In addition, Investors have the opportunity to acquire Sorenson Research Park at a substan-tial discount to replacement cost with the future ability to increase NOI through rent appreciation as the Salt Lake Economy continues to grow.
Portfolio InformationBuildings: 6Developable Land: 5.07 AcresParcels: 9Rentable Area: 323,357 Square FeetParking: 5.6:1000Occupancy: 88.91%Number of Tenants: 12Net Operating Income: $3,333,228Financing: Offered Free and Clear
Property highlights• Sixbuildingcorporatecampuswithfiveacresofdevelopableofficeland.• Stabilizedwithover81%ofexistingincomefromnationallyrecognizedtenants.• Diversetenancyrepresenting10industries.• Staggeredrolloverscheduleoverthenext5years.• Flexiblefloorplatesandabilitytoaccommodatediverserangeof
tenantrequirements.• Outstandingabovemarketparkingratioof5.6:1000.• DramaticWasatchMountainViews.• AdjacentlocalamenitiesMeadowBrookGolfCourseandtheJordanRiver
ParkwayTrail.
4 | ExECuTiVESuMMARy
ExECuTiVESuMMARy | 5
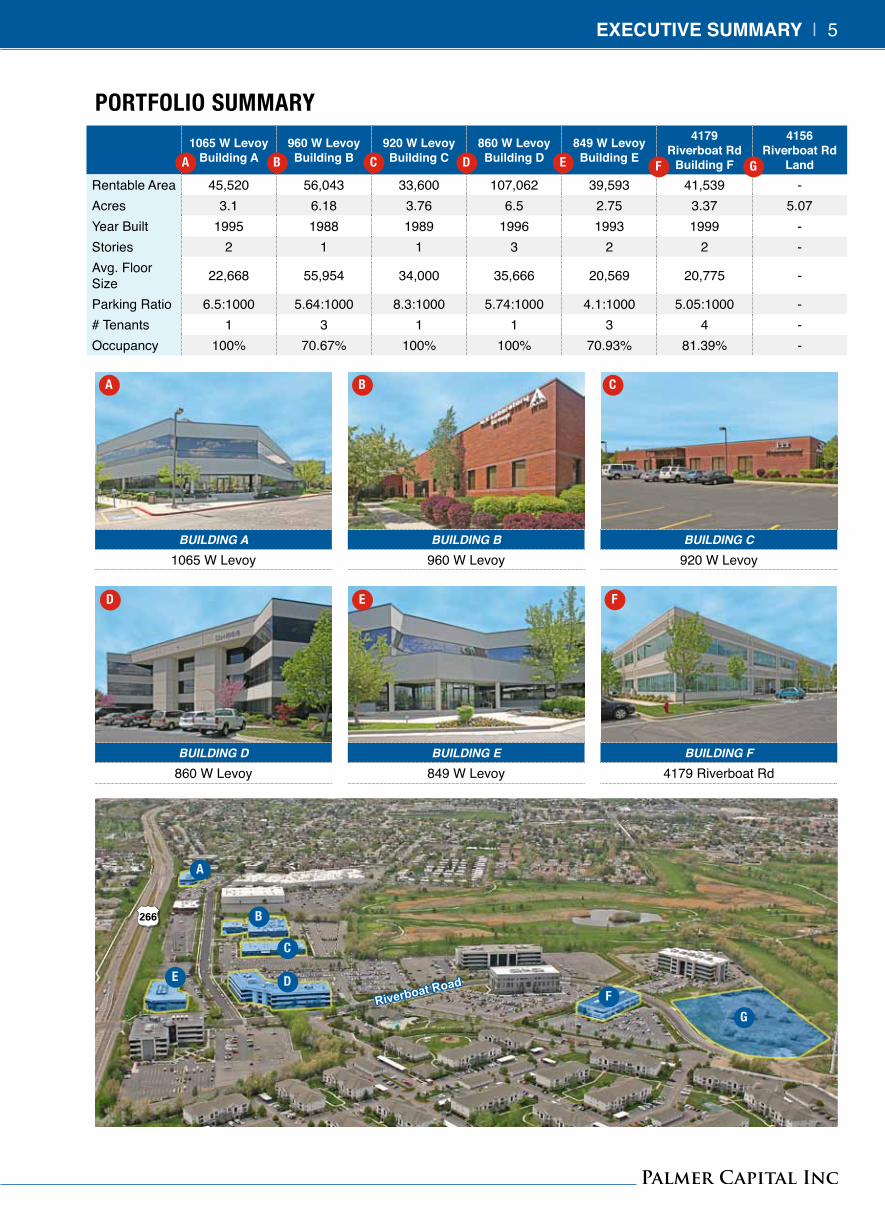
1065WLevoybuilding a
960WLevoy building b
920WLevoy building C
860WLevoy building D
849WLevoy building e
4179RiverboatRd
building f
4156RiverboatRd
landRentable Area 45,520 56,043 33,600 107,062 39,593 41,539 -Acres 3.1 6.18 3.76 6.5 2.75 3.37 5.07Year Built 1995 1988 1989 1996 1993 1999 -Stories 2 1 1 3 2 2 -Avg. Floor Size 22,668 55,954 34,000 35,666 20,569 20,775 -
Parking Ratio 6.5:1000 5.64:1000 8.3:1000 5.74:1000 4.1:1000 5.05:1000 -# Tenants 1 3 1 1 3 4 -Occupancy 100% 70.67% 100% 100% 70.93% 81.39% -
266
a
a
a
b
b
c
c
d
d
e
e
f
f
g
e
b
c
df
gRiverboat Road
Building A 1065 W Levoy
Building d860 W Levoy
Building B960 W Levoy
Building E849 W Levoy
Building C920 W Levoy
Building F4179 Riverboat Rd
PortfolIo Summary
SORENSONRESEARCH PARK
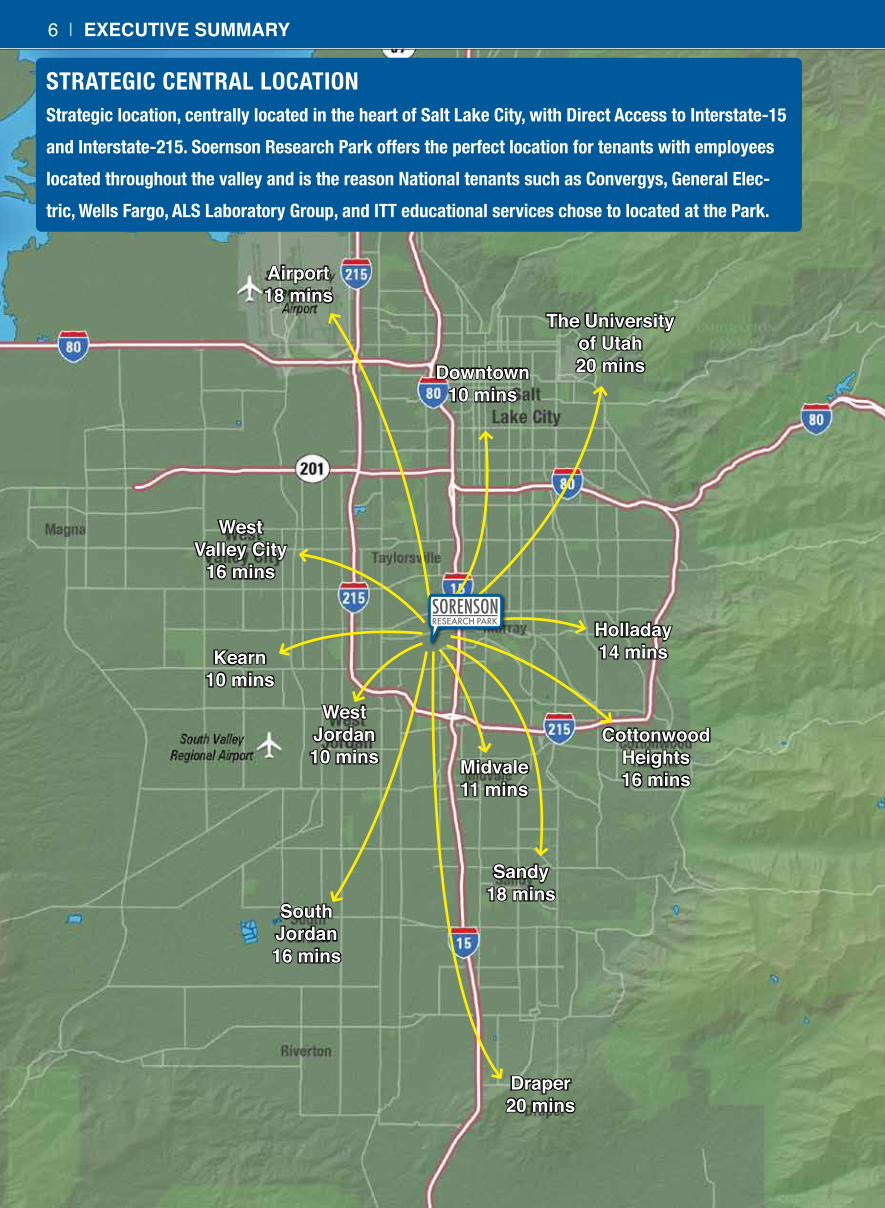
StrategIc central locatIonStrategic location, centrally located in the heart of Salt lake city, with direct access to Interstate-15
and Interstate-215. Soernson research Park offers the perfect location for tenants with employees
located throughout the valley and is the reason national tenants such as convergys, general elec-
tric, Wells fargo, alS laboratory group, and Itt educational services chose to located at the Park.
6 | ExECuTiVESuMMARy
airport18mins
south Jordan16mins
Draper20mins
Downtown10mins
West Jordan10mins
Theuniversityof Utah20mins
Holladay14mins
WestValleyCity16mins
Cottonwood Heights16mins
Kearn10mins
Sandy18mins
Midvale11mins
SORENSONRESEARCH PARK

fInancIal hIghlIghtSTenant exp Date sf %ofPortfolio
1065WestLeVoy-BldgAConvergys Customer Nov-17 45,520 14.10%960WestLeVoy-BldgBBloxr Dec-17 10,842 3.36%Insurance Company of the West Nov-13 1,127 0.35%ALS USA Corp Dec-14 27,304 8.46%920WestLeVoy-BldgCITT Educational Service Sep-16 33,600 10.41%860WestLeVoy-BldgDConvergys Customer Jun-15 107,062 33.16%849WestLeVoy-BldgEMuscular Dystrophy Association Dec-16 3,464 1.07%Richmond American Home Oct-17 6,273 1.94%Kleinfelder, Inc. Aug-13 18,235 5.65%4179RiverboatRoad-BldgFWells Fargo Dealer Services May-17 11,037 3.42%General Electric Company Feb-16 8,216 2.54%PSOMAS May-15 9,190 2.85%Best Buy Stores, L.P. Oct-13 4,227 1.31%Available 35,849 11.09%
PPr projects over 14% rent growth in the Sorenson research Park’s submarket through 2015.
market highlightsSalt Lake MSA Recognized as one of the Fastest Growing Economies in the County.• Low unemployment rate that has average below 5% for the past decade as result
of the young and well educated workforce located in the area. • Significant increase in major corporations emigrating and expanding to the region
including Goldman Sachs, Proctor & Gamble, Oracle, and Twitter. • Over 40% of the population has achieved college level education or better.• Utah’s Corporate tax rate 5% among the lowest in the country. • Utah offers the third lowest cost of doing business in the Western United States.
ExECuTiVESuMMARy | 7

1515

266
266
leadIng occuPancy rate WIthIn the Submarket The Sorenson Research Park has remained a successful and stabilized project by providing institutional space with flexibility for variety of tenant requirements. Over the past six years the Park’s occupancy has averaged 94%. In comparison, the submarket has averaged 81% occupancy.
historical vacancy
natIonally recognIzed tenantS TheSorensonResearchParkfeaturesawiderangeofcreditandnationallyrecognizedtenantsrepresentingover81%ofthein-placeincome. The national tenancy at Sorenson Research Park is a testament to the diverse range of space throughout the Park.
Belowarethenationallyrecognizedtenantscurrentlyinoccupancy:
inVESTMEnTHiGHLiGHTS | 9
INVESTMENTHIGHLIGHTS

SORENSONRESEARCH PARK
lImIted leaSe rolloverThe recent five year renewal by Convergys provides Sorenson Research Park with the benefit of limited expo-sure to lease expirations within in the first three years of new ownership. Excluding 2015, no more than 20% of the square footage rolls in any given year.
sorenson research Park
lease rollover schedule
market StabIlIty–future rent groWth Rental rates in the Salt Lake City office market have remained stable over the last decade with less than a 2% decrease peak-to-trough during the “2008-2010 global recession”. Overall rents have grown by a modest 10% over the past ten years while Salt Lake City has matured into a primary market in the Western United States. Salt Lake City is now recognized as one of the primary markets for reloca-tion and expansion in the Western United States by major national and global employers including Oracle, Goldman Sachs, Adobe, and Proctor & Gamble.
Based on projections by Property and Portfolio Research “PPR”, the Sorenson Research Park submarket “East Central Valley” is projected to increase by over 13.5% by 2015, creating the opportunity for investors to increase net operating income in the future.
market stability future rent growth
toP tIer job groWth Salt Lake City’s non-farm employment is projected by Moody’s to increase by 8.7% and produce an additional 54,000 jobs by 2016. Specifically office employment is projected to increase by 21,800 jobs over the same time period. Assuming 200 square feet per employee, an additional 4.36 million square feet of office space will be absorbed over the next 5 years.
jobs Projection
10 | inVESTMEnTHiGHLiGHTS

loWeSt unemPloyment rate In WeStern uS SaltLakeCityboastsa5.9%unemploymentrate,thelowestamongstallMetropolitanareasintheWesternunitedStates.
QualIfIed labor PoolSalt Lake City is renowned for its educational attainment, provided primarily through the University of Utah and Brigham Young University with a combined enrollment of more than 60,000. Furthermore, there are ten additional major colleges and institutions with additional enrollment totaling approximately 140,000 students in the region. The Metro has one of the nation’s highest degree attainment rates, with approximately 39% of the population ages 25 and over possessing at minimum an associate’s degree.
loWer coSt of buSIneSSAdditional drivers for businesses in Salt Lake City include energy costs that are 31% below the national average and a corporate tax rate of only 5%, which is well below the national average of 6.2%.
Due to these reasons as well as the number of qualified employees that are drawn to the region to capitalize on a high quality of life, Salt Lake City boasts the second largest concentration of Goldman Sachs employees in the nation. Furthermore, Procter & Gamble, ITT, Home Depot and Boeing all announced expansions in Utah this year.
inVESTMEnTHiGHLiGHTS | 11
SORENSONRESEARCH PARK
215
15
15
15215
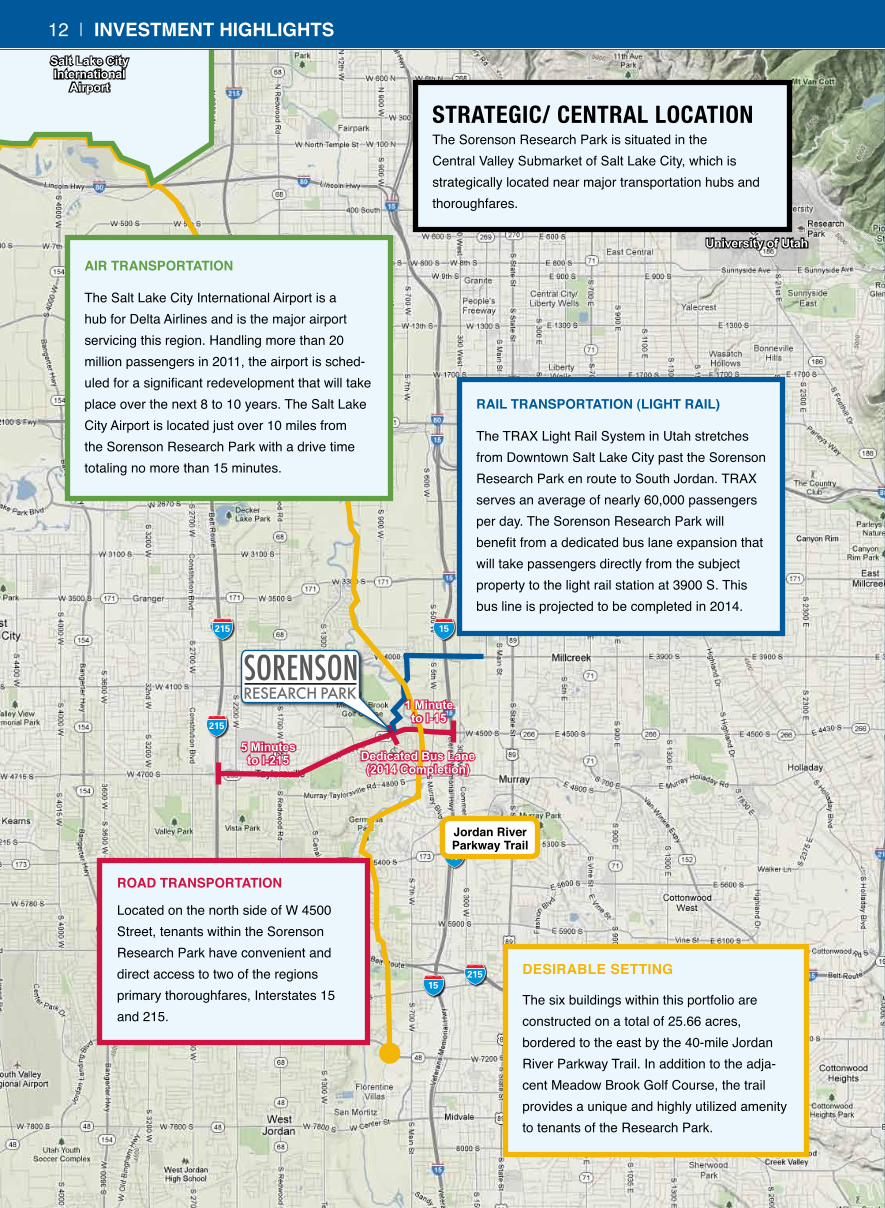
StrategIc/ central locatIonThe Sorenson Research Park is situated in the Central Valley Submarket of Salt Lake City, which is strategically located near major transportation hubs and thoroughfares.
ROADTRAnSPORTATiOn
Located on the north side of W 4500 Street, tenants within the Sorenson Research Park have convenient and direct access to two of the regions primary thoroughfares, Interstates 15 and 215.
AiRTRAnSPORTATiOn
The Salt Lake City International Airport is a hub for Delta Airlines and is the major airport servicing this region. Handling more than 20 million passengers in 2011, the airport is sched-uled for a significant redevelopment that will take place over the next 8 to 10 years. The Salt Lake City Airport is located just over 10 miles from the Sorenson Research Park with a drive time totaling no more than 15 minutes.
RAiLTRAnSPORTATiOn(LiGHTRAiL)
The TRAX Light Rail System in Utah stretches from Downtown Salt Lake City past the Sorenson Research Park en route to South Jordan. TRAX serves an average of nearly 60,000 passengers per day. The Sorenson Research Park will benefit from a dedicated bus lane expansion that will take passengers directly from the subject property to the light rail station at 3900 S. This bus line is projected to be completed in 2014.
DESiRABLESETTinG
The six buildings within this portfolio are constructed on a total of 25.66 acres, bordered to the east by the 40-mile Jordan River Parkway Trail. In addition to the adja-cent Meadow Brook Golf Course, the trail provides a unique and highly utilized amenity to tenants of the Research Park.
215
Salt Lake CityInternational
Airport
University of Utah
Dedicated Bus Lane(2014 Completion)
JordanRiverParkwayTrail
5 Minutesto I-215
1 Minute to I-15
12 | inVESTMEnTHiGHLiGHTS
SORENSONRESEARCH PARK
266
WestLevoyR
oad
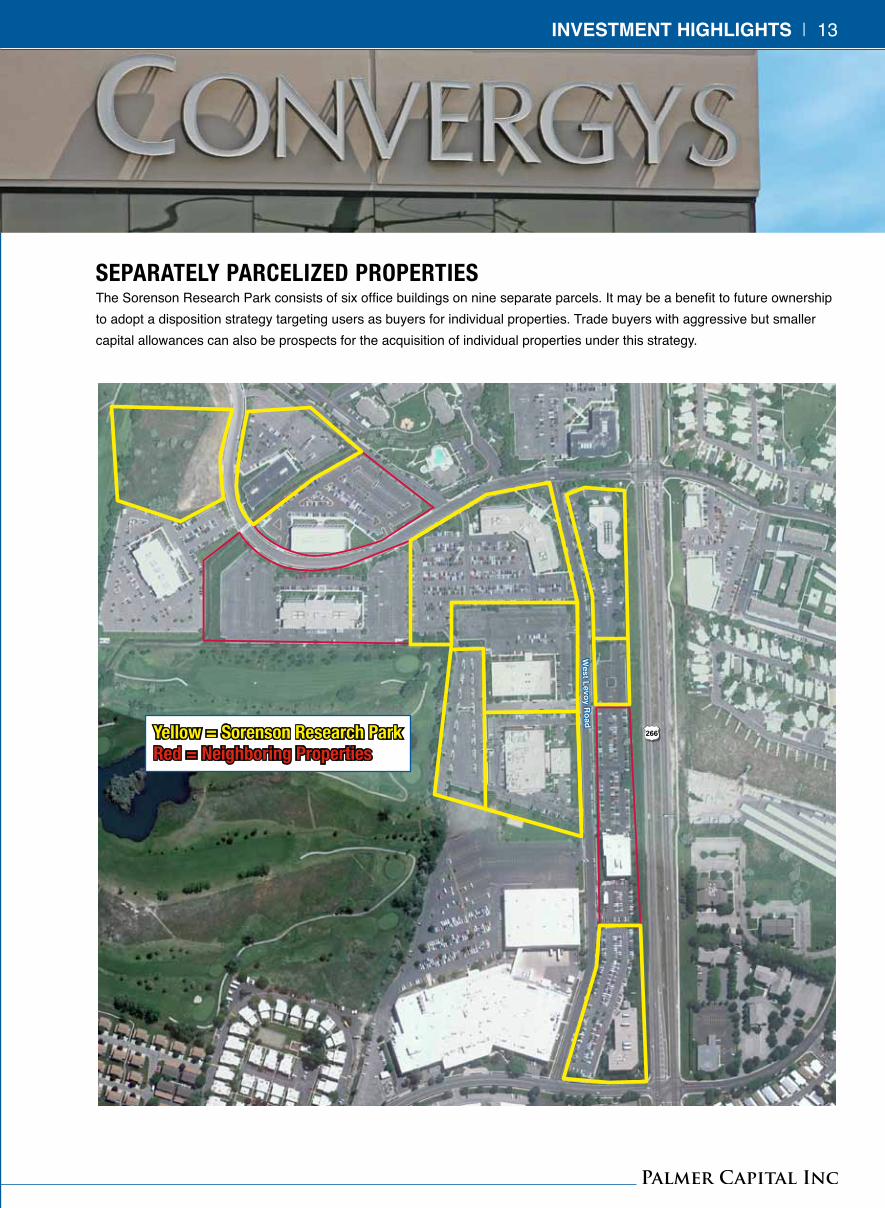
SeParately ParcelIzed ProPertIeSThe Sorenson Research Park consists of six office buildings on nine separate parcels. It may be a benefit to future ownership to adopt a disposition strategy targeting users as buyers for individual properties. Trade buyers with aggressive but smaller capital allowances can also be prospects for the acquisition of individual properties under this strategy.
University of Utah
yellow = Sorenson research Parkred = neighboring Properties
inVESTMEnTHiGHLiGHTS | 13

SORENSONRESEARCH PARK
101
266
15
2. 4215 South Riverboat Road - Utah
Capital
3. 4246 South Riverboat Road -
Mikami Brothers
4. 4393 South Riverboat Road - Utah
Capital
5. 4455 South Atherton Drive - ICU
Medical
6. 995 West Levoy Drive - Westwood
Incorporated
7. Atherton Storage - Wexford Capital
Corporation
8. 4314 Zevex Park Lane - MOOG
9. 663 West 4100 South - Jim Clark
10. 4170 South 500th West - Salt Lake
County Cottonwood
11. 469 West 4500 South - Fresh Air
Environmental
12. 549 West 4500 South - Margin
Properties
13. 4546 South Atherton Drive - Bud
Harley
14. Future Vision Technologies
15. Atherton Park - Walter Bowen
16. 4192 South Riverboat Road - Utah
Capital
17.
Office
Retail
Industrial
Multi-Family
Legend1. Subject Property
Riverboat Road Levoy Drive
Atherton Drive
Enterprise Way
DT Salt Lake City6 Miles
Mill Creek 2.5 Miles
Meadow Brook Golf Course
Jordan River
3
4
6
14
16
8 II
912
ADJACEnTOWnERS | 1514 | ADJACEnTOWnERS
11
132
10
5
7
15

SORENSONRESEARCH PARK
2. 4215 South Riverboat Road - Utah Capital
3. 4246 South Riverboat Road - Mikami Brothers
4. 4393 South Riverboat Road - Utah Capital
5. 4455 South Atherton Drive - ICU Medical
6. 995 West Levoy Drive - Westwood Incorporated
7. Atherton Storage - Wexford Capital Corporation
8. Future Vision Technologies9. 549 West 4500 South - Margin
Properties10. 469 West 4500 South - Fresh Air
Environmental11. Bridge Building - WLA Investments12. Cedar Plaza - Private Owners13. ICH Childrens Hospital14. 747 West 2150 North - WCS
Investments15. Confluence Place - Office Industrial
- Condos16. 4282 South 590 West - Bridgewater
Incorporated17. 4314 Zevex Park Lane - MOOG18. 649 West 4330 South - Ashlin
Investment19. 597 West 4330 South - Harrison
Properties 20. Fairfield Inn 21. Itermountain Medical Center22. Stevens-Henager Building - Cresa23. SelectHealth Headquarters 24. 4192 South Riverboat Road - Utah
Capital25.
Office
Retail
Industrial
Hotel
Medical
Legend1. Subject Property
266
15
Riverboat Road
Jordan River
Meadow Brook Golf Course
14
15
16 17
1819
ADJACEnTOWnERS | 1716 | ADJACEnTOWnERS
10
2 3
24
8
11
22
231213
21
4 5
6
79
I
20
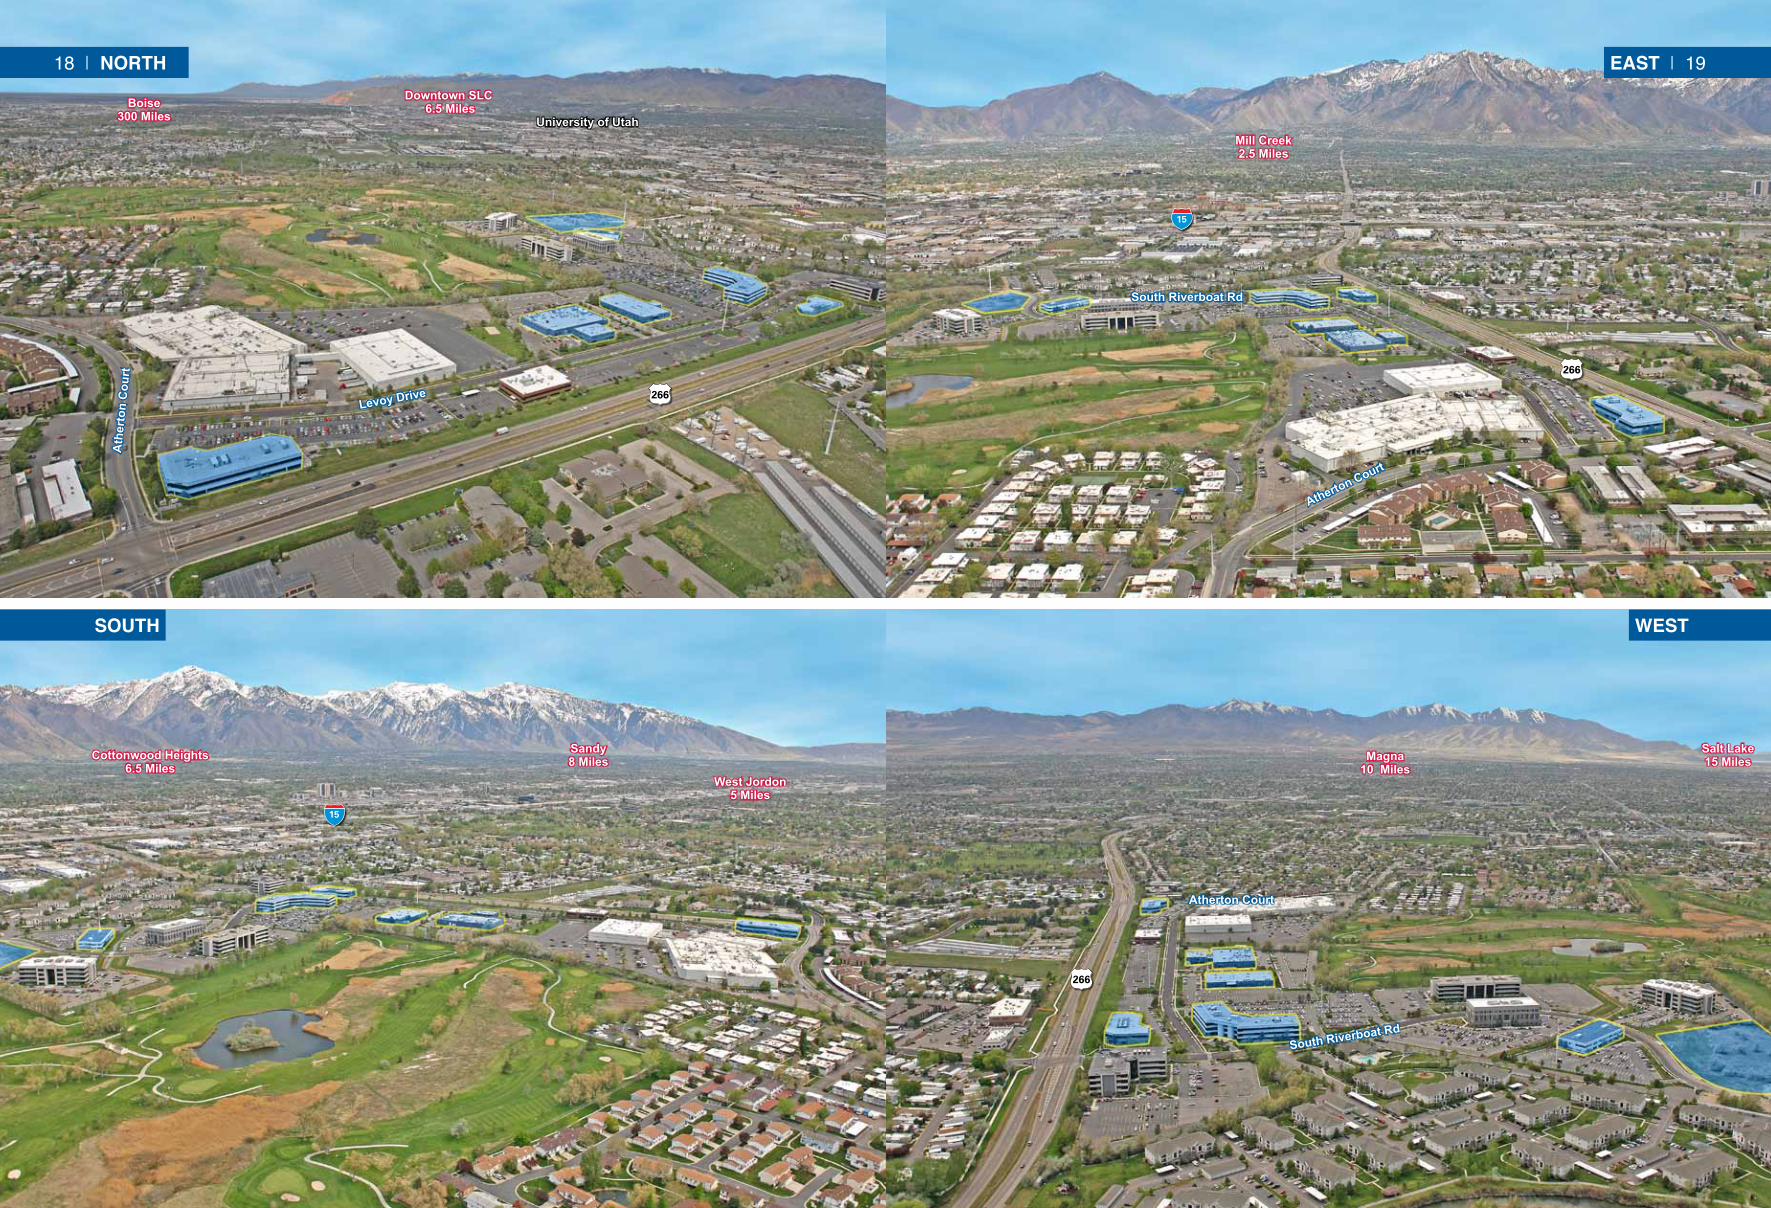
266
266
266
15
15
South Riverboat Rd
South Riverboat Rd
Ath
erto
n C
ourt
Levoy Drive
Atherton Court
Atherton Court
University of UtahBoise
300 Miles
Downtown SLC 6.5 Miles
West Jordon5 Miles
Sandy8 MilesCottonwood Heights
6.5 MilesSalt Lake 15 MilesMagna
10 Miles
Mill Creek2.5 Miles
easT | 19
WesT
18 | nORTH
soUTH

SORENSONRESEARCH PARK
266
WestLevoyR
oad
20 | PARCELMAP
Parcel Descriptionsubject Properties
1
21-02-252-001-000021-02-402-003-000021-02-401-001-000021-02-251-021-000021-02-251-020-000021-02-251-015-000021-02-251-012-000021-02-329-004-0000
name:Subject Property Owner: Owner use:Zoning / Acreage / SF
surrounding Properties
2 21-02-201-005-0000name:4192 S Riverboat Road Owner: Utah Capitaluse:Office / 6.12 Acres / 96,792 SF
3 21-02-251-014-0000name:4246 S Riverboat Owner: Mikami Brothers use:Office / 6.5 Acres / 121,716 SF
4 21-02-252-002-0000name:4215 S Riverboat Road Owner: Utah Capital use:Office / 4.27 Acres / 81,184 SF
5 21-02-252-002-0000name:4341 S Riverboat Road Owner: Fairstone Associates use:Residential / 28.61 Acres / 40,348 SF
6 21-02-328-004-0000name:4455 S Atherton Dr Owner: ICU Medical Inc use: Office / 18.5 Acres / 805,860 SF
7 21-02-329-002-0000name:995 W Levoy Drive Owner: Converg Office LLC use:Office / 3 Acres / 130,680 SF
SouthR
iverboa
tRoad

2015-1720132012 20142011Available
1065 W levoy - bldg a
960 W levoy - bldg b
FLOORPLAnS | 21
alS uSa corP 27,304 Sf
exP dec-14 SuIte 150-115
avaIlable7,271 Sf
SuIte 105-110
avaIlable2,931 Sf
SuIte 190 bloxr3,685 Sf
exP dec-17 SuIte 170
bloxr7,157 Sf
exP dec-17 SuIte 100
convergyS 45,520 Sf
exP nov-17 floorS 1&2
(2nd floor)
avaIlable 4,033 Sf
SuIte 200
avaIlable 2,261 Sf
SuIte 250
InSurance comPany of
the WeSt 1,127 Sf
exP nov-13 SuIte 230
SORENSONRESEARCH PARK
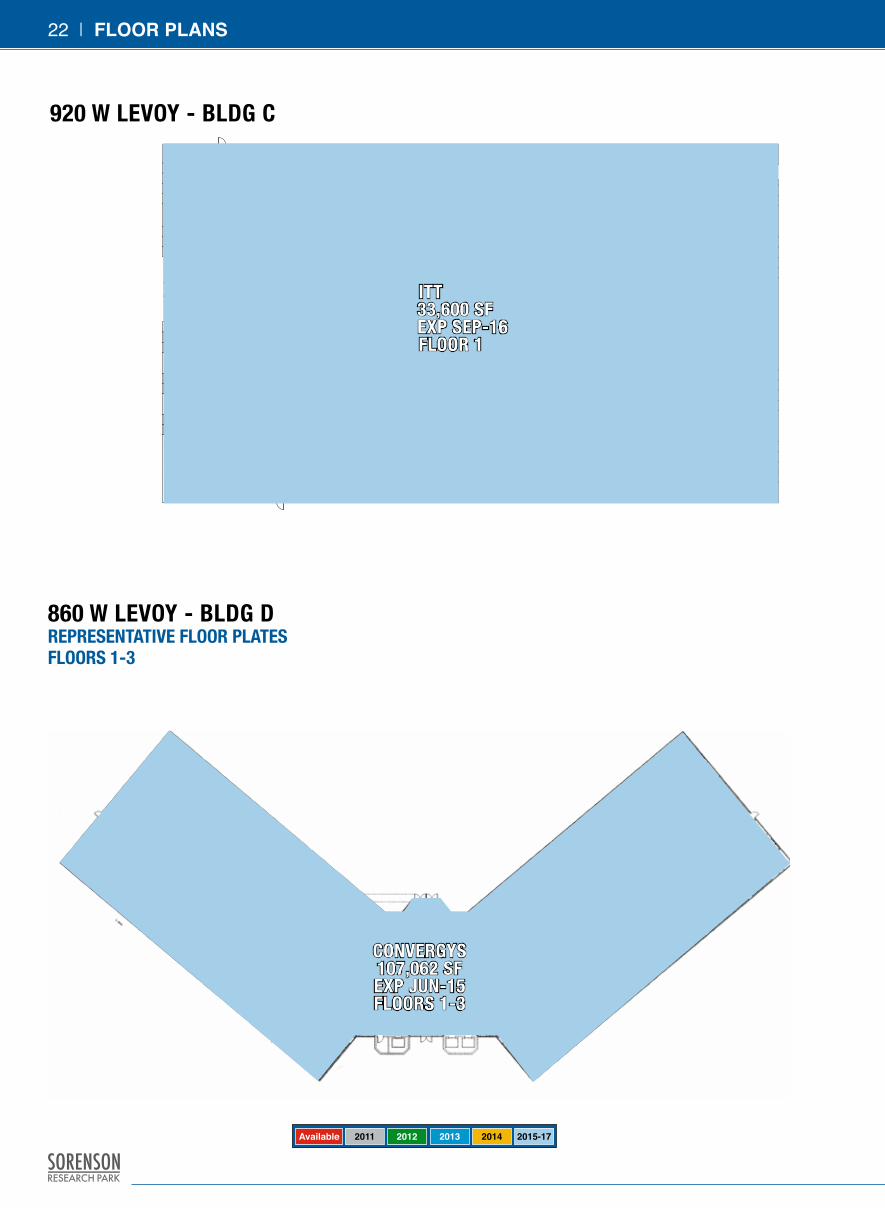
920 W levoy - bldg c
860 W levoy - bldg drePreSentatIve floor PlateSfloorS 1-3
2015-1720132012 20142011Available
22 | FLOORPLAnS
Itt33,600 Sf exP SeP-16 floor 1
convergyS 107,062 Sf exP jun-15 floorS 1-3

849 W levoy - bldg e
849 W levoy - bldg efloor tWo
2015-1720132012 20142011Available
FLOORPLAnS | 23
rIchmond amerIca1,988 Sf
exP oct-17 SuIte 108
kleInfelder, Inc8,717 Sf
exP aug-13 SuIte 110
kleInfelder, Inc9,518 Sf
exP aug-13 SuIte 200rIchmond amerIca
4,285 Sf exP oct-17 SuIte 220
muScular dyStroPhy aSSocIatIon3,464, Sf
exP dec-16 SuIte 210-215
avaIlable8,527 Sf
SuIte 100
avaIlable3,094 Sf
SuIte 220a

SORENSONRESEARCH PARK
4179 rIverboat - bldg ffloor tWo
4179 rIverboat - bldg ffloor one
2015-1720132012 20142011Available
24 | FLOORPLAnS
WellS fargo dealer ServIceS11,037 Sf
exP may-17 SuIte 104-106-110
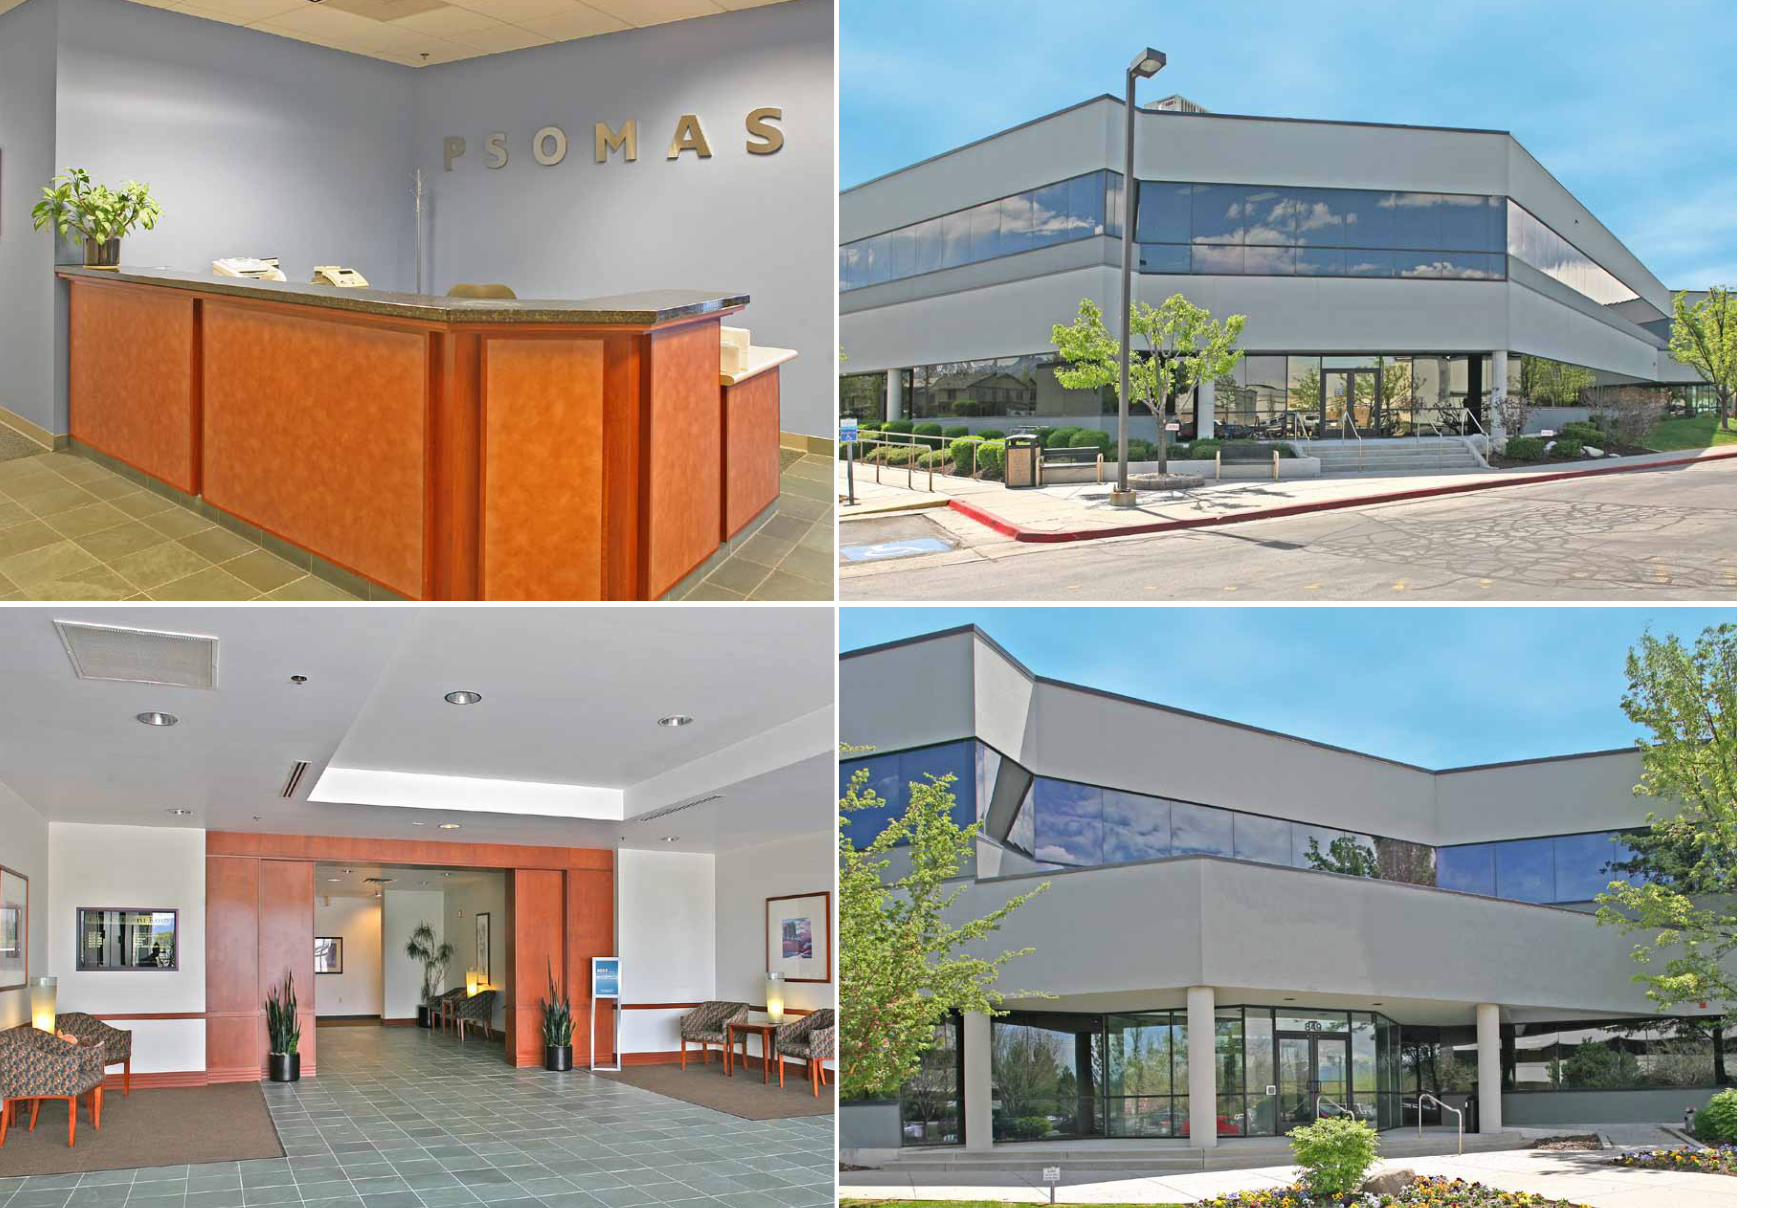
PSomaS 9,190 Sf
exP may-16 SuIte 200
avaIlable4,376 Sf
SuIte 100
avaIlable3,043 Sf
SuIte 208
beSt buy Store l.P. 4,227 Sf
exP oct-13 SuIte 102
general electrIc comPany6,093 Sf
exP feb-16 SuIte 203
general electrIc comPany2,123 Sf
exP feb-16 SuIte 206
avaIlable1,137 Sf
SuIte 205

Property Description
Address: 1065 West Levoy Bldg A
960 West Levoy Bldg B
920 West Levoy Bldg C
860 West Levoy Bldg D
849 West Levoy Bldg E
4179 Riverboat Rd Bldg F
Building Square Footage: 45,520 SF 56,043 SF 33,600 SF 107,062 SF 39,593 SF 41,539 SFYear Built: 1995 1988 1989 1996 1993 1999Land Area: 3.1 acres 6.18 acres 3.76 acres 6.5 acres 2.75 acres 3.37 acresNumber of Floors: 2 Stories 1 Story 1 Story 3 Stories 2 Stories 2 Stories Ceiling Heights: (Slab to Slab) 12’ 8’9” lab area single level; 2
story 13’ 8’6” single level building 15’ 16’ 13’6”
Load Factor: single tenant 13.17% single tenant single tenant 10.55% 14.25%Parking: Parking Spaces & Ratio
296 parking spaces 6.5/1,000
316 parking spaces 5.64/1,000
279 parking spaces 8.3/1,000
615 parking spaces 5.74/1,000
162 parking spaces 4.1/1,000
207 parking spaces 5.05/1,000
Floor Area Ratio (FAR): 33.70% 20.80% 20.50% 37.80% 32.90% 28.10%Site Coverage: 17.40% 18.50% 20.40% 12.80% 17.80% 14.60%
Building Systems
Roof Construction:Flat, fully-adhered, mechanically-fastened single-ply
Flat, ballasted single-ply membrane systems
Flat, ballasted single-ply membrane systems
Flat, ballasted single-ply membrane systems
Flat, ballasted single-ply membrane systems
Flat, ballasted single-ply membrane systems
HVAC: Hot water boilers with coils in VAV boxes
Central systems with gas-fired rooftop units
Central systems with gas-fired rooftop units
Hot water boilers with coils in VAV boxes
Central systems with gas-fired rooftop units
Central systems with gas-fired rooftop units
Elevators:
Hydraulic Montgomery Kone 1 passenger 0 freight
Hydraulic ThyssenKrupp 1 passenger 0 freight
none
Hydraulic Dover 2 passenger 1 freight
Hydraulic Dover 1 passenger 0 freight
Hydraulic Otis 1 passenger 0 freight
Building Construction:The superstructures consist of load bearing exterior masonry walls with interior steel post, open web joist and metal decking or conventional steel framing with steel floor
beams, composite floor decks and roof trusses with metal deck roofs. The exterior treatment of each building varies from brick and curtain wall windows at the 920 and 960 Buildings to EIFS and curtain wall ribbon windows at the other buildings.
Fire/Life Safety: Wet systems, supervised fire alarm systems, horns, strobes, pull stations, and smoke detectors in all buildings Electrical: 480/277 volt, 3-phase, 4-wire service with step-down transformersBack Up Generator: Tenant Owned None None Tenant Owned None NoneFoundation: Conventional spread footings, grade walls and concrete slabs-on-grade
Utility ProvidersElectricity: Utah Power Utah Power Utah Power Utah Power Utah Power Utah PowerGas: Questar Questar Questar Questar Questar Questar
Sewer: Metropolitan Water District of Salt Lake & Sandy
Metropolitan Water District of Salt Lake & Sandy
Metropolitan Water District of Salt Lake & Sandy
Metropolitan Water District of Salt Lake & Sandy
Metropolitan Water District of Salt Lake & Sandy
Metropolitan Water District of Salt Lake & Sandy
Water: Metropolitan Water District of Salt Lake & Sandy
Metropolitan Water District of Salt Lake & Sandy
Metropolitan Water District of Salt Lake & Sandy
Metropolitan Water District of Salt Lake & Sandy
Metropolitan Water District of Salt Lake & Sandy
Metropolitan Water District of Salt Lake & Sandy
Trash: BFI Waste Systems BFI Waste Systems BFI Waste Systems BFI Waste Systems BFI Waste Systems BFI Waste Systems
Fiber Optics: Century Link & ATT XO Communications Services Structured System LLC
Real Estate Taxes
Assessor Parcel Number: 21-02-329-004-0000 21-02-401-001-0000 21-02-251-020-0000
21-02-251-012-0000 21-02-251-021-0000 21-02-251-015-0000 21-02-402-003-0000 21-02-252-001-0000
Interior Building InformationWalls: Aluminum and glass ribbon curtain wall system with EIFS on metal studs or brick masonry with aluminum and glass curtain wall systems. Windows: Aluminum-framed, tinted, insulated glass (punch & ribbon systems).
Number of Restrooms: 6 13 (4 common, 9 Tenant spaces) 4 18 (6 each floor) 4 4
Lobbies: Slate tile, quarry tile or carpeted floors, painted and vinyl wall covered walls, painted drywall or suspended acoustical tile ceilings.
Portfolio Description Number of Buildings 6 buildings and 1 land parcel Addresses 1065 West Levoy - Bldg A
960 West Levoy - Bldg B 920 West Levoy - Bldg C 860 West Levoy - Bldg D 849 West Levoy - Bldg E 4179 Riverboat Road - Bldg F 4156 Riverboat Road – Land (5 acres)
Portfolio Square Footage: 323,357
Portfolio Land Area: 30.73 acres Number of Parcels: 9Parking Spaces and Ratio 1875 spaces - 5.8:1000
Zoning Designation: The entire offering is zoned M-1 (light manufacturing).Easements/Covenants/Restrictions:
Please see Title and CC&R report on due diligence site.
Flood Zone: X Earthquake Disclosure: Zone 3
Land Description
Address 4156 Riverboat Road Land (5 acres)
Assessor Parcel Number: 21-02-201-006-0000
PRoPERTy DEScRIPTIon

27

SORENSONRESEARCH PARK
Due Diligence Itemleases
REnTROLLRent Roll May 2012Rent Roll_Feb_2012Rent Roll_Feb 20081065WestLeVoy-BldgAConvergys - Lease Profile - Bldg A Convergys - Lease and Amendments - Bldg AConvergys - Parking Lease - first, second, and third amendment - Bldg A960WestLeVoy-BldgBALSUSA Corp - Lease Profile - Bldg BALS USA Corp - Lease & Amendments -DataChemBlack & Veatch - Lease and Amendment - DataChemBlack & Veatch - Lease Profile- DataChemGeneral Dynamics - Lease Profile - Bldg BGeneral Dynamics- Lease and Amendment - Bldg BInsurance Company of the West - Lease & Amendment - Bldg BInsurance Company of the West - Lease Profile - Bldg B920WestLeVoy-BldgC ITT Educational Service - Lease Profile - Bldg CITT Educational Service - Lease and Amendments - Bldg C Lease ITTConvergys Parking - Lease Profile - Bldg C860WestLeVoy-BldgDConvergys - _Lease & Amendment - Bldg DConvergys - Lease Profiles - Bldg D849WestLeVoy-BldgEKleinfelder - Lease and Amendment - Bldg EKleinfelder - Lease Profile - Bldg EMuscular Dystrophy Association - Lease Profile - Bldg EMuscular Dystrophy Association - Lease - Bldg ERichmond American Homes - Lease and Amendments - Bldg ERichmond American Homes - Lease Profile - Bldg E4179RiverboatRoad-BldgFBest Buy- Lease Profile - Bldg FBest Buy - Lease and Amendment - Bldg FWells Fargo - Lease Profile - Bldg FWells Fargo - Lease and Amendments - Bldg FPSOMAS - Lease Profile - Bldg FPSOMAS - Lease and Amendment - Bldg FGeneral Electric - Lease Profile - Bldg FGeneral Electric - Lease and Amendment - Bldg FZiplocal/Phone Directories - Lease Profile - Bldg FZiplocal/Phone Directories - Lease and Amendment - Bldg F
operating InformationOPERATinGSTATEMEnTS4/30/12COMBINED - Statement of Ops 2011COMBINED - Statement of Ops 2010COMBINED -Statement of Ops 2009INDIVIDUAL- Statement of Ops 2011INDIVIDUAL- Statement of Ops 2010INDIVIDUAL- Statement of Ops 20091065WestLeVoy-BldgACAM Rec - 2011FY - Bldg A960WestLeVoy-BldgBCAM Rec - 2011FY - Bldg B2085B -Sorenson Datachem-CAM 11-12-GETGL 2011920WestLeVoy-BldgCCAM Rec - 2011FY - Bldg C860WestLeVoy-BldgDCAM Rec- 2011FY - Bldg D849WestLeVoy-BldgECAM Rec - 2011FY - Bldg E4179RiverboatRoad-BldgFCAM Rec - 2011FY - Bldg F2085F GETGL 2011
Physicalinformationfloor Plans1065 W Levoy - Bldg A - 2nd Floor Plans860 W LeVoy - Bldg D - Floor Plans920 W LeVoy - Bldg C - Floor Plans849 - Bldg E - 2nd Floor As-built849 - Bldg E - 1st Floor As-built4179 Riverboat - Bldg F - 2nd Floor4179 Riverboat - Bldg F - 1st Floor960 W Levoy - Bldg B - As-built
Due Diligence Item
28 | DuEDiLiGEnCE
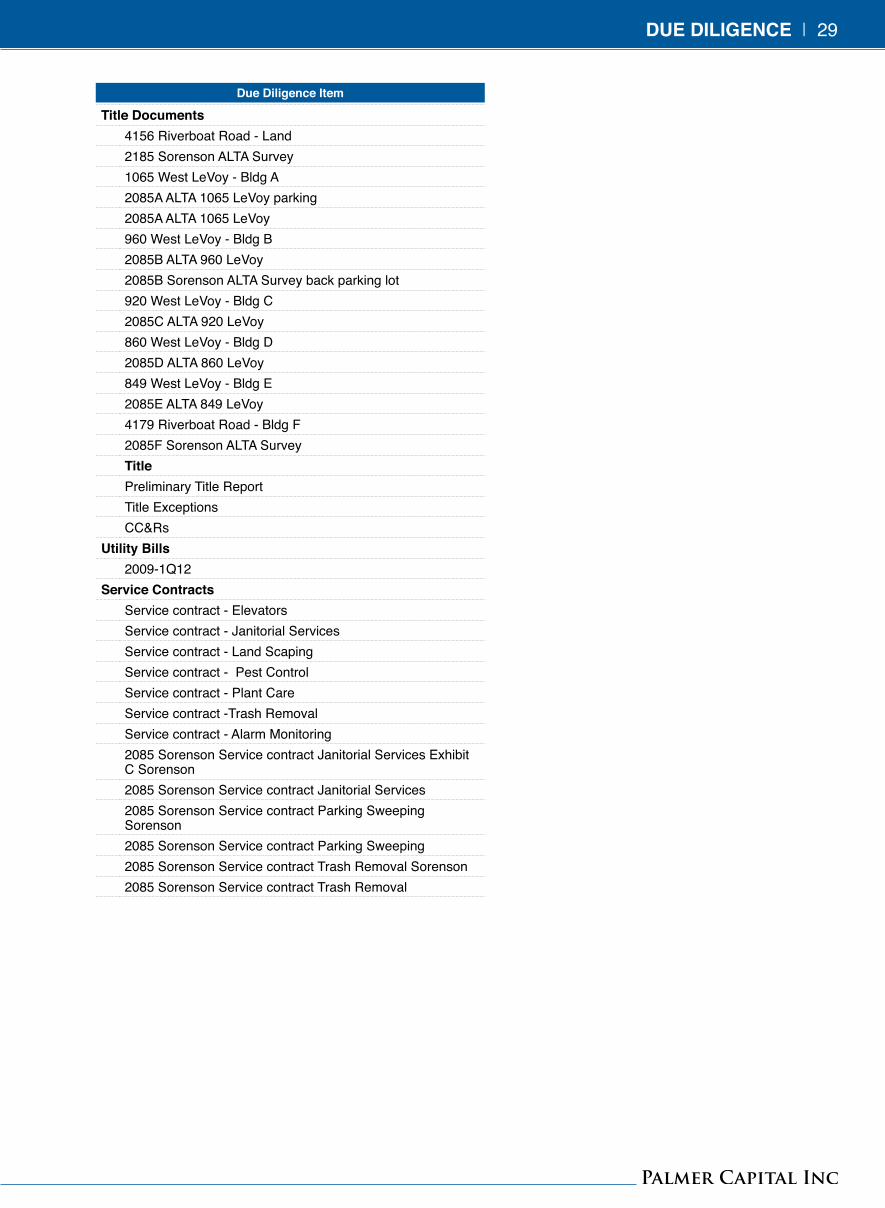
Title Documents4156 Riverboat Road - Land2185 Sorenson ALTA Survey1065 West LeVoy - Bldg A2085A ALTA 1065 LeVoy parking2085A ALTA 1065 LeVoy960 West LeVoy - Bldg B2085B ALTA 960 LeVoy2085B Sorenson ALTA Survey back parking lot920 West LeVoy - Bldg C2085C ALTA 920 LeVoy860 West LeVoy - Bldg D2085D ALTA 860 LeVoy849 West LeVoy - Bldg E2085E ALTA 849 LeVoy4179 Riverboat Road - Bldg F2085F Sorenson ALTA SurveyTitlePreliminary Title ReportTitle ExceptionsCC&Rs
utilityBills2009-1Q12
ServiceContractsService contract - ElevatorsService contract - Janitorial ServicesService contract - Land ScapingService contract - Pest ControlService contract - Plant CareService contract -Trash RemovalService contract - Alarm Monitoring2085 Sorenson Service contract Janitorial Services Exhibit C Sorenson2085 Sorenson Service contract Janitorial Services2085 Sorenson Service contract Parking Sweeping Sorenson2085 Sorenson Service contract Parking Sweeping2085 Sorenson Service contract Trash Removal Sorenson2085 Sorenson Service contract Trash Removal
operating InformationOPERATinGSTATEMEnTS4/30/12COMBINED - Statement of Ops 2011COMBINED - Statement of Ops 2010COMBINED -Statement of Ops 2009INDIVIDUAL- Statement of Ops 2011INDIVIDUAL- Statement of Ops 2010INDIVIDUAL- Statement of Ops 20091065WestLeVoy-BldgACAM Rec - 2011FY - Bldg A960WestLeVoy-BldgBCAM Rec - 2011FY - Bldg B2085B -Sorenson Datachem-CAM 11-12-GETGL 2011920WestLeVoy-BldgCCAM Rec - 2011FY - Bldg C860WestLeVoy-BldgDCAM Rec- 2011FY - Bldg D849WestLeVoy-BldgECAM Rec - 2011FY - Bldg E4179RiverboatRoad-BldgFCAM Rec - 2011FY - Bldg F2085F GETGL 2011
Physicalinformationfloor Plans1065 W Levoy - Bldg A - 2nd Floor Plans860 W LeVoy - Bldg D - Floor Plans920 W LeVoy - Bldg C - Floor Plans849 - Bldg E - 2nd Floor As-built849 - Bldg E - 1st Floor As-built4179 Riverboat - Bldg F - 2nd Floor4179 Riverboat - Bldg F - 1st Floor960 W Levoy - Bldg B - As-built
Due Diligence Item
DuEDiLiGEnCE | 29

SORENSONRESEARCH PARK
Actual Year 1 Year 2 Year 3 Year 4 Year 5 Year 6 Year 7 Year 8 Year 9 Year 10 Year 1112/01/2012 (12/12-11/13) (12/13-11/14) (12/14-11/15) (12/15-11/16) (12/16-11/17) (12/17-11/18) (12/18-11/19) (12/19-11/20) (12/20-11/21) (12/21-11/22) (12/22-11/23)
Contract Rent PSF $13.69 $14.05 $14.58 $15.14 $15.69 $16.37 $17.06 $17.72 $18.30 $18.91 $19.47 $20.04
Market Rent PSF $14.67 $14.64 $15.08 $15.84 $16.63 $17.13 $17.64 $18.17 $18.72 $19.28 $19.86 $20.45
Replacement Rent PSF $29.18 $29.18 $30.05 $30.96 $31.88 $32.84 $33.83 $34.84 $35.89 $36.96 $38.07 $39.21
Market Rent Growth 3.0% 5.0% 5.0% 3.0% 3.0% 3.0% 3.0% 3.0% 3.0% 3.0%
Contract Rent % of Market 93.3% 95.9% 96.7% 95.6% 94.3% 95.6% 96.7% 97.5% 97.8% 98.1% 98.0% 98.0%
Market Rent % of Replacement 50.3% 50.2% 50.2% 51.2% 52.2% 52.2% 52.2% 52.2% 52.2% 52.2% 52.2% 52.2%
Cumulative Rollover 7.30% 7.30% 51.69% 64.62% 85.12% 94.07% 99.56% 99.56% 99.56% 99.56% 99.56%
Potential Gross Rent $3,935,606 $4,596,115 $4,723,534 $4,905,493 $5,083,138 $5,292,455 $5,515,043 $5,729,076 $5,917,637 $6,113,295 $6,295,669 $6,479,760
Other Revenues $112,716 $112,716 $116,097 $119,581 $123,169 $126,863 $130,668 $134,589 $138,627 $142,786 $147,069 $151,480
Operating Expense Recoveries $968,751 $968,751 $1,018,207 $908,154 $1,104,190 $1,156,973 $1,168,077 $1,183,089 $1,046,275 $1,278,203 $1,317,803 $1,351,667
Expense Recoveries of Total Expenses 57.53% 57.61% 58.23% 50.66% 59.47% 60.36% 59.25% 58.15% 50.19% 59.13% 59.26% 59.05%
Potential Gross Revenue $5,017,073 $5,623,281 $5,848,438 $5,923,546 $6,300,525 $6,576,291 $6,813,788 $7,046,754 $7,102,539 $7,534,284 $7,760,541 $7,982,907
Downtime Allowance $(601,194) $(100,196) $(343,783) $(112,137) $(62,581) $(250,361) $(132,699) $(406,277) $(34,160) $(159,248) $(245,910)
Downtime of Potential Gross Revenue 10.69% 1.71% 5.80% 1.78% 0.95% 3.67% 1.88% 5.72% 0.45% 2.05% 3.08%
Physical Occupancy 88.91% 89.19% 98.22% 92.60% 97.84% 99.09% 95.79% 98.08% 92.60% 99.58% 97.52% 96.36%
Economic Vacancy Allowance $(85,746) $(105,766) $(45,855) $(147,037) $(149,440) $(99,928) $(126,149) $(74,019) $(195,589) $(166,322) $(126,594)
Economic Vacancy of Potential Gross Revenue 1.52% 1.81% 0.77% 2.33% 2.27% 1.47% 1.79% 1.04% 2.60% 2.14% 1.59%
Economic Occupancy 87.78% 96.48% 93.42% 95.89% 96.78% 94.86% 96.33% 93.24% 96.95% 95.80% 95.33%
Effective Gross Income $5,017,073 $4,936,341 $5,642,476 $5,533,908 $6,041,351 $6,364,270 $6,463,499 $6,787,906 $6,622,243 $7,304,535 $7,434,971 $7,610,403
Real Estate Tax Expense $403,552 $403,552 $415,660 $428,128 $440,972 $454,201 $467,827 $481,863 $496,319 $511,207 $526,545 $542,340
Operating Expenses $1,078,940 $1,078,940 $1,111,307 $1,144,647 $1,178,986 $1,214,355 $1,250,788 $1,288,309 $1,326,961 $1,366,768 $1,407,771 $1,450,005
Insurance Expense $50,840 $50,840 $52,366 $53,935 $55,554 $57,222 $58,938 $60,707 $62,526 $64,404 $66,334 $68,326
Management Fee Expense $150,513 $148,091 $169,274 $166,018 $181,241 $190,929 $193,906 $203,638 $198,667 $219,136 $223,049 $228,311
Total Expenses $1,683,845 $1,681,423 $1,748,607 $1,792,728 $1,856,753 $1,916,707 $1,971,459 $2,034,517 $2,084,473 $2,161,515 $2,223,699 $2,288,982
Expenses PSF $5.21 $5.20 $5.41 $5.54 $5.74 $5.93 $6.10 $6.29 $6.45 $6.68 $6.88
Net Operating Income $3,333,228 $3,254,918 $3,893,869 $3,741,180 $4,184,598 $4,447,563 $4,492,040 $4,753,389 $4,537,770 $5,143,020 $5,211,272 $5,321,421
Change From Actual (2.3)% 16.8% 12.2% 25.5% 33.4% 34.8% 42.6% 36.1% 54.3% 56.3% 59.6%
Tenant Improvements $350,310 $323,899 $1,370,687 $80,801 $487,242 $737,354 $552,380 $1,589,001 $93,670 $564,848 $794,392
Leasing Commissions $133,385 $118,417 $410,669 $35,200 $164,093 $253,395 $218,700 $485,321 $40,806 $190,229 $270,130
Capital Reserve $462,503 $161,961 $495,457 $477,003 $225,592 $76,227 $306,916 $254,654 $61,443 $409,289 $65,184
Total Capital Costs $946,198 $604,277 $2,276,813 $593,004 $876,927 $1,066,976 $1,077,996 $2,328,976 $195,919 $1,164,366 $1,129,706
Cumulative Capital Costs $946,198 $1,550,475 $3,827,288 $4,420,292 $5,297,219 $6,364,195 $7,442,191 $9,771,167 $9,967,086 $11,131,452 $12,261,158
Net Cash Flow - UnLeveraged $3,333,228 $2,308,720 $3,289,592 $1,464,367 $3,591,594 $3,570,636 $3,425,064 $3,675,393 $2,208,794 $4,947,101 $4,046,906 $4,191,715
Debt Service $682,500 $682,500 $682,500 $1,096,720 $1,096,720 $1,096,720 $1,096,720 $1,096,720 $1,096,720 $1,096,720 $1,096,720 $1,096,720
Debt Coverage Ratio 4.88 4.77 5.71 3.41 3.82 4.06 4.10 4.33 4.14 4.69 4.75 4.85
Cumulative Net Cash Flow - Unleveraged $2,308,720 $5,598,312 $7,062,679 $10,654,273 $14,224,909 $17,649,973 $21,325,366 $23,534,160 $28,481,261 $32,528,167 $36,719,882
Cumulative Net Cash Flow - Leveraged $1,626,220 $4,233,312 $4,600,959 $7,095,833 $9,569,749 $11,898,093 $14,476,766 $15,588,840 $19,439,221 $22,389,407 $25,484,402
1 The in-place contract rents are a ±7% discount to the current blended market rent.2 Replacement cost estimated at ±$228 PSF which based on a 10% developer return requires a $29.18 PSF rent to justify
new construction. Economic barrier to new competition in the market given current market rents are nearly 50% of replacement rent.
3 Market rent growth underwritten for the analysis.4 Limited tenant lease term expiration exposure within the first 24 months of ownership. We underwrote a 75% retention
rate at expiration terms.5 The 1065, 920, and 860 building collect $112,716 of other revenues in year 1 of the analysis through parking income and
antenna income.6 Currently the portfolio is recovering 57.53% of expenses.7 Utilized a ±3% vacancy factor throughout the analysis period.8 Total per square foot expenses in the portfolio. Please note Convergys pays a number of expenses directly. If buildings A
& D were leased on a full service/base year lease structure, expenses for these buildings would likely be higher.9 Net operating income growth from in-place which experiences significant growth starting in year 4 of the analysis.10 This Offering is an as-is/where-is purchase and any assumptions regarding capital expenditures and reserves are solely
the responsibility of the Buyer. Please note a Physical Condition Report dated July 2012 indicates recommended capital expenditures of $2.3 million over a 10-year hold for the 6 buildings. This cost has been added to the Capital Reserve in the cash flow analysis.
11 Cumulative capital required through the first five years of ownership which accounts for lease up to 97% occupancy. We utilized a $15/$7 PSF tenant improvement assumption and a 6%/3% leasing assumption throughout the analysis period.
12 Based on specific feedback from active lenders in the market, the debt service is based on a $21.0M loan at a 3.25% interest rate utilizing two years of interest-only and then a 30 year amortization schedule thereafter. The in-place cash flow provides a 4.88 debt service coverage ratio. Lenders would likely require structure around the Convergys rollover. Please contact one of Palmer Capital’s Structured Finance Partners for further details.
13 There are no negative cash flow years throughout the analysis, either on a leveraged or unleveraged basis.
1
2
5
6
8
1110
12
13
9
7
4
3
CASHFLOWAnALySiS | 3130 | CASHFLOWAnALySiS

SORENSONRESEARCH PARK
TenantSuite
% of Total
Square Ft
% of Total
Rent
Square
Footage
Actual
Monthly
Rent PSF
Market
Monthly
Rent PSF
Start
Date
End
Date
Monthly
Rent
Recovery
Method
Actual
Annual
Rent PSF
Market
Annual
Rent PSF
1065 West LeVoy - Bldg A
SRA100 CONVERGYS CUSTOMER MGMT 22,700 7.93% $1.15 $1.15Dec-95 Nov-17 7.02% $26,010 Conv NNN$13.75 $13.75
SRA200 CONVERGYS CUSTOMER MGMT 22,820 7.97% $1.15 $1.15Dec-95 Nov-17 7.06% $26,148 Conv NNN$13.75 $13.75
960 West LeVoy - Bldg B
SRB100 BLOXR 7,157 3.00% $1.38 $1.40Aug-12 Dec-17 2.21% $9,841 Std BY$16.50 $16.75
SRB105 AVAILABLE 1,587 0.00% $0.00 $1.40Aug-13 Jul-18 0.49% $0 Std BY$0.00 $16.75
SRB110 AVAILABLE 5,684 0.00% $0.00 $1.40Nov-13 Oct-18 1.76% $0 Std BY$0.00 $16.75
SRB115 ALS USA Corp 1,554 0.45% $0.94 $1.04Apr-00 Dec-14 0.48% $1,461 NNN - Data$11.28 $12.50
SRB150 ALS USA Corp 25,750 7.38% $0.94 $1.04Apr-00 Dec-14 7.96% $24,205 NNN - Data$11.28 $12.50
SRB170 BLOXR 3,685 1.54% $1.38 $1.40Aug-12 Dec-17 1.14% $5,067 Std BY$16.50 $16.75
SRB180 MGMT Ofc 274 0.00% $0.00 $1.40Aug-07 Jul-32 0.08% $0 None$0.00 $16.75
SRB190 AVAILABLE 2,931 0.00% $0.00 $1.44Feb-14 Jan-19 0.91% $0 Std BY$0.00 $17.25
SRB200 AVAILABLE 4,033 0.00% $0.00 $1.44Jul-14 Jun-19 1.25% $0 Std BY$0.00 $17.25
SRB230 INSURANCE COMPANY OF TH 1,127 0.61% $1.78 $1.40Mar-04 Nov-13 0.35% $2,008 BY 2004$21.38 $16.75
SRB250 AVAILABLE 2,261 0.00% $0.00 $1.44May-14 Apr-19 0.70% $0 Std BY$0.00 $17.25
920 West LeVoy - Bldg C
SRC100 ITT EDUCATIONAL SERVICE 33,600 9.54% $0.93 $1.08Oct-96 Sep-16 10.39% $31,304 NNN - ITT$11.18 $13.00
860 West LeVoy - Bldg D
SRD100 CONVERGYS CUSTOMER MGMT 17,689 5.60% $1.04 $1.08May-98 Jun-15 5.47% $18,352 NNN - Convergys$12.45 $13.00
SRD102 CONVERGYS CUSTOMER MGMT 10,809 3.42% $1.04 $1.08May-98 Jun-15 3.34% $11,214 NNN - Convergys$12.45 $13.00
SRD200 CONVERGYS CUSTOMER MGMT 3,415 1.08% $1.04 $1.08May-98 Jun-15 1.06% $3,543 NNN - Convergys$12.45 $13.00
SRD220 CONVERGYS CUSTOMER MGMT 30,382 9.61% $1.04 $1.08May-98 Jun-15 9.40% $31,521 NNN - Convergys$12.45 $13.00
SRD300 CONVERGYS CUSTOMER MGMT 38,030 12.03% $1.04 $1.08Sep-99 Jun-15 11.76% $39,456 NNN - Convergys$12.45 $13.00
SRD100E CONVERGYS CUSTOMER MGMT 6,737 2.13% $1.04 $1.08May-98 Jun-15 2.08% $6,990 NNN - Convergys$12.45 $13.00
849 West LeVoy - Bldg E
SRE100 AVAILABLE 8,527 0.00% $0.00 $1.45Feb-14 Jan-19 2.64% $0 Std BY$0.00 $17.46
SRE108 Richmond America 1,988 0.86% $1.41 $1.41Nov-12 Oct-17 0.61% $2,808 Std BY$16.95 $16.95
SRE110 KLEINFELDER, INC. 8,717 3.67% $1.38 $1.41Sep-03 Aug-13 2.70% $12,030 BY KleinFelder$16.56 $16.95
SRE200 KLEINFELDER, INC. 9,518 4.01% $1.38 $1.41Sep-03 Aug-13 2.94% $13,135 BY KleinFelder$16.56 $16.95
SRE210 Muscular Dystrophy Association 1,253 0.53% $1.40 $1.41Oct-11 Dec-16 0.39% $1,748 Std BY$16.74 $16.95
SRE215 Muscular Dystrophy Association 2,211 0.94% $1.40 $1.41Oct-11 Dec-16 0.68% $3,084 Std BY$16.74 $16.95
SRE220 Richmond America 4,285 1.85% $1.41 $1.41Nov-12 Oct-17 1.33% $6,053 Std BY$16.95 $16.95
SRE220A AVAILABLE 3,094 0.00% $0.00 $1.41Aug-13 Jul-18 0.96% $0 Std BY$0.00 $16.95
4179 Riverboat Road - Bldg F
SRF100 AVAILABLE 4,376 0.00% $0.00 $1.58Nov-13 Oct-18 1.35% $0 Std BY$0.00 $18.95
SRF102 BEST BUY STORES, L.P. 4,227 1.88% $1.46 $1.58May-03 Oct-13 1.31% $6,164 BY - Best Buy$17.50 $18.95
SRF104 Wells Fargo Dealer Services 4,434 2.18% $1.61 $1.58Jun-00 May-17 1.37% $7,135 BY Wells$19.31 $18.95
SRF106 Wells Fargo Dealer Services 1,160 0.57% $1.61 $1.58Sep-07 May-17 0.36% $1,867 BY Wells$19.31 $18.95
SRF108 AVAILABLE 313 0.00% $0.00 $1.58Aug-13 Jul-18 0.10% $0 Std BY$0.00 $18.95
SRF110 Wells Fargo Dealer Services 5,443 2.67% $1.61 $1.58Oct-11 May-17 1.68% $8,759 BY Wells$19.31 $18.95
SRF200 PSOMAS 9,190 4.40% $1.57 $1.58Jun-05 May-15 2.84% $14,421 BY - PSOMAS$18.83 $18.95
SRF203 General Electric Company 6,093 3.17% $1.71 $1.58Aug-07 Feb-16 1.88% $10,409 BY GE$20.50 $18.95
SRF205 ARDEN REALTY 1,137 0.00% $0.00 $1.58Aug-07 Jul-32 0.35% $0 None$0.00 $18.95
SRF206 General Electric Company 2,123 0.99% $1.52 $1.58May-11 Feb-16 0.66% $3,234 BY GE$18.28 $18.95
SRF208 AVAILABLE 3,043 0.00% $0.00 $1.58May-13 Apr-18 0.94% $0 Std BY$0.00 $18.95TenantSuite
% of Total
Square Ft
% of Total
Rent
Square
Footage
Actual
Monthly
Rent PSF
Market
Monthly
Rent PSF
Start
Date
End
Date
Monthly
Rent
Recovery
Method
Actual
Annual
Rent PSF
Market
Annual
Rent PSF
323,357 100.00% 100.00% $327,967 $1.14 $1.22
35,849 11.09%Total Available Space:
$13.69 $14.67
14 Ownership recently completed a lease extension with Convergys for an additional five years at a $13.75 NNN rent which established the market rent assumption for this building.
15 Ownership recently completed a lease with BLOXR which established the market rent assumption for this building.16 Ownership recently completed a lease with Richland America which established the market rent assumption for this
building.
14 14
15 15
15 15
16 16
16 16
REnTROLL | 3332 | REnTROLL

SORENSONRESEARCH PARK
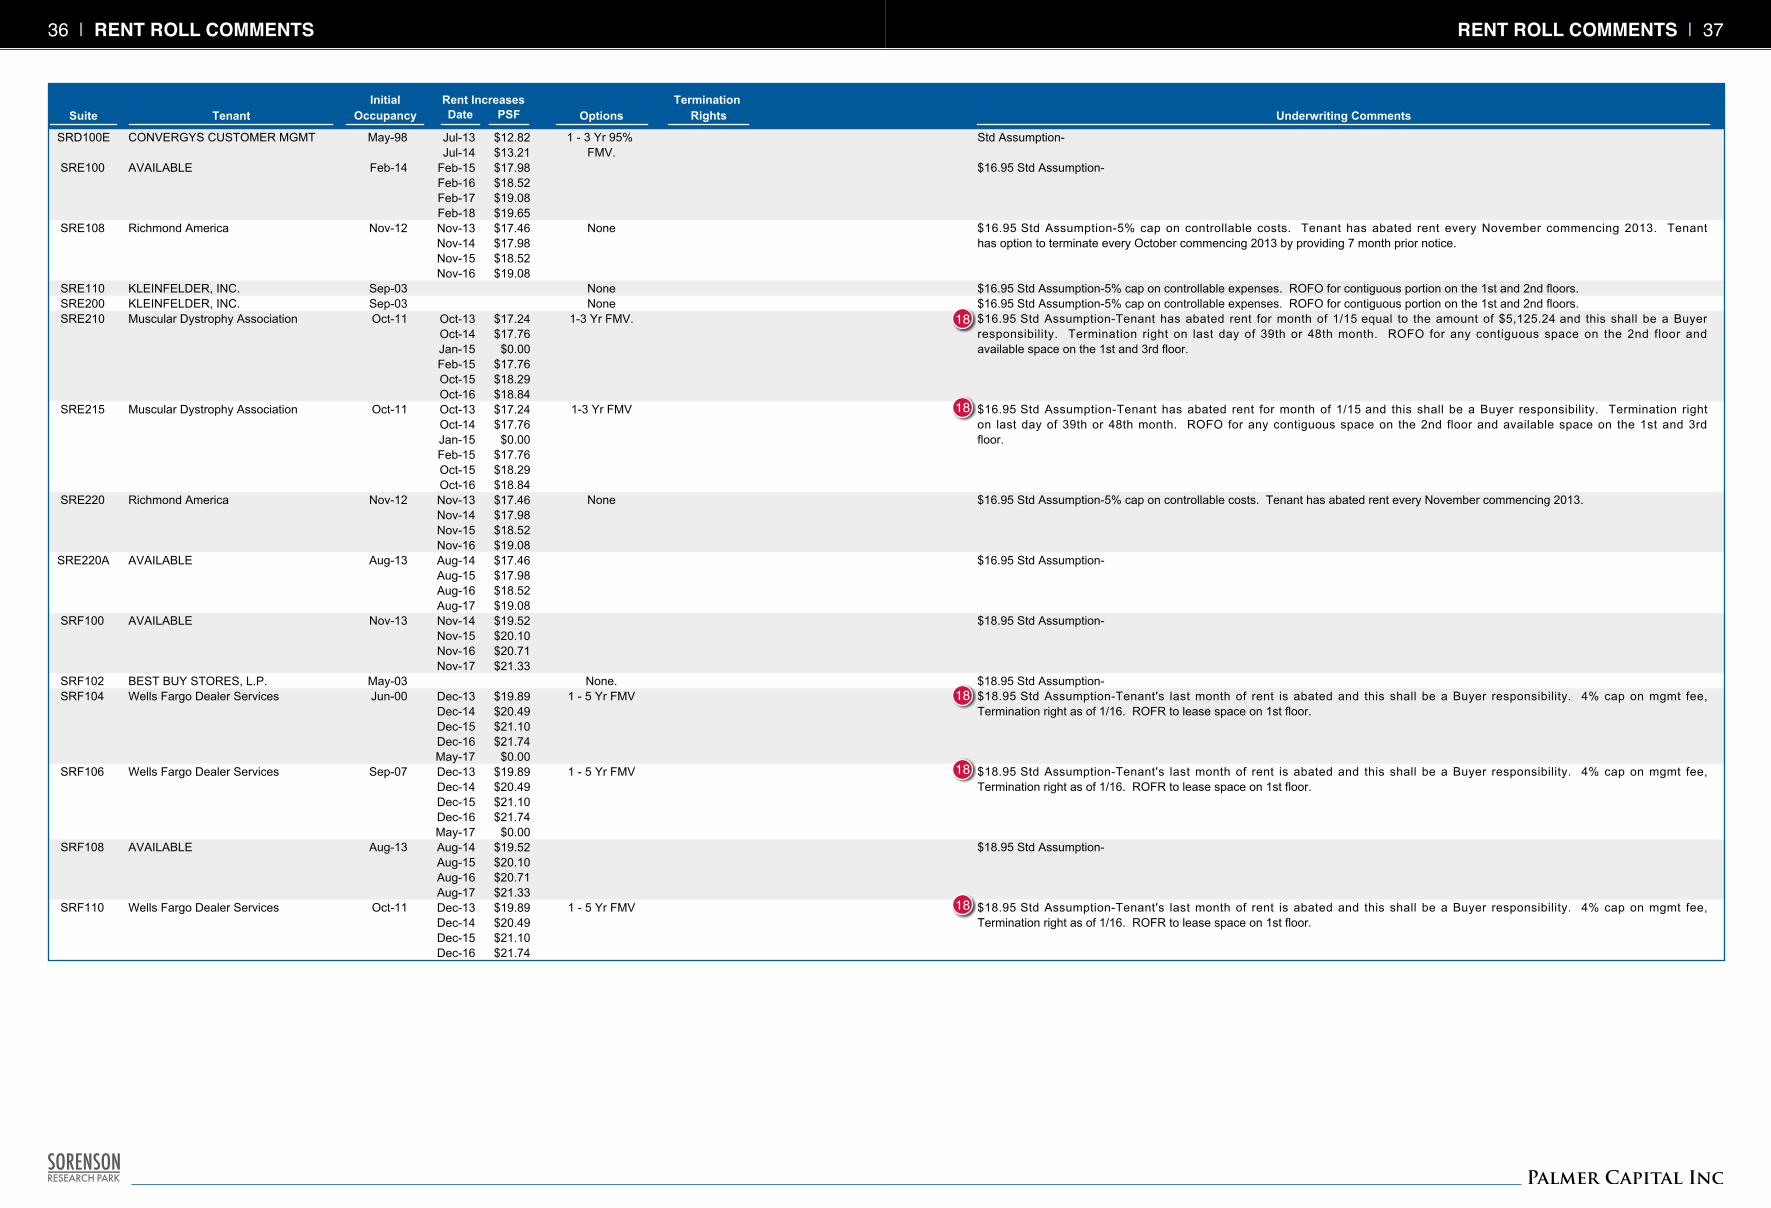
TenantSuite Date PSF
Rent Increases Termination
RightsOptions
Initial
Occupancy Underwriting Comments
SRA100 CONVERGYS CUSTOMER MGMT Dec-13 $14.16
Dec-14 $14.59
Dec-15 $15.02
Dec-16 $15.48
YDec-95 Bldg A-TI allowance of $222K shall be a Seller responsibility.
SRA200 CONVERGYS CUSTOMER MGMT Dec-13 $14.16
Dec-14 $14.59
Dec-15 $15.02
Dec-16 $15.48
YDec-95 Bldg A-
SRB100 BLOXR Aug-13 $17.00
Aug-14 $17.50
Aug-15 $18.03
Aug-16 $18.57
Aug-17 $19.13
1 - 3 Yr FMVAug-12 $16.75 Std Assumption-ROFR for Suite 110 and 190. Abated rent for 1/13, 3/13, and 8/13 is a buyer responsibility.
SRB105 AVAILABLE Aug-14 $17.25
Aug-15 $17.77
Aug-16 $18.30
Aug-17 $18.85
Aug-13 $16.75 Std Assumption-
SRB110 AVAILABLE Nov-14 $17.25
Nov-15 $17.77
Nov-16 $18.30
Nov-17 $18.85
Nov-13 $16.75 Std Assumption-
SRB115 ALS USA Corp Jan-13 $11.64
Jan-14 $12.00
1 - 5 Yr FMVApr-00 3% mgmt fee. 4% cap on controllable operating expenses. Right to purchase.
SRB150 ALS USA Corp Jan-13 $11.64
Jan-14 $12.00
1 - 5 Yr FMVApr-00 3% mgmt fee. 4% cap on controllable operating expenses. Right to purchase.
SRB170 BLOXR Aug-13 $17.00
Aug-14 $17.50
Aug-15 $18.03
Aug-16 $18.57
Aug-17 $19.13
1 - 3 Yr FMVAug-12 $16.75 Std Assumption-ROFR for Suite 110 and 190. Abated rent for 1/13, 3/13, and 8/13 is a buyer responsibility;
SRB180 MGMT Ofc Aug-07 $16.75 Std Assumption-Assume remains a Mgmt Office for the entire term of the analysis.
SRB190 AVAILABLE Feb-15 $17.77
Feb-16 $18.30
Feb-17 $18.85
Feb-18 $19.42
Feb-14 $16.75 Std Assumption-
SRB200 AVAILABLE Jul-15 $17.77
Jul-16 $18.30
Jul-17 $18.85
Jul-18 $19.42
Jul-14 $16.75 Std Assumption-
SRB230 INSURANCE COMPANY OF TH NoneMar-04 $16.75 Std Assumption-
SRB250 AVAILABLE May-15 $17.77
May-16 $18.30
May-17 $18.85
May-18 $19.42
May-14 $16.75 Std Assumption-
SRC100 ITT EDUCATIONAL SERVICE Sep-13 $11.51
Sep-14 $11.86
Sep-15 $12.21
1 - 5 Yr FMV.Oct-96 Std Assumption-TI allowance of $9/SF shall be a Seller responsibility.
SRD100 CONVERGYS CUSTOMER MGMT Jul-13 $12.82
Jul-14 $13.21
1 - 3 Yr 95%
FMV.
May-98 Std Assumption-$54,000 TI allowance shall be a Seller responsibility. Landlord shall not rent space to competitors who are
national/regional telephone marketing service bureaus.
SRD102 CONVERGYS CUSTOMER MGMT Jul-13 $12.82
Jul-14 $13.21
1 - 3 Yr 95%
FMV.
May-98 Std Assumption-
SRD200 CONVERGYS CUSTOMER MGMT Jul-13 $12.82
Jul-14 $13.21
1 - 3 Yr 95%
FMV.
May-98 Std Assumption-
SRD220 CONVERGYS CUSTOMER MGMT Jul-13 $12.82
Jul-14 $13.21
1 - 3 Yr 95%
FMV.
May-98 Std Assumption-
SRD300 CONVERGYS CUSTOMER MGMT Jul-13 $12.82
Jul-14 $13.21
1 - 3 Yr 95%
FMV.
Sep-99 Std Assumption-
17 Note Convergys Termination right.18 Note Buyer obligations for free rent.
17
17
18
18
REnTROLLCOMMEnTS | 3534 | REnTROLLCOMMEnTS
SORENSONRESEARCH PARK
TenantSuite Date PSF
Rent Increases Termination
RightsOptions
Initial
Occupancy Underwriting Comments
SRD100E CONVERGYS CUSTOMER MGMT Jul-13 $12.82
Jul-14 $13.21
1 - 3 Yr 95%
FMV.
May-98 Std Assumption-
SRE100 AVAILABLE Feb-15 $17.98
Feb-16 $18.52
Feb-17 $19.08
Feb-18 $19.65
Feb-14 $16.95 Std Assumption-
SRE108 Richmond America Nov-13 $17.46
Nov-14 $17.98
Nov-15 $18.52
Nov-16 $19.08
NoneNov-12 $16.95 Std Assumption-5% cap on controllable costs. Tenant has abated rent every November commencing 2013. Tenant
has option to terminate every October commencing 2013 by providing 7 month prior notice.
SRE110 KLEINFELDER, INC. NoneSep-03 $16.95 Std Assumption-5% cap on controllable expenses. ROFO for contiguous portion on the 1st and 2nd floors.
SRE200 KLEINFELDER, INC. NoneSep-03 $16.95 Std Assumption-5% cap on controllable expenses. ROFO for contiguous portion on the 1st and 2nd floors.
SRE210 Muscular Dystrophy Association Oct-13 $17.24
Oct-14 $17.76
Jan-15 $0.00
Feb-15 $17.76
Oct-15 $18.29
Oct-16 $18.84
1-3 Yr FMV.Oct-11 $16.95 Std Assumption-Tenant has abated rent for month of 1/15 equal to the amount of $5,125.24 and this shall be a Buyer
responsibility. Termination right on last day of 39th or 48th month. ROFO for any contiguous space on the 2nd floor and
available space on the 1st and 3rd floor.
SRE215 Muscular Dystrophy Association Oct-13 $17.24
Oct-14 $17.76
Jan-15 $0.00
Feb-15 $17.76
Oct-15 $18.29
Oct-16 $18.84
1-3 Yr FMVOct-11 $16.95 Std Assumption-Tenant has abated rent for month of 1/15 and this shall be a Buyer responsibility. Termination right
on last day of 39th or 48th month. ROFO for any contiguous space on the 2nd floor and available space on the 1st and 3rd
floor.
SRE220 Richmond America Nov-13 $17.46
Nov-14 $17.98
Nov-15 $18.52
Nov-16 $19.08
NoneNov-12 $16.95 Std Assumption-5% cap on controllable costs. Tenant has abated rent every November commencing 2013.
SRE220A AVAILABLE Aug-14 $17.46
Aug-15 $17.98
Aug-16 $18.52
Aug-17 $19.08
Aug-13 $16.95 Std Assumption-
SRF100 AVAILABLE Nov-14 $19.52
Nov-15 $20.10
Nov-16 $20.71
Nov-17 $21.33
Nov-13 $18.95 Std Assumption-
SRF102 BEST BUY STORES, L.P. None.May-03 $18.95 Std Assumption-
SRF104 Wells Fargo Dealer Services Dec-13 $19.89
Dec-14 $20.49
Dec-15 $21.10
Dec-16 $21.74
May-17 $0.00
1 - 5 Yr FMVJun-00 $18.95 Std Assumption-Tenant's last month of rent is abated and this shall be a Buyer responsibility. 4% cap on mgmt fee,
Termination right as of 1/16. ROFR to lease space on 1st floor.
SRF106 Wells Fargo Dealer Services Dec-13 $19.89
Dec-14 $20.49
Dec-15 $21.10
Dec-16 $21.74
May-17 $0.00
1 - 5 Yr FMVSep-07 $18.95 Std Assumption-Tenant's last month of rent is abated and this shall be a Buyer responsibility. 4% cap on mgmt fee,
Termination right as of 1/16. ROFR to lease space on 1st floor.
SRF108 AVAILABLE Aug-14 $19.52
Aug-15 $20.10
Aug-16 $20.71
Aug-17 $21.33
Aug-13 $18.95 Std Assumption-
SRF110 Wells Fargo Dealer Services Dec-13 $19.89
Dec-14 $20.49
Dec-15 $21.10
Dec-16 $21.74
May-17 $0.00
1 - 5 Yr FMVOct-11 $18.95 Std Assumption-Tenant's last month of rent is abated and this shall be a Buyer responsibility. 4% cap on mgmt fee,
Termination right as of 1/16. ROFR to lease space on 1st floor.
18
18
18
18
18
REnTROLLCOMMEnTS | 3736 | REnTROLLCOMMEnTS

SORENSONRESEARCH PARK
TenantSuite Date PSF
Rent Increases Termination
RightsOptions
Initial
Occupancy Underwriting Comments
SRF200 PSOMAS Jan-13 $19.40
Jan-14 $19.98
Jan-15 $20.58
2 - 5 Yr 95%
FMV
Jun-05 $18.95 Std Assumption-ROFO for space tenant vacated previously.
SRF203 General Electric Company Mar-13 $21.00
Mar-14 $21.50
Mar-15 $22.00
NoneAug-07 $18.95 Std Assumption-Utilities are not separately metered.
SRF205 ARDEN REALTY Aug-07 $18.95 Std Assumption-Assume the space remains a Management Office through the term of the analysis.
SRF206 General Electric Company May-13 $18.83
May-14 $19.39
May-15 $19.97
NoneMay-11 $18.95 Std Assumption-Utilities are not separately metered.
SRF208 AVAILABLE May-14 $19.52
May-15 $20.10
May-16 $20.71
May-17 $21.33
May-13 $18.95 Std Assumption-
REnTROLLCOMMEnTS | 3938 | REnTROLLCOMMEnTS
SORENSONRESEARCH PARK
TenantSuite
% of Total
Rent
Square
Footage
End
Date
Monthly
Rent
% of Total
Square Ft
Contract
Annual
Rent PSF
at Expiration
Market
Annual
Rent PSF
at Expiration
Option
Annual
Rent PSF
at Expiration
Market
Annual
Rent PSF
Actual
Monthly
Rent PSF
Actual
Annual
Rent PSF
Market
Monthly
Rent PSF
Available
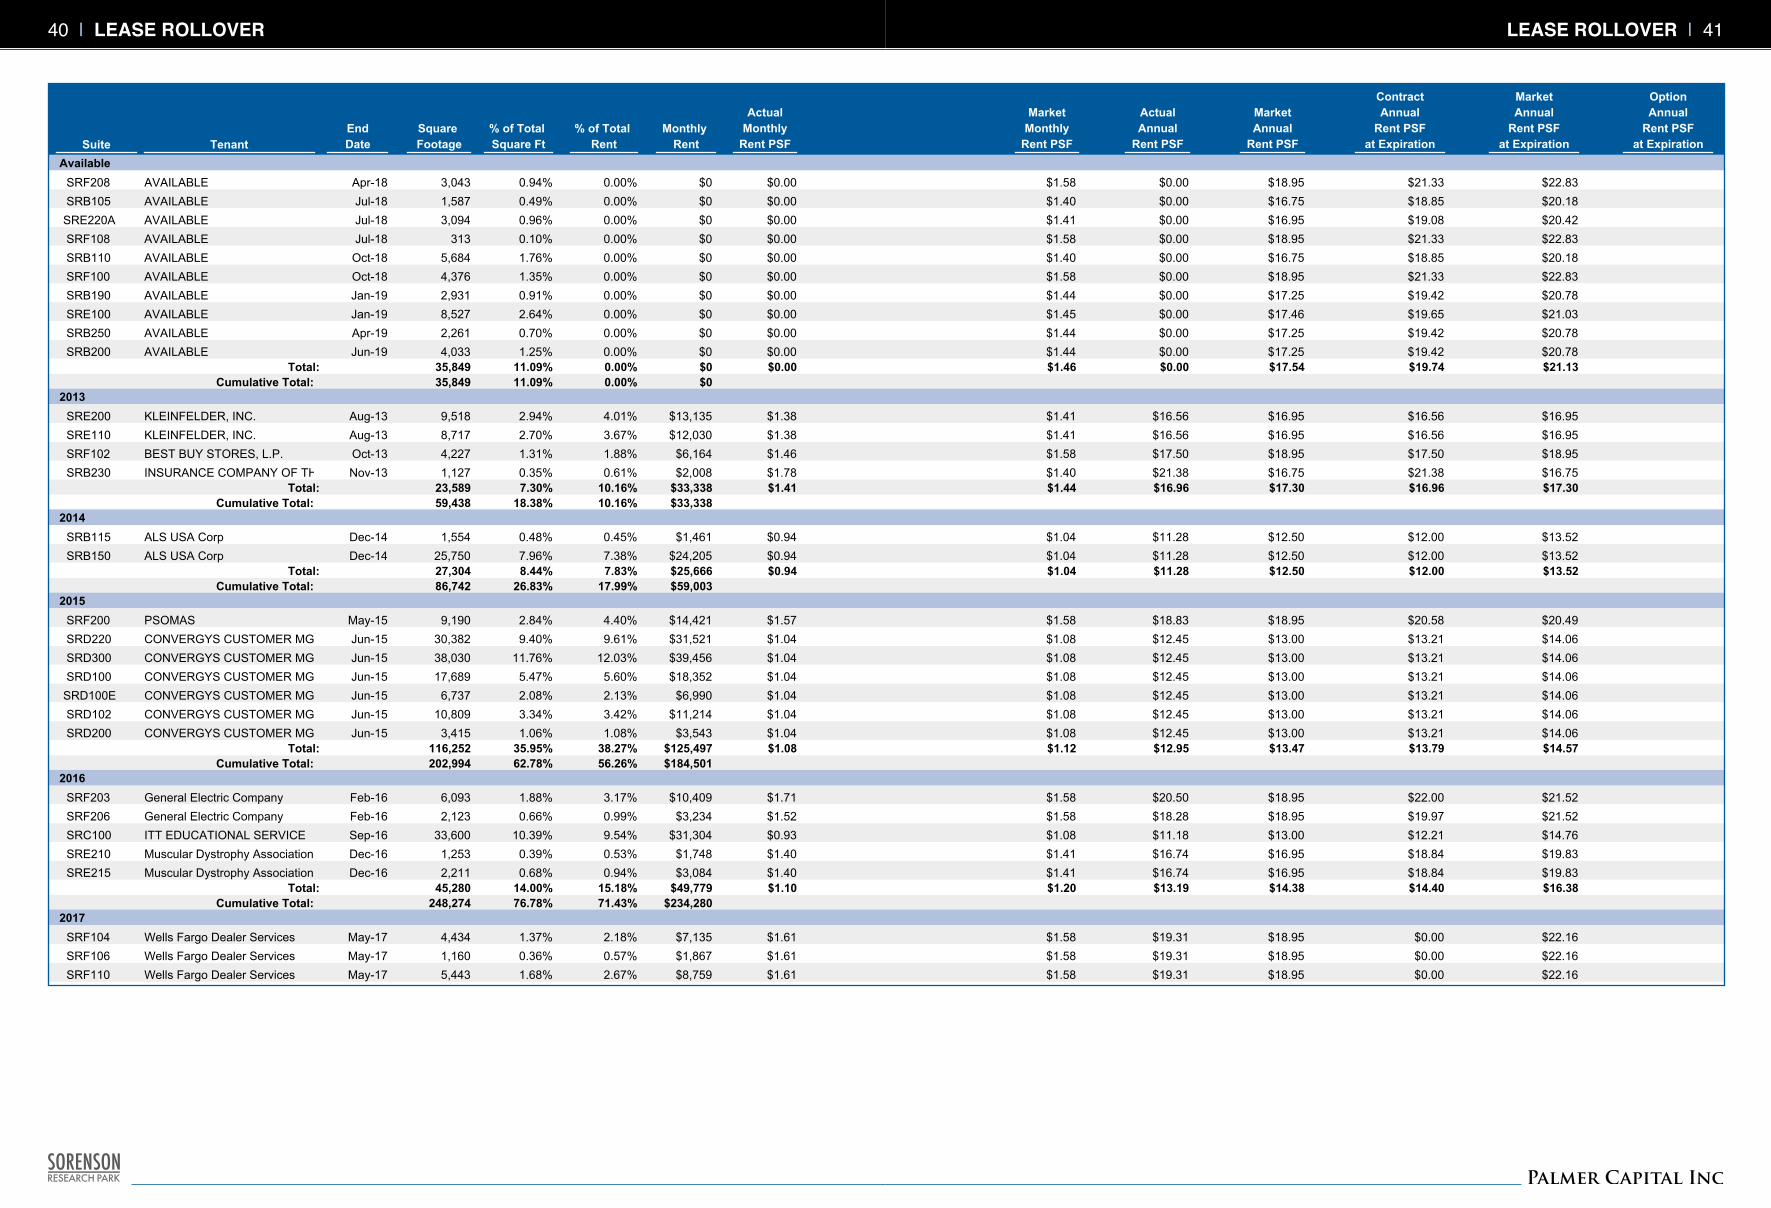
SRF208 AVAILABLE 3,043 0.00% $1.58Apr-18 0.94% $0 $18.95 $22.83$0.00 $0.00 $21.33
SRB105 AVAILABLE 1,587 0.00% $1.40Jul-18 0.49% $0 $16.75 $20.18$0.00 $0.00 $18.85
SRE220A AVAILABLE 3,094 0.00% $1.41Jul-18 0.96% $0 $16.95 $20.42$0.00 $0.00 $19.08
SRF108 AVAILABLE 313 0.00% $1.58Jul-18 0.10% $0 $18.95 $22.83$0.00 $0.00 $21.33
SRB110 AVAILABLE 5,684 0.00% $1.40Oct-18 1.76% $0 $16.75 $20.18$0.00 $0.00 $18.85
SRF100 AVAILABLE 4,376 0.00% $1.58Oct-18 1.35% $0 $18.95 $22.83$0.00 $0.00 $21.33
SRB190 AVAILABLE 2,931 0.00% $1.44Jan-19 0.91% $0 $17.25 $20.78$0.00 $0.00 $19.42
SRE100 AVAILABLE 8,527 0.00% $1.45Jan-19 2.64% $0 $17.46 $21.03$0.00 $0.00 $19.65
SRB250 AVAILABLE 2,261 0.00% $1.44Apr-19 0.70% $0 $17.25 $20.78$0.00 $0.00 $19.42
SRB200 AVAILABLE 4,033 0.00% $1.44Jun-19 1.25% $0 $17.25 $20.78$0.00 $0.00 $19.42
35,849 0.00% $1.46 11.09% $0 $17.54 $21.13Total: $0.00 $0.00 $19.74
35,849 0.00% 11.09% $0 Cumulative Total:
2013
SRE200 KLEINFELDER, INC. 9,518 4.01% $1.41Aug-13 2.94% $13,135 $16.95 $16.95$1.38 $16.56 $16.56
SRE110 KLEINFELDER, INC. 8,717 3.67% $1.41Aug-13 2.70% $12,030 $16.95 $16.95$1.38 $16.56 $16.56
SRF102 BEST BUY STORES, L.P. 4,227 1.88% $1.58Oct-13 1.31% $6,164 $18.95 $18.95$1.46 $17.50 $17.50
SRB230 INSURANCE COMPANY OF TH 1,127 0.61% $1.40Nov-13 0.35% $2,008 $16.75 $16.75$1.78 $21.38 $21.38
23,589 10.16% $1.44 7.30% $33,338 $17.30 $17.30Total: $1.41 $16.96 $16.96
59,438 10.16% 18.38% $33,338 Cumulative Total:
2014
SRB115 ALS USA Corp 1,554 0.45% $1.04Dec-14 0.48% $1,461 $12.50 $13.52$0.94 $11.28 $12.00
SRB150 ALS USA Corp 25,750 7.38% $1.04Dec-14 7.96% $24,205 $12.50 $13.52$0.94 $11.28 $12.00
27,304 7.83% $1.04 8.44% $25,666 $12.50 $13.52Total: $0.94 $11.28 $12.00
86,742 17.99% 26.83% $59,003 Cumulative Total:
2015
SRF200 PSOMAS 9,190 4.40% $1.58May-15 2.84% $14,421 $18.95 $20.49$1.57 $18.83 $20.58
SRD220 CONVERGYS CUSTOMER MGMT 30,382 9.61% $1.08Jun-15 9.40% $31,521 $13.00 $14.06$1.04 $12.45 $13.21
SRD300 CONVERGYS CUSTOMER MGMT 38,030 12.03% $1.08Jun-15 11.76% $39,456 $13.00 $14.06$1.04 $12.45 $13.21
SRD100 CONVERGYS CUSTOMER MGMT 17,689 5.60% $1.08Jun-15 5.47% $18,352 $13.00 $14.06$1.04 $12.45 $13.21
SRD100E CONVERGYS CUSTOMER MGMT 6,737 2.13% $1.08Jun-15 2.08% $6,990 $13.00 $14.06$1.04 $12.45 $13.21
SRD102 CONVERGYS CUSTOMER MGMT 10,809 3.42% $1.08Jun-15 3.34% $11,214 $13.00 $14.06$1.04 $12.45 $13.21
SRD200 CONVERGYS CUSTOMER MGMT 3,415 1.08% $1.08Jun-15 1.06% $3,543 $13.00 $14.06$1.04 $12.45 $13.21
116,252 38.27% $1.12 35.95% $125,497 $13.47 $14.57Total: $1.08 $12.95 $13.79
202,994 56.26% 62.78% $184,501 Cumulative Total:
2016
SRF203 General Electric Company 6,093 3.17% $1.58Feb-16 1.88% $10,409 $18.95 $21.52$1.71 $20.50 $22.00
SRF206 General Electric Company 2,123 0.99% $1.58Feb-16 0.66% $3,234 $18.95 $21.52$1.52 $18.28 $19.97
SRC100 ITT EDUCATIONAL SERVICE 33,600 9.54% $1.08Sep-16 10.39% $31,304 $13.00 $14.76$0.93 $11.18 $12.21
SRE210 Muscular Dystrophy Association 1,253 0.53% $1.41Dec-16 0.39% $1,748 $16.95 $19.83$1.40 $16.74 $18.84
SRE215 Muscular Dystrophy Association 2,211 0.94% $1.41Dec-16 0.68% $3,084 $16.95 $19.83$1.40 $16.74 $18.84
45,280 15.18% $1.20 14.00% $49,779 $14.38 $16.38Total: $1.10 $13.19 $14.40
248,274 71.43% 76.78% $234,280 Cumulative Total:
2017
SRF104 Wells Fargo Dealer Services 4,434 2.18% $1.58May-17 1.37% $7,135 $18.95 $22.16$1.61 $19.31 $0.00
SRF106 Wells Fargo Dealer Services 1,160 0.57% $1.58May-17 0.36% $1,867 $18.95 $22.16$1.61 $19.31 $0.00
SRF110 Wells Fargo Dealer Services 5,443 2.67% $1.58May-17 1.68% $8,759 $18.95 $22.16$1.61 $19.31 $0.00
LEASEROLLOVER | 4140 | LEASEROLLOVER

SORENSONRESEARCH PARK
TenantSuite
% of Total
Rent
Square
Footage
End
Date
Monthly
Rent
% of Total
Square Ft
Contract
Annual
Rent PSF
at Expiration
Market
Annual
Rent PSF
at Expiration
Option
Annual
Rent PSF
at Expiration
Market
Annual
Rent PSF
Actual
Monthly
Rent PSF
Actual
Annual
Rent PSF
Market
Monthly
Rent PSF
SRE220 Richmond America 4,285 1.85% $1.41Oct-17 1.33% $6,053 $16.95 $19.83$1.41 $16.95 $19.08
SRE108 Richmond America 1,988 0.86% $1.41Oct-17 0.61% $2,808 $16.95 $19.83$1.41 $16.95 $19.08
SRA100 CONVERGYS CUSTOMER MGMT 22,700 7.93% $1.15Nov-17 7.02% $26,010 $13.75 $16.08$1.15 $13.75 $15.48
SRA200 CONVERGYS CUSTOMER MGMT 22,820 7.97% $1.15Nov-17 7.06% $26,148 $13.75 $16.08$1.15 $13.75 $15.48
SRB100 BLOXR 7,157 3.00% $1.40Dec-17 2.21% $9,841 $16.75 $20.18$1.38 $16.50 $19.13
SRB170 BLOXR 3,685 1.54% $1.40Dec-17 1.14% $5,067 $16.75 $20.18$1.38 $16.50 $19.13
73,672 28.57% $1.27 22.78% $93,687 $15.24 $17.92Total: $1.27 $15.26 $14.00
321,946 100.00% 99.56% $327,967 Cumulative Total:
2023+
SRB180 MGMT Ofc 274 0.00% $1.40Jul-32 0.08% $0 $16.75 $24.10$0.00 $0.00 $0.00
SRF205 ARDEN REALTY 1,137 0.00% $1.58Jul-32 0.35% $0 $18.95 $27.26$0.00 $0.00 $0.00
1,411 0.00% $1.54 0.44% $0 $18.52 $26.65Total: $0.00 $0.00 $0.00
323,357 100.00% 100.00% $327,967 Cumulative Total:
19 This provides a unique opportunity in this real estate cycle for ownership to have each year contract rents expiring below the space’s current market rent. This will limit future ownership downside upon lease expiration.
LEASEROLLOVER | 4342 | LEASEROLLOVER
19
SORENSONRESEARCH PARK
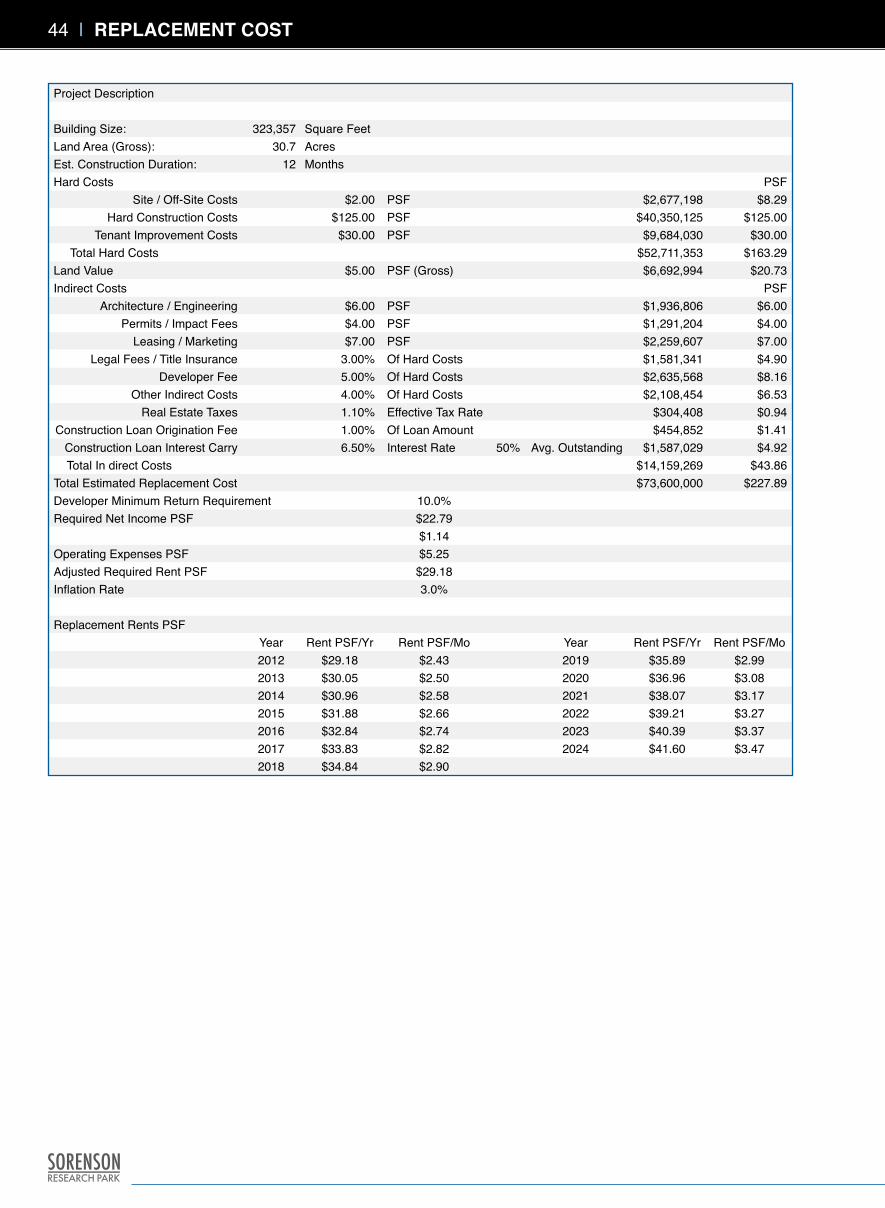
Project Description
Building Size: 323,357 Square FeetLand Area (Gross): 30.7 AcresEst. Construction Duration: 12 MonthsHard Costs PSF
Site / Off-Site Costs $2.00 PSF $2,677,198 $8.29 Hard Construction Costs $125.00 PSF $40,350,125 $125.00
Tenant Improvement Costs $30.00 PSF $9,684,030 $30.00 Total Hard Costs $52,711,353 $163.29 Land Value $5.00 PSF (Gross) $6,692,994 $20.73 Indirect Costs PSF
Architecture / Engineering $6.00 PSF $1,936,806 $6.00 Permits / Impact Fees $4.00 PSF $1,291,204 $4.00
Leasing / Marketing $7.00 PSF $2,259,607 $7.00 Legal Fees / Title Insurance 3.00% Of Hard Costs $1,581,341 $4.90
Developer Fee 5.00% Of Hard Costs $2,635,568 $8.16 Other Indirect Costs 4.00% Of Hard Costs $2,108,454 $6.53
Real Estate Taxes 1.10% Effective Tax Rate $304,408 $0.94 Construction Loan Origination Fee 1.00% Of Loan Amount $454,852 $1.41
Construction Loan Interest Carry 6.50% Interest Rate 50% Avg. Outstanding $1,587,029 $4.92 Total In direct Costs $14,159,269 $43.86 Total Estimated Replacement Cost $73,600,000 $227.89 Developer Minimum Return Requirement 10.0%Required Net Income PSF $22.79
$1.14 Operating Expenses PSF $5.25 Adjusted Required Rent PSF $29.18 Inflation Rate 3.0%
Replacement Rents PSFYear Rent PSF/Yr Rent PSF/Mo Year Rent PSF/Yr Rent PSF/Mo2012 $29.18 $2.43 2019 $35.89 $2.99 2013 $30.05 $2.50 2020 $36.96 $3.08 2014 $30.96 $2.58 2021 $38.07 $3.17 2015 $31.88 $2.66 2022 $39.21 $3.27 2016 $32.84 $2.74 2023 $40.39 $3.37 2017 $33.83 $2.82 2024 $41.60 $3.47 2018 $34.84 $2.90
44 | REPLACEMEnTCOST
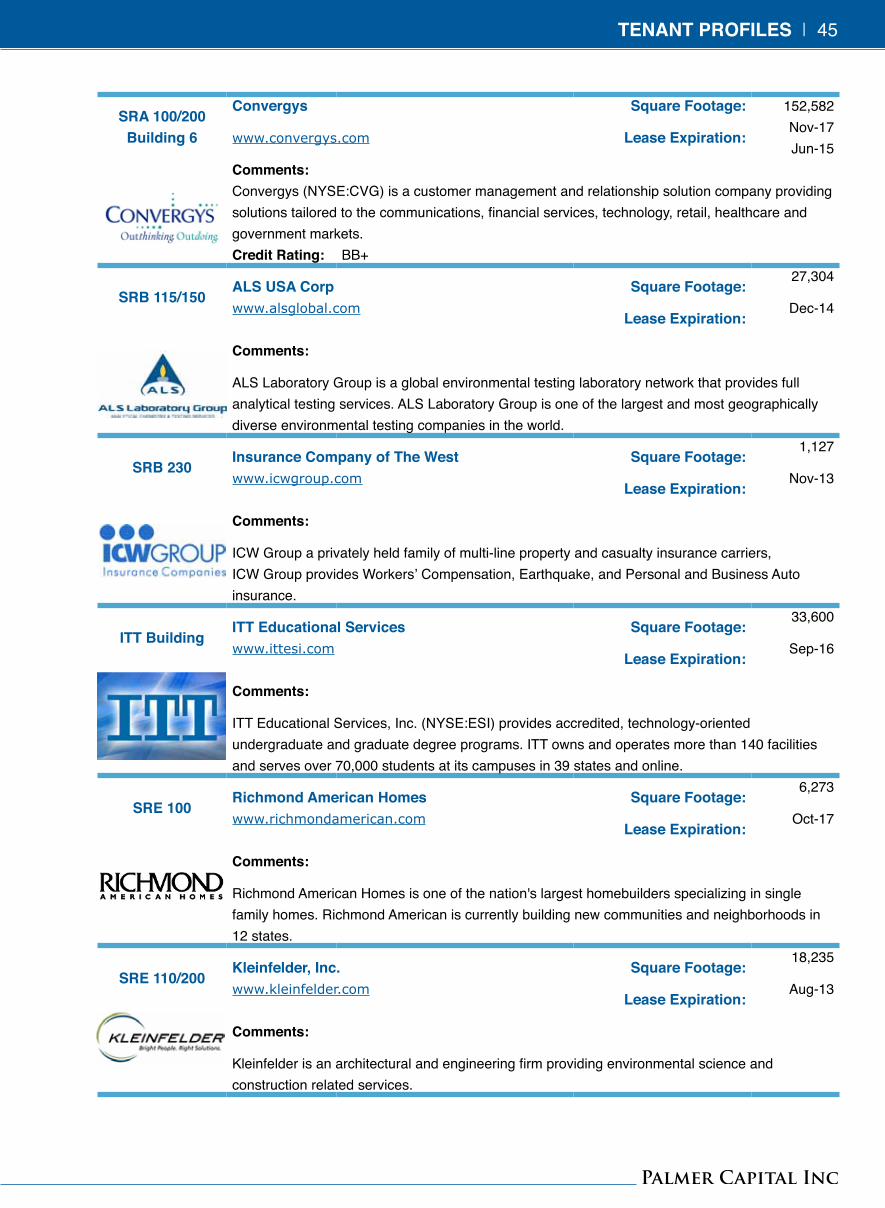
SRA100/200 Building6
Convergys SquareFootage: 152,582
www.convergys.com LeaseExpiration:Nov-17 Jun-15
Comments:Convergys (NYSE:CVG) is a customer management and relationship solution company providing solutions tailored to the communications, financial services, technology, retail, healthcare and government markets.CreditRating: BB+
SRB115/150als Usa Corp SquareFootage:
27,304
www.alsglobal.comLeaseExpiration:
Dec-14
Comments:
ALS Laboratory Group is a global environmental testing laboratory network that provides full analytical testing services. ALS Laboratory Group is one of the largest and most geographically diverse environmental testing companies in the world.
SRB230insuranceCompanyofTheWest SquareFootage:
1,127
www.icwgroup.comLeaseExpiration:
Nov-13
Comments:
ICW Group a privately held family of multi-line property and casualty insurance carriers, ICW Group provides Workers’ Compensation, Earthquake, and Personal and Business Auto insurance.
ITT buildingiTTEducationalServices SquareFootage:
33,600
www.ittesi.comLeaseExpiration:
Sep-16
Comments:
ITT Educational Services, Inc. (NYSE:ESI) provides accredited, technology-oriented undergraduate and graduate degree programs. ITT owns and operates more than 140 facilities and serves over 70,000 students at its campuses in 39 states and online.
SRE100RichmondAmericanHomes SquareFootage:
6,273
www.richmondamerican.comLeaseExpiration:
Oct-17
Comments:
Richmond American Homes is one of the nation's largest homebuilders specializing in single family homes. Richmond American is currently building new communities and neighborhoods in 12 states.
SRE110/200Kleinfelder,inc. SquareFootage:
18,235
www.kleinfelder.comLeaseExpiration:
Aug-13
Comments:
Kleinfelder is an architectural and engineering firm providing environmental science and construction related services.
TEnAnTPROFiLES | 45
SORENSONRESEARCH PARK
SRE210/215 MuscularDystrophyAssociation SquareFootage: 3,464www.mdausa.org
LeaseExpiration:Dec-16
Comments:
MDA is a nonprofit health agency dedicated to curing muscular distrophy, ALS and related diseases by funding worldwide research. MDA has more than 200 offices across the country, sponsors over 200 hospital affiliated clinics and supports more than 330 research projects around the world.
SRF102BestBuyStores SquareFootage:
4,227
www.bestbuy.comLeaseExpiration:
Oct-13
Comments:Best Buy (NYSE:BBY) is a specialty retailer of consumer electronics operating in the US, Puerto Rico, Mexico, Canada and China. BBY operates more than 1,150 stores domestically and internationally.CreditRating: BBB-
SRF104/106/110WellsFargoDealerServices SquareFootage:
11,037
www.wellsfargodealerservices.comLeaseExpiration:
May-17
Comments:
Wells Fargo Dealer Services is one of the nation's leading auto finance lenders and the #1 used car lender. WFDS provides full spectrum lending in the auto industry including real estate and floorplan financing and an array of commercial banking services with over 11,000 auto dealers.
CreditRating:A+
SRF110 PsoMas engineering SquareFootage: 9,190www.psomas.com LeaseExpiration: May-15
Comments:
PSOMAS Engineering is a consulting engineering firm providing solutions in transportation, water, site development, federal and energy markets across the Western United States.
SRF203/206GeneralElectricCompany SquareFootage:
8,216
www.ge.comLeaseExpiration:
Feb-16
Comments:General Electric (NYSE:GE) in a multinational conglomerate corporation operating through four main segments: Energy, Technology Infrastructure, Captial Finance and Consumer & Industrial.CreditRating: AA+
46 | TEnAnTPROFiLES

CiTy/COunTyinTERViEWS | 47
cIty of taylorSvIlle – mIchael meldrum, PrIncIPal Planner
IntervIeW Summary: The available land at Sorenson Research Park is zoned RD – Research & Development. There are no current, active entitle-ments but the parcel could eventually be developed into a ±80,000 square foot office building.
However, the City of Taylorsville would require the construction of another access point into the Park to accommodate additional office buildings. This would most likely be done by building a bridge across the Jordan River that connects South Riverboat Road to West 4170 South. No cost estimates have been obtained by the City, but this requirement likely makes office development on the parcel not economically feasible in the near term.
Locating a residential use in Sorenson Research Park is not compliant with the City’s General Land Use Plan or the current zoning. In order to have a residential use, future ownership would need to file an application to amend both the General Plan and the Zoning Map. It is unlikely that the City would support or favorably recommend residential on this parcel.
"A"
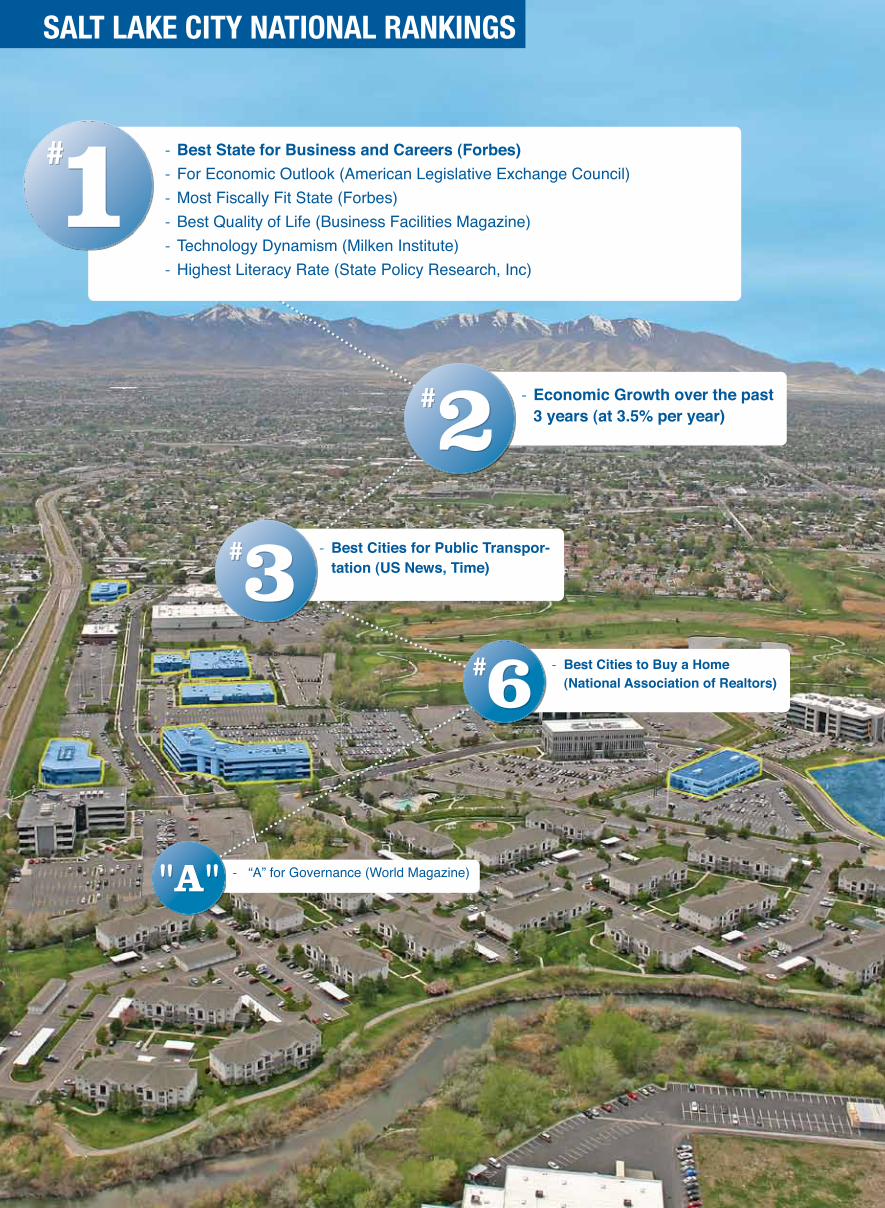
- BestStateforBusinessandCareers(Forbes) - For Economic Outlook (American Legislative Exchange Council) - Most Fiscally Fit State (Forbes) - Best Quality of Life (Business Facilities Magazine) - Technology Dynamism (Milken Institute) - Highest Literacy Rate (State Policy Research, Inc)
- best Cities for Public Transpor-tation(uSnews,Time)
- “A” for Governance (World Magazine)
- EconomicGrowthoverthepast3years(at3.5%peryear)
- BestCitiestoBuyaHome(nationalAssociationofRealtors)
Salt lake cIty natIonal rankIngS
1#
2#
3#
6#

seCTIon | 49MARKETAnALySiS | 49
MarkETaNaLySIS
The Sorenson Research Park is located within the East Central Valley submarket, which is part of the greater Salt Lake City office market. Office tenants are attracted to the submarket due to its central location within the region near Interstates 15 and 215, as well as its lower rental rates compared to downtown Salt Lake City, Cottonwood, and West Jordan. Most areas of the greater Salt Lake City area are reached in 20 minutes or less from the subject property.
The overall Salt Lake City market consists of more than 30.5 million square feet with a current vacancy rate of 14.29%. Large technology users have gravitated to the Salt Lake City area, drawn to its highly educated work force, lower wages, reasonable business costs, pro-business environment, and high standard of living.
SORENSONRESEARCH PARK
CbD
WestValley
CentralValleyWest
east
CottonWood
south WestValley

SORENSONRESEARCH PARK
vacancy analySIS The East Central Valley submarket had a vacancy rate of 18.6% as of the first quarter of 2012. The vacancy rate has continued to drop over the past year since peaking at 24.5% in 2010. There has been a consistent increase in leasing velocity, especially by large users looking for moderately priced office space.
Most of the vacancy consists of less efficient and older office space that is not directly competitive with the Sorenson Research Park. Currently, most of the available space in the submarket is between 3,000 and 7,000 square feet in older buildings. The subject’s larger floor plates are considered an asset in the market, coinciding with current tenant demand. Further, Class A space has enjoyed a vacancy rate of only 6% in the submarket. Rental rates have remained steady over the past few years and have actually increased over the quarter.
east central valley submarket vacancy
The Salt Lake City market currently has a 14.29% vacancy rate, steadily decreasing since 2008. Vacancy rates have trended lower due in part to demand from larger corporate and technology tenants looking for 20,000+ square foot spaces. There are few large blocks of office space available in the market.
salt lake city vacancy
abSorPtIon analySIS
The East Valley submarket experienced 28,493 square feet of positive net absorption in the first quarter of 2012. In 2011, the submarket experienced 96,489 square feet of positive net absorption, continuing a trend of positive absorption, lowering vacancy rates, and increasing rental rates. The submarket is positioned to see increased net absorption given the velocity of tenant activity in conjunction with higher rental rates in surrounding submarkets.
east central valley submarket absorPtion
The Salt Lake City market had approximately 796,668 million square feet of positive net absorption in 2011. This gain has continued a strong absorption trend over the past several years, even through the recent economic downturn.
salt lake city absorPtion
50 | MARKETAnALySiS

rental rate analySIS The average rental rate for office space in the submarket is currently $19.28 per square foot FSG, which is a 3.3% increase over the previous quarter. The rental rates have remained steady over the past several years. Average Rental Rates are projected to continue to increase in 2012 based on recent leasing activity and demand.
The East Valley submarket will directly benefit from the lack of available space and higher rental rates in surrounding submarkets. Also, the current cost of construction makes it economically unjustifiable to build any new speculative space in and around the submarket. No new major non build-to-suit product will be coming online in 2012, and rental rates have been remaining steady over the past five years.
east central valley submarket rental rates
The Salt Lake City market average rental rate is $18.82 per square foot FSG, which is an increase from 2011. The market experienced a peak rental rate of $19.25 in 2008. The hyper-activity from the technology sector this year, in conjunction with other market users looking for new and expansion space is a positive sign that there is steady demand and rental rates should continue to increase.
salt lake city rental rates
InStItutIonS & corPoratIonS Salt Lake City continues to attract and retain the most sophisticated real estate investors given its stable economy, strategic location, and growing population. Below is a sample of institutional investors that own office buildings in the area:
• Principal financial• KBSRealtyAdvisors• Ubs• WellsRealEstateFund
• PRi• alexander & baldwin• Wa Capital Management• WPCarey
• GERealEstate• Inland• Hines
MARKETAnALySiS | 51

SORENSONRESEARCH PARK
market overvIeWThe Salt Lake City region offers a high quality of life and is recognized as one of the strongest and most stable economies in the country. The City enjoys a wealth of amenities and favorable cost of living. Salt Lake City’s two hour flight proximity to all of the major metro areas in the West makes it a convenient location for a variety of industries. The region offers abundant recreational activities, professional sports, and cultural events making it an attractive place to live and work.
Salt Lake City and the state of Utah continue to outperform competing markets in the Western United States. Fundamentals such as low unemployment, population growth, economic strength and continued in-migration keep the region on an upward growth trend.
MarketGrowthDrivers:
· JobGrowth/unemployment–The Salt Lake City area currently has, and historically maintains, one of the highest rates of job growth in the Western United States. In the past 12 months ending March 2012, the region has added over 20,400 jobs and has an unemployment rate of 5.8%.
· HousingRecovery – The Salt Lake City region enjoys the lowest cost of living index in comparison to the major markets in the West Coast. This is combined with a median home price down over 25% from the 2007 peak.
· PopulationGrowth – As a result of its high quality of life and home affordability, the Salt Lake City population is projected to grow 6.6% over the next 5 years. This rate of growth is nearly 70% greater than the projected population growth for the United States.
· TechBoom–The Salt Lake City region has experienced explosive growth in the technology, life science and clean energy sectors. Utah is home to over 5,700 life science and information technology companies employing over 76,000 people.
· intellectualCapital–Salt Lake City has one of the youngest and most educated workforces in the Nation with over 39% of the workforce having received an associate’s degree or higher.
dIrector, economIc develoPment – don adamS
IntervIeW Summary:The City of Taylorsville Economic Development Agency is fully supportive of business growth in the Sorenson Research Park. There are currently between 5,000 and 5,500 employees located at the office park and several have taken advan-tage of the incentives offered by both the State of Utah and the City Economic Development Agency. The incentives resulting in the greatest impact are payroll tax exemptions, sales tax exemptions for manufacturing equipment and fast tracking of permitting processes.
The Sorenson Research Park is seen as a well respected office park in the region and has attracted several major tenants in the last several years. For example, the Royal Bank of Scotland occupies two full floors of a property within the park and employs over 400 people.
There are plans currently in process to add an extension of the bus rapid transit system that will connect the TRAX light rail system from its current stop east of Interstate 15, along W 4500 S with dedicated stops at the Sorenson Research Park, and further west to the Salt Lake Community College. The extension is planned to be fully operational by the end of 2014. This addition will allow a direct link to the TRAX system, opening up a direct line of public transportation to the subject property.
52 | MARKETOVERViEW
CiTyCOunTyinTERViEW

In a recent study at the W.P. Carey School of Business at Arizona State University, Utah was ranked second in the nation for job growth in 2011.
Utah has historically kept pace with or shown stronger wage growth compared to the US, with 2011 having a 60 basis point higher wage growth compared to the rest of the country. The driver behind this trend is the dramatic growth in the life science and high tech jobs.
wage growth
emergIng tech hubSalt Lake City’s combination of young, highly educated labor force and extreme pro business government continue to drive the recent growth in the high tech and life science fields. Employment in the life science and information technology fields has jumped over 283% since 2006 and currently employs over 76,000 people.
The region has ranked 1st in the nation for life science business per capita and in 2008 the Milken Institute named Utah second in the nation for overall industry growth. The Bureau of Labor Statistics noted in 2010 that Utah has the highest concentration of Biomedical Engineers in the US. Additionally, Utah companies currently produce 70% of all arterial and vascular access devices utilized worldwide.
High tech and life science companies are drawn to Utah and the Salt Lake City region for its underlying entrepreneurial atmosphere and existing strong infrastructure. Utah ranked 1st and Salt Lake City ranked 5th in the nation for the top tech-savvy states and medium sized cities respectively. In 2007-2008, according to the Utah Technology Council, the State ranked higher than Oregon, California, Colorado and the US in information technology industry growth for both new business and employees. Additionally, the National Science Foundation has ranked Utah in the top 10 states for high tech business for 2012.
Salt lake cIty jobS – groWth trendS and drIverSThe Salt Lake City region has consistently outperformed all comparable regions in the Western United States in job growth and unemployment. In the most recent 12 months ending March 2012, the region added over 20,400 jobs and is projected to increase an additional 2.7% for the 2012 calendar year. The market has outshined by showing posi-tive job growth in all but three months since March of 2010.
total non-farm jobs (in 1,000s)
The strengthening job market has largely been attributed to the explosive growth of the mining and natural resources industry, which grew at an impressive 10.1% during 2011. Growth across four employment sectors was up over 3% in the same period. The projections call for strong continued growth through 2016 with mining and natural resources, financial activities, information and professional and busi-ness services leading the growth.
utah labor force change
MARKETOVERViEW | 53
SORENSONRESEARCH PARK
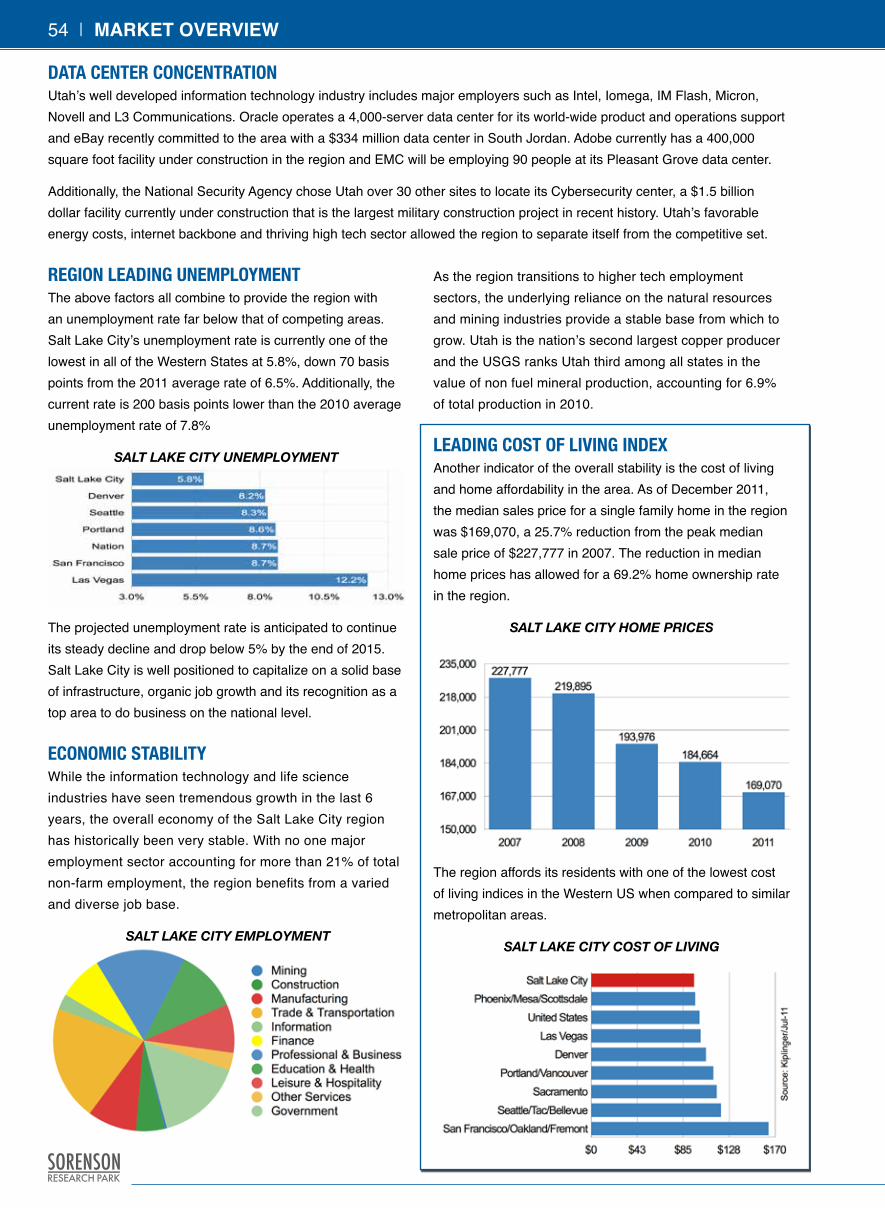
data center concentratIonUtah’s well developed information technology industry includes major employers such as Intel, Iomega, IM Flash, Micron, Novell and L3 Communications. Oracle operates a 4,000-server data center for its world-wide product and operations support and eBay recently committed to the area with a $334 million data center in South Jordan. Adobe currently has a 400,000 square foot facility under construction in the region and EMC will be employing 90 people at its Pleasant Grove data center.
Additionally, the National Security Agency chose Utah over 30 other sites to locate its Cybersecurity center, a $1.5 billion dollar facility currently under construction that is the largest military construction project in recent history. Utah’s favorable energy costs, internet backbone and thriving high tech sector allowed the region to separate itself from the competitive set.
regIon leadIng unemPloymentThe above factors all combine to provide the region with an unemployment rate far below that of competing areas. Salt Lake City’s unemployment rate is currently one of the lowest in all of the Western States at 5.8%, down 70 basis points from the 2011 average rate of 6.5%. Additionally, the current rate is 200 basis points lower than the 2010 average unemployment rate of 7.8%
salt lake city unemPloyment
The projected unemployment rate is anticipated to continue its steady decline and drop below 5% by the end of 2015. Salt Lake City is well positioned to capitalize on a solid base of infrastructure, organic job growth and its recognition as a top area to do business on the national level.
economIc StabIlItyWhile the information technology and life science industries have seen tremendous growth in the last 6 years, the overall economy of the Salt Lake City region has historically been very stable. With no one major employment sector accounting for more than 21% of total non-farm employment, the region benefits from a varied and diverse job base.
salt lake city emPloyment
As the region transitions to higher tech employment sectors, the underlying reliance on the natural resources and mining industries provide a stable base from which to grow. Utah is the nation’s second largest copper producer and the USGS ranks Utah third among all states in the value of non fuel mineral production, accounting for 6.9% of total production in 2010.
leadIng coSt of lIvIng IndexAnother indicator of the overall stability is the cost of living and home affordability in the area. As of December 2011, the median sales price for a single family home in the region was $169,070, a 25.7% reduction from the peak median sale price of $227,777 in 2007. The reduction in median home prices has allowed for a 69.2% home ownership rate in the region.
salt lake city home Prices
The region affords its residents with one of the lowest cost of living indices in the Western US when compared to similar metropolitan areas.
salt lake city cost of living
54 | MARKETOVERViEW

ProBusinessEnvironment
Salt Lake City has a national reputation as a pro-business city. The cost of doing business in the area is 87% of the national average and KPMG has ranked Salt Lake City as the 7th most cost attractive mid-sized city in the country in which to do busi-ness – the only city in the Western States to make the top 10.
Additionally, the low cost of doing business provides an attractive alternative for companies looking to relocate from more expensive states such as California. The economic and political stability Utah offers relocating businesses creates a strong draw for companies seeking to establish expansion or relocation facilities.
UtilitiesElectricity(CentsperkWh) Utah California
Commercial 6.48 12.24Industrial 4.19 9.12
naturalGas(DollarsperThousandCubicFeet) Utah CaliforniaCommercial $6.66 $8.60 Industrial $5.70 $8.14
TaxesTaxRates Utah California
State Corporate Income Tax Rate 5% 8.85%State Real Property Tax Rate None NoneState Real Property Assessment Rate 100% of market value 100% of market valueLocal Real Property Assessment Rate Market Value Market ValueState Personal Property Tax Rate None None
WagesWageComparison(MeanAnnualWage) Utah California
All Occupations $39,220 $49,550 Manufacturing Technician (SOC 519199) $24,730 $31,060
RankingsRankingsintheu.S. Utah California
BestManagedStateGovernment—Pew Charitable Trust 2008 1 47EconomicOutlook—AlEC-laffer State Competitiveness index 2010 1 46LeastDebt-BurdenedState—Forbes 2010 1 47America'sMostPro-BusinessState—Pollina Corporate 2010 2 50BestStateforBusiness—Forbes 2010 1 39America'sTopBusinessStates2010—CnBC 2010 8 32LowCostofDoingBusiness—Tax Foundation 2010 10 48
Forbes Magazine has consistently ranked Utah among the top states for doing business and identified it as the number one state for the last two years. In 2011, Utah was the only state to rank in the top 15 of all six major categories – business costs, labor supply, regulatory environment, economic climate, growth prospects and quality of life.
Intellectual caPItalThe Salt Lake City region boasts one of the most highly educated workforces in the nation with 39.7% of its population having achieved an associate’s degree or higher, ranking it one of the highest metropolitan areas in the country. Additionally, Utah is home to 12 major universities or colleges with a total enrollment of nearly 200,000 students.
The University of Utah, located in Salt Lake City, is classified by the Carnegie Foundation as one of the 50 Comprehensive Research I Universities from among 3,700 U.S. institutions. The University is a leader in biotechnology research and is a direct driver of the life science and biotechnology growth in the region. Additionally, it is ranked first in the nation, tied with MIT, for the number of research produced business start-ups underscoring its strength within the life science industry.
MARKETOVERViEW | 55
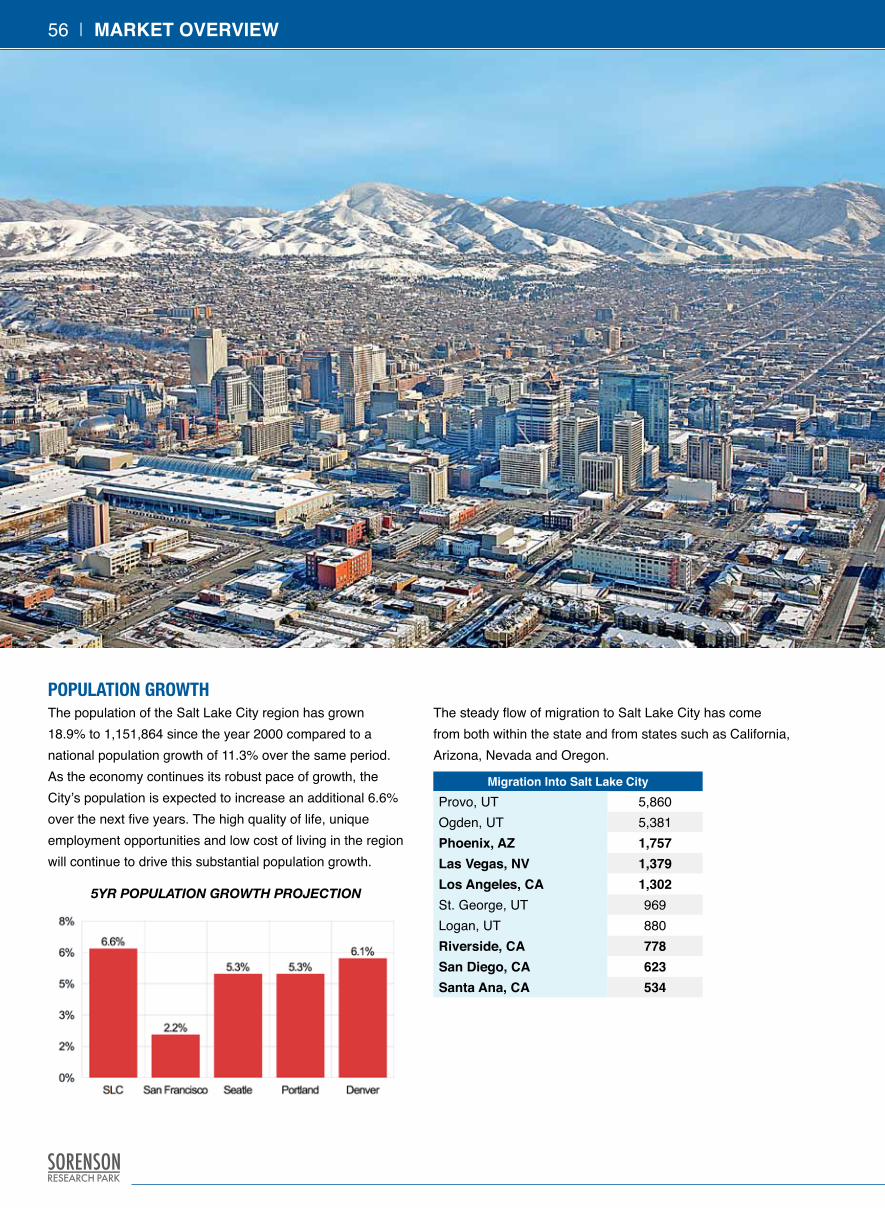
SORENSONRESEARCH PARK
PoPulatIon groWth The population of the Salt Lake City region has grown 18.9% to 1,151,864 since the year 2000 compared to a national population growth of 11.3% over the same period. As the economy continues its robust pace of growth, the City’s population is expected to increase an additional 6.6% over the next five years. The high quality of life, unique employment opportunities and low cost of living in the region will continue to drive this substantial population growth.
5yr PoPulation growth Projection
The steady flow of migration to Salt Lake City has come from both within the state and from states such as California, Arizona, Nevada and Oregon.
MigrationintoSaltLakeCityProvo, UT 5,860Ogden, UT 5,381Phoenix,AZ 1,757LasVegas,nV 1,379LosAngeles,CA 1,302St. George, UT 969Logan, UT 880Riverside,CA 778SanDiego,CA 623SantaAna,CA 534
56 | MARKETOVERViEW

croSSroadS of the WeSt – logIStIcS InfraStructureThe Salt Lake City region has long been considered the “Crossroads of the West” as its central location and heavy infrastruc-ture of interstate highways, rail lines and air services place it within 1 to 2-day access to half of the nation’s population.
The numerous alternatives for both commercial and non-commercial traffic provide the region’s companies with multiple choices for transportation and freight logistics.
freeWaySSalt Lake City’s primary east-west arterial freeways are Interstate 80, which runs from San Francisco to New York City, as well as Interstate 215 and Interstate 70 extending east to Denver. The primary north-south arte-rial freeway is Interstate 15, which runs from the border of Mexico to Canada.
Over 700 trucking companies are based on Utah and its strategic location along the Mexico/Canada corridor provides an ideal hub for distribution.
aIrPortSThe Salt Lake City International Airport operates Delta Air Lines’ second largest hub and is the 23rd busiest airport in the nation. Additionally, it is within 2.5 hours of half of the nation’s population.
raIl lIneSUtah has 1,400 miles of rail lines throughout the state that converge in the Salt Lake-Ogden metropolitan area. Union Pacific is the primary rail service provider in the State. The main lines link Utah to major sea ports such as Los Angeles, Oakland, Portland and Seattle, as well as many other key locations throughout the country.
maSS tranSIt ServIceSUtah Transportation Authority’s (“UTA”) TRAX light rail system is currently averaging more than 59,000 riders a day along its 35 miles of routes through 5 municipalities in the Salt Lake region. It is currently the 9th busiest light rail system in the US by ridership. UTA is working on expanding the current light rail system to open an extension south to Draper and west to the Salt Lake City International Airport – scheduled to open by 2015.
Construction is near completion on the 44-mile commuter rail line from Weber to Salt Lake and is predicted to transport 5,900 travelers daily. Another rail extension is planned to run from Salt Lake City through the southern end of Utah County, where roughly 76% of Utah’s popula-tion resides. This extension should be completed within the next few years.
Salt Lake City is one of the nation’s greenest communi-ties with more residents per capita using regional public transportation than any other metropolitan statistical area in the country. Currently, an estimated 20% of Salt Lake City commuters use another mode of transportation other than motor vehicles.
MARKETOVERViEW | 57

SORENSONRESEARCH PARK
CompetitivePropertiesProperty/Address sf built Rate/SF/yr Occupancy owner Comments
1CentrePointe Business Park 1865 West 2100 South Salt Lake City, UT
54,427 2008 $16.00 NNN 0.0% Portfolio Inv N/A
R&D Office - Multi Building Campus Environment
2Franklin Covey Park 2650 South Decker Lake Blvd Salt Lake City, UT
143,338 1984 $18.50 FSG 58.0% Levy Affiliated Holding
5 Story Office Building in a Corporate Campus
3Lake Pointe Corp Ctr III 2875 South Decker Lake Drive Salt Lake City, UT
118,712 1998 $18.50 FSG 66.0% Argent Group5 Story Office Building in a Multi Building Office Park -
22k SF Floor Plates
4Sorenson Research Park 8 4215 South Riverboat Road Taylorsville, UT
80,000 2009 $16.50 NNN 48.1% Utah Capital4 Story Office Building within Subject Office Park - 25k SF
Floor Plates
5Sorenson Research Park 7 4246 South Riverboat Road Taylorsville, UT
121,716 1998 $19.75 FSG 64.3% Mikami Brothers
4 Story Office Building within Subject Office Park - 30k SF
floor plates
6Sorenson Research Park 12 4393 South Riverboat Road Taylorsville, UT
100,768 1998 $13.50 NNN 0.0% Utah Capital 4 Story Office Building within Subject Office Park
Comparable sale PropertiesProperty/Address Total sf
CoePrice(MM) Price/SF
Cap Rate
Buyer seller Comments
7Salt Lake Hardware Building 101-155 N 400 W Salt Lake City, UT
198,565 May-2012
$30.3 $152.59 7.00% KBS Realty Advisors
Gastronomy Creative Office Space
8Jordan Valley Technology Center 698 West 10000 South South Jordan, UT
105,600 Mar-2011
$23.1 $219.00 NA Morgan Stanley
Boyer Company Built 2002, Class A Office
9Neways International 2089 West Neways Drive Springville, UT
82,945 Aug-2009
$14.0 $168.79 8.36% Springville, UT
Cardinal Capital Built 2002, Located South of SLC
10OSHA Tech Center 8660 S Sandy Parkway Sandy, UT
75,000 Apr-2009
$21.0 $280.00 7.40% BMD Management
CapLease Single tenant, 13 Yr Lease
Comparable lease TransactionsTenant/Property/Address sf Rate/SF/yr Term(yrs.) start LeaseType owner
11
Mitchell International Lake Pointe Corp Ctr III 2875 South Decker Lake Dr Salt Lake City, UT
2,587 $17.95 3 04/11 FSG Argent Group
12
Sorenson Communications Sorenson Research Park Bldg 4215 South Riverboat Road Taylorsville, UT
20,403 $16.94 7 01/12 NNN Utah Capital
13U.S. General Services Admin 2830 South Redwood Road West Valley City, UT
31,700 $17.17 1 04/11 FSG Rivendell Props
14
Dollar Financial Patrick Henry Builiding 2650 S Decker Lake BlvdWest Valley City, UT
15,000 $18.00 5 05/11 FSG Franklin Development
15
IHC Health Services Towers I @ 45th 310 East 4500 South Murray, UT
1,825 $18.50 3 08/11 FSG Bond Stephens Johnson
16
Salt Lake Wound Care Woodlands Tower IV 3949 South 700 East Millcreek, UT
5,168 $19.63 3 03/12 FSG Wasatch Property Mgmt
COMPARABLES | 5958 | COMPARABLES
SubjectPropertyProperty TotalnRA(SF) yearBuilt Rate/SF/yr Occupancy Comments
849, 860, 920, 960, 1065 West LeVoy Drive 4179 South Riverboat Road
323,357 1989-1999 $16.95 - $18.95 FSG $13.00 - $13.50 NNN 88.91% 6 Buildings
11
7
1
6
45 12
13
15
14
16
8
10
23
SORENSONRESEARCH PARK
9

SORENSONRESEARCH PARK
driving directions from salt lake city international airPort:
Head South on Terminal Dr (1.3 miles)Take the I-80 East ramp to City Center/Ogden/Provo (.7 miles)Keep left at the fork, follow signs for I-80 East merge onto I-80 East (4 miles)Merge onto I-15 South (5.3 miles)Take exit 301 for State Route 266 toward 4500 So. (.3 miles)Keep right at the fork, follow signs for Taylorsville and merge onto W 4500 S/State Route 266 West (.7 miles) Turn right onto Riverboat Road Miles: 13 Approximate Drive Time: 19 Minutes
ProPerty address:
Sorenson Research Park1065 West Levoy, 960 West Levoy920 West Levoy, 860 West Levoy849 West Levoy4179 South Riverboat Road4156 South Riverboat RoadSalt Lake City, UT
60 | MAPS&DRiVinGDiRECTiOnS

SORENSONRESEARCH PARK

621 Capitol Mall, Suite 2100 • Sacramento, California 95814(916)446-8274 • www.palmercapital.com