by benjamin m. sleeter and christian g. raumann - usgs · by benjamin m. sleeter and christian g....
TRANSCRIPT
Land-Cover Trends in the Mojave Basin and Range Ecoregion
By Benjamin M. Sleeter and Christian G. Raumann
This report documents the rates and causes of late-20th century land-cover change in the Mojave Basin and Range ecoregion as part of the U.S. Geological Survey’s National Land-Cover Trends project.
U.S. Department of the InteriorU.S. Geological Survey
Scientific Investigations Report 2006–5098

For product and ordering information: World Wide Web: http://www.usgs.gov/pubprod Telephone: 1-888-ASK-USGS
For more information on the USGS—the Federal source for science about the Earth, its natural and living resources, natural hazards, and the environment: World Wide Web: http://www.usgs.gov Telephone: 1-888-ASK-USGS
Although this report is in the public domain, permission must be secured from the individual copyright owners to reproduce any copyrighted materials contained within this report.
This report and any updates to it are available online athttp://pubs.usgs.gov/sir/2006/5098/
U.S. Geological Survey, Reston, Virginia: 2006
U.S. Department of the InteriorP. Lynn Scarlett, Acting Secretary
U.S. Geological SurveyP. Patrick Leahy, Acting Director
Cataloging-in-publication data are on file with the Library of Congress (URL http://www.loc.gov/).
Any use of trade, product, or firm names in this publication is for descriptive purposes only and does not imply endorsement of the U.S. Government.
Produced in the Western Region, Menlo Park, CaliforniaManuscript approved for publication, April 25, 2006Text edited by Peter H. StaufferLayout and design by Susan Mayfield
iii
Contents
Abstract ...........................................................................................................................................................1Introduction.....................................................................................................................................................1Background.....................................................................................................................................................1
Ecoregion description ..........................................................................................................................1Relation of environmental characteristics and land cover ...........................................................4Methods..................................................................................................................................................5
Results .............................................................................................................................................................6Estimated gross area change .............................................................................................................6Net change by land-cover type ..........................................................................................................6Common land-cover conversions ......................................................................................................7Temporal component of change .......................................................................................................11
Verification ....................................................................................................................................................11Summary........................................................................................................................................................13References ....................................................................................................................................................13Appendix 1. Land-cover classes and definitions used in the Land-Cover Trends project ..............15
Figures1. Location map of Mojave Basin and Range Ecoregion ........................................................................22. Map showing Federal land ownership in the Mojave Basin and Range Ecoregion and sur-
rounding area ................................................................................................................................33. Map showing National Land Cover Data (NLCD) in the study area and sample block
selections .......................................................................................................................................54. Detailed maps of land-cover change in sample blocks #14-1009 (near Palmdale,
California) and #14-555 (near Henderson, Nevada) ........................................................... 8–95. Photograph of disturbed land at Fort Irwin National Training Center .............................................106. Graph of population trends in counties of the Mojave Basin and Range ecoregion ...................127. Graph of population trends for major cities within the Mojave Basin and
Range Ecoregion .........................................................................................................................12
Tables1. Characteristics of Landsat data sets used in the analysis of land-cover change ..........................62. Normalized estimated annual land-cover change rates by time interval ........................................73. Percent total land area by land cover class .........................................................................................74. Areas of common land-cover conversions by time interval ...............................................................75. Population change of selected cities in the western Mojave Basin and Range Ecoregion .........96. Precision of change estimates ..............................................................................................................11
Land-Cover Trends in the Mojave Basin and Range Ecoregion
By Benjamin M. Sleeter and Christian G. Raumann
Abstract The U.S. Geological Survey’s Land-Cover Trends Project
aims to estimate the rates of contemporary land-cover change within the conterminous United States between 1972 and 2000. A random sampling approach was used to select a representa-tive sample of 10-km by 10-km sample blocks and to estimate change within +/−1 percent at an 85-percent confidence interval (Stehman and others, 2003; Loveland and others, 2002). Land-sat Multispectral Scanner, Thematic Mapper, and Enhanced Thematic Mapper Plus data were used, and each 60-m pixel was assigned to one of 11 distinct land-cover classes based upon a modified Anderson classification system. Upon comple-tion of land-cover change mapping for five dates, land-cover change statistics were generated and analyzed. This paper presents estimates for the Mojave Basin and Range ecoregion located in the southwestern United States. Our research suggests land-cover change within the Mojave to be relatively rare and highly localized. The primary shift in land cover is unidirec-tional, with natural desert grass/shrubland being converted to development. We estimate that more than 1,300 km2 have been converted since 1973 and that the conversion is being largely driven by economic and recreational opportunities provided by the Mojave ecoregion. The time interval with the highest rate of change was 1986 to 1992, in which the rate was 0.21 percent (321.9 km2) per year total change.
IntroductionThe Mojave Basin and Range ecoregion (Omernik, 1987;
Environmental Protection Agency, 1999) covers much of the Southern California desert, southern Nevada, and small portions of western Arizona and southwestern Utah (fig.1). The majority of the ecoregion (hereafter, the terms “Mojave ecoregion” or “ecoregion” will be used interchangeably) con-sists of undisturbed lands fragmented only by widely spaced road and highway development. With a combined population of 769,303 (U.S. Census Bureau, 2001), Las Vegas and the surrounding cities of Henderson and North Las Vegas form the major urban center and the main contributor to the ongo-ing population increase within the ecoregion. The cities of Palmdale and Lancaster, located along the western edge of the
ecoregion, form the second largest urban area and have a com-bined population of more than 200,000 residents (U.S. Census Bureau, 2001). Recreation is a major activity in the ecoregion, because people are drawn to locations such as Death Valley National Park, Mojave National Preserve, open-access Bureau of Land Management (BLM) lands, Lake Mead National Rec-reation Area, and the city of Las Vegas. Despite the increasing population, active military training operations, and demands for recreation, there is a paucity of quantitative contemporary information on land-cover change for the Mojave ecoregion.
Historical satellite imagery, which has been widely avail-able since the early 1970s, provides a consistent imagery base for comparative study of land-cover change. This study used methods developed by the U.S. Geological Survey Land-Cover Trends Project (Loveland and others, 2002), which implements a probability sampling technique and archived satellite imagery to map and quantify contemporary land-cover change for the 84 U.S. Environmental Protection Agency Level III ecoregions (Omernik, 1987). Estimates of area and rates of change have been computed for the Mojave ecoregion on the basis of visual interpretation and subsequent postclassification comparison of five dates of imagery between 1973 and 2000 for 40 sample blocks, each 10 km by 10 km (see fig.2). A modified Anderson classification scheme (Anderson and others, 1976) was used to group land cover into 11 discrete classes.
This paper provides a description and discussion of land-cover change in the Mojave Basin and Range ecoregion. Two fundamental issues associated with land-cover change are addressed: (1) what are the spatial and temporal dimensions of land-use and land-cover change and (2) what are the local to global driving forces of land-use and land-cover change? A description of the Mojave ecoregion, historical land-cover trends and issues, and an analysis of contemporary land-cover change are included in this paper.
Background Ecoregion Description
The Mojave Basin and Range ecoregion as defined by Omernik (1987) is located in the southwestern United States and covers a total area of 130,742 km2. It includes portions of California (58.5% of the ecoregion), Nevada (29.4%), Arizona

(11.7%), and Utah (0.4%)(fig. 1). Counties partly within the ecoregion boundary include San Bernardino, Riverside, Los Angeles, Inyo, and Kern Counties in California; Clark, Lincoln, Nye, and Esmeralda Counties in Nevada; Mohave and Coconino Counties in Arizona; and Washington County in Utah.
The majority of the ecoregion consists of the Mojave Desert, but the northern extent of the ecoregion crosses into the southwestern edge of the Basin and Range geomorphic province. As its name indicates, the Mojave Basin and Range ecoregion is characterized by basin and range topography, with numerous distinct fault-bounded mountain ranges skirted
by bajadas and separated by relatively flat and often expansive alluvial valley floors. A remarkable amount of vertical topo-graphic relief results from this geology.
Low annual precipitation and high summer temperatures are characteristic throughout the ecoregion. Average annual precipitation varies between 50 and 250 mm in the valleys and is as much as 625 mm in the mountain ranges. Precipitation is spread out fairly evenly over the year and falls mostly as rain. However, some snow does regularly fall at higher elevations in the winter and early spring. Average annual temperatures generally range between 16 and 24ºC but are as low as 10ºC
Nye County
San Bernardino County
Inyo County
MohaveCounty
Lincoln County
Clark County
Kern County
Riverside County
Tulare County
Yavapai County
Fresno County
Los AngelesCounty
Esmeralda CountyMono
County
Iron County
La PazCounty
WashingtonCounty
Mineral County White PineCounty
CoconinoCounty
MillardCounty
MaderaCounty
BeaverCounty
TuolumneCounty
OrangeCounty
MariposaCounty
San DiegoCounty
CALIFORNIANEVADA
ARIZONA
UTAH
Needles
Kingman
Hesperia
Yucca ValleyTwentynine Palms
Palmdale
Mesquite
Lancaster
HendersonRidgecrest
Boulder City
BullheadCity
California City
North Las VegasLas Vegas
Victorville
Barstow
Adelanto
Apple Valley
Pacific Ocean0 10050 KILOMETERS
0 5025 MILES
Figure 1. Location map of the Mojave Basin and Range ecoregion (shaded area). The ecoregion is in the southwestern United States and includes land in California, Nevada, Arizona, and Utah. The area studied in this project covers approximately 130,000 km2.
Land-Cover Trends in the Mojave Basin and Range Ecoregion

in the mountains (Natural Resources Conservation Service, 1981). As a result of the harsh regional climatic conditions, this ecoregion is quite fragile and recovers slowly from anthro-pogenic disturbances (Hunter and others, 2003).
The largest landowner in the Mojave Basin and Range ecoregion is the Federal Government. Designated Federal lands in the ecoregion make up roughly 81 percent of the total land area (fig. 2). The Bureau of Land Management (BLM) controls almost half of the land in the ecoregion (44.7%). The National Park Service (NPS) manages 20 percent, with the largest holdings being Death Valley National Park, Lake
Mead National Recreation Area, Joshua Tree National Park, and Mojave National Preserve. A portion of Grand Canyon National Park also lies on the eastern boundary of the ecore-gion. The Department of Defense (DOD) is another major holder and user of lands in the ecoregion at 15 percent of the total area. Major military facilities, which in turn support the local economies of a number of towns and small cities, include China Lake Naval Air Weapons Station, Fort Irwin National Training Center, Nellis Air Force Base, Edwards Air Force Base, Marine Corps Air-Ground Combat Center Twenty-Nine Palms, and the Marine Corps Logistics Base at Nebo.
Figure . Federal land ownership in the Mojave Basin and Range ecoregion and surrounding area. The Bureau of Land Management is the largest land holder; other lands are held and managed by the National Park Service, Department of Defense, Bureau of Reclamation, Bureau of Indian Affairs, and the U.S. Forest Service. Ecoregion names are in red, boundaries in black. Boxes are the forty sample blocks analyzed in this project.
Nellis AFB
Nevada Test Site
Nellis AFBNationalWildlifeRange
DeathValley
NationalPark
China LakeNAWS
Fort IrwinNational Training
Center
ToiyabeNational
Forest
MoapaRiver
Lake MeadNational
RecreationArea
Hualapai IndianReservation
MojaveNationalPreserve
29 Palms
Edwards AFB
HavasuNationalWildlifeRefuge
Joshua TreeNational Park
MOJAVE BASINAND RANGE
CENTRAL BASINAND RANGE
SONORAN DESERT
CENTRAL AND SOUTHERN
CHAPARRAL ANDOAK WOODLANDS
SIERRA NEVADA
MOUNTAINS
ARIZONA/NEW MEXICO
PLATEAU
COLORADOPLATEAU
CALIF.CENTRALVALLEY
SOUTHERN CALIF. MOUNTAINS
Bureau of Indian Affairs
Bureau of Land Management
Bureau of Reclamation
Department of Defense
Forest Service
Fish and Wildlife Service
National Park Service
Other
FEDERAL AGENCY
0 10050 KILOMETERS
0 5025 MILESPacific Ocean
Background

The Department of Energy’s (DOE) Nevada Test Site on the northeastern boundary of the ecoregion makes up 1.5 percent of total lands.
Urban development is generally limited throughout the ecoregion, mostly because of harsh environmental conditions and a lack of adequate resources and infrastructure. However, significant development has and continues to take place in the Las Vegas, Nevada, area and in California along the south-western edge of the ecoregion in the cities of Lancaster and Palmdale. Almost all of the modern communities in the ecore-gion have originated along lines of transportation, whether these were railroads, highways, pack animal trails, or even navigable rivers (Bard, 1972).
Las Vegas, along with the surrounding cities of North Las Vegas, Henderson, and Boulder City, is the dominant urban center in the ecoregion. McCarran International Airport, which serves the Las Vegas area, is the eighth busiest airport in the world, and nearby Lake Mead has more than 10 million visitors a year. Vacation resorts, golf courses, and other tourist attractions draw large numbers of visitors to the area. The gaming and tourism industry is dependent on the continued influx of visitors, easy access to the area, and a local popula-tion capable of sustaining these industries. This local popula-tion is moving further away from the city centers, resulting in the need for continued infrastructure development.
The southwestern edge of the ecoregion is occupied by several cities, with Lancaster, Palmdale, Victorville, and Barstow being the largest. The congested urban landscape of Los Angeles and western San Bernardino County is forcing development to move along transportation corridors that lead through the physiographic boundary of the San Gabriel and San Bernardino Mountains (Southern California Mountains ecoregion) into the western Mojave Desert. In many cases, people are willing to commute long distances to work in order to take advantage of more affordable housing in suburban neighborhoods located in the desert, contributing to urban growth in the region.
Other notable urbanized areas in the ecoregion, apart from those previously described, are Ridgecrest, California, which supports China Lake Naval Weapons Station, and the cities along or near the Colorado River in the south, including Needles, California, and Bullhead City and Kingman, Arizona.
Relation of Environmental Characteristics and Land Cover
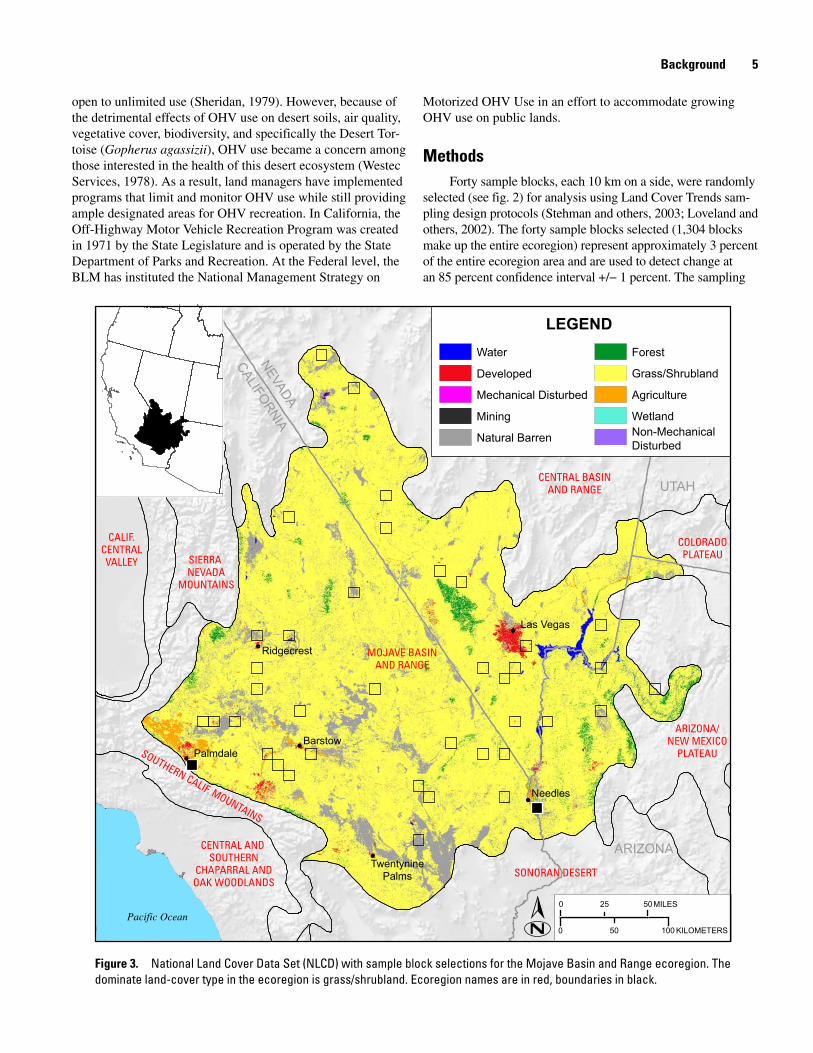
Both climatic and topographic extremes contribute to the sparseness of vegetation within the ecoregion. However, these environmental conditions also promote species diversity, and the ecoregion is home to approximately 2,000 plant species, of which 150 are introduced and 500 are endemic (Rowlands and others, 1982). According to the National Land Cover Data Set from 1992 (Vogelmann and others, 2001), the predominant land-cover type in the ecoregion is desert shrub/grassland, which covers approximately 86 percent of the ecoregion (fig. 3). The dominant shrub species throughout the ecoregion is creosote (Larrea tri-
dentata), which is found up to elevations of about 1,375 m. Near the northernmost boundary of the ecoregion, creosote begins to disappear due to cooler winter temperatures, and big sagebrush (Artemisia tridentata) becomes more common. Other com-mon plant species include white bursage (Ambrosia dumosa), Mormon tea (Ephedra sp.), Joshua Tree (Yucca brevifolia), and cactus. Pinyon-juniper woodland is found at higher elevations, consisting of single-leaf pinyon pines (Pinus monophylla) and Utah junipers (Juniperus osteosperma) (Little, 1971).
Many dry lakes forming playa deposits occur throughout the ecoregion. Large and actively migrating sand dunes are scattered throughout the ecoregion, as are geologically old and young volcanic features, such as cinder cones, domes, and lava flows. The dominant soils in the ecoregion are Orthents, Psam-ments, Fluvents, Orthids, and Argids, which generally have low moisture retention and high moisture evaporation rates (Natural Resources Conservation Service, 1981). The intermit-tent Mojave River is the major drainage in the ecoregion and has been subject to floods during nearly all recorded El Niño years (Hereford and Webb, 1997). Although very little surface water exists naturally within the ecoregion, a great deal of water moves through the ecoregion by way of the Colorado River Aqueduct. Furthermore, the small amounts of naturally existing surface water are subject to strict management. Most notably, the Mojave River has undergone much channeling and diversion throughout the time of settlement of the ecoregion (Mouat and others, 1998).
The ecoregion has historically supported human-related activities, such as military training, livestock grazing, aqueduct rights-of-way, mining, recreation, and agriculture, all of which have some level of effect on the desert landscape (Lovich and Bainbridge, 1999). Agriculture, although not extensive in the ecoregion, does occur locally along the Colorado and Mojave Rivers and west of Edwards Air Force Base and Lancaster. Grazing takes place primarily on BLM lands and is a con-troversial practice within the ecoregion, partly because of its impacts on land cover, including alteration of vegetation cover and composition as well as soil compaction (Mouat and oth-ers, 1998). Abundant geological resources have allowed for the development of extractive mining for a variety of minerals, resulting in the accumulation of tailings and modifications to fragile dry lake ecosystems.
Natural vegetation of the Mojave Basin and Range ecoregion is subjected to numerous types of anthropogenic alterations. The introduction of livestock for grazing (Bentley, 1898), off-highway vehicle use (Webb and Wilshire, 1983), urbanization and associated activities (Reible and others, 1982, Walsh and Hoffer, 1991), and military use (Lathrop, 1983, Prose and others, 1987, Prose and Wilshire, 2000, Steiger and Webb, 2000) all contribute to the loss of vegetated lands. These impacts, when combined with the harsh environmental charac-teristics, result in a landscape slow to recover from disturbance.
The most widespread recreational activity in the ecore-gion is off-highway vehicle (OHV) use, which began to rise dramatically around 1960 (Bard, 1972). OHV use in the ecoregion was initially minimally regulated, with large areas
Land-Cover Trends in the Mojave Basin and Range Ecoregion
open to unlimited use (Sheridan, 1979). However, because of the detrimental effects of OHV use on desert soils, air quality, vegetative cover, biodiversity, and specifically the Desert Tor-toise (Gopherus agassizii), OHV use became a concern among those interested in the health of this desert ecosystem (Westec Services, 1978). As a result, land managers have implemented programs that limit and monitor OHV use while still providing ample designated areas for OHV recreation. In California, the Off-Highway Motor Vehicle Recreation Program was created in 1971 by the State Legislature and is operated by the State Department of Parks and Recreation. At the Federal level, the BLM has instituted the National Management Strategy on
Motorized OHV Use in an effort to accommodate growing OHV use on public lands.
MethodsForty sample blocks, each 10 km on a side, were randomly
selected (see fig. 2) for analysis using Land Cover Trends sam-pling design protocols (Stehman and others, 2003; Loveland and others, 2002). The forty sample blocks selected (1,304 blocks make up the entire ecoregion) represent approximately 3 percent of the entire ecoregion area and are used to detect change at an 85 percent confidence interval +/− 1 percent. The sampling
Figure . National Land Cover Data Set (NLCD) with sample block selections for the Mojave Basin and Range ecoregion. The dominate land-cover type in the ecoregion is grass/shrubland. Ecoregion names are in red, boundaries in black.
Pacific Ocean
!(
!(
CALIFO
RN
IAN
EVADA
ARIZONA
UTAH
Palmdale
Las Vegas
Ridgecrest
Barstow
TwentyninePalms
Needles
MOJAVE BASINAND RANGE
CENTRAL BASINAND RANGE
SONORAN DESERT
CENTRAL AND SOUTHERN
CHAPARRAL ANDOAK WOODLANDS
SIERRA NEVADA
MOUNTAINS
ARIZONA/NEW MEXICO
PLATEAU
COLORADOPLATEAU
CALIF.CENTRALVALLEY
SOUTHERN CALIF. MOUNTAINS
Water
Developed
Mechanical Disturbed
Mining
Natural Barren
Forest
Grass/Shrubland
Agriculture
WetlandNon-MechanicalDisturbed
LEGEND
0 10050 KILOMETERS
0 5025 MILES
Background

design was random, as was the selection of sample blocks by various interpreters to reduce interpretative bias. A modified Anderson classification system (Anderson and others, 1976) was used to partition land cover into 11 distinct classes (appen-dix 1) using manual interpretation methods. Landsat Thematic Mapper (TM), Enhanced Thematic Mapper Plus (ETM+), and Multispectral Scanner (MSS) images, along with ancillary data such as topographic maps and aerial photographs, were used to derive land-cover and land-cover-change images for each sample block selected for analysis (table 1). Upon completion of sample block interpretations, postclassification comparison was used to generate land-cover change statistics for the ecoregion based on the assumption of a representative sample. A more comprehensive review of the land-cover trends methodology can be found in Loveland and others (2002).
ResultsEstimated Gross Area Change
Results show land-cover change between our thematic classes (see appendix 1) to be relatively rare and highly local-ized. Total land-area change from 1973 to 2000 is estimated at 2.6 percent (3,390 km2). The most common change observed was the conversion of an estimated 1,426 km2 of the grass/shrubland class to the developed class. An additional 651 km2 of grass/shrubland was lost to mechanical disturbance and 345 km2 to mining activities. In addition, it is estimated that 340 km2 of forest transitioned to mechanically disturbed, and 205 km2 are estimated to have transitioned from a mechani-cally disturbed state to developed.
The urbanization process is represented by the conversion of natural-cover and mechanically disturbed cover types to the developed class. Urbanization is the dominate land-cover transi-tion occurring in the ecoregion, and it follows a unidirectional pattern, terminating in the development of the desert landscape. In most instances, urbanization is represented by the direct transition of grass/shrublands to the developed class. However, in some cases the mechanically disturbed phase of urbaniza-tion was captured and reflects anthropogenic alterations such as scraping, leveling, and clearing of vegetation and soils.
Although land-cover change in the ecoregion is rare as a percent of total ecoregion area, the total area of the ecoregion converted to development is significant. Developed lands increased by 1,695 km2 from 1973 to 2000, in addition to an increase of 423 km2 in mining land. The increase of develop-ment can be largely attributed to population growth in both the Las Vegas metropolitan area and the suburban areas of Lan-caster and Palmdale along the western edge of the ecoregion.
A substantial shift has occurred in mining-related activi-ties as the ecoregion has shifted away from precious-metal and ore extraction to increased surface and aggregate mining for infrastructure construction uses. Most of the active mining operations observed in the sample blocks were arranged within close proximity of existing developed areas or an interstate highway expansion project.
Military training activities have contributed in a sub-stantial way to our disturbance estimates. For example, one sample block located at Fort Irwin National Training Center experienced high amounts of disturbance due to its location in an area of the facility where tank and other vehicle training activities are particularly intense. The intense nature of this land use combined with the fragility of the desert landscape results in a slow recovery rate (Lovich and Bainbridge, 1999, Steiger and Webb, 2000, Prose and Wilshire, 2000) and thus the persistence of the mechanical disturbance classification.
In addition to estimates of area changed, average annual rates of change were estimated by dividing the area changed per temporal interval by the number of years in the interval. Undoubtedly change is not evenly distributed across each year within a temporal interval. However, because the temporal sam-pling intervals are not equal in length (either six, seven, or eight years), for purposes of temporal comparison it is useful to com-pare average annual rates. After normalization, the 1986 to 1992 interval remained the period with the most change (table 2).
Net Change by Land-Cover TypeAs anticipated, the grass/shrubland class experienced the
most change of any class, decreasing from 89.3 percent to 87.4 percent between 1973 and 2000 (-1.9%; 2,347 km2). Between 1986 and 1992 the grass/shrubland class lost 0.9 percent (1,173 km2). Other significant changes were in the developed
TemporalCenter Point Sensor Source
ProcessedResolution Projection
1973 MSS NALC 60m UTM1980 MSS New Acquisition 60m UTM1986 MSS NALC 60m UTM1992 MSS, TM NALC, MRLC 60m, 30m UTM, Albers2000 ETM+ MRLC 30m Albers
Table 1. Characteristics of Landsat data sets used in the analysis of land-cover change.
[MSS: Multispectral Scanner; TM: Thematic Mapper; ETM+: Enhanced Thematic Mapper Plus; NALC: North American Land-scape Characterization Program; MRLC: Multi-Resolution Land Characteristics; UTM: Universal Transverse Mercator; Albers: Albers Conical Equal Area]
Land-Cover Trends in the Mojave Basin and Range Ecoregion
Time Interval Change (%) Annual area change (km2)
1973 to 1980 0.07 96.41980 to 1986 0.08 103.21986 to 1992 0.21 323.91992 to 2000 0.08 140.1
Land cover 1973 1980 1986 1992 2000
Water 0.89 0.91 0.91 0.85 0.87Developed 1.50 1.79 1.98 2.59 2.78Mech. Disturbed 0.12 0.09 0.16 0.47 0.71Mine/Quarry 1.07 1.13 1.25 1.36 1.38Natural Barren 4.73 4.73 4.70 4.68 4.68Forest 1.97 1.96 1.93 1.92 1.67Grassland/Shrub 89.25 88.93 88.61 87.55 87.36Agriculture 0.23 0.21 0.22 0.22 0.27Wetlands 0.25 0.23 0.23 0.37 0.28
1973 to 1980
Area (km2) Conversion Area (km2) Conversion Area (km2) Conversion Area (km2) Conversion
1980 to 1986 1986 to 1992 1992 to 2000
314 Grass/Shrub to Developed
202 Grass/Shrub to Developed
751 Grass/Shrub to Developed
324 Forest to Mech. Disturbed
90 Grass/Shrub to Mining
115 Grass/Shrub to Mech. Disturbed
435 Grass/Shrub to Mech. Disturbed
160 Grass/Shrub to Developed
52 Mech. Disturbed to Developed
110 Grass/Shrub to Mining
125 Water to Wetland 89 Mech. Disturbed to Developed
51.9 Wetland to Water 49 Natural Barren to Mining
110 Grass/Shrub to Mining
82 Wetland to Agriculture
Table . Normalized estimated annual land-cover change rates by time interval.
[Because time intervals are not of equal length, estimated annual change is calculated by divid-ing total change in a time interval by the number of years in the time interval.]
Table . Percent total land area by land-cover class at different times.
[The grassland/shrub class shows a steady decline while the developed class increases in each time inter-val, revealing urbanization as being the major land-cover conversion associated with the ecoregion.]
class, which had an increase of 1.3 percent (1,695 km2), and the mechanically disturbed class at +0.5 percent (652 km2). All other land-cover classes remained fairly stable throughout the study period (table 3).
Common Land-Cover Conversions
The main story of change in the Mojave Basin and Range ecoregion is urbanization of the desert landscape as reflected by our mapped conversion of grass/shrubland to developed
land. However, the driving forces of land-cover change are not uniform across the ecoregion and tend to vary at a local scale.
The four most common conversions for each time interval, presented in table 4, support urbanization being the major process driving land-cover change in the ecoregion. Grass/shrublands converting to developed is one of the top two changes by area in each temporal interval and is the top change in three of those intervals. In addition, grass/shrub-lands converting to mechanical disturbance and grass/shrub-lands converting to mining are also present in each of the
Table . Areas of common land-cover conversions by time interval.
[Grassland/shrub to developed (urbanization) is the top conversion in the first three time intervals and the second most common conversion in the final time interval.]
Results

four time intervals. These changes are commonly associated with urbanization.
Clark County, Nevada, and its largest city, Las Vegas, represent one of the fastest growing regions in the country (U.S. Census Bureau, 2001). The rapid growth of Las Vegas and the surrounding cities such as Henderson can be attributed to the development of this area as a world-famous tourist des-tination made popular primarily by the ever-apparent gaming industry. Numerous megaresort-style hotel casinos have been built since the 1970s and have attracted millions of visitors annually. The large influx of tourism within Clark County in the past 30 years has necessitated the development of infra-structure, housing, and jobs to support the tourist industry. This development has resulted in the rapid conversion of the natural desert landscape to urban land uses.
Helping this rise in tourism, a modern interstate highway system facilitates the movement of people from large popu-lated areas such as Phoenix, Arizona, and the Los Angeles metropolitan area to the Las Vegas area. Furthermore, many recreation activities exist in the Las Vegas area that attract more visitors and increase the demand for infrastructure.
Hoover Dam, Lake Mead, and the Grand Canyon are all close to Las Vegas and offer a wide range of recreational and cultural activities. These recreational opportunities in addition to a low cost of living and abundant affordable housing con-tribute to the Las Vegas area being a desirable place to live, which in turn has contributed to the increased development of the Las Vegas area.
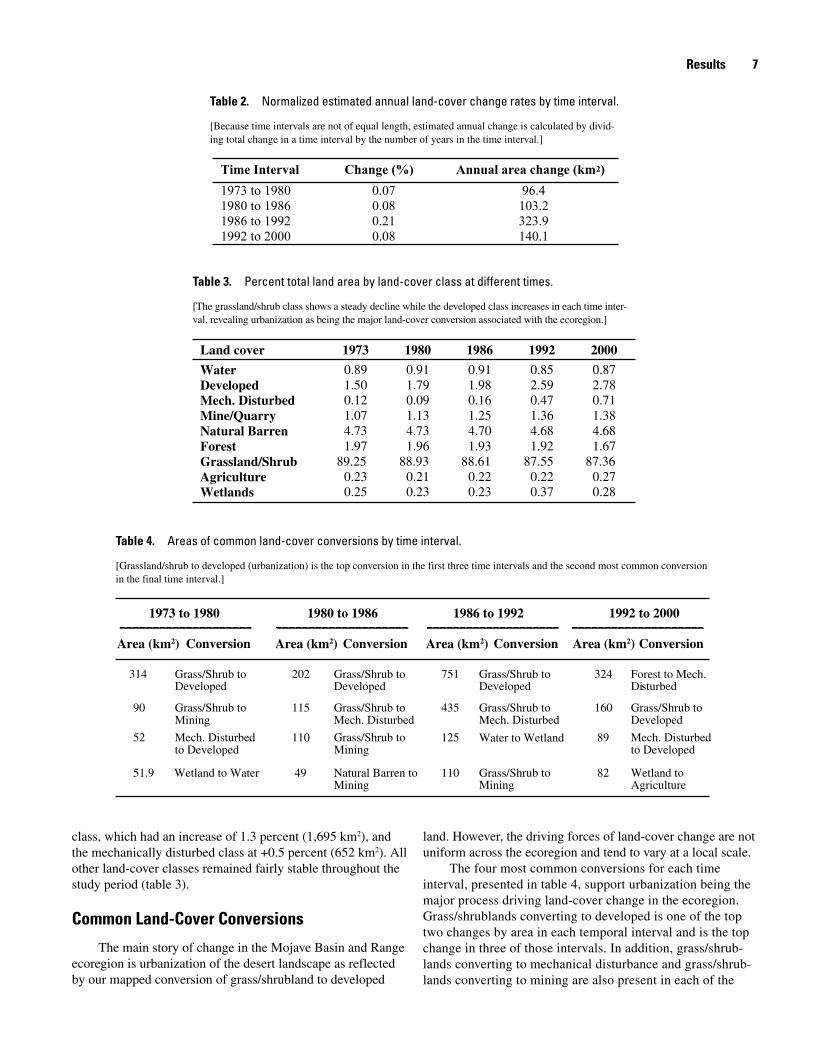
Of the 19 sample blocks that experienced some amount of change (47.5% of all sample blocks), 63 percent expe-rienced a transition to developed. The distribution of these changed blocks across the ecoregion generally follows trans-portation corridors, with the highest change blocks occurring closest to established urban areas. This is evidenced in blocks #14-555 and #14-1009. The most frequent conversions in each interval generally involved the grass/shrubland and developed classes, with mining and mechanical disturbance as associ-ated changes. Examples from sample-block interpretations are presented in figure 4.
In contrast to areas in the eastern portion of the ecore-gion, where tourism is the primary driver of change, the west-ern Mojave ecoregion is characterized by a number of smaller
1973 1980 1986 1992 2000
1973-1980 1980-1986 1986-1992 1992-2000
AGRICULTUREGRASSLAND/SHRUBMININGMECHANICAL DISTURBANCEDEVELOPED
A
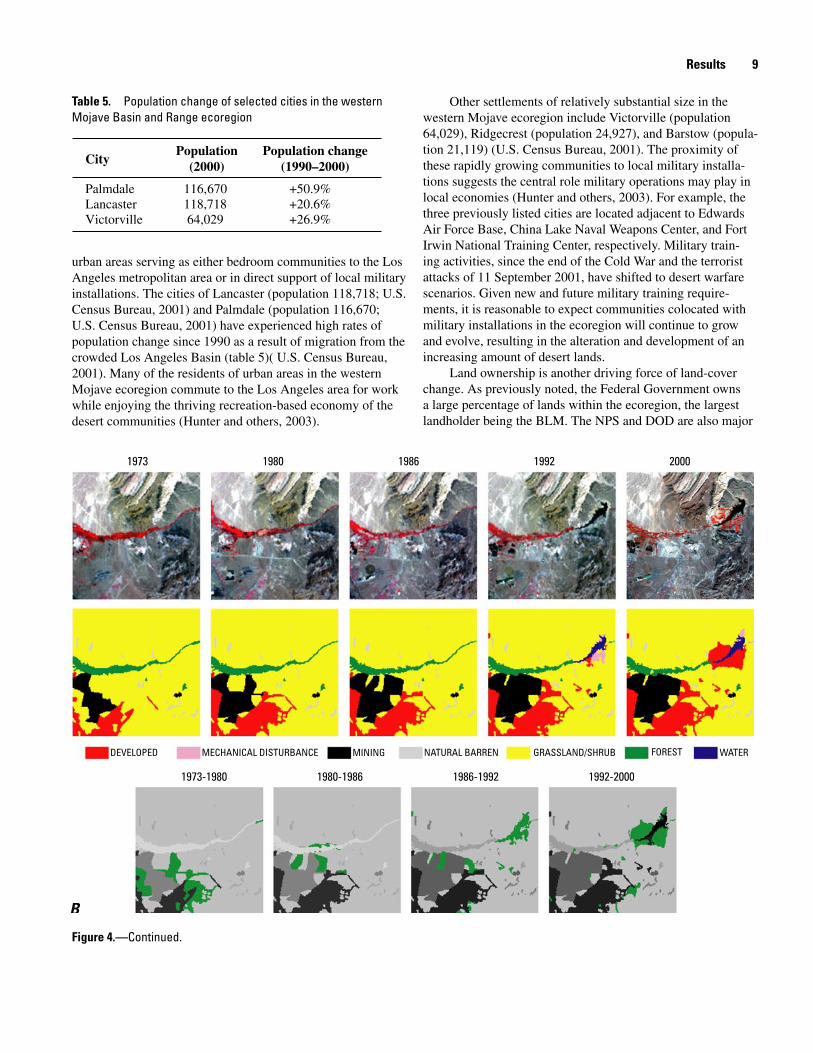
Figure . Two selected sample blocks illustrating urbanization taking place in the Mojave Basin and Range ecoregion. The top row of images is actual satellite data used to map land-cover change in each time interval. The second row of images is mapped land-cover for each time interval. The third set of images shows areas of change (in green) between successive image dates. A, Sample block #14-1009 located near Palmdale, California. B, Sample block #14-555 located near Henderson, Nevada.
Land-Cover Trends in the Mojave Basin and Range Ecoregion
CityPopulation
(2000)Population change
(1990–2000)
Palmdale 116,670 +50.9%Lancaster 118,718 +20.6%Victorville 64,029 +26.9%
Table . Population change of selected cities in the western Mojave Basin and Range ecoregion
1973 1980 1986 1992 2000
1973-1980 1980-1986 1986-1992 1992-2000
NATURAL BARREN GRASSLAND/SHRUBMININGMECHANICAL DISTURBANCEDEVELOPED FOREST WATER
B
urban areas serving as either bedroom communities to the Los Angeles metropolitan area or in direct support of local military installations. The cities of Lancaster (population 118,718; U.S. Census Bureau, 2001) and Palmdale (population 116,670; U.S. Census Bureau, 2001) have experienced high rates of population change since 1990 as a result of migration from the crowded Los Angeles Basin (table 5)( U.S. Census Bureau, 2001). Many of the residents of urban areas in the western Mojave ecoregion commute to the Los Angeles area for work while enjoying the thriving recreation-based economy of the desert communities (Hunter and others, 2003).
Other settlements of relatively substantial size in the western Mojave ecoregion include Victorville (population 64,029), Ridgecrest (population 24,927), and Barstow (popula-tion 21,119) (U.S. Census Bureau, 2001). The proximity of these rapidly growing communities to local military installa-tions suggests the central role military operations may play in local economies (Hunter and others, 2003). For example, the three previously listed cities are located adjacent to Edwards Air Force Base, China Lake Naval Weapons Center, and Fort Irwin National Training Center, respectively. Military train-ing activities, since the end of the Cold War and the terrorist attacks of 11 September 2001, have shifted to desert warfare scenarios. Given new and future military training require-ments, it is reasonable to expect communities colocated with military installations in the ecoregion will continue to grow and evolve, resulting in the alteration and development of an increasing amount of desert lands.
Land ownership is another driving force of land-cover change. As previously noted, the Federal Government owns a large percentage of lands within the ecoregion, the largest landholder being the BLM. The NPS and DOD are also major
Figure .—Continued.
Results
public-land holders (fig 2). Each of these three agencies man-ages public lands to meet various distinct goals and objectives. For instance, BLM lands are often open for public use and recreation as seen in the popularity of OHV activities (Lovich and Bainbridge, 1999). In most cases, OHV disturbances, such as single vehicle tracks, were not detected in image interpreta-tions because of the coarseness of the minimum mapping unit (60 m2) and are therefore not described by the change esti-mates. However, image interpretations identified several large staging areas where relatively large areas of grass/shrubland have gradually been stripped of vegetation. Continued use of these areas has resulted in soil compaction, preventing the re-establishment of vegetation. The growth of OHV activity in the ecoregion can be largely attributed to the open-access policy of the BLM and the close proximity of these lands to major urban areas (Sheridan, 1979).
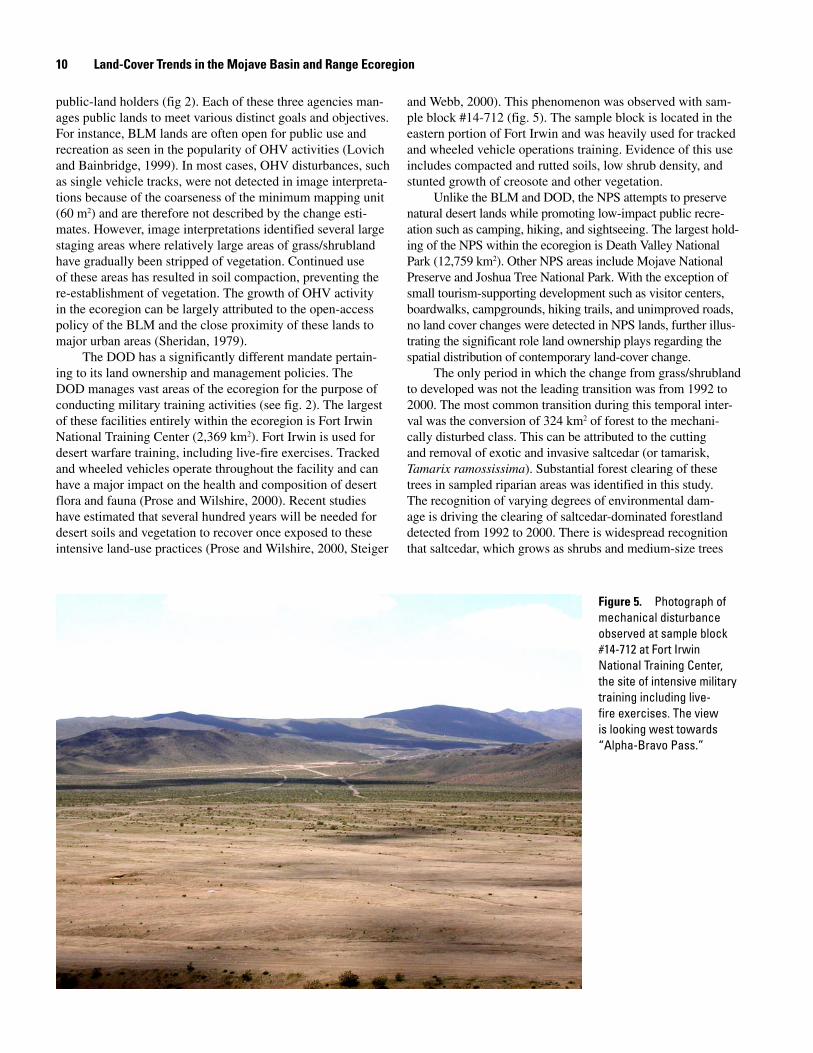
The DOD has a significantly different mandate pertain-ing to its land ownership and management policies. The DOD manages vast areas of the ecoregion for the purpose of conducting military training activities (see fig. 2). The largest of these facilities entirely within the ecoregion is Fort Irwin National Training Center (2,369 km2). Fort Irwin is used for desert warfare training, including live-fire exercises. Tracked and wheeled vehicles operate throughout the facility and can have a major impact on the health and composition of desert flora and fauna (Prose and Wilshire, 2000). Recent studies have estimated that several hundred years will be needed for desert soils and vegetation to recover once exposed to these intensive land-use practices (Prose and Wilshire, 2000, Steiger
and Webb, 2000). This phenomenon was observed with sam-ple block #14-712 (fig. 5). The sample block is located in the eastern portion of Fort Irwin and was heavily used for tracked and wheeled vehicle operations training. Evidence of this use includes compacted and rutted soils, low shrub density, and stunted growth of creosote and other vegetation.
Unlike the BLM and DOD, the NPS attempts to preserve natural desert lands while promoting low-impact public recre-ation such as camping, hiking, and sightseeing. The largest hold-ing of the NPS within the ecoregion is Death Valley National Park (12,759 km2). Other NPS areas include Mojave National Preserve and Joshua Tree National Park. With the exception of small tourism-supporting development such as visitor centers, boardwalks, campgrounds, hiking trails, and unimproved roads, no land cover changes were detected in NPS lands, further illus-trating the significant role land ownership plays regarding the spatial distribution of contemporary land-cover change.
The only period in which the change from grass/shrubland to developed was not the leading transition was from 1992 to 2000. The most common transition during this temporal inter-val was the conversion of 324 km2 of forest to the mechani-cally disturbed class. This can be attributed to the cutting and removal of exotic and invasive saltcedar (or tamarisk, Tamarix ramossissima). Substantial forest clearing of these trees in sampled riparian areas was identified in this study. The recognition of varying degrees of environmental dam-age is driving the clearing of saltcedar-dominated forestland detected from 1992 to 2000. There is widespread recognition that saltcedar, which grows as shrubs and medium-size trees
Figure . Photograph of mechanical disturbance observed at sample block #14-712 at Fort Irwin National Training Center, the site of intensive military training including live-fire exercises. The view is looking west towards “Alpha-Bravo Pass.”
10 Land-Cover Trends in the Mojave Basin and Range Ecoregion

mostly in riparian areas, is undesirable from the standpoint of maintaining vigorous native ecosystems. As a result, saltcedar is included on the California Exotic Pest Plant Council’s list of exotic pest plants of greatest ecological concern (Lovich and de Gouvenain, 1998). Saltcedar competes with and replaces native plant communities, degrades wildlife habitat, alters stream morphology, uses large amounts of groundwater, increases fire frequency, reduces recreational and agricultural usage, and reduces biodiversity. Many managed areas within the ecore-gion, such as the Havasu National Wildlife Refuge, implement programs to remove saltcedar and revegetate mechanically treated areas with native species in efforts to alleviate these consequences. However, mechanical treatment of saltcedar stands is not without potentially devastating consequences. The southwestern willow flycatcher (Epidonax trailii extimus) has begun nesting in saltcedar, causing great concern among biolo-gists that biological control of saltcedar may reduce flycatcher populations (DeLoach and others, 2000).
The conversion of 34 km2 of wetlands to water from 1973 to 1980, 125 km2 of water to wetlands from 1986 to 1992, and 28 km2 of wetlands to water from 1992 to 2000 can be attributed to fluctuations of surface water levels in marshlands. Wetland-to-water and water-to-wetland land-cover conversions are relatively local changes, because approximately 81 percent of all Mojave ecoregion wetlands occur along the Colorado, Virgin, and Muddy rivers upstream of and flowing into Lake Mead and along the lower Colorado River downstream from Lake Mead. This localization of wetland distribution is illus-trated by 53 percent of all ecoregion wetlands occurring within a 7-km buffer along a 40-km stretch of the lower Colorado River near Needles, California. Furthermore, these changes are dictated by a combination of environmental and managerial driving forces. Large wetland areas, such as Topock Marsh (16 km2) near Needles and part of the Havasu National Wildlife Refuge, depend on water diversions from the Colorado River. As a result, these areas are subject to fluctuations in flow based on annual variations in water availability as well as met-ropolitan water needs in coordination and consideration of the best water levels for waterfowl and shorebird habitat (Lower Colorado River Multi-Species Conservation Program, 2004).
Temporal Component of Change
Results indicate that land-cover change is fairly consis-tent over time, with the exception of a substantial increase in the amount of urbanization occurring between 1986 and 1992. The normalized average annual rate for all land-cover changes is estimated at 0.07 to 0.08 percent for all time periods with the exception of the 1986 to 1992 (0.21%/year). Change esti-mates also show no shift in the dominant type of land-cover change, urbanization remaining the primary change observed during all temporal intervals.
It is presumed that favorable economic conditions during the mid-1980s, combined with rapid construction farther away from the Los Angeles Basin, served to make the 1986 to 1992 the most dynamic in terms of land-cover change. Many new
megaresort casinos were developed during this time, result-ing in more jobs and economic opportunity for the Las Vegas region. Between 1980 and 1990, Clark County added more than a quarter of a million residents. The Palmdale and Lan-caster region of the western Mojave also experienced a spike in growth again because of a favorable economic landscape and the availability of relatively inexpensive housing still within commuting range of greater Los Angeles.
VerificationVerification of land-cover change results for the Mojave
ecoregion is divided into two parts: (1) how well the sample blocks represented the ecoregion and (2) how accurately image interpretations identified and described land-cover dynamics. The sampling methodology used was developed to achieve greater statistical precision on smaller areas of land when compared to mapping change in the entire ecoregion while also being more cost effective than wall-to-wall mapping (Stehman and others, 2003). The statistical formula used to determine the number of sample blocks needed for the ecoregion was based on the project-established standard of detecting change within +/− 1 percent at an 85-percent confidence interval (that is, the accuracy of interpretation) (Stehman and others, 2003, Loveland and oth-ers, 2002). Change estimates with a margin of error greater than 1 percent were the result of higher than expected variability in the spatial distribution of change, such as rare events or clumped and clustered change (Loveland and others, 2002).
The interpretations of Mojave Basin and Range land-cover change indicate that the 40 samples used to estimate rates of land-cover change for the ecoregion result in stan-dard error limits within our goal of mapping change at +/− 1 percent at an 85-percent confidence interval (table 6). The 1986 to 1992 period had the highest error margin at +/− 0.94 percent and was the period with the most amount of change (1.27%), while the 1980 to 1986 period had the lowest margin of error (+/− 0.24%) and was the period with the least amount of change at 0.46 percent.
To verify image interpretations of land-cover change we focused on the developed land-cover type. Conversion to devel-oped is the dominant change we documented, and we assume its verified performance is parallel to the other mapped conver-sions. To confirm this, we accessed the U.S. Bureau of Census data that documents the acres of new development. Although
ChangeInterval Change
Avg. AnnualChange
85% CI
1973-1980 0.52% 0.07% +/- 0.279%1980-1986 0.46% 0.08% +/- 0.246%1986-1992 1.27% 0.21% +/- 0.940%1992-2000 0.64% 0.08% +/- 0.476%
Table . Precision of change estimates.
Verification 11

there is no definitive data source that can be used to measure the true accuracy of our change estimate, the U.S. Census provides a highly accurate source of data to compare change in the developed classification. However, census data are not without limitations. For this project, county-level census data could not be relied upon to validate change estimates because of the size and arrangement of counties that make up the ecoregion. For example, San Bernardino County has a vast majority of its area within the ecoregion, but a majority of its population resides in the small area outside of the ecoregion. The use of finer census units such as tracts and block groups is difficult because as
population changes over time, boundary locations change and single reporting units are divided into multiple units.
Clark County, Nevada, has been one of the fastest growing counties in the country (fig. 6) and provides a good proxy for the estimation of change in developed land cover. The cities of Las Vegas, North Las Vegas, and Henderson are within both Clark County and the Mojave ecoregion and have undergone rapid urbanization since 1970. This corresponds with our estimates that conversion of the vegetated landscape to urban uses is the leading type of land-cover change occur-ring in the ecoregion.
Year
Num
ber o
f per
sons
add
ed in
pre
viou
s te
n ye
ars
523,364
210,994
441,298
189,799
278,372
835,082LAND COVER TRENDS
0
100000
200000
300000
400000
500000
600000
700000
800000
900000
1900 1910 1920 1930 1940 1950 1960 1970 1980 1990 2000
Inyo CountySan Bernardino CountyClark CountyEsmeralda County
Popu
latio
n (th
ousa
nds)
0
50
100
150
200
250
300
350
400
450
500
15
30
45
60
75
90
105
120
135
150
1965 1970 1975 1980 1985Year
1990 1995 2000 2005 2010
7 years 6 years 6 years 8 years
0.08% 0.07% 0.21% 0.08%
VictorvilleLancasterPalmdale
Western Mojave
HendersonNorth Las VegasLas Vegas
Eastern Mojave
55 km2/ year
41 km2/ year
131 km2/ year
31 km2/ year
Avg. annual change to Developed
Figure . Population trends in counties of the Mojave Basin and Range ecoregion. Data are number of persons added to each county based on U.S. Census. San Bernardino County, California, and Clark County, Nevada, have experienced the most growth of any counties in the ecoregion, adding more than 175,000 persons in each decade since 1980. The time period studied in the Land Cover Trends Project is indicated.
Figure . Population trends for major cities within the Mojave Basin and Range ecoregion. The gray bars and the area and percent figures show average annual increase in the developed category during the four time intervals studied.
1 Land-Cover Trends in the Mojave Basin and Range Ecoregion
To further verify estimates of land-cover change, city-level population data were used. Cities in the ecoregion with a 2000 census population greater than 20,000 were selected for comparison. It is reasonable to conclude that changes in popu-lation of major urban areas in the ecoregion would correspond to our estimates of change in the developed class. Figure 7 plots the population trend of the six largest cities in the ecore-gion and shows the estimated average annual increase in the developed class. A relatively large amount of grass/shrublands was converted to developed lands between 1986 and 1992 (131 km2/year) and this corresponds to a general spike in popula-tion trends of major cities during this same period. However, it should be noted that in the final time interval (1992-2000) our change estimates appear to contradict the city population data. In this interval we see the largest population numbers for the six cities used for comparison, while our study estimates urbanization to be at its lowest during this interval. This could in part be due to a lag between the urbanization process and the time it takes to populate new developments.
SummaryLand-cover change estimates for the Mojave Basin and
Range ecoregion were derived by using a probabilistic random sampling approach (Stehman and others, 2003, Loveland and others, 2002) and mapping land-cover change for five dates and four temporal intervals at a 60-m minimum mapping unit (Loveland and others, 2002). Forty 10-km by 10-km sample blocks were selected, and land-cover change was mapped for each time interval in each block using a modified Anderson classification scheme (appendix 1).
Our results reveal that land-cover change between thematic classes in the Mojave is relatively rare and is highly localized. Urbanization is the primary type of change, although other human-use activities such as military training and recreation are significant contributors to change within the ecoregion. The most dynamic period observed was the 1986 to 1992 interval, with 0.21 percent change per year. All of the other intervals remained relatively constant at less than 0.10 percent change per year.
Land-cover change in the Mojave is most likely to occur at or near the edges of existing urban areas such as those found near Las Vegas, Nevada, and Palmdale and Lancaster, Cali-fornia. Other urban areas associated with military installations are also places where change is likely to occur, especially in the developed and grass/shrubland classes. However, change in more remote locations was not uncommon, as was seen in military training sites and isolated wetland regions.
The key drivers of change include population growth, land ownership, and recreation opportunities. Population growth is occurring for various reasons in different parts of the ecoregion. The Las Vegas area has grown significantly since the early 1970s and is now one of the main vacation destina-tions in the country. To satisfy this demand, there has been a large increase in population to support the local gaming and
tourism industry. Change in the western portion of the ecore-gion is occurring for different reasons, as people seek outdoor recreation activities and affordable housing all within commut-ing distance to major metropolitan cities.
Federal land ownership appears to be a major driver as well. Various Federal government agencies operate under different mandates, thus impacting the landscape in various ways, as seen in the comparison of National Park Service and Department of Defense land holdings. The level and intensity of use allowed in designated lands appears to lead to increased disturbance when heavy use is allowed and/or required. Lands set aside for conservation, as is the case of many NPS holdings, generally appear less impacted by human use and disturbance. BLM lands range from low-intensity use to high-intensity use and more disturbance is generally associated with areas of heavy off-highway vehicle activity.
References
Anderson, J.R., Hardy, E.E., Roach, J.T., and Witmer, R.E., 1976, A land use and land cover classification system for use with remote sensor data: U.S. Geological Survey Pro-fessional Paper 964, 28 p.
Bard, R.C., 1972, Settlement patterns of the eastern Mojave Des-ert: Los Angeles, University of California, Ph.D. dissertation.
Bentley, H.L., 1898, Cattle ranges of the southwest; a history of the exhaustion of the pasturage and suggestions for its restoration: U.S. Department of Agriculture, Farmers Bul-letin 72, p.1-31.
DeLoach, C.J., Carruthers, R.I., Lovich, J.E., Dudley, T.L., and Smith, S.D., 2000, Ecological interactions in the biologi-cal control of saltcedar (Tamarix spp.) in the United States; toward a new understanding, in Spencer, N. R., ed., Pro-ceedings of the X International Symposium on Biological Control of Weeds, 4-14 Jul 1999: Bozeman, Montana State University, p. 819-873.
Environmental Protection Agency, 1999, Level III ecoregions of the continental United States: Corvallis, Oregon, U.S. Environmental Protection Agency, National Health and Environmental Effects Research Laboratory, 1:7,500,000-scale map.
Hereford, R., and Webb, R.H, 1997, How often does rainfall cause overland flow in the arid Mojave Desert? A study of reservoir deposits in Valjean Valley [abs.]: Quarterly San Bernardino County Museum Association, v. 44, p. 14.
Hunter, L.M., Gonzalez, M.de J., Stevenson, M., Karish, K.S., Toth, R., Edwards, T.C., Lilieholm, R.J., and Cablk, M., 2003, Population and land use change in the California Mojave; natural habitat implications of alternative futures: Population Research and Policy Review, v. 22, p. 373-379.
Summary 1

Lathrop, E. W., 1983, The effect of vehicle use on desert vegetation, in Webb, R. H., and Wilshire, H. G., eds., Environmental effects of off-road vehicles; impacts and management in arid regions: New York, Springer-Verlag, p. 154-166.
Little, E.L., Jr., 1971, Atlas of United States trees; conifers and important hardwoods: U.S. Department of Agriculture Miscellaneous Publication 1146, v. 1, 9 p., 200 maps.
Loveland, T.R., Sohl, T.L., Stehman, S.V., Gallant, A.L., Say-ler, K.L., and Napton, D.E., 2002, A strategy for estimat-ing the rates of recent United States land-cover changes: Photogrammetric Engineering and Remote Sensing, v. 68, no. 10, p. 1091-1095.
Lovich, J.E., and Bainbridge, D., 1999, Anthropogenic deg-radation of the southern California desert ecosystem and prospects for natural recovery and restoration: Environmen-tal Management, v. 24, p. 309-326.
Lovich, J.E., and de Gouvenain, R.G., 1998, Saltcedar inva-sion in desert wetlands of the southwestern United States; ecological and political implications, in Majumdar, S. K., Miller, E. W., and Brenner, F. J., eds., Ecology of wetlands and associated systems: Pennsylvania Academy of Science, p. 447-467.
Lower Colorado River Multi-Species Conservation Program, 2004, Lower Colorado River Multi-Species Conservation Program, Habitat Conservation Plan, Final: Sacramento, California, Jones and Stokes, v. 2.
Mouat, D.A., Kiester, R., and Baker, J., 1998, Analysis and assessment of impacts on biodiversity; a framework for environmental management on DoD Lands within the Cali-fornia Mojave Desert; a research plan: Corvallis, Oregon, U.S. Environmental Protection Agency, 61 p.
Natural Resources Conservation Service, 1981, Land resource regions and major land resource areas of the United States: USDA Agriculture Handbook 296, 156 p.
Omernik, J.M., 1987, Ecoregions of the conterminous United States: Annals of the Association of American Geographers, v. 77, p. 118-125.
Prose, D. V., and Wilshire, H. G., 2000, The lasting effects of tank maneuvers on desert soils and intershrub flora: U.S. Geological Survey Open File Report 00-512, 22 p.
Prose, D. V., Metzger, S. K., and Wilshire, H. G., 1987, Effects of substrate disturbance on secondary plant succession, Mojave Desert, California: Journal of Applied Ecology, v. 24, p. 305-313.
Reible, D. D., Ouimette, J. R., and Shair, F. H., 1982, Atmo-spheric transport of visibility degrading pollutants into California Mojave Desert: Atmospheric Environment, v. 16(3), p. 599-613.
Rowlands, P., Johnson, H., Ritter, E., and Endo, A., 1982, The Mojave Desert, in Bender, G.L., ed., Reference handbook on the deserts of North America: Westport, Connecticut, Greenwood Press, 594 p.
Sheridan, D., 1979, Off-road vehicles on public land: Council on Environmental Quality, 84 p.
Stehman, S.V., Sohl, T.L., and Loveland, T.R., 2003, Statisti-cal sampling to characterize recent United States land-cover change: Remote Sensing of Environment, v. 86, p. 517-529.
Steiger, J.W., and Webb, R.H, 2000, Recovery of perennial vegetation in the military target sites in the eastern Mojave Desert, Arizona: U.S. Geological Survey Water-Resources Investigations Report 00-355, 28 p.
U.S. Census Bureau, 2001, American Fact Finder [http://fact-finder.census.gov/home/saff/main.html?_lang=en (accessed May 1, 2005)].
Vogelmann, J.E., Howard, S.M., Yang, L., Larson, C.R., Wylie, B.K., and van Driel, N., 2001, Completion of the 1990s National Land Cover Data Set for the conterminous United States from Landsat Thematic Mapper data and ancillary data sources: Photogrammetric Engineering & Remote Sensing, v. 67, p. 650-662.
Walsh, P.A., and Hoffer, T. E., 1991, The changing environ-ment of a desert boomtown: The Science of the Total Envi-ronment, v. 105, p. 233-258.
Webb, R. H., and Wilshire, H. G., 1983, Environmental effects of off-road vehicles; impacts and management in arid regions: New York, Springer-Verlag, 534 p.
Westec Services, Inc., 1978, A history of land use in the California Desert Conservation Area: Riverside, Califor-nia, prepared for Bureau of Land management, Desert Planning Staff.
1 Land-Cover Trends in the Mojave Basin and Range Ecoregion
Appendix 1. Land-Cover Classes and Definitions Used in the Land-Cover Trends Project.
Definitions used in this project are based on the original Anderson and others (1976) Level I definitions, so that the land-cover data developed are consistent with those pro-duced through other projects. The spatial resolution of the trends database is 60 m2. Features with ground footprints less than the minimum mapping unit are not mapped. Our ability to identify and map these land-cover classes is lim-ited by the technical specifications of Landsat MSS, TM, and ETM+ sensors and by the local and regional landscape characteristics that affect the form and contrast of land-cover characteristics.
Water Areas persistently covered with water, such as streams, canals, lakes, reservoirs, bays, or oceans.
Developed Areas of intensive use, with much of the land covered with structures (for example, high-density residential, commercial, industrial, or transportation), or less intensive uses where the land-cover matrix includes both vegetation and structures (for example, low-density residential, recreational facilities, cemeteries, or transportation and utility corridors), including any land functionally related to the developed or built-up activity.
Mechanically disturbed or transitional Land in an altered unvegetated state that, because of disturbances by mechani-cal means, is in transition from one cover type to another. Mechanical disturbances include forest clearcutting, earthmov-ing, scraping, chaining, reservoir drawdown, and other related human-induced changes.
Mining Areas with extractive mining activities that have a sig-nificant surface expression. This includes (to the extent that these
features can be detected) mining buildings, quarry pits, overbur-den, tailings and leach, evaporative, or other related components.
Natural barren Land comprising natural occurrences of soils, sand, or rocks where less than 10 percent of the area is vegetated.
Forests and woodland Tree-covered land where the tree-cover density is greater than 10 percent. Note that cleared forest land (that is, clearcuts) will be mapped according to current cover (for example, disturbed or transitional, shru-bland/grassland).
Shrubland/grassland Land dominantly covered with grasses, forbs, or shrubs. The vegetated cover must total at least 10 percent of the area.
Cropland and pasture Land in either a vegetated or non-vegetated state used for the production of food or fiber. This includes cultivated and uncultivated croplands, hay lands, pasture, orchards, vineyards, and confined livestock opera-tions. Note that forest plantations are considered as forests or woodlands, regardless of the use of the wood products.
Wetland Lands where water saturation is the determining factor in soil characteristics, vegetation types, and animal communities. Wetlands comprise water and vegetated cover.
Nonmechanical disturbed or transitional Land in an altered nonvegetated state that, because of disturbances by nonme-chanical means, is in transition from one cover type to another. Nonmechanical disturbances include wind, floods, fire, ani-mals, and other related sources.
Snow and ice Land where the accumulation of snow and ice does not completely melt during the summer period.
Appendix 1 1