laboratory of combustion engines theory
TRANSCRIPT
Warsaw University of Technology
Faculty of Automotive and Construction Machinery Engineering
Institute of Vehicles
Laboratory of Combustion Engines Theory
Lab work №4
INDICATOR DIAGRAM
Developed by: Jakub Lasocki, PhD Eng

2
1. INTRODUCTION
The indicator diagram of a reciprocating internal combustion engine is a graphical
representation of the cyclic variations of pressure within the engine cylinder according to the
changes of crankshaft angle or corresponding in-cylinder volume. The open indicator diagram
(Fig. 1) refers to the case of plotting the pressure p against the crankshaft angle α, while the
closed indicator diagram (Fig. 2) – the pressure p against the cylinder volume V.
Fig. 1. An example of the open indicator diagram of a compression-ignition engine
Fig. 2. An example of the closed indicator diagram of a compression-ignition engine
The relationship between the indicator diagram and the actual operating cycle of the four-
stroke combustion engine can be seen in Fig. 3. It shows the valve timing, the start of
0
2
4
6
8
10
12
-360 -270 -180 -90 0 90 180 270 360
p [
MP
a]
α [deg]
0
2
4
6
8
10
12
0 0,0002 0,0004 0,0006 0,0008 0,001 0,0012
p [
MP
a]
V [m3]

3
combustion and the piston position inside the cylinder for a typical automotive engine. It should
be mentioned that in a four-stroke combustion engine, two crankshaft revolutions, and therefore
four piston movements (strokes), are required to complete a full cycle.
Fig. 3. The closed indicator diagram with marked valve timing
Data necessary for plotting the indicator diagram are obtained experimentally by measuring
the instantaneous in-cylinder gas pressure and the instantaneous crank angle over one operating
cycle of the engine. The term “indicator” is used because the first diagrams of this type used to
be generated with a mechanical device called an engine indicator [1]. A typical modern engine
indicating system includes a piezoelectric pressure sensor located inside engine combustion
chamber, a charge amplifier for signal processing, an optical angular encoder to determine the
angular position of the crankshaft, with reference to the Top Dead Centre (TDC) related to the
compression stroke, and a data acquisition system [2].
Comparison of the results of measurements carried out for a number of successive operating
cycles of an engine reveals substantial variations of the in-cylinder pressure on a cycle-by-cycle
basis (Fig. 4). It is caused mainly by the differences in the gas flow pattern, various amounts of
air and fuel fed to the cylinder and, consequently, unique mixture formation in each cycle. As
V
p
Intake
valve
Atmospheric
pressure
Exhaust
valve
Start of
combustion
IVO
Start of
combustion
EVC
IVO
EVC
BDCTDC
EVO
IVC
Intake
process
Exhaust
process
EVO
IVC
Trajectory of
connecting rod journal
TDC BDC
Stroke length
Displaced
cylinder volume
Combustion
chamber
volume
TDC – Top Dead Centre
BDC – Bottom Dead Centre
EVC/EVO – Exhaust valve
closing/opening
IVC/IVO – Inlet valve
closing/opening

4
a result, each combustion process develops differently, and the shape of the indicator diagram
is not exactly the same. To overcome this problem, one representative indicator diagram for
given engine operating conditions is usually designated using statistical averaging of
measurement results.
Fig. 4. Cylinder pressure variations in fifty consecutive cycles of a spark-ignition engine:
j – cycle number
2. CALCULATIONS OF ENGINE OPERATING PARAMETERS BASED ON THE
INDICATOR DIAGRAM
The analysis of the indicator diagram is a fundamental one and used for the investigation of
fuel combustion process occurring inside the engine cylinder. It allows determining work
transfer between the gases and the piston. Above all, it provides the information on the mean
indicated pressure, the indicated work and power, the maximum combustion pressure and
compression pressure, the maximum rate of pressure rise and heat-release rate, the crank angles
at which these maximums occur, as well as characteristic phases of the combustion process.
Besides, knowing the engine crankshaft rotation speed, the engine torque and the heating value
of the fuel, it is possible to calculate indicated, mechanical, theoretical, thermal and overall
efficiencies of the engine.
The open indicator diagram can be created straightforward by plotting the pressure against
the crank angle for one engine operating cycle (0–720 deg). In order to obtain the closed
indicator diagram, the instantaneous cylinder volume as a function of the crank angle V(α) has
to be determined:
j
p
5
αsin11
1cosα1r
4
πDVαV 22
2
ch (1)
where:
Vch = Vdc/(ε-1) – the combustion chamber volume,
Vdc = πD2S/4 – the displaced cylinder volume,
ε – the engine compression ratio,
D – the cylinder diameter,
S – the piston stroke,
r = S/2 – the crank radius,
λ = r/l – the connecting rod coefficient,
l – the connecting rod length.
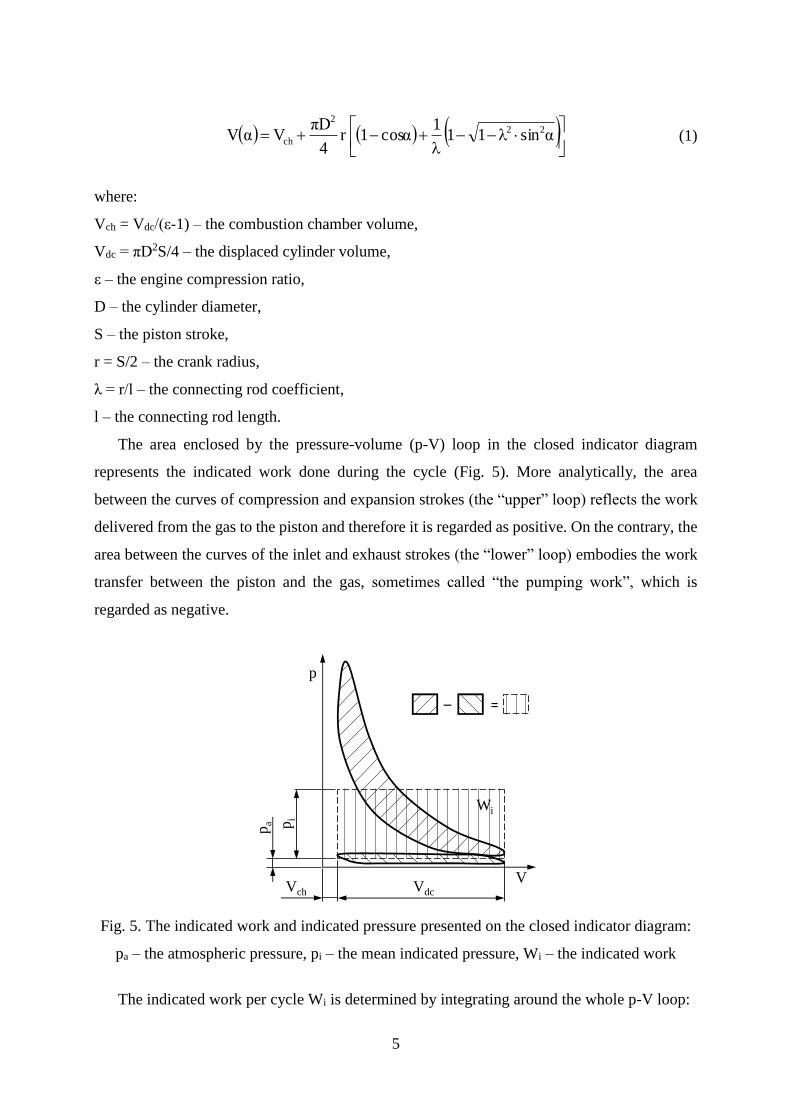
The area enclosed by the pressure-volume (p-V) loop in the closed indicator diagram
represents the indicated work done during the cycle (Fig. 5). More analytically, the area
between the curves of compression and expansion strokes (the “upper” loop) reflects the work
delivered from the gas to the piston and therefore it is regarded as positive. On the contrary, the
area between the curves of the inlet and exhaust strokes (the “lower” loop) embodies the work
transfer between the piston and the gas, sometimes called “the pumping work”, which is
regarded as negative.
Fig. 5. The indicated work and indicated pressure presented on the closed indicator diagram:
pa – the atmospheric pressure, pi – the mean indicated pressure, Wi – the indicated work
The indicated work per cycle Wi is determined by integrating around the whole p-V loop:
V
p
VdcVch
pi
pa
– =
Wi

6
pdVWi (2)
Alternatively, the indicated work can be obtained from the indicator diagram by dividing
the p-V loop into four curves, that correspond to individual piston strokes, estimating the areas
under each curve using integration, and summing these areas with the proper signs:
espscsisi WWWWW (3)
where:
Wis – the work of the intake stroke,
Wcs – the work of the compression stroke,
Wps – the work of the expansion (power) stroke,
Wes – the work of the exhaust stroke.
The mean indicated pressure pi is the conventional constant pressure which, if acted on the
piston only during the expansion (power) stroke, would perform the same work as the variable
pressure that actually acts on the piston during the entire engine operating cycle. The mean
indicated pressure is calculated according to the formula:
dc
ii
V
Wp (4)
The indicated power per cycle Pi is related to the indicated work per cycle by:
t
WP i
i (5)
where:
t = 60∙τ/n [s] – the time of performing work,
τ – the number of crank revolutions for each power stroke per cylinder (equals 2 for four-stroke
engines and 1 for two-stroke engines),
n [rpm] – the crankshaft rotation speed.
The indicated power concerns the rate of work transfer from the gas to the piston within the
cylinder. Part of this work is further consumed for overcoming engine friction and driving
engine accessories. As a result, the actual power output determined in engine testing on

7
a dynamometer called the effective (useful) power, and it has a lower value than the indicated
power. Related parameters, i.e. the mean effective pressure and the effective work, are obtained
in a similar manner.
The mean effective pressure pe is given by:
nV
τ60Pp
d
ee
(6)
where:
Pe – the effective power,
Vd – the displaced engine volume.
The effective work per cycle We is calculated as follows:
dcee VpW (7)
or
i
tPW e
e
(8)
where:
i – the number of cylinders.
3. THE EFFICIENCY AND ENERGY BALANCE OF THE COMBUSTION ENGINE
A scheme of energy transfer and related losses in an internal combustion engine is presented
in Fig. 6. It is possible to determine the efficiency of the engine, i.e. the efficiency of the process
of converting the chemical energy, contained in the fuel supplied to the engine, to the
mechanical work.
The heat Q originates from the chemical energy contained in the fuel supplied to the engine
cylinder and released by the complete combustion during one engine operating cycle:
in60
τQGQ HVf
(9)
where:
fG – the fuel mass flow rate,
QHV – the heating value of the fuel.

8
Fig. 6. Energy transfer and energy losses in an internal combustion engine
The concept of theoretical efficiency of the engine ηt is applied to its theoretical (ideal)
cycle (see section 4). It is defined as a ratio of the theoretical work done to the heat (or more
precisely the energy of the fuel) supplied to the engine during one cycle:
Q
Wη t
t (10)
It is the efficiency that takes into account the need to release heat in a closed cycle, in
accordance with the second law of thermodynamics. The theoretical work would have been
done by the engine if it worked as in the accepted theoretical cycle. Theoretical efficiency is,
therefore, a measure of heat losses caused by the inevitable heat transfer between the hot and
cold thermal reservoirs1. The equivalent of these losses in the real engine is the loss of the heat
with exhaust gases.
As previously mentioned, there are significant differences between theoretical and real
engine cycles. The indicated work has a lower value than the theoretical work due to various
losses occurring in the actual engine, for example, related to gas exchange processes, which is
1 A heat engine operates by transferring energy between two heat reservoirs, i.e. from a warmer region to a colder
region of space, and converting some of that energy into mechanical work.
Energy contained
in the fuel (Q)
Theoretical
work (Wt)
Indicated
work (Wi)
Effective
work (We)
Heat release losses
according to the 2nd
law of thermodynamics
Thermal losses
Mechanical losses
9
not taken into account in theoretical cycles, or non-ideal character of the heat supply and heat
rejection processes. These aspects are included in the indicated efficiency of the engine ηi:
t
ii
W
Wη (11)
The thermal efficiency of the engine ηth characterizes the operating cycle of the real engine.
It is defined as the ratio of indicated work to the heat released from the fuel over one cycle:
Q
Wη i
th (12)
The mechanical efficiency of the engine ηm takes into account mechanical losses of the
indicated work due to the friction and the necessity of driving engine accessories. The
mechanical efficiency is the ratio of the following effective and indicated parameters: pressure,
work or power. It could be calculated according to the following formula:
i
e
i
e
i
em
P
P
W
W
p
pη (13)
The overall (an effective) efficiency of the engine ηe is defined as the ratio of the effective
work to the heat supplied:
Q
Wη e
e (14)
The overall engine efficiency is also called the fuel conversion efficiency because it
characterizes the entire process of conversion of fuel energy to the mechanical work. It is
connected with previously defined efficiencies as:
mite ηηηη (15)
or
mthe ηηη (16)
The overall efficiency is the most commonly used definition of engine efficiency for
practical applications because it is based on an easily measured quantities, i.e. the heating value
10
of the fuel, defining the usable energy supplied to the engine, and the effective torque, necessary
for calculating the effective power and then the effective work.
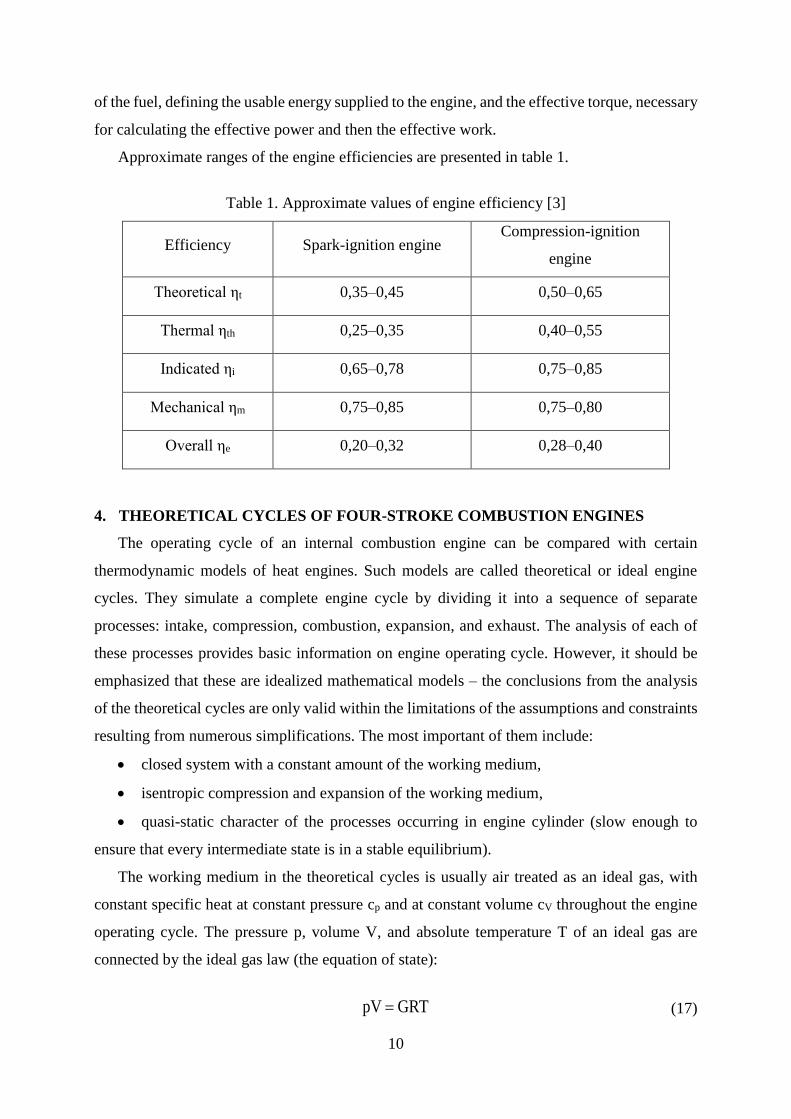
Approximate ranges of the engine efficiencies are presented in table 1.
Table 1. Approximate values of engine efficiency [3]
Efficiency Spark-ignition engine Compression-ignition
engine
Theoretical ηt 0,35–0,45 0,50–0,65
Thermal ηth 0,25–0,35 0,40–0,55
Indicated ηi 0,65–0,78 0,75–0,85
Mechanical ηm 0,75–0,85 0,75–0,80
Overall ηe 0,20–0,32 0,28–0,40
4. THEORETICAL CYCLES OF FOUR-STROKE COMBUSTION ENGINES
The operating cycle of an internal combustion engine can be compared with certain
thermodynamic models of heat engines. Such models are called theoretical or ideal engine
cycles. They simulate a complete engine cycle by dividing it into a sequence of separate
processes: intake, compression, combustion, expansion, and exhaust. The analysis of each of
these processes provides basic information on engine operating cycle. However, it should be
emphasized that these are idealized mathematical models – the conclusions from the analysis
of the theoretical cycles are only valid within the limitations of the assumptions and constraints
resulting from numerous simplifications. The most important of them include:
closed system with a constant amount of the working medium,
isentropic compression and expansion of the working medium,
quasi-static character of the processes occurring in engine cylinder (slow enough to
ensure that every intermediate state is in a stable equilibrium).
The working medium in the theoretical cycles is usually air treated as an ideal gas, with
constant specific heat at constant pressure cp and at constant volume cV throughout the engine
operating cycle. The pressure p, volume V, and absolute temperature T of an ideal gas are
connected by the ideal gas law (the equation of state):
GRTpV (17)
11
where:
G – the mass of the gas,
R – the specific gas constant (different for each gas species).
The complex process of heat release as a result of fuel combustion in the actual engine is
replaced in the theoretical cycle by simply heat supply to the cycle. Similarly, the heat rejected
by exhaust gases in the actual engine is assumed to be removed after work is done in the
theoretical cycle. The particular type of theoretical cycle depends mainly on the method of heat
supply and rejection.
There are three basic theoretical engine cycles commonly used for approximation of the
operation of four-stroke reciprocating combustion engine:
the Otto cycle (heat supplied at constant volume),
the Diesel cycle (heat supplied at constant pressure),
the Sabathé cycle (mixed; heat supply split into constant volume and constant pressure).
In each of these theoretical cycles, heat rejection occurs at constant volume.
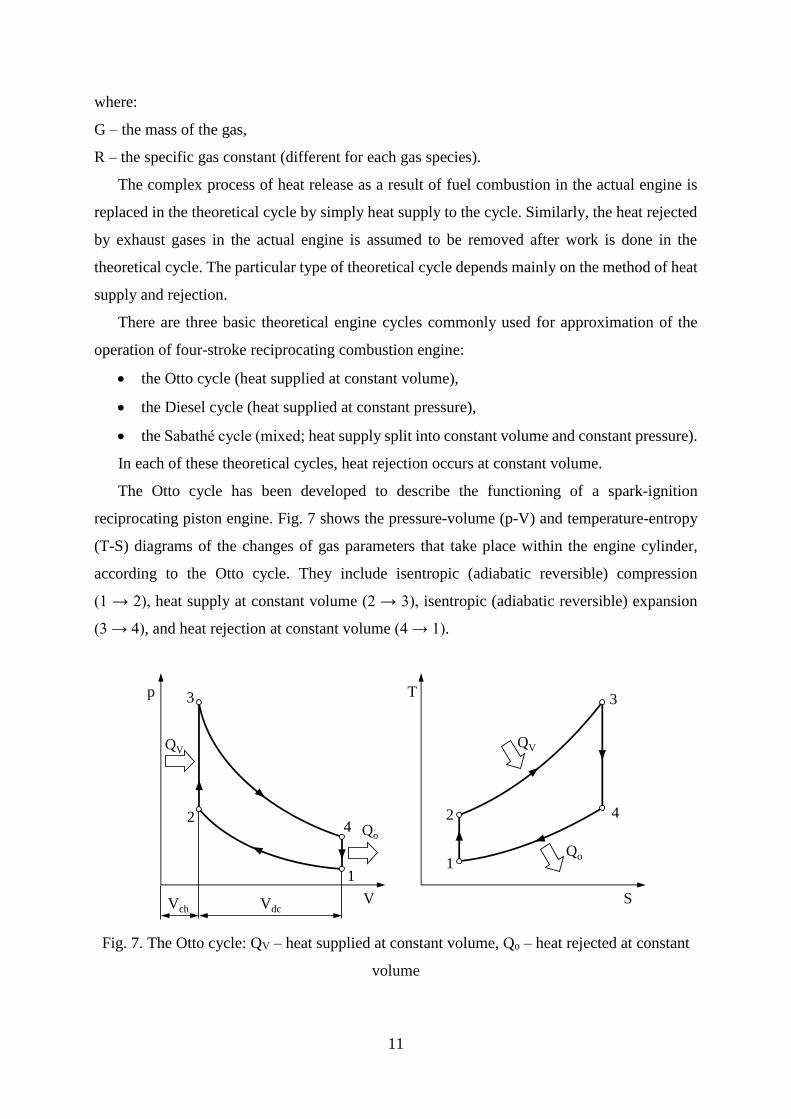
The Otto cycle has been developed to describe the functioning of a spark-ignition
reciprocating piston engine. Fig. 7 shows the pressure-volume (p-V) and temperature-entropy
(T-S) diagrams of the changes of gas parameters that take place within the engine cylinder,
according to the Otto cycle. They include isentropic (adiabatic reversible) compression
(1 → 2), heat supply at constant volume (2 → 3), isentropic (adiabatic reversible) expansion
(3 → 4), and heat rejection at constant volume (4 → 1).
Fig. 7. The Otto cycle: QV – heat supplied at constant volume, Qo – heat rejected at constant
volume
V
p
VdcVch
Qo
QV
1
2
3
4
S
T
Qo
QV
1
2
3
4

12
The compression ratio εc is the same as the expansion ratio εe:
ch
dcch
3
4e
2
1c
V
VV
V
Vε
V
Vε
(18)
The heat supplied at constant volume is given by:
)T(TcQ 23VV (19)
while the heat rejected at constant volume is:
)T(TcQ 14Vo (20)
Relationships between the state parameters of the gas at characteristic points of the Otto
cycle can be derived based on the ideal gas law (17) and the isentropic process equation, which
connects points 1 and 2, 3 and 4:
constpVk (21)
where:
k = cp/cv – the ratio of specific heats (or adiabatic index).
Taking it into account, the following dependency could be shown:
1k
1k
ch
dcch
1
2 εV
VV
T
T
(22)
and
1k
1k
ch
dcch
4
3 εV
VV
T
T
(23)
Finally, it follows from the above that:
3
2
4
1
T
T
T
T (24)

13
The theoretical efficiency ηt of any engine cycle is a ratio of the theoretical work done to
the heat supplied to the engine during one cycle (see section 3). Since the theoretical work is
a difference of heat supplied to the cycle and rejected from the cycle, the theoretical efficiency
of the Otto cycle can be expressed as:
V
oV
V
tt
Q
Q
Wη
(25)
and
3
2
4
1
3
4
23V
14V23Vt
T
T1
T
T1
T
T1
)T(Tc
)T(Tc)T(Tcη
(26)
Taking into account (24), the above equation becomes
k1
1k2
1t ε1
ε
11
T
T1η
(27)
The Diesel cycle, describing the operation of a compression-ignition reciprocating piston
engine, is shown on p-V and T-S diagrams in Fig. 8. It consists of isentropic (reversible
adiabatic) compression (1 → 2), heat supply at constant pressure (2 → 3), isentropic (reversible
adiabatic) expansion (3 → 4), and heat discharge at constant volume (4 → 1).
Fig. 8. The Diesel cycle: Qp – heat supplied at constant pressure, Qo – heat rejected at constant
volume
1
V
p
VdcVch
Qo
Qp
1
2 3
4
S
T
Qo
Qp
2
3
4

14
It can be seen from the p-V diagram of the Diesel cycle that the change of the volume for
the compression process is Vdc, while for the expansion process it will be smaller and equals to
Vdc – V3. It follows that the expansion ratio εe differs from the compression ratio εc and is
always smaller.
The compression ratio is given by:
ch
dcch
2
1c
V
VV
V
Vε
(28)
while the expansion ratio is:
3
dcch
3
4e
V
VV
V
Vε
(29)
Because Vch < V3, then εc > εe.
It is helpful to introduce the concept of cut-off ratio φ, which indicates at what volume
change the heat is supplied (ratio of the volume after and before the combustion):
2
3
V
V (30)
It can also be obtained by dividing the compression ratio on the expansion ratio:
2
3
3
1
2
1
e
c
V
V
V
V
V
V
ε
ε (31)
Hence
ec εε (32)
The heat supplied at constant pressure is given by:
)T(TcQ 23pp (33)
while the heat rejected by:
)T(TcQ 14Vo (34)
15
Just like in the Otto cycle, relationships between the gas state parameters at characteristic
points can be derived on the basis of the ideal gas law (17) and the isentropic process equation
(21), which connects points 1 and 2, 3 and 4.
The theoretical efficiency of the Diesel cycle is:
1T
T
1T
T
T
T
k
11
TT
TT
c
c1
Q
Q
Wη
2
3
1
4
2
1
23
14
p
v
p
op
p
tt
(35)
Using the equations of isentropic compression, isobaric heat supply and isentropic
expansion to determine the temperature ratios in the above equation and taking into account the
expressions on the compression ratio and the cut-off ratio, the following formula can be written:
1
1
k
ε1η
kk1c
t
(36)
or by introducing the expansion ratio:
1-kk
kk1e
t
1
k
ε1η
(37)
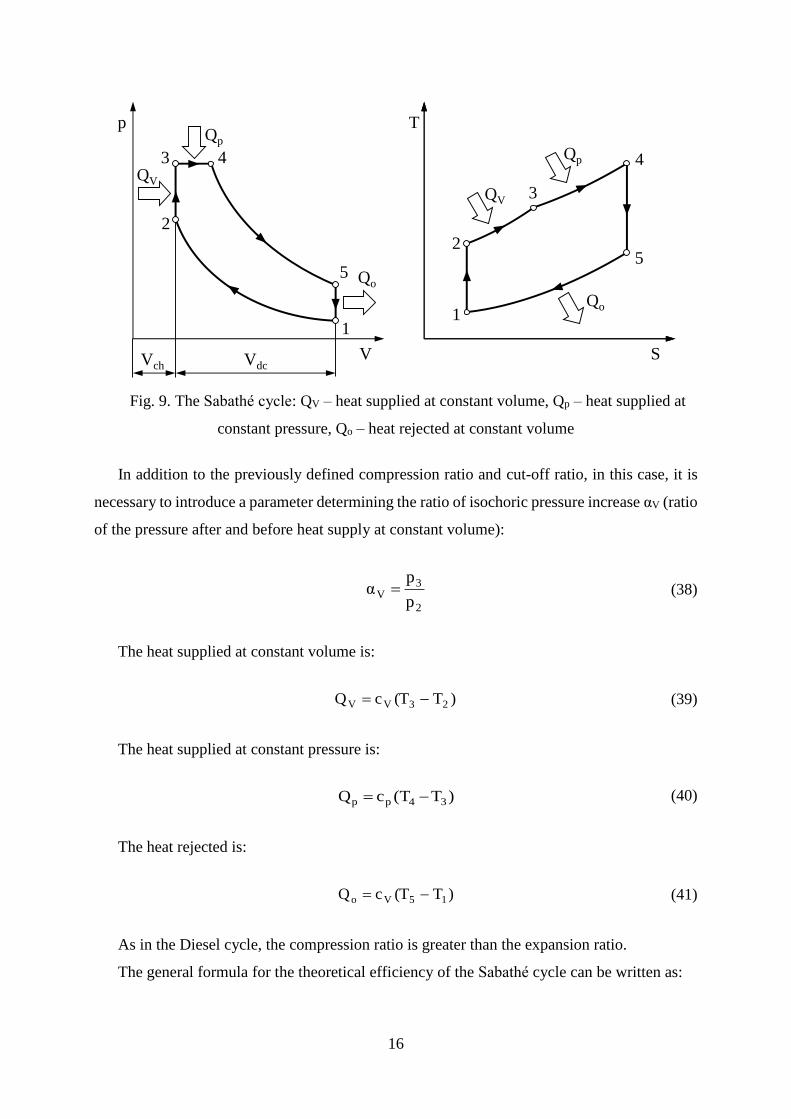
In the Sabathé engine cycle (also known as the Seiliger cycle or mixed cycle), heat is
supplied partly at constant volume and partly at constant pressure. For this reason, it has mixed
features of both Otto and Diesel cycles, which can be seen on the p-V and T-S diagrams shown
in Fig. 9. The Sabathé cycle consists of the following operations: isentropic (reversible
adiabatic) compression (1 → 2), heat supply at constant volume (2 → 3), heat supply at constant
pressure (3 → 4), isentropic (reversible adiabatic) expansion (4 → 5), and heat discharge at
constant volume (5 → 1).
16
Fig. 9. The Sabathé cycle: QV – heat supplied at constant volume, Qp – heat supplied at
constant pressure, Qo – heat rejected at constant volume
In addition to the previously defined compression ratio and cut-off ratio, in this case, it is
necessary to introduce a parameter determining the ratio of isochoric pressure increase αV (ratio
of the pressure after and before heat supply at constant volume):
2
3V
p
pα (38)
The heat supplied at constant volume is:
)T(TcQ 23VV (39)
The heat supplied at constant pressure is:
)T(TcQ 34pp (40)
The heat rejected is:
)T(TcQ 15Vo (41)
As in the Diesel cycle, the compression ratio is greater than the expansion ratio.
The general formula for the theoretical efficiency of the Sabathé cycle can be written as:
5
V
p
VdcVch
Qo
Qp
1
4
S
T
Qo
Qp
1
2
4QV
2
QV
3
5
3
17
pV
opV
pV
tt
QQQ
Wη
(42)
By substituting the expressions for heat supplied (39, 40) and rejected heat (41) in the above
formula and rearranging it, the theoretical efficiency depending on the temperature in the
characteristic points of the cycle is obtained:
3423
15t
TTkTT
TT1η
(43)
Using the equations of isentropic compression, isochoric heat supply, isobaric heat supply
and isentropic expansion to determine temperatures in the above equation, considering the
expressions on the compression ratio, the cut-off ratio and the ratio of isochoric pressure
increase, the following formula can be written:
1)(kα1α
1αε1η
VV
kVk1
et
(44)
The above expression is the most convenient notation of the efficiency of Sabathé cycle. By
adopting the appropriate values of cut-off ratio φ and the ratio of isochoric pressure increase
αV, the proportions between the amounts of heat supplied isochorically and isobarically can be
changed. Assuming φ = 1 the theoretical efficiency of the Otto cycle (27) is obtained, while for
αV = 1 the theoretical efficiency of the Diesel cycle (37) could be calculated as well. The
Sabathé cycle is, therefore, the most general theoretical cycle of the four-stroke reciprocating
piston combustion engine. In fact, it can be considered as an ideal model for the operation of
the modern internal combustion engine, both spark-ignition and compression-ignition.
5. MATCHING THE THEORETICAL CYCLE TO THE ACTUAL CLOSED
INDICATOR DIAGRAM OF THE ENGINE
In principle, the operating cycle of a spark-ignition engine can be compared to the Otto or
Sabathé theoretical cycles, while the operating cycle of a compression-ignition engine – to the
Diesel or Sabathé theoretical cycles. Further adjustment of the cycle to the characteristics of
a particular engine can be made on the basis of two criteria:
the comparison of the calculated and measured pressure after the compression process,

18
the total heat supplied to the engine cylinder over one cycle.
The following assumptions can be made for calculations:
the working medium is air treated as a perfect gas with the parameters R = 287 J/(kg·K)
and k = cp/cv = 1,4,
initial parameters of the compression process are: p1 = 0,1 MPa, T1 = 323 K,
V1 = Vmax = Vch + Vdc,
the heat supplied to the cycle equals the energy content of the fuel,
the displaced cylinder volume, the combustion chamber volume and the compression
ratio are as in the tested engine.
Regardless of which theoretical cycle is chosen for the analysis, the state parameters of the
gas at the beginning and at the end of compression process are the same in all cycles. They are
interrelated by the equation of isentropic process. The key step in calculations is a proper
assignment of the heat supplied to the relevant theoretical processes. In the case of the Otto
cycle, heat is supplied only at constant volume. Therefore, the maximum theoretical pressure,
occurring at the end of the heat supply process, depends on the maximum theoretical
temperature of the cycle, which, in turn, is related to the amount of the heat supplied. In the
Diesel cycle, the heat is supplied only at constant pressure. This occurs when the final pressure
of the theoretical compression process is equal to the maximum measured pressure of the actual
engine cycle. In the Sabathé cycle, the first dose of heat, which is supplied at constant volume,
is limited by the maximum measured pressure of the actual engine cycle. Then the rest of the
heat is supplied at constant, maximum pressure. The processes of expansion and heat rejection
are calculated in the same way for all three theoretical cycles.
Fig. 10 presents the example of the Sabathé cycle matched to the closed indicator diagram
of the compression-ignition engine showed in Fig. 3.
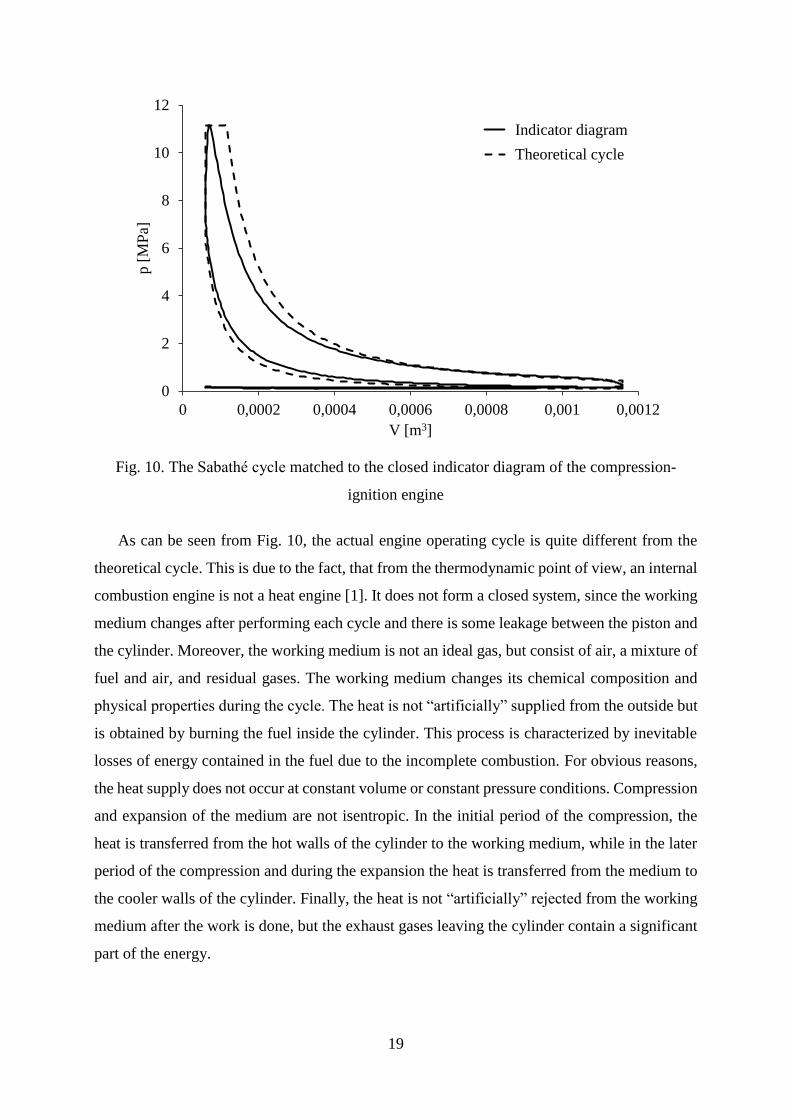
19
Fig. 10. The Sabathé cycle matched to the closed indicator diagram of the compression-
ignition engine
As can be seen from Fig. 10, the actual engine operating cycle is quite different from the
theoretical cycle. This is due to the fact, that from the thermodynamic point of view, an internal
combustion engine is not a heat engine [1]. It does not form a closed system, since the working
medium changes after performing each cycle and there is some leakage between the piston and
the cylinder. Moreover, the working medium is not an ideal gas, but consist of air, a mixture of
fuel and air, and residual gases. The working medium changes its chemical composition and
physical properties during the cycle. The heat is not “artificially” supplied from the outside but
is obtained by burning the fuel inside the cylinder. This process is characterized by inevitable
losses of energy contained in the fuel due to the incomplete combustion. For obvious reasons,
the heat supply does not occur at constant volume or constant pressure conditions. Compression
and expansion of the medium are not isentropic. In the initial period of the compression, the
heat is transferred from the hot walls of the cylinder to the working medium, while in the later
period of the compression and during the expansion the heat is transferred from the medium to
the cooler walls of the cylinder. Finally, the heat is not “artificially” rejected from the working
medium after the work is done, but the exhaust gases leaving the cylinder contain a significant
part of the energy.
0
2
4
6
8
10
12
0 0,0002 0,0004 0,0006 0,0008 0,001 0,0012
p [
MP
a]
V [m3]
Indicator diagram
Theoretical cycle

20
6. THE AIM OF THE LABORATORY EXERCISE
The aim of this laboratory exercise is to draw and analyze the indicator diagrams of the
combustion engine, based on the results of measurements of in-cylinder pressure and the angle
of crankshaft rotation.
7. TASKS
For given results of in-cylinder pressure and crank angle measurements, knowing engine
specifications and fuel characteristics, perform the following tasks:
draw the open and closed indicator diagrams,
calculate the engine operating parameters as described in section 2,
match the ideal thermodynamic cycle to the closed indicator diagram as described in
section 5,
calculate engine efficiencies as described in section 3,
mark on the closed indicator diagram: the combustion chamber volume, the displaced
cylinder volume, the valve timing, the approximate start of combustion, the mean
indicated pressure, the mean effective pressure, the indicated work and the effective
work.
8. LABORATORY REPORT
A written (printed) laboratory report should address at least the following issues:
aim of the laboratory exercise,
specifications of the tested combustion engine,
solutions to the tasks listed in section 7,
conclusions.
REFERNCES
1. Heywood J. B.: Internal Combustion Engine Fundamentals, McGraw-Hill, Inc., New
York, 1988.
2. Bueno A. V., Velásquez J. A., Milanez L. F.: Internal combustion engine indicating
measurements, in: Applied Measurement Systems, InTech, 2012, 23–44.
3. Wajand J. A., Wajand J. T.: Tłokowe silniki spalinowe średnio i szybkoobrotowe.
WNT, Warszawa 1997 /in Polish/.