lab assignment report
TRANSCRIPT

University of Nairobi
School of Computing and Informatics
CSC 431: NETWORK DESIGN
Lab Report on the installation, experimenting and applicability of Net-
SNMP, an MIB Browser, a Packet Sniffer, MRTG, Open NMS
Kelvin Wahome Macharia
P15/1446/2012
© March 2016
1. Net-SNMP
Introduction
Simple Network Management Protocol (SNMP) is a protocol used to monitor the health
of network equipment like routers, computer equipment and other computer-related
devices like UPSs.
Net-SNMP is therefore a suite of applications that implement SNMPv1, SNMPv2c and
SNMPv3 using both IPv4 and IPv6. The suite incorporates:
a) Command-line applications to:
retrieve information from an SNMP-capable device using single requests
such as "snmpget" and "snmpgetnext" or multiple requests such as
"snmpwalk", "snmptable" and "snmpdelta",
manipulate configuration information on an SNMP-capable device using
commands such as "snmpset",
retrieve a fixed collection of information from an SNMP-capable device
using commands such as "snmpdf", "snmpnetstat" and "snmpstatus",
convert between numerical and textual forms of MIB Object IDs, and
display MIB content and structure using commands such as
snmptranslate".
b) A graphical MIB browser (tkmib), using Tk/perl or qtmib
c) A daemon application for receiving SNMP notifications (snmptrapd). Selected
notifications can be logged, forwarded to another SNMP management system,
or passed to an external application.
d) An extensible agent for responding to SNMP queries for management
information (snmpd). This includes builtin support for a wide range of MIB
information modules, and can be extended using dynamically loaded modules,
external scripts and commands, and both the SNMP multiplexing (SMUX) and
Agent Extensibility (AgentX) protocols.
e) A library for developing new SNMP applications, with both C and perl APIs.

Ubuntu Linux Installation
On the Linux platform (Ubuntu) open the Terminal using the "Ctrl+Alt+T" command.
Type:
"$ sudo apt-get update".
This command updates the apt database.
Then type :
"$ sudo apt-get install net-snmp"
or
"$ sudo apt-get install snmp".
This command installs Net-SNMP daemon
Once the installation is complete type again on the Teminal:
"$ sudo apt-get install snmpd".
This command installs the SNMP Client
Usage and Configuration
Configuration of the SNMP manager
Open the "/etc/snmp/snmp.conf" file using sudo rights as follows:
"$ sudo subl /etc/snmp/snmp.conf"
and comment out the "mibs:" line as such: "# mibs:" Save and exit
Configuration of the SNMP client
Copy the "/etc/snmp/snmpd.conf" file to "/etc/snmp/snmpd.conf-orig" file using
sudo privileges Then open the "/etc/snmp/snmpd.conf" file using sudo priviledges
follows:
"$ sudo subl /etc/snmp/snmpd.conf"
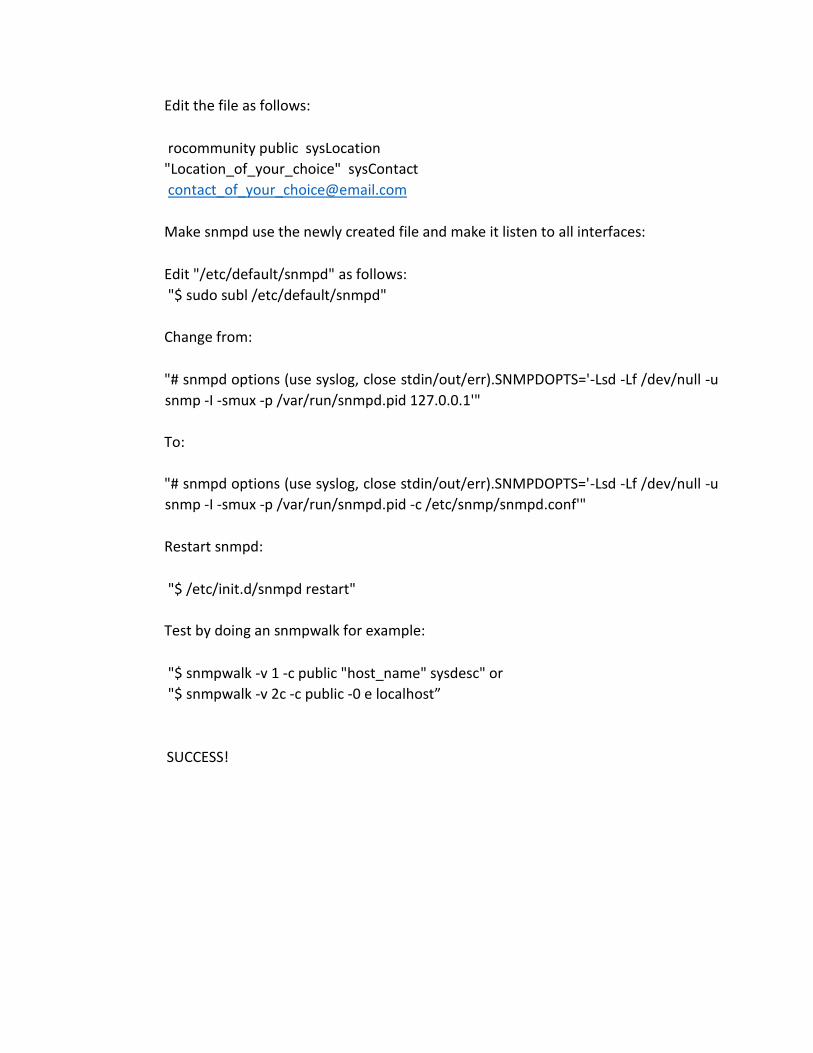
Edit the file as follows:
rocommunity public sysLocation
"Location_of_your_choice" sysContact
Make snmpd use the newly created file and make it listen to all interfaces:
Edit "/etc/default/snmpd" as follows:
"$ sudo subl /etc/default/snmpd"
Change from:
"# snmpd options (use syslog, close stdin/out/err).SNMPDOPTS='-Lsd -Lf /dev/null -u
snmp -I -smux -p /var/run/snmpd.pid 127.0.0.1'"
To:
"# snmpd options (use syslog, close stdin/out/err).SNMPDOPTS='-Lsd -Lf /dev/null -u
snmp -I -smux -p /var/run/snmpd.pid -c /etc/snmp/snmpd.conf'"
Restart snmpd:
"$ /etc/init.d/snmpd restart"
Test by doing an snmpwalk for example:
"$ snmpwalk -v 1 -c public "host_name" sysdesc" or
"$ snmpwalk -v 2c -c public -0 e localhost”
SUCCESS!
2. MIB Browser
Introduction
The Management Information Base is a database used for managing the entities in a
communications network. Most often associated with the Simple Network Management
Protocol (SNMP), the term is also used more generically in contexts such as in OSI/ISO
Network management model. While intended to refer to the complete collection of
management information available on an entity, it is often used to refer to a particular
subset, more correctly referred to as MIB-module.
Objects in the MIB are defined using a subset of Abstract Syntax Notation One (ASN.1)
called "Structure of Management Information Version 2 (SMIv2)" RFC 2578.The software
that performs the parsing is a MIB compiler.
The database is hierarchical (tree-structured) and each entry is addressed through an
object identifier (OID).
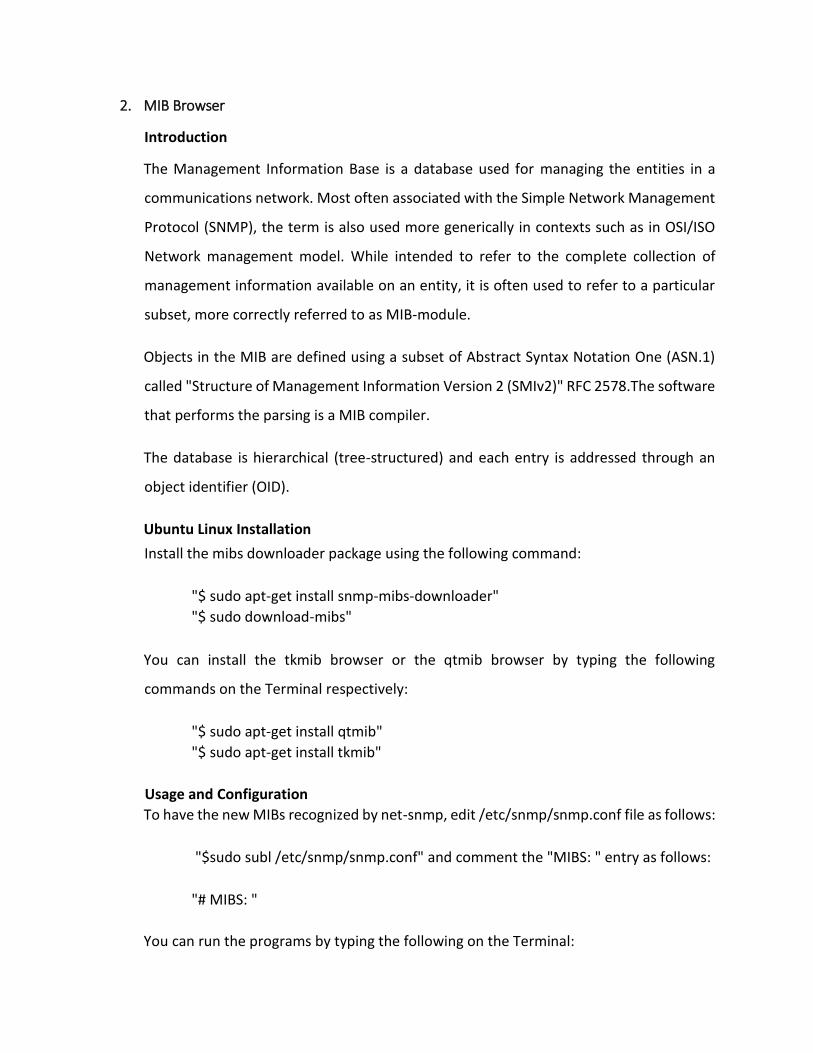
Ubuntu Linux Installation
Install the mibs downloader package using the following command:
"$ sudo apt-get install snmp-mibs-downloader"
"$ sudo download-mibs"
You can install the tkmib browser or the qtmib browser by typing the following
commands on the Terminal respectively:
"$ sudo apt-get install qtmib"
"$ sudo apt-get install tkmib"
Usage and Configuration
To have the new MIBs recognized by net-snmp, edit /etc/snmp/snmp.conf file as follows:
"$sudo subl /etc/snmp/snmp.conf" and comment the "MIBS: " entry as follows:
"# MIBS: "
You can run the programs by typing the following on the Terminal:
"$ qtmib"
"$ tkmib"
Features of MibBrowser
➢ Supports UDP/TCP communication with respective agents
➢ SNMP operation like GET and GETNEXT can be performed by right clicking each
node of the MIB tree. Definition of each node for a particular object can also be
viewed.
➢ Enables the performance of the basic SNMP operations like GET, GETNEXT,
GETBULK, and SET.
➢ Display the output of any snmp operations in a tabular fashion with oid and
values as columns.
➢ Supports multi-varbind requests.
➢ Enables real-time plotting of SNMP data in a graph. Line graph and graph are the
two types of graphs that are currently supported.
➢ Provides a user-friendly view of SNMP table data. The table data can be viewed
in a separate window called SNMP Table Panel.
Fault Management
Diagnostic information can be retrieved directly by proactively querying the information
from the MIB using SNMP. Additionally, it can also be acquired simply by listening for
messages (alarms) sent from the agents in the form of SNMP Traps, Informs, and
Notifications. The agents that have the capability to send diagnostic information in these
formats have to be told where to send the information. ByteSphere's Fault Management
solution includes OidView's Trap Management module. It can act as a listening Network
Manager and can be configured with comprehensive recognition, filtering, and
notification mechanisms.
Performance Management
Performance Management uses a number of collection techniques to determine network,
device, and resource utilization as well as a variety of other critical metrics; coupled with
predictive modeling algorithms collected data can be used to determine MTBF, leveraged
for capacity planning, or exported and shared with 3rd-party applications and systems for

a wide range of functions. Jaguar’s Monitor Engine (ME) can be used by itself or integrated
with any 3rd-party NMS; allowing for efficient data collection and delivery to a variety of
data and reporting sources.
3. Packet Sniffer (Ethereal)
Introduction
Wireshark is a free and open-source packet analyzer used for network troubleshooting,
analysis, software and communications protocol development, and education. Originally
it was named Ethereal. Wireshark is cross-platform, using the GTK+ widget toolkit to
implement its user interface, and pcap to capture packets. Wireshark allows the user to
put network interface controllers that support promiscuous mode into that mode, in
order to see all traffic visible on that interface, not just traffic addressed to one of the
interface's configured addresses and broadcast/multicast traffic.
Data can be captured "from the wire" from a live network connection or read from a file
of already-captured packets. Live data can be read from a number of types of network,
including Ethernet, IEEE 802.11, PPP and loopback. Captured network data can be
browsed via a GUI, or via the terminal version of the utility, TShark. Captured files can be
programmatically edited or converted via command-line switches to the "editcap"
program. Data display can be refined using a display filter. Plug-ins can be created for
dissecting new protocols. VoIP calls in the captured traffic can be detected. If encoded in
a compatible encoding, the media flow can even be played. Raw USB traffic can be
captured.
Ubuntu Linux Installation
On the terminal type the following commands:
“$ sudo apt-get update”
“$ sudo apt-get install wireshark”
This will include the GUI:
“$ sudo apt-get install tshark”
This is the terminal version of the utility
Usage and Configuration
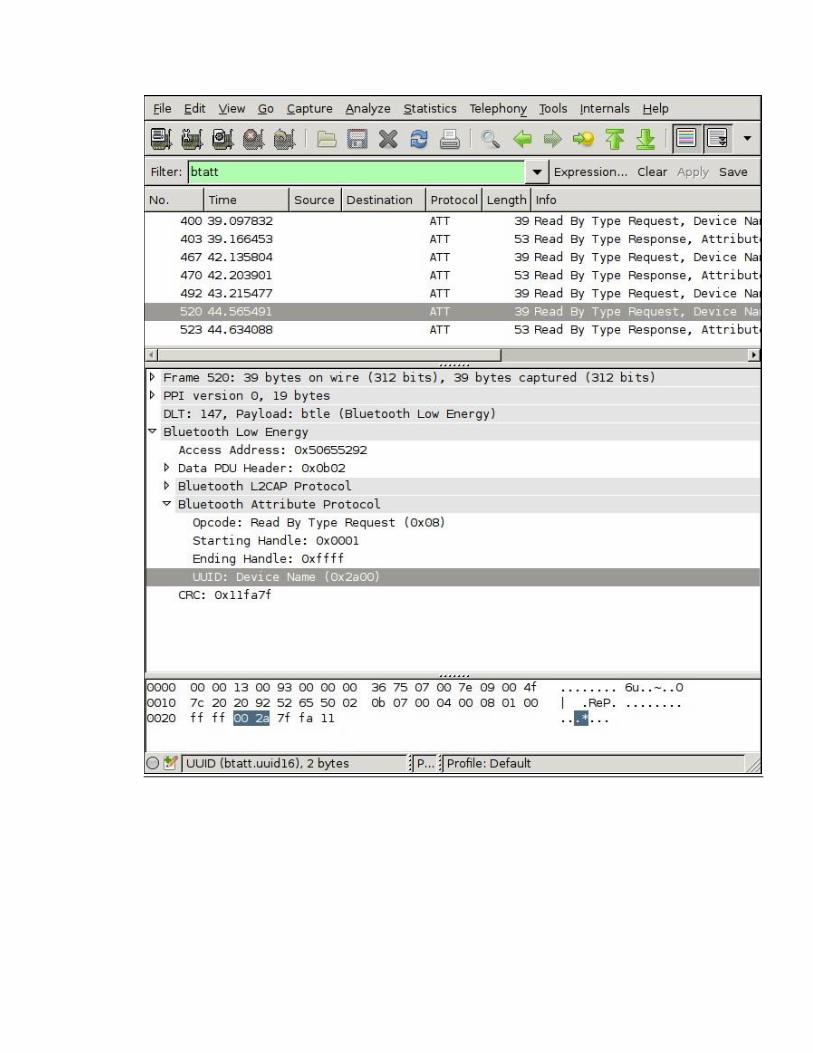
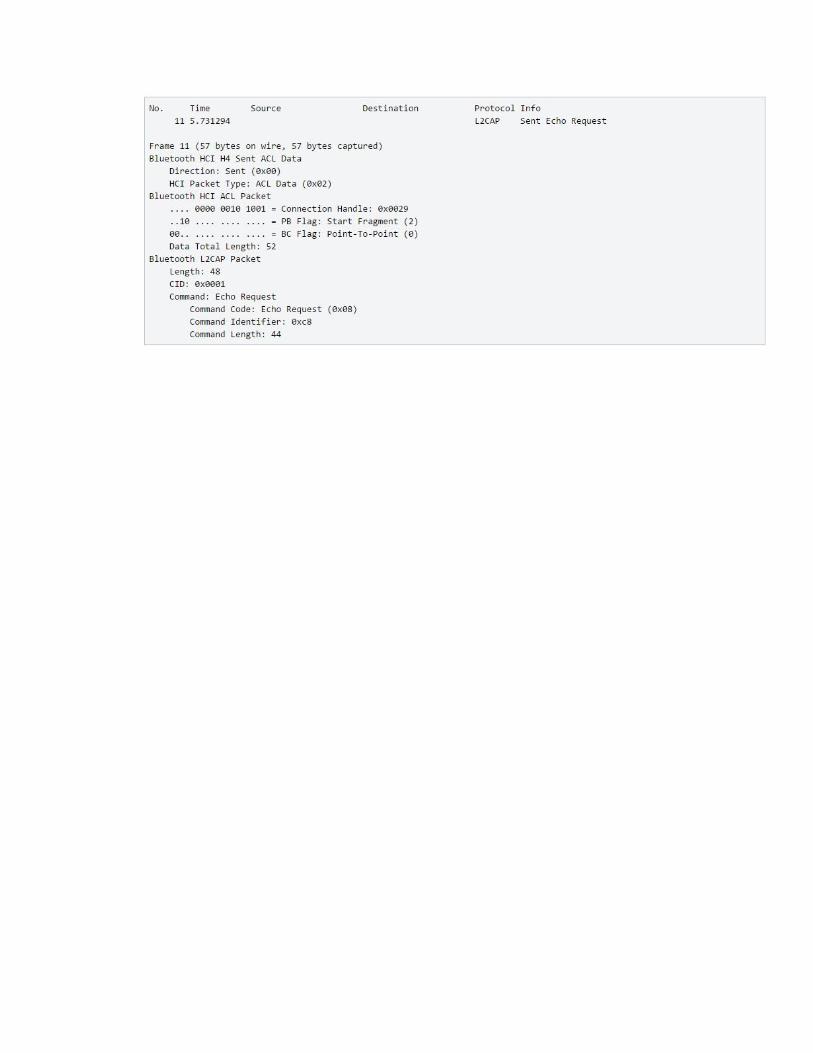
Below is a screenshot illustrating sample bluetooth traffic on Wireshark:

4. MRTG
Introduction
MRTG is an open-source software that is used to monitor SNMP capable network
devices and shows, graphically, how much traffic has passed through each interface.
It generates HTML pages containing PNG images which provide a live visual
representation of this traffic. It is written in Perl and works on Unix/Linux, Windows
and even Netware platforms. Its time routines are written in C and these log the traffic
data and create graphs representing the traffic on the monitored network. These
graphs are embedded into HTML webpages which can then be displayed on the web
browser. It is free and is licensed under the Gnu GPL.
In addition to detailed daily view, MRTG also creates visual representations of the
traffic seen during the last seven days, the last five weeks and the last 12months. This
is possible because MRTG keeps a log of all the data it has pulled from the interfaces.
This log is automatically consolidated so that it does not grow over time, but still
contains all the relevant data for all the traffic seen over the last two years.
MRTG is not limited to monitoring traffic alone. It is possible to monitor any SNMP
variable you choose such as systems load, login sessions, modem availability and
more. MRTG even allows you accumulate two or more data sources into a single
graph.
Unix/Linux Installation
Before installation, make sure you have the following on your Unix/Linux distribution:
• The GNU C compiler
• Perl
• gd – a basic graph-drawing library
• libpng – a library required by gd in order to produce PNG graphics files
• zlib – a library needed by libpng to compress the graphics files that will be
created
• snmp (which we previously installed)
• apache2 – this is required for cases where the localhost (127.0.0.1) will be
monitored. To verify that apache2 is present in the machine (normally it is a
default with every recent Unix/Linux distribution), go to the browser and type

“localhost”. To indicate success, the browser will load an index.html page
located at /var/www/html/ for debian-based distributions and /home/httpd/
for other distributions such as RedHat and fedora.
By default, all these files, except snmp and snmpd(agent), are included in recent
distributions of Linux starting from v12 onwards
On debian-based, unix systems, mrtg can be installed using the package manager
dpkg. Just run the following command on the Terminal to install mrtg and its
dependencies:
$ sudo apt-get install update
to update the apt database, then:
$ sudo apt-get install mrtg
to install.
While installing, you will be asked whether you want ot only make /etc/mrtg.cfg
readable by the mrtg user. Since we want to also monitor remote hosts and because
secutrity is a concern, we select yes to keep mrtg contained in a non-root user
environment.

Usage and Configuration
MRTG will automatically set up /var/www/mrtg/ but if it doesn't go ahead and create
this directory. For my case, since I wanted the index.html file in the /mrtg/ directory
to be visible to the browser when running the localhost, I set up the directory in the
/var/www/html/ directory on the Terminal as follows:
$ sudo mkdir /var/www/html/mrtg
This will now be the working directory and will be assigned to the “WorkDir: ” variable
during the subsequent configuration process.
Also, upon installation, mrtg creates a config file at /etc/ hence /etc/mrtg.cfg.
I'm going to create an /etc/mrtg directory rather then move the mrtg.cfg file within
/etc/ .This will make it less confusing in the future.
$ sudo mkdir /etc/mrtg
$ sudo mv /etc/mrtg.cfg /etc/mrtg
or copy:
$ sudo cp /etc/mrtg.cfg /etc/mrtg
Now we run the cfgmaker command to get things up and running:
$ sudo cfgmaker --global 'WorkDir:/var/www/http/mrtg' --global 'Options[_]:
bits,growright' --output /etc/mrtg/mrtg.cfg public@<yourrouterip>or<localhost>
We need to make sure the following lines are correct in /etc/mrtg/mrtg.cfg. If they
are not there, open up an editor using admin privileges:
$ sudo subl /etc/mrtg/mrtg.cfg
and add them:
EnableIPv6: no
# daemonize the mrtg
RunAsDaemon: Yes
# Set mrtg to monitor the interfaces at every 5-minute interval
Interval: 5
# set the destination of the log files
LogDir: /var/log/mrtg
Let's identify what interfaces are visible to snmp. Type the following on the Terminal:
$ snmpwalk -v 1 -c localhost IP-MIB::ipAdEntIfIndex
You should get something like this if you are connected to the network:
IP-MIB::ipAdEntIfIndex.127.0.0.1 = INTEGER: 1 IP-
MIB::ipAdEntIfIndex.196.0.2.1 = INTEGER: 3
Else you will get only:
IP-MIB::ipAdEntIfIndex.127.0.0.1 = INTEGER: 1
Run the following to start the snmp agent:
$ service snmpd start
You will get the following message:
* Starting network management services:
Next run the following command:
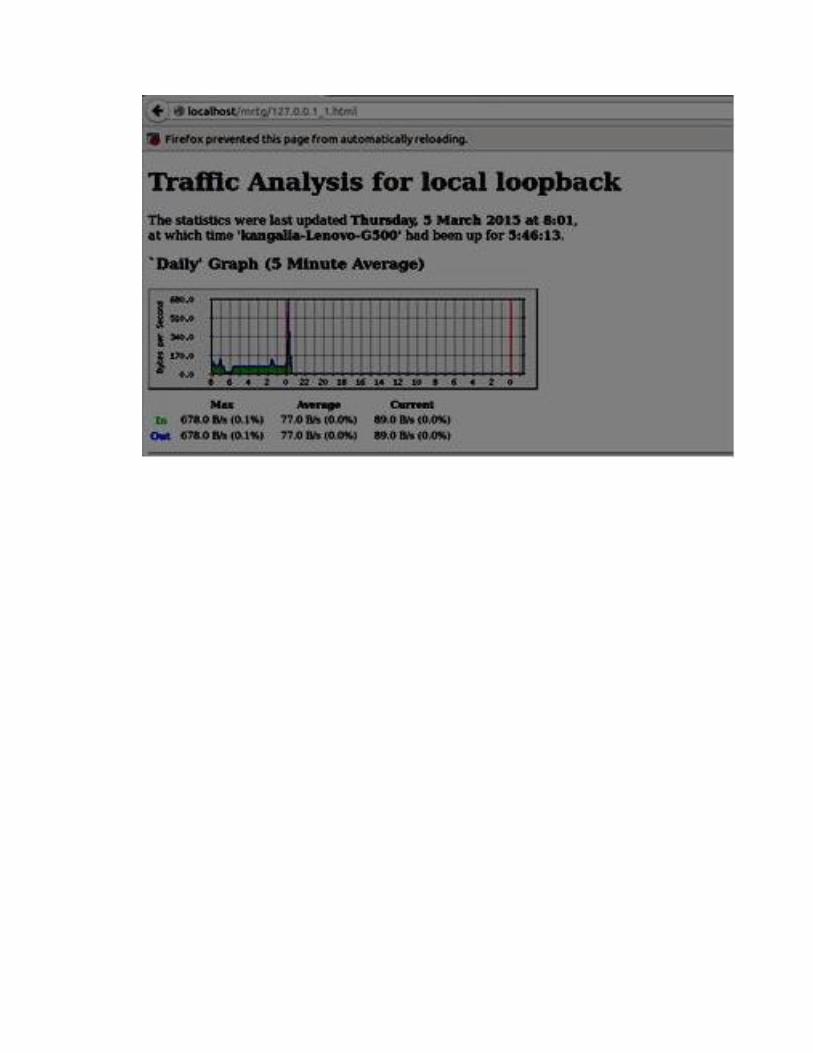
$ sudo indexmaker –output=/var/www/http/mrtg/index.html /etc/mrtg/mrtg.cfg
This will build the index.html we mentioned earlier so that you can view the output
on the browser.
In case you run into the error during this build when setting MRTG up on the localhost
and get the following error message,
ERROR: did not find any matching data in cfg file
it is because MRTG cannot find any line to create an index for it. It could also mean
lines are commented out or they start with blank space. Make sure the blocks
regarding your network interface definition are not commented out and do not have
any space at beginning of the line.
Including the following snippet in your mrtg.cfg could also help:
Target[127.0.0.1_1]: 1:[email protected]:
SetEnv[127.0.0.1_1]: MRTG_INT_IP="127.0.0.1" MRTG_INT_DESCR="lo"
MaxBytes[127.0.0.1_1]: 1250000
Title[127.0.0.1_1]: Traffic Analysis for local loopback
PageTop[127.0.0.1_1]: <h1>Traffic Analysis for local loopback</h1>
Next, run this command to set an environment variable:
$ sudo env LANG=C /usr/bin/mrtg /etc/mrtg/mrtg.cfg
Finally, go to the browser and type the following URL:
localhost/mrtg/index.html
You should be able to see an output graph as shown below:
5. Open NMS
Introduction
OpenNMS is a free and open-source enterprise-grade, cross-platform network monitoring
and network management tool. Its goal is to be a truly distributed, scalable management
application platform for all aspects of the FCAPS (acronym for: fault, configuration,
accounting, performance, security) network management model while remaining 100%
free and open-source. Currently, its focus is on Fault and Performance management.
OpenNMS is written in Java, and thus it can run on any platform that supports Oracle Java
SDK version 1.6 and above. Precompiled libraries are available for most Linux
distributions, Windows, Solaris and OS X. In addition to Java, it requires the PostgreSQL
database, although work is being done to make the application database independent by
leveraging the Hibernate project.
While its features list is long and consistently growing, they can be divided into four main
areas:
• Automated and Directed Discovery
Simply point OpenNMS at your network and it will discover the network services
being provided
• Event and Notification Management
OpenNMS can generate its own events or receive events from outside sources,
such as SNMP Traps, syslog or TL/1. It is even easy to send custom events to
OpenNMS: simply connect to a TCP port and, if you have permission, sent some
XML-formatted text.
OpenNMS can serve as the central repository for your network event stream. Able
to handle bursts of thousands of events per second, OpenNMS also has a number
of correlation methods to automatically clear events, translate one event into
another, and reduce duplicate events into one alarm.
Once the important events have been identified, they can generate notices or
trouble tickets. Any command that can be executed from the OpenNMS server
command line can be used to send notifications (such as an e-mail or an SMS) and
OpenNMS has a trouble ticketing API that allows it to have bidirectional
communication with many popular trouble ticketing systems.
• Service Assurance
OpenNMS was started during a time when Service Level Agreements (SLAs) were
the focus of much management effort. The application comes with a large number
of service monitors that perform synthetic transactions ranging from a simple
ICMP request (ping) or port check, up through complex website monitoring and
round trip e-mail testing.
Detailed reports can be generated on the availability of the services, and it is
extremely easy to customize polling rates as well as to configure scheduled
downtime.
• Performance Measurement
There are a number of data collectors within OpenNMS, including support for the
SNMP and JMX protocols. The HTTP collector can retrieve any web page and use
regular expressions to extract values, so extending an application to integrate
with OpenNMS can be as simple as writing a text file that can be accessed by a
web server.
All data stored can be tested against thresholds, not only the usual “high” and
“low” thresholds but ones that trigger based on a relative or absolute value
change. These thresholds can generate events to be managed by the event and
notification system.
Performance data can be graphed, and “Top N” reports can be generated to easily
identify problem areas within the network.
Ubuntu Linux Installation
With all the prerequisites taken care of, you can now install OpenNMS. The OpenNMS
software is not a single package, but a combination of many components. The APT
packaging system will download and install all of these components and their
dependencies, if they are not already installed on your system.
Start by installing the "opennms" package. This will pull in everything you need to have a
working OpenNMS, including the OpenNMS core, web UI, and a set of common plugins.
You can do so by running (as root):
$ sudo apt-get install opennms
The installer typically has two prompts: "The OpenNMS installer must now be run
manually" and a warning that "IPLIKE installation failed". Please select "<Ok>" for both
questions to continue.
The IPLIKE warning is normal, as this package will attempt to install itself into the
OpenNMS database, but on a new install the database has not been configured yet. We
will re-attempt the install later.
Usage and Configuration
Post Install Configurations
Configure Java
Next, you need to tell OpenNMS which Java you want it to use, using the
"$OPENNMS_HOME/bin/runjava" command.
$OPENNMS_HOME is a variable representing the directory where opennms is
found. In my case it is the following path:
$OPENNMS_HOME=/usr/share/opennms/
To have OpenNMS search for and auto-detect the JRE, run:
$ sudo $OPENNMS_HOME/bin/runjava -s
Example output:
runjava: Looking for an appropriate JRE... runjava:
Checking for an appropriate JRE in JAVA_HOME...
runjava: skipping... JAVA_HOME not set runjava:
Checking JRE in user's path: "/usr/bin/java"...
runjava: found an appropriate JRE in user's path: "/usr/bin/java" runjava:
value of "/usr/bin/java" stored in configuration file
To configure OpenNMS to use a specific JRE binary, use the "-S" with the path to
the desired binary.
$ sudo $OPENNMS_HOME/bin/runjava -S /usr/bin/java
Create/Update the OpenNMS Database
Whenever you install OpenNMS or upgrade it, you should run the –dis command,
to create the OpenNMS database, or update it to the latest version. The install
command takes many options, but in most cases all you should need are the three
options below:
• -d - to update the database
• -i - to insert any default data that belongs in the database
• -s - to create or update the stored procedures OpenNMS uses for certain
kinds of data access
A warning "Failed to load the optional jrrd library." during installation is normal
and not a problem, as jrrd use is optional. The installation should finish with the
line "Installer completed successfully!".
Now it's time to create and configure the OpenNMS database. To do so, run the
following command (as root):
$ sudo $OPENNMS_HOME/bin/install -dis

You should get output something like this:
==================================================================
============ OpenNMS Installer
==================================================================
============ Configures PostgreSQL tables, users, and other miscellaneous
settings.
- searching for libjicmp.so:
- trying to load /libjicmp.so: NO
- trying to load /usr/share/opennms/lib/libjicmp.so: NO
- trying to load /usr/share/opennms/lib/linux64/libjicmp.so: NO
- trying to load /usr/java/packages/lib/amd64/libjicmp.so: NO - trying to load
/usr/lib/jni/libjicmp.so: OK
- searching for libjicmp6.so:
- trying to load /libjicmp6.so: NO
- trying to load /usr/share/opennms/lib/libjicmp6.so: NO
- trying to load /usr/share/opennms/lib/linux64/libjicmp6.so: NO
- trying to load /usr/java/packages/lib/amd64/libjicmp6.so: NO
- trying to load /usr/lib/jni/libjicmp6.so: OK
- searching for libjrrd.so: - trying to load /libjrrd.so: NO
.
.
.
Installer completed successfully!
(Optional but recommended) Install IPLIKE database stored procedure
OpenNMS uses a PostgreSQL stored procedure called "IPLIKE" which provides an
API for easily performing complicated IP address queries. By default, OpenNMS
installs a version of IPLIKE that is compatible with all versions of PostgreSQL, but
there is a platform-specific version of IPLIKE with much better performance. While
it is optional, it is recommended that you configure the iplike package from APT
for performance reasons.
The appropriate IPLIKE package (eg, iplike-pgsql84, iplike-pgsql90, etc.) for your
database should already have installed when you installed the main "opennms"
package. All you should need to do is re-run the "install_iplike" shell script (as
root):
$ sudo /usr/sbin/install_iplike.sh
This is the expected output if the installation was successful:
CREATE FUNCTION
Verify connectivity to the OpenNMS database
At this point, you can check the network listener and authentication changes, as
well as whether or not your DB creation worked properly by trying to connect to
the OpenNMS database as the postgres database user from localhost.
$ psql -U postgres --host=localhost opennms
If you are presented with a prompt that looks like opennms=#, you can type \q
and quit the PostgreSQL shell as the database connection was successful. If this
was not successful, you will need to review your PostgreSQL configuration before
continuing.
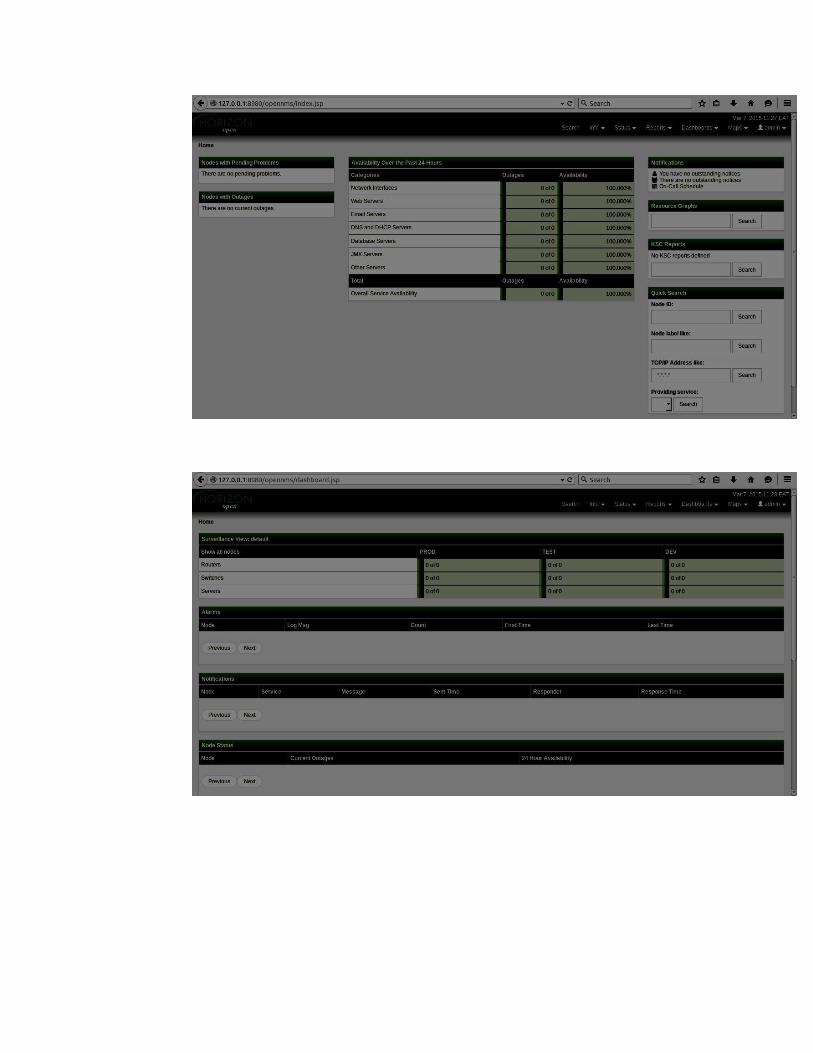
Start OpenNMS and Connect to the Web UI
You can now start OpenNMS using the "service" command (as root).
Try starting OpenNMS, and connecting to the web UI.
$ sudo service opennms start
You should be able to go to “http://127.0.0.1:8980/opennms/” in your browser
and see the web UI. The default username and password are both "admin" so
enter them in when you see the login prompt.
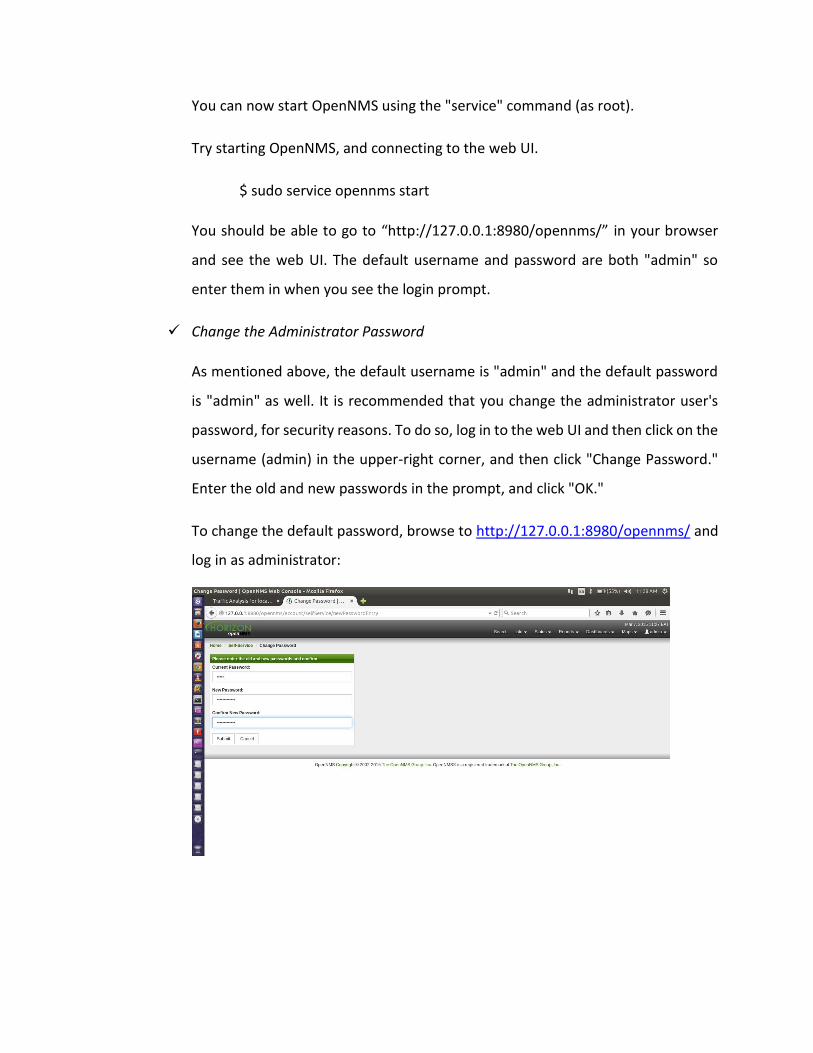
Change the Administrator Password
As mentioned above, the default username is "admin" and the default password
is "admin" as well. It is recommended that you change the administrator user's
password, for security reasons. To do so, log in to the web UI and then click on the
username (admin) in the upper-right corner, and then click "Change Password."
Enter the old and new passwords in the prompt, and click "OK."
To change the default password, browse to http://127.0.0.1:8980/opennms/ and
log in as administrator: