la nkwantanang-madina municipality
TRANSCRIPT

LA NKWANTANANG-MADINA
MUNICIPALITY

ii
Copyright (c) 2014 Ghana Statistical Service

iii
PREFACE AND ACKNOWLEDGEMENT
No meaningful developmental activity can be undertaken without taking into account the
characteristics of the population for whom the activity is targeted. The size of the population
and its spatial distribution, growth and change over time, in addition to its socio-economic
characteristics are all important in development planning.
A population census is the most important source of data on the size, composition, growth
and distribution of a country’s population at the national and sub-national levels. Data from
the 2010 Population and Housing Census (PHC) will serve as reference for equitable
distribution of national resources and government services, including the allocation of
government funds among various regions, districts and other sub-national populations to
education, health and other social services.
The Ghana Statistical Service (GSS) is delighted to provide data users, especially the
Metropolitan, Municipal and District Assemblies, with district-level analytical reports based
on the 2010 PHC data to facilitate their planning and decision-making.
The District Analytical Report for the La Nkwantanang-Madina Municipality is one of the
216 district census reports aimed at making data available to planners and decision makers at
the district level. In addition to presenting the district profile, the report discusses the social
and economic dimensions of demographic variables and their implications for policy
formulation, planning and interventions. The conclusions and recommendations drawn from
the district report are expected to serve as a basis for improving the quality of life of
Ghanaians through evidence-based decision-making, monitoring and evaluation of
developmental goals and intervention programmes.
For ease of accessibility to the census data, the district report and other census reports
produced by the GSS will be disseminated widely in both print and electronic formats. The
report will also be posted on the GSS website: www.statsghana.gov.gh.
The GSS wishes to express its profound gratitude to the Government of Ghana for providing
the required resources for the conduct of the 2010 PHC. While appreciating the contribution
of our Development Partners (DPs) towards the successful implementation of the Census, we
wish to specifically acknowledge the Department for Foreign Affairs, Trade and
Development (DFATD) formerly the Canadian International Development Agency (CIDA)
and the Danish International Development Agency (DANIDA) for providing resources for
the preparation of all the 216 district reports. Our gratitude also goes to the Metropolitan,
Municipal and District Assemblies, the Ministry of Local Government, Consultant Guides,
Consultant Editors, Project Steering Committee members and their respective institutions for
their invaluable support during the report writing exercise. Finally, we wish to thank all the
report writers, including the GSS staff who contributed to the preparation of the reports, for
their dedication and diligence in ensuring the timely and successful completion of the district
census reports.
Dr. Philomena Nyarko
Government Statistician

iv
TABLE OF CONTENTS
PREFACE AND ACKNOWLEDGEMENT ....................................................................... iii
LIST OF TABLES .................................................................................................................. vi
LIST OF FIGURES ............................................................................................................... vii
ACRONYMS AND ABBREVIATONS ............................................................................. viii
EXECUTIVE SUMMARY .................................................................................................... ix
CHAPTER ONE: INTRODUCTION ................................................................................... 1
1.1 Introduction .................................................................................................................... 1
1.2 Physical Features ........................................................................................................... 1
1.3 Political and Administration Structure ........................................................................... 3
1.4 Cultural and Social Structure ......................................................................................... 3
1.5 Economy ........................................................................................................................ 4
1.6 Census Methodology, Concepts and Definitions ........................................................... 5
1.7 Organization of the Report........................................................................................... 15
CHAPTER TWO: DEMOGRAPHIC CHARACTERISTICS ......................................... 16
2.1 Introduction .................................................................................................................. 16
2.2 Population Size and Distribution ................................................................................. 16
2.3 Age-Sex Structure ........................................................................................................ 18
2.4 Fertility, Mortality and Migration ................................................................................ 18
CHAPTER THREE: SOCIAL CHARACTERISTICS .................................................... 23
3.1 Introduction .................................................................................................................. 23
3.2 Household Composition and Structure ........................................................................ 23
3.3 Marital Status ............................................................................................................... 25
3.4 Nationality.................................................................................................................... 30
3.5 Religious Affiliation .................................................................................................... 30
3.6 Literacy and Education ................................................................................................ 31
CHAPTER FOUR: ECONOMIC CHARACTERISTICS ............................................... 37
4.1 Introduction .................................................................................................................. 37
4.2 Economic Activity Status ............................................................................................ 37
4.3 Occupation ................................................................................................................... 40
4.4 Industry ........................................................................................................................ 40
4.5 Employment Status ...................................................................................................... 41
4.6 Employment Sector ...................................................................................................... 42
CHAPTER FIVE: INFORMATION COMMUNICATION TECHNOLOGY .............. 43
5.1 Introduction .................................................................................................................. 43
5.2 Ownership of Mobile Phones....................................................................................... 43
5.3 Use of Internet.............................................................................................................. 44
5.4 Household Ownership of Fixed Telephone Lines ....................................................... 44
5.5 Household ownership of Desktop/Laptop computer ................................................... 44
CHAPTER SIX: DISABILITY ........................................................................................... 45
6.1 Introduction .................................................................................................................. 45
6.2 Types of Disability ....................................................................................................... 45
6.3 Population with Disability ........................................................................................... 45

v
6.4 Distribution by Type of Locality and sex .................................................................... 46
6.5 Disability and Economic Activity ................................................................................ 47
6.6 Disability, Education and Literacy .............................................................................. 48
CHAPTER SEVEN: AGRICULTURAL ACTIVITIES ................................................... 50
7.1 Introduction .................................................................................................................. 50
7.2 Households in Agriculture ........................................................................................... 50
7.3 Types of Agricultural Activities .................................................................................. 50
7.4 Types of Farming Activities ........................................................................................ 51
CHAPTER EIGHT: HOUSING CONDITIONS ............................................................... 53
8.1 Introduction .................................................................................................................. 53
8.2 Housing stock, Households and Household Size ......................................................... 53
8.3 Type of Dwelling, Holding and Tenancy Arrangement .............................................. 54
8.4 Construction Materials ................................................................................................. 56
8.5 Room Occupancy ......................................................................................................... 58
8.6 Access to Utilities and Household Facilities ............................................................... 59
8.7 Main Source of Water for drinking and for other domestic use .................................. 61
8.8 Bathing and Toilet Facilities ........................................................................................ 63
8.9 Method of Waste Disposal ........................................................................................... 65
CHAPTER NINE: SUMMARY OF FINDINGS, CONCLUSION AND POLICY
IMPLICATIONS ................................................................................ 67
9.1 Introduction .................................................................................................................. 67
9.2 Summary of Main Findings ......................................................................................... 67
9.3 Conclusion ................................................................................................................... 69
9.4 Policy Implications ...................................................................................................... 70
REFERENCES ....................................................................................................................... 72
APPENDICES ........................................................................................................................ 73
LIST OF CONTRIBUTORS ................................................................................................ 79

vi
LIST OF TABLES
Table 2.1: Population by age, sex and type of locality ........................................................... 17 Table 2.2: Reported total fertility rate, general fertility rate and crude birth rate by District . 19 Table 2.3: Birthplace by duration of residence of migrants .................................................... 20 Table 2.4: Total population, deaths in households and crude death rate by district ............... 21
Table 3.1: Household size by type of locality ......................................................................... 23 Table 3.2: Household population by composition and sex ..................................................... 24 Table 3.3: Household population by structure and sex ........................................................... 25 Table 3.4: Population 12 years and older by age group and marital status ............................ 27 Table 3.5: Persons 12 years and older by sex, marital status and level of education ............. 28
Table 3.6: Marital status of persons 12 years and older by economic activity status ............. 29 Table 3.7: Population by nationality and sex .......................................................................... 30 Table 3.8: Population by religion and sex .............................................................................. 31
Table 3.9: Population 11 years and older by sex, age and literacy status ............................... 33 Table 3.10:Population 3 years and older by level of education, school attendance and sex ... 35 Table 4.1: Population 15 years and older by activity status and sex ...................................... 38 Table 4.2: Population 15 years and older by sex, age and activity status ............................... 39
Table 4.3: Employed population 15 years and older by occupation and sex .......................... 40 Table 4.5: Employed population 15 years and older by employment status and sex ............. 42
Table 4.6: Employed population 15 years and older by employment sector and sex ............. 42 Table 5.1: Population 12 years and older by mobile phone ownership, internet facility usage, and sex ........................................................................................................ 43
Table 5.2: Households having desktop/laptop computers and fixed telephone lines by sex .. 44
Table 6.1: Population by type of locality, disability type and sex .......................................... 45 Table 6.2: Population by type of locality, disability type and sex .......................................... 46 Table 6.3: Population 3 years and older by sex, disability type and level of education ......... 49
Table 7.1: Households by agricultural activities and locality ................................................. 50 Table 7.2: Distribution of animal reared and keepers ............................................................. 52
Table 8.1: Stock of houses and households by type of locality .............................................. 54 Table 8.3: Ownership status of dwelling by sex of household head and type of locality ....... 55 Table 8.4: Main construction material for outer wall of dwelling units by type of locality ... 57
Table 8.5: Main construction material for the floor of dwelling units by type of locality ..... 57 Table 8.6: Main construction material for roofing of dwelling unit by type of locality ......... 58 Table 8.7: Households by size and number of sleeping rooms occupied in dwelling unit ..... 59
Table 8.8: Main source of lighting of dwelling units by type of locality ............................... 59 Table 8.9: Main source of cooking fuel, and cooking space used by households .................. 61
Table 8.10:Main source of drinking water and other domestic purposes for dwelling unit .... 62 Table 8.11:Type of toilet facility and bathing facility used by households by type of
locality................................................................................................................... 64 Table 8.12:Method of solid and liquid waste disposal of households by type of locality ....... 66 Table A1: Household composition by type of locality ........................................................... 73
Table A2: Population 3 years and older by sex, disability type and level of education ......... 74 Table A3: Distribution of households engaged in tree growing or crop farming by type of
crop and population engaged ................................................................................. 75 Table A4: Population by sex, number of households and houses in the 20 largest communities ........................................................................................................... 77
Table A5: Population by age group in the 20 largest communities ........................................ 78

vii
LIST OF FIGURES
Figure 1.1: Map of La Nkwantanang–Madina Municipal ........................................................ 2
Figure 2.1: Population Pyramid .............................................................................................. 18
Figure 2.2: Reported age specific death rate by sex ............................................................... 22
Figure 3.1: Population distribution of marital status .............................................................. 26
Figure 3.2: Population distribution of Literacy Status ............................................................ 32
Figure 3.3: School attendance by sex ..................................................................................... 36
Figure 7.1: Household Agriculture activities by locality ........................................................ 51
Figure 8.1: Ownership status of dwelling units by type of locality ........................................ 56
Figure 8.2: Main source of lighting by locality ...................................................................... 60
Figure 8.3: Main source of water for other domestic use by locality ..................................... 63
Figure 8.4: Type of toilet facility use by households by locality ............................................ 65

viii
ACRONYMS AND ABBREVIATONS
AIDS Acquire Immune Deficiency Syndrome
ASFR Age Specific Fertility Rate
CBR Crude Birth Rate
CEB Children Ever Born
CERGIS Centre for Geographical and Information Systems
CIDA Canadian International Development Agency
CS Children Surviving
DANIDA Danish International Development Agency
DCD District Co-ordinating Director
DCE District Chief Executive
EA Enumeration Area
ECOWAS Economic Community of West African States
FCUBE Free Compulsory Universal Basic Education
GFR General Fertility Rate
GSS Ghana Statistical Service
ICT Information Communication Technology
IMIS Integrated Management Information System
JHS Junior High School
JSS Junior Secondary School
L.I Legislative Instrument
MMDAs Metropolitan, Municipal, District Assemblies
NGO Non-Governmental Organisation
PHC Population and Housing Census
PWDs Persons with Disabilities
SHS Senior High School
SSS Senior Secondary School
TFR Total Fertility Rate
UN United Nation
WC Water Closet
ix
EXECUTIVE SUMMARY
Introduction
This district census report is the first of its kind since the first post-independence census was
conducted in 1960. The report provides basic information about the district. It gives a brief
background of the district, describing its physical features, political and administrative
structure, socio-cultural structure and economy. Using data from the 2010 Population and
Housing Census (2010 PHC), the report discusses the population characteristics of the district,
fertility, mortality, migration, marital status, literacy and education, economic activity status,
occupation, employment; Information Communication Technology (ICT), disability,
agricultural activities and housing conditions of the district. The key findings of the analysis
are as follows (references are to the relevant sections of the report):
Population size, structure and composition
The population of La Nkwantanang-Madina Municipal according to the 2010 Population and
Housing Census, is 111,926 representing 2.8 percent of the region’s total population. Females
constitute 51.5 percent and males represent 48.5 percent. About 84.0 percent of the
population in the Municipality reside in urban localities. The district has a sex ratio of 94.1.
The population of the Municipality is youthful (38.7%) depicting a broad base population
pyramid which tapers off with a small number of elderly persons (5.0%). The total age
dependency ratio for the Municipality is 47.2, the age dependency ratio for males is higher
(47.3) than that of females (47.2).
Fertility, mortality and migration
The Total Fertility Rate for the municipality is 2.5. The General Fertility Rate is 71.7 births
per 1000 women aged 15-49 years which is the second highest for the region. The Crude Birth
Rate (CBR) is 22.5 per 1000 population. The crude death rate for the municipality is 3.5 per
1000. Accident/violence/homicide/suicide accounted for 12.2 percent of all deaths while other
causes constitute 87.8 percent of deaths in the Municipality. Majority (77.1 %) of migrants
living in the municipality were born in another region in Ghana while 19.9 percent were born
elsewhere in the Greater Accra Region. For migrants born in another region, those born in
Eastern constitute 31.1 percent, followed by Volta with 27.4 percent and Ashanti, 14.1
percent.
Household Size, composition and structure
The district has a household population of 108,051 with a total number of 24,269 households.
The average household size in the district is 3.7 persons per household. Children constitute the
largest proportion of the household structure accounting for 35.3 percent. Spouses form about
11.1 percent. Nuclear households (head, spouse(s) and children) constitute 25.3 percent of the
total number of households in the municipality
Marital status
About forty five per cent of the population aged 12 years and older are married, 51.2 percent
have never married, 3.8 percent are in consensual unions, 3.3 percent are widowed, 2.7
percent are divorced and 1.8 percent are separated. By age 30-34 years, less than half of
males (47.2%) are married and 61.1 percent for females. Almost the same proportion of
males (37.2%) and females (37.3%) are married but a higher percentage of the males (55.3%)
x
than the females (47.4%) are never married. At age 65 and above, widowed females account
for as high as 51.6 percent while widowed males account for only 10.3 percent. Among the
married, 11.1 percent have no education while about 4.7 percent of the unmarried have never
been to school. Majority (80.3%) of the married population are employed, 3.4 percent are
unemployed and 16.3 percent are economically not active. More than half (51.7%) of those
who have never married are economically not active and 6.2 percent are unemployed.
Nationality
The proportion of Ghanaians by birth in the district is 91.6 percent. Those who have
naturalised constitute 1.2 percent and the non-Ghanaian population in the Municipality is 3.2
percent.
Literacy and education
Of the population 11 years and above, 91.3 percent are literate and 8.7 percent are non-
literate. The proportion of literate males (95.4%) is higher compared to that of the females
(87.5%). A little more than half (55.4%) of the literate population indicated they could speak
and write both English and Ghanaian languages. Of the population aged 3 years and above
(102,325) in the municipality, 6.3 percent has never attended school, 37.3 percent are
currently attending and 56.4 percent have attended in the past.
Economic Activity Status
About seventy percent of the population 15 years and older are economically active while
31.1 per cent are economically not active. Of the economically active population, 92.3
percent are employed while 7.7 percent are unemployed. For those who are economically not
active, more than half (56.7%) are students, while almost a quarter (24.9%) performing
household duties and 3.7 percent are disabled or too sick to work. About six out of ten
unemployed are seeking work for the first time.
Occupation
Of the employed population, about 35.5 percent are engaged as service and sales, 22.0
percent in craft and related trade, 10.5 percent in Professional technicians, and 8.4 percent are
engaged as elementary occupation.
Employment status and sector
Of the population 15 years and older 43.4 percent are self-employed without employees, 8.5
percent are self-employed with employees, 2.5 percent are contributing family workers, and
3.9 percent are apprentices. The private informal sector is the largest employer in the
Municipality, employing 69.7 percent of the population, with females having relatively
higher proportion (78.8%). The reverse is the case for private formal sector which engages
17.6 percent of working population; the proportion of male working population is higher
relative to their female counterpart (23.7% against 11.6%).
Information Communication Technology
Of the population 12 years and above, 78.1 percent have mobile phones. A proportion of
male who own mobile phones relative to females is higher (82.0% against 74.4%). A total
number of 21,376 persons 12 years and older, representing 24.9 percent use internet facilities
in the municipality. About 22.8 percent of the total households in the municipality have
desktop/laptop computers.

xi
Disability
About 2.7 percent of the municipal’s total population has one form of disability or the other.
This proportion is the same for both male and female population. The types of disability in
the municipality include sight, hearing, speech, physical, intellect, and emotion. Persons with
sight disability recorded the highest of 42.1 percent followed by physical disability (22.9%).
About 2.7 percent of the population with disability are in the urban localities. There are more
males with speech, hearing and intellectual challenges than females in the municipality.
Among the population of PWD, those who are sight impaired have the highest proportion
(55.7%) who is employed.
Agriculture
As low as 5.3 percent of households in the municipality are engage in agriculture. In the
rural localities, 8.1 percent of households are agricultural households while only 4.7 percent
is the case for the urban localities. More than three-quarters (75.5%) of the agricultural
households in the municipality are involved in crop farming; it is however more common
among agricultural household in the rural (67.9%) communities than in the urban
communities (77.9%). Similarly, poultry (chicken) which is the dominant animal reared in
the municipality is commonly reared in the rural localities (39.0%) than urban localities
(25.7%).
Housing
The housing stock of La Nkwantanang Madina Municipality is 13,647 representing 2.9
percent of the total number of houses in the Greater Accra Region. The average number of
persons per house is 3.9.
Type, tenancy arrangement and ownership of dwelling units
Over half (52.6%) of all dwelling units in the municipality are compound houses; 19.8
percent are separate houses and 7.1 percent are semi-detached houses. More than half
(45.0%) of the dwelling units in the municipality are owned by other private individuals; 38.2
percent are owned by members of the household; 9.2 percent are owned by a relative who is
not a member of the household and 2.9 percent of the dwelling units is owned by public or
government, whereas, less than one percent (0.7) is owned through mortgage schemes.
Material for construction of outer wall, floor and roof
The main construction material for outer walls of dwelling units in the municipality is
cement/concrete accounting for 82.6 percent with wood constituting 12.1 percent of outer
walls of dwelling units in the municipality. Cement (73.4%) and mud/earth (6.7%) are the
two main materials used in the construction of floors of dwelling units in the municipality.
Metal sheets are the main roofing material (60.4 %) for dwelling units in the municipality.
Room occupancy
One room constitutes the highest percentage (91.0%) of sleeping rooms occupied by
households in housing units in the municipality. About 9.2 percent of households with 10 or
more members occupy single rooms.
Utilities and household facilities
The three main sources of lighting in dwelling units in the municipality are electricity
(85.8%), kerosene lamp (4.3%) and flashlight/torch (6.0%). The main source of fuel for
cooking for most households in the municipality is Gas (52.9%). The proportion for rural

xii
(53.8%) is higher than that of urban (48.3%). The three main sources of water in the
municipality are satchel water (61.9%), pipe borne water (20.6%) and borehole.
The most important toilet facility used in the municipality is W.C. (39.8%), followed by
public toilet (WC, KVIP, Pit, Pan) representing 18.1 percent, and then pit latrine (10.7%).
About 5.1 percent of the population in the municipality has no toilet facility. More than a
third (34.3%) has separate bathrooms in the same house, while 30.6 percent of households in
the municipality own bathrooms for their exclusive use, and almost a quarter (23.5%) share
open cubicle.
Waste disposal
The most widely method of solid waste disposal is through collection (67.9%). About one in
ten households (11.3%) burning their solid waste, while one out of hundred indiscriminately
dispose their solid waste. On the account of liquid waste disposal, more than one-fifth of
households throw unto the compound (22.3%) and unto the street (21.0%).

1
CHAPTER ONE
INTRODUCTION
1.1 Introduction
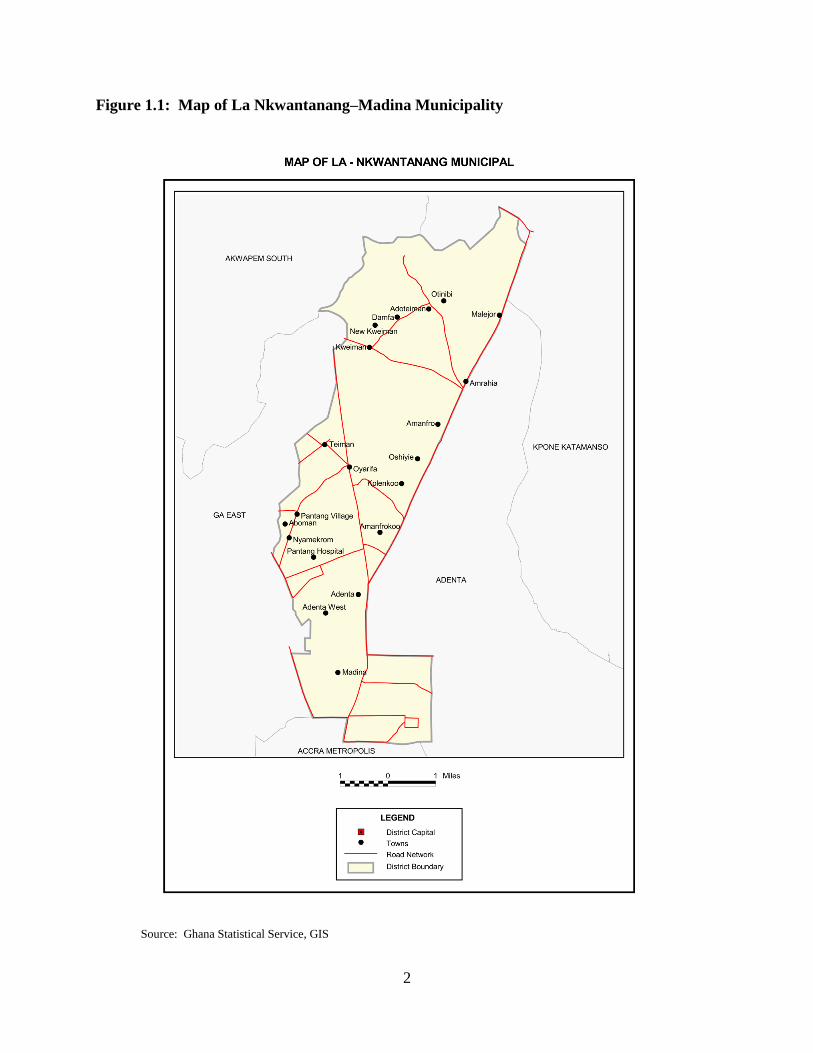
The La Nkwantanang-Madina Municipality is located in the Greater Accra Region. It is one of
the 16 Metropolitan, Municipal and District Assemblies in the region and was created in 2012 as
part of the newly created Assemblies aimed at deepening decentralization and bringing
development to the door step of citizens. La Nkwantanang Madina Municipal was established
by Legislative Instrument (L.I.) 2131 and inaugurated in June 2012. It was carved out of the Ga
East Municipality. The La Nkwantanang -Madina Municipality is located at the northern part of
the Greater Accra Region. It covers a total land surface area of 70.887 square kilometers. It is
bordered on the West by the Ga East Municipal, on the East by the Adentan Municipal, the
South by Accra Metropolitan Area and the North by the Akwapim South District (see figure 1.1).
La Nkwantanang Madina Municipality is generally urban (84percent). This chapter describes the
physical features, political and administrative structure, social and cultural structure and
economy and living conditions prevalent in the Municipality.
1.2 Physical Features
1.2.1 Geology and soils
The area is underlain by the Precambrian rocks of the Dahomeyan formation. A strain of
metamorphic rocks mainly consisting of granite, gneiss and schist probably derived from
sedimentary layers exist in the Municipality. These rocky formations are weathered at the surface
and carried by run-offs towards the plains. The geological formation of the Municipality has
resulted in the prevalence of sandy loam soils in many parts of the Municipality. Five soil types
are found in the Municipality namely; Fete Consociation, Nyigbenya Hatso Complex
Association, Oyarifa-Manfe Complex Association, Danfa-Dome Association and Fete Bediesi
Complex Association. Fete Consociations are very shallow, excessively well-drained, pale
coloured sandy loam, and contains small pieces of rock on steep slopes. These soils are found in
the northernmost part of the Municipality towards the Akwapim – Togo Range. Nyigbenya,
Hatso Complex Association can be found at Frafraha. They are well-drained, red, sandy clay
loam to clay with abundant, rough stone concretions and quartz gravels. The Oyarifa-Manfe
Complex Associations are located at Ayimensah, Adoteiman, Otinibi and Oyarifa. These are
deep, orange brown to bright red, sandy clay loam containing abundant ironstone concretions
and gravels. The Danfa-Dome Associations are well drained concretionary clay loam; deep,
plastic concretionary clay; yellowish brown with lime concretions; deep black, calcareous
cracking clays. Found at Ayimensah, the Fete Bediesi Complex Association consisting of
yellow, brown and alluvial sand; red, well drained sandy clay loam.
2
Figure 1.1: Map of La Nkwantanang–Madina Municipality
Source: Ghana Statistical Service, GIS
3
1.2.2 Climate
The Municipality lies within the dry equatorial climatic zone. It experiences double maxima
rainfall of 700mm in the first rainy season and 770mm in the second rainy season. The Akwapim
–Togo Range heavily influences the rainfall pattern of the Municipality. The northern side of the
Range, which is on the leeward side, receives a lot more rainfall and moisture (in the form of
dew) than other parts of the Municipality thus creating a somewhat distinct ecological zone. The
average annual temperature ranges between 25.1o
C in August and 28.4o C in February and
March. February and March are normally the hottest months (Dickson and Benneh, 2001).
1.2.3 Relief and drainage
The land area of the Municipality consists of plains interspersed with undulating topography in
the south and west. The Akwapim Range rises steeply above the northern part and lies generally
at 375-420m south of Aburi and falls to 300m southwards. Major rivers and streams traversing
the Municipality include the Sisami and the Dakubi.
1.2.4 Vegetation
The Municipality is dominated by two closely related vegetation types, namely; shrub lands and
grassland. The grassland covers the low lying parts of the Municipality graduating into shrubs
and wood thickets towards the northern part close to the Akwapim –Togo Range.
1.3 Political and Administration Structure
The political administration of the Municipality is based on the local government structure. The
Municipality is headed by the Municipal Chief Executive and supported by the Municipal
Coordinating Director who is the administrative head of the Municipality. The highest decision
making body of the Assembly is the General Assembly comprising of all elected and appointed
Assembly members. This body performs the deliberative and decision making functions of the
Assembly. This body consists of the elected representatives (70percent) of the various Electoral
Areas and appointed representatives (30percent). The Assembly through the Local Government
Act, Act 462, 1993 (section 10 sub sections 1,2,3,4 and 5), carries out the legislative, deliberative
and executive functions of Government. There are currently 15 Assembly members including the
Municipal Chief Executive and the Member of Parliament for Madina constituency. The
members are made up of four appointed and nine elected members. The Municipality is divided
into two zonal councils covering nine electoral areas.
1.4 Cultural and Social Structure
The indigenous people of the La Nkwantanang Madina Municipality are Ga Dangmes and the
main language spoken is Ga-Adangbe. There are two main Traditional Areas; namely the La
Traditional Area and the Teshie Traditional Area. In addition to these major traditional divisions,
there are other areas in the Municipality whose historical allegiance is to other groups. All these
are part of the indigenous Ga-Dangme people who settled in the area in the 16th
and 17th
Centuries covering a large area from the coast to the southern edge of the Akwapim – Togo
Range. It is mainly a patrilineal society. Their livelihoods traditionally are farming and trading.
There are large groups of settler communities who have evolved their own systems of
organization heavily influenced by their cultural heritage. The settler communities comprises of

4
settlers who were settled in the area in the late 1950s and come from the Gonja, Dagomba, Wala,
Frafra, and Hausa stock. These communities have evolved to become almost indigenous by
establishing firm roots in the area. Other ethnic groups in the Municipality are Akans, Ewes,
Nzema’s and Guans among others. The indigenes are the La people and they celebrate the
Homowo festival. However, due to the cosmopolitan nature of the Municipality many other
ethnic minority tribes also celebrate their own festivals.
1.5 Economy
The main economic activities in the La Nkwantanang Madina Municipality are commerce,
agriculture, services and manufacturing. Trading is one of the main economic activities in the
Municipality with the Madina market as the main trading centre. It generates employment and
revenue to the people in the Municipality. There are many manufacturing industries in the
Municipality. They include the Nkulenu Industry, Mechanical Lloyd, Royal Aluminum
Company, Special Ice Water Company, Voltic Water Bottling among others. The items produced
include food processing, packaging and fabrication. The services sector covers areas such as
financial institutions, hospitality, personal care and beauty, telecommunications, graphic design,
food services and professional services among others. This sector employs large numbers of
skilled people and it is one of the rapidly growing sectors of the Municipal economy. There is
also a constructional industry in the Municipality engaged in businesses such as block factories,
stone quarrying and the sale of building materials in addition to the provision of skills such as
masonry, carpentry, tiling and many other associated skilled jobs in the industry.
The major agricultural activities are farming and livestock rearing. The crops include cereals,
tubers and vegetables. Livestock and poultry farmers can be found at Teiman, Ayimensa,
Pantang and Oyarifa.
There are quite a number of agro-processing establishments in the Municipality. These include
the Nkulenu Industries located in Madina, which process vegetables and fruits on a large scale.
Gari processing is predominant at Teiman. Alternative livelihood activities include mushroom
and snail production and the rearing of grass cutters and rabbits.
The Municipality is linked by road to other parts of Accra and the rest of the country.
Commercial transportation by vehicles, taxis and others provide employment for drivers and
mechanics. There are a number of business associations in the Municipality, which include
market women’s associations, drivers associations, farmer groups, dressmakers and beauticians
associations.
1.5.1 Demography
The demographic characteristics of the population in the Municipality have social and economic
implications and are the benchmark for the provision of social services such as recreational
centres, housing, health services, and education. The age-sex structure also influences fertility
and mortality levels. At the community level, age and sex are two attributes that largely
influence an individual’s status and role in society.
A significant proportion of population in the Municipality constitute the youth population (0 -9)
years suggests that the population in the Municipality has the potential to grow for a considerable
5
number of years with implications for economic development. However the youth dependency
on the working-age population of Municipality has serious implications on the economy.
1.6 Census Methodology, Concepts and Definitions
1.6.1 Introduction
Ghana Statistical Service (GSS) was guided by the principle of international comparability and
the need to obtain accurate information in the 2010 Population and Housing Census (2010 PHC).
The Census was, therefore, conducted using all the essential features of a modern census as
contained in the United Nations Principles and Recommendations for countries taking part in the
2010 Round of Population and Housing Censuses.
Experience from previous post independence censuses of Ghana (1960, 1970, 1984 and 2000)
was taken into consideration in developing the methodologies for conducting the 2010 PHC. The
primary objective of the 2010 PHC was to provide information on the number, distribution and
social, economic and demographic characteristics of the population of Ghana necessary to
facilitate the socio-economic development of the country.
1.6.2 Pre-enumeration activities
Development of census project document and work plans
A large scale statistical operation, such as the 2010 Population and Housing Census required
meticulous planning for its successful implementation. A working group of the Ghana Statistical
Service prepared the census project document with the assistance of two consultants. The
document contains the rationale and objectives of the census, census organisation, a work plan as
well as a budget. The project document was launched in November 2008 as part of the Ghana
Statistics Development Plan (GSDP) and reviewed in November 2009.
Census secretariat and committees
A well-structured management and supervisory framework that outlines the responsibilities of
the various stakeholders is essential for the effective implementation of a population and housing
census. To implement the 2010 PHC, a National Census Secretariat was set up in January 2008
and comprised professional and technical staff of GSS as well as staff of other Ministries,
Departments and Agencies (MDAs) seconded to GSS. The Census Secretariat was primarily
responsible for the day-to-day planning and implementation of the census activities. The
Secretariat had seven units, namely; census administration, cartography, recruitment and
training, publicity and education, field operations and logistics management, data processing,
and data analysis and dissemination.
The Census Secretariat was initially headed by an acting Census Coordinator engaged by the
United Nations Population Fund (UNFPA) in 2008 to support GSS in the planning of the Census.
In 2009, the Census Secretariat was re-organized with the Government Statistician as the
National Chief Census Officer and overall Coordinator, assisted by a Census Management Team
and a Census Coordinating Team. The Census Management Team had oversight responsibility
for the implementation of the Census. It also had the responsibility of taking critical decisions on
the census in consultation with other national committees. The Census Coordinating Team, on
the other hand, was responsible for the day-to-day implementation of the Census programme.

6
A number of census committees were also set up at both national and sub-national levels to
provide guidance and assistance with respect to resource mobilization and technical advice. At
the national level, the committees were the National Census Steering Committee (NCSC), the
National Census Technical Advisory Committee (NCTAC) and the National Census Publicity
and Education Committee (NCPEC). At the regional and district levels, the committees were the
Regional Census Implementation Committee and the District Census Implementation
Committee, respectively.
The Regional and District Census Implementation Committees were inter-sectoral in their
composition. Members of the Committees were mainly from decentralized departments with the
Regional and District Coordinating Directors chairing the Regional Census Implementation
Committee and District Census Implementation Committee, respectively. The Committees
contributed to the planning of district, community and locality level activities in areas of
publicity and field operations. They supported the Regional and District Census Officers in the
recruitment and training of field personnel (enumerators and supervisors), as well as mobilizing
logistical support for the census.
Selection of census topics
The topics selected for the 2010 Population and Housing Census were based on
recommendations contained in the UN Principles and Recommendations for 2010 Round of
Population and Housing Censuses and the African Addendum to that document as well as the
needs of data users. All the core topics recommended at the global level, i.e., geographical and
internal migration characteristics, international migration, household characteristics,
demographic and social characteristics such as age, date of birth, sex, and marital status, fertility
and mortality, educational and economic characteristics, issues relating to disability and housing
conditions and amenities were included in the census.
Some topics that were not considered core by the UN recommendations but which were found to
be of great interest and importance to Ghana and were, therefore, included in the 2010 PHC are
religion, ethnicity, employment sector and place of work, agricultural activity, as well as housing
topics, such as, type of dwelling, materials for outer wall, floor and roof, tenure/holding
arrangement, number of sleeping rooms, cooking fuel, cooking space and information
communication technology (ICT).
Census mapping
A timely and well implemented census mapping is pivotal to the success of any population and
housing census. Mapping delineates the country into enumeration areas to facilitate smooth
enumeration of the population. The updating of the 2000 Census Enumeration Area (EA) maps
started in the last quarter of 2007 with the acquisition of topographic sheets of all indices from
the Survey and Mapping Division of the Lands Commission. In addition, digital sheets were
also procured for the Geographical Information System Unit.
The Cartography Unit of the Census Secretariat collaborated with the Survey and Mapping
Division of the Lands Commission and the Centre for Remote Sensing and Geographic
Information Services (CERSGIS) of the Department of Geography and Resource Development,
University of Ghana, to determine the viability of migrating from analog to digital mapping for

7
the 2010 PHC, as recommended in the 2000 PHC Administrative Report. Field cartographic
work started in March 2008 and was completed in February 2010.
Development of questionnaire and manuals
For effective data collection, there is the need to design appropriate documents to solicit the
required information from respondents. GSS consulted widely with main data users in the
process of the questionnaire development. Data users including MDAs, research institutions,
civil society organizations and development partners were given the opportunity to indicate the
type of questions they wanted to be included in the census questionnaire.
Documents developed for the census included the questionnaire and manuals, and field operation
documents. The field operation documents included Enumerator’s Visitation Record Book,
Supervisor’s Record Book, and other operational control forms. These record books served as
operational and quality control tools to assist enumerators and supervisors to control and monitor
their field duties respectively.
Pre-tests and trial census
It is internationally recognized that an essential element in census planning is the pre-testing of
the questionnaire and related instructions. The objective of the pre-test is to test the
questionnaire, the definition of its concepts and the instructions for filling out the questionnaire.
The census questionnaire was pre-tested twice in the course of its development. The first pre-test
was carried out in March 2009 to find out the suitability of the questions and the instructions
provided. It also tested the adequacy and completeness of the responses and how respondents
understood the questions. The second pre-test was done in 10 selected enumeration areas in
August, 2009. The objective of the second pre-test was to examine the sequence of the questions,
test the new questions, such as, date of birth and migration, and assess how the introduction of
‘date of birth’ could help to reduce ‘age heaping’. With regard to questions on fertility, the pre-
tests sought to find out the difference, if any, between proxy responses and responses by the
respondents themselves. Both pre-tests were carried in the Greater Accra Region. Experience
from the pre-tests was used to improve the final census questionnaire.
A trial census which is a dress rehearsal of all the activities and procedures that are planned for
the main census was carried out in October/November 2009. These included recruitment and
training, distribution of census materials, administration of the questionnaire and other census
forms, enumeration of the various categories of the population (household, institutional and
floating population), and data processing. The trial census was held in six selected districts
across the country namely; Saboba (Northern Region), Chereponi (Northern Region), Sene
(Brong Ahafo Region), Bia (Western Region), Awutu Senya (Central Region), and Osu Klottey
Sub-Metro (Greater Accra Region). A number of factors were considered in selecting the trial
census districts. These included: administrative boundary issues, ecological zone, and
accessibility, enumeration of floating population/outdoor-sleepers, fast growing areas,
institutional population, and enumeration areas with scattered settlements.
The trial census provided GSS with an opportunity to assess its plans and procedures as well as
the state of preparedness for the conduct of the 2010 PHC. The common errors found during
editing of the completed questionnaires resulted in modifications to the census questionnaire,

8
enumerator manuals and other documents. The results of the trial census assisted GSS to arrive at
technically sound decisions on the ideal number of persons per questionnaire, number of persons
in the household roster, migration questions, placement of the mortality question, serial
numbering of houses/housing structures and method of collection of information on community
facilities. Lessons learnt from the trial census also guided the planning of the recruitment
process, the procedures for training of census field staff and the publicity and education
interventions.
1.6.3 Census enumeration
Method of enumeration and field work
All post- independence censuses (1960, 1970, 1984, and 2000) conducted in Ghana used the de
facto method of enumeration where people are enumerated at where they were on census night
and not where they usually reside. The same method was adopted for the 2010 PHC. The de
facto count is preferred because it provides a simple and straight forward way of counting the
population since it is based on a physical fact of presence and can hardly be misinterpreted. It is
thought that the method also minimizes the risks of under-enumeration and over enumeration.
The canvasser method, which involves trained field personnel visiting houses and households
identified in their respective enumeration areas, was adopted for the 2010 PHC.
The main census enumeration involved the canvassing of all categories of the population by
trained enumerators, using questionnaires prepared and tested during the pre-enumeration phase.
Specific arrangements were made for the coverage of special population groups, such as the
homeless and the floating population. The fieldwork began on 21st September 2010 with the
identification of EA boundaries, listing of structures, enumeration of institutional population and
floating population.
The week preceding the Census Night was used by field personnel to list houses and other
structures in their enumeration areas. Enumerators were also mobilized to enumerate
residents/inmates of institutions, such as, schools and prisons. They returned to the institutions
during the enumeration period to reconcile the information they obtained from individuals and
also to cross out names of those who were absent from the institutions on Census Night. Out-
door sleepers (floating population) were also enumerated on the Census Night.
Enumeration of the household population started on Monday, 27th
September, 2010.
Enumerators visited houses, compounds and structures in their enumeration areas and started
enumerating all households including visitors who spent the Census Night in the households.
Enumeration was carried out in the order in which houses/structures were listed and where the
members of the household were absent, the enumerator left a call-back-card indicating when
he/she would come back to enumerate the household. The enumeration process took off
smoothly with enumerators poised on completing their assignments on schedule since many of
them were teachers and had to return to school. However, many enumerators ran short of
questionnaires after a few days’ work.
Enumeration resumed in all districts when the questionnaire shortage was resolved and by 17th
October, 2010, enumeration was completed in most districts. Enumerators who had finished their
work were mobilized to assist in the enumeration of localities that were yet to be enumerated in
some regional capitals and other fast growing areas. Flooded areas and other inaccessible

9
localities were also enumerated after the end of the official enumeration period. Because some
enumeration areas in fast growing cities and towns, such as, Accra Metropolitan Area, Kumasi,
Kasoa and Techiman were not properly demarcated and some were characterized by large EAs,
some enumerators were unable to complete their assigned tasks within the stipulated time.
1.6.4 Post enumeration survey
In line with United Nations recommendations, GSS conducted a Post Enumeration Survey (PES)
in April, 2011 to check content and coverage error. The PES was also to serve as an important
tool in providing feedback regarding operational matters such as concepts and procedures in
order to help improve future census operations. The PES field work was carried out for 21 days
in April 2011 and was closely monitored and supervised to ensure quality output. The main
findings of the PES were that:
97.0 percent of all household residents who were in the country on Census Night (26th
September, 2010) were enumerated.
1.3 percent of the population was erroneously included in the census.
Regional differentials are observed. Upper East region recorded the highest coverage rate
of 98.2 percent while the Volta region had the lowest coverage rate of 95.7 percent.
Males (3.3%) were more likely than females (2.8%) to be omitted in the census. The
coverage rate for males was 96.7 percent and the coverage rate for females was 97.2
percent. Also, the coverage rates (94.1%) for those within the 20-29 and 30-39 age
groups are relatively lower compared to the coverage rates of the other age groups.
There was a high rate of agreement between the 2010 PHC data and the PES data for sex
(98.8%), marital status (94.6%), relationship to head of household (90.5%) and age
(83.0%).
1.6.5 Release and dissemination of results
The provisional results of the census were released in February 2011 and the final results in May
2012. A National Analytical report, six thematic reports, a Census Atlas, 10 Regional Reports
and a report on Demographic, Social, Economic and Housing were prepared and disseminated in
2013.
1.6.6 Concepts and definitions
Introduction
The 2010 Population and Housing Census of Ghana followed the essential concepts and
definitions of a modern Population and Housing Census as recommended by the United Nations
(UN). It is important that the concepts, definitions and recommendations are adhered to since
they form the basis upon which Ghana could compare her data with that of other countries.
The concepts and definitions in this report cover all sections of the 2010 Population and Housing
Census questionnaires (PHC1A and PHC1B). The sections were: geographical location of the
population, household and non-household population, literacy and education, emigration,
10
demographic and economic characteristics, disability, information communication technology
(ICT), fertility, mortality, agricultural activity and housing conditions.
The concepts and definitions are provided to facilitate understanding and use of the data
presented in this report. Users are therefore advised to use the results of the census within the
context of these concepts and definitions.
Region
There were ten (10) administrative regions in Ghana during the 2010 Population and Housing
Census as they were in 1984 and 2000.
District
In 1988, Ghana changed from the local authority system of administration to the district
assembly system. In that year, the then existing 140 local authorities were demarcated into 110
districts. In 2004, 28 new districts were created; this increased the number of districts in the
country to 138. In 2008, 32 additional districts were created bringing the total number of districts
to 170. The 2010 Population and Housing Census was conducted in these 170 administrative
districts (these are made-up of 164 districts/municipals and 6 metropolitan areas). In 2012, 46
new districts were created to bring the total number of districts to 216. There was urgent need for
data for the 46 newly created districts for planning and decision-making. To meet this demand,
the 2010 Census data was re-programmed into 216 districts after carrying out additional
fieldwork and consultations with stakeholders in the districts affected by the creation of the new
districts.
Locality
A locality was defined as a distinct population cluster (also designated as inhabited place,
populated centre, settlement) which has a NAME or LOCALLY RECOGNISED STATUS. It
included fishing hamlets, mining camps, ranches, farms, market towns, villages, towns, cities
and many other types of population clusters, which meet the above criteria. There were two
main types of localities, rural and urban. As in previous censuses, the classification of localities
into ‘urban’ and ‘rural’ was based on population size. Localities with 5,000 or more persons
were classified as urban while localities with less than 5,000 persons were classified as rural.
Population
The 2010 Census was a “de facto” count and each person present in Ghana, irrespective of
nationality, was enumerated at the place where he/she spent the midnight of 26th September
2010.
Household
A household was defined as a person or a group of persons, who lived together in the same house
or compound and shared the same house-keeping arrangements. In general, a household
consisted of a man, his wife, children and some other relatives or a house help who may be living
with them. However, it is important to remember that members of a household are not
necessarily related (by blood or marriage) because non-relatives (e.g. house helps) may form part
of a household.
11
Head of household
The household head was defined as a male or female member of the household recognised as
such by the other household members. The head of household is generally the person who has
economic and social responsibility for the household. All relationships are defined with reference
to the head.
Household and non-household population
Household population comprised of all persons who spent the census night in a household
setting. All persons who did not spend the census night in a household setting (except otherwise
stated) were classified as non-household population. Persons who spent census night in any of
the under listed institutions and locations were classified as non-household population:
a) Educational institutions
b) Children's and old people’s homes
c) Hospitals and healing centres
d) Hotels
e) Prisons
f) Service barracks
g) Soldiers on field exercise
h) Floating population: The following are examples of persons in this category:
i. All persons who slept in lorry parks, markets, in front of stores and offices, public
bathrooms, petrol filling stations, railway stations, verandas, pavements, and all such
places which are not houses or compounds.
ii. Hunting and fishing camps.
iii. Beggars and vagrants (mentally sick or otherwise).
Age
The age of every person was recorded in completed years disregarding fractions of days and
months. For those persons who did not know their birthdays, the enumerator estimated their ages
using a list of district, regional and national historical events.
Nationality
Nationality is defined as the country to which a person belongs. A distinction is made between
Ghanaians and other nationals. Ghanaian nationals are grouped into Ghanaian by birth, Ghanaian
with dual nationality and Ghanaian by naturalization. Other nationals are grouped into ECOWAS
nationals, Africans other than ECOWAS nationals, and non-Africans.

12
Ethnicity
Ethnicity refers to the ethnic group that a person belonged to. This information is collected only
from Ghanaians by birth and Ghanaians with dual nationality. The classification of ethnic groups
in Ghana is that officially provided by the Bureau of Ghana Languages and which has been in
use since the 1960 census.
Birthplace
The birthplace of a person refers to the locality of usual residence of the mother at the time of
birth. If after delivery a mother stayed outside her locality of usual residence for six months or
more or had the intention of staying in the new place for six or more months, then the actual
town/village of physical birth becomes the birthplace of the child.
Duration of residence
Duration of residence refers to the number of years a person has lived in a particular place. This
question is only asked of persons not born in the place where enumeration took place. Breaks in
duration of residence lasting less than 12 months are disregarded. The duration of residence of
persons who made multiple movements of one (1) year or more is assumed to be the number of
years lived in the locality (town or village) since the last movement.
Religion
Religion refers to the individual’s religious affiliation as reported by the respondent, irrespective
of the religion of the household head or the head’s spouse or the name of the person. No attempt
was made to find out if respondents actually practiced the faith they professed.
Marital status
Marital status refers to the respondent’s marital status as at Census Night. The question on
marital status was asked only of persons 12 years and older. The selection of the age limit of 12
years was based on the average age at menarche and also on the practice in some parts of the
country where girls as young as 12 years old could be given in marriage.
Literacy
The question on literacy referred to the respondent's ability to read and write in any language. A
person was considered literate if he/she could read and write a simple statement with
understanding. The question on literacy was asked only of persons 11 years and older.
Education
School Attendance
Data was collected on school attendance for all persons three (3) years and older. School
attendance refers to whether a person has ever attended, was currently attending or has never
attended school. In the census, school meant an educational institution where a person received
at least four hours of formal education.
Although the lower age limit of formal education is six years for primary one, eligibility for the
school attendance question was lowered to three years because pre-school education has become
an important phenomenon in the country.

13
Level of Education
Level of education refers to the highest level of formal school that a person ever attended or was
attending. This information was obtained for persons 3 years and older.
Activity status
Activity status refers to economic or non-economic activity of respondents during the 7 days
preceding census night. Information on type of activity was collected on persons 5 years and
older. A person was regarded as economically active if he/she:
i. Worked for pay or profit or family gain for at least 1 hour within the 7 days preceding
Census Night. This included persons who were in paid employment or self- employment
or contributing family workers
ii. Did not work, but had jobs to return to
iii. Were unemployed.
The economically not active were persons who did not work and were not seeking for work.
They were classified by reasons for not being economically active. Economically not active
persons included homemakers, students, retired persons, the disabled and persons who were
unable to work due to their age or ill-health.
Occupation
This referred to the type of work the person was engaged in at the establishment where he/she
worked. This was asked only of persons 5 years and older who worked 7 days before the census
night, and those who did not work but had a job to return to as well as those unemployed who
had worked before. All persons who worked during the 7 days before the census night were
classified by the kind of work they were engaged in. The emphasis was on the work the person
did during the reference period and not what he/she was trained to do. For those who did not
work but had a job to return to, their occupation was the job they would go back to after the
period of absence. Also, for persons who had worked before and were seeking for work and
available for work, their occupation was on the last work they did before becoming unemployed.
If a person was engaged in more than one occupation, only the main one was considered.
Industry
Industry referred to the type of product produced or service rendered at the respondent’s work
place. Information was collected only on the main product produced or service rendered in the
establishment during the reference period.
Employment status
Employment status refers to the status of a person in the establishment where he/she currently
works or previously worked. Eight employment status categories were provided: employee, self-
employed without employees, self-employed with employees, casual worker, contributing family
worker, apprentice, domestic employee (house help). Persons who could not be classified under
any of the above categories were classified as “other”.

14
Employment sector
This refers to the sector in which a person worked. The employment sectors covered in the
census were public, private formal, private informal, semi-public/parastatal, NGOs and
international organizations.
Disability
Persons with disability were defined as those who were unable to or were restricted in the
performance of specific tasks/activities due to loss of function of some part of the body as a
result of impairment or malformation. Information was collected on persons with visual/sight
impairment, hearing impairment, mental retardation, emotional or behavioural disorders and
other physical challenges.
Information Communication Technology (ICT)
Information Communication Technology (ICT) questions were asked for both individuals and
households. Persons having mobile phones refer to respondents 12 years and older who owned
mobile phones (irrespective of the number of mobile phones owned by each person). Persons
using internet facility refers to those who had access to internet facility at home, internet cafe, on
mobile phone or other mobile device. Internet access is assumed to be not only via computer, but
also by mobile phones, PDA, game machine and digital television.
Households having personal computers/laptops refer to households who own desktops/laptop
computers. The fixed telephone line refers to a telephone line connecting a customer’s terminal
equipment (e.g. telephone set, facsimile machine) to the public switch telephone network.
Fertility
Two types of fertility data were collected: lifetime fertility and current fertility. Lifetime fertility
refers to the total number of live births that females 12 years and older had ever had during their
life time. Current fertility refers to the number of live births that females 12-54 years old had in
the 12 months preceding the Census Night.
Mortality
Mortality refers to all deaths that occurred in the household during the 12 months preceding the
Census Night. The report presents information on deaths due to accidents, violence, homicide
and suicide. In addition, data were collected on pregnancy-related deaths of females 12-54
years.
Agriculture
The census sought information on household members who are engaged in agricultural activities,
including the cultivation of crops or tree planting, rearing of livestock or breeding of fish for sale
or family consumption. Information was also collected on their farms, types of crops and number
and type of livestock.
Housing conditions and facilities
The UN recommended definition of a house as “a structurally separate and independent place of
abode such that a person or group of persons can isolate themselves from the hazards of climate

15
such as storms and the sun’’ was adopted. The definition, therefore, covered any type of shelter
used as living quarters, such as separate houses, semi-detached houses, flats/apartments,
compound houses, huts, tents, kiosks and containers.
Living quarters or dwelling units refer to a specific area or space occupied by a particular
household and therefore need not necessarily be the same as the house of which the dwelling unit
may be a part.
Information collected on housing conditions included the type of dwelling unit, main
construction materials for walls, floor and roof, holding/tenure arrangement, ownership type,
type of lighting, source of water supply and toilet facilities. Data was also collected on method of
disposal of solid and liquid waste.
1.7 Organization of the Report
The report consists of nine chapters. Chapter one provides basic information about the district. It
gives a brief background of the district, describing its physical features, political and
administrative structure, social and cultural structure, economy and the methodology and
concepts used in the report. Chapter two discusses the population size, composition and age
structure. It further discusses the migratory pattern in the district as well as fertility and
mortality.
In chapter three, the focus is on household size, composition and headship as well as the marital
characteristics and nationality of the inhabitants of the district. The chapter also discusses the
religious affiliations and the educational statuses of the members of the district. Chapter four
focuses on economic characteristics such as economic activity status, occupation, industries and
the employment status and sectors that the people are employed.
Information and Communication Technology (ICT) is discussed in chapter five. It analyses
mobile phone ownership, Internet use and ownership of desktop/laptop computers while chapter
six is devoted to Persons living with disabilities (PWDs) and their socio-demographic
characteristics. Chapter seven concentrates on the agricultural activities of the households,
describing the types of farming activities, livestock rearing and numbers of livestock reared.
In chapter eight, housing conditions such as housing stock, type of dwelling and construction
materials, room occupancy, holding and tenancy, lighting and cooking facilities, bathing and
toilet facilities, waste disposal and source of water for drinking or for other domestic use in the
district are discussed and analyzed in detail. The final chapter, Chapter nine presents the
summary of findings and conclusions. It also discusses the policy implications of the findings for
the district.
16
CHAPTER TWO
DEMOGRAPHIC CHARACTERISTICS
2.1 Introduction
It is important that the size, composition and distribution of any population be analyzed to
facilitate development planning and implementation of policies. A country’s population
composition greatly influences its needs and well-being. The current decentralized governance
system and administration of planning in Ghana require that statistics are provided on the size,
composition and distribution of the population at the Metropolitan, Municipal and District levels.
This chapter analyses population size and distribution, age-sex structure, nationality, fertility,
mortality and migration in the La Nkwantanang Madina Municipality.
2.2 Population Size and Distribution
Table 2.1 presents the population of the La Nkwantanang Madina Municipality by age, sex, sex
ratio and type of locality. The total population of the Municipality in 2010 was 111,926
comprising 48.5 percent males as against 51.5 females, giving a sex ratio of 94.1 percent
compared with 93.6 in the region and 95.2 at the national level (GSS, 2012).
In terms of age distribution, the greatest proportion of the population (13.0%) was in the age
bracket of 20-24 while the least proportion of 0.0 percent fell within the age category of 95-99
(Table 2.1). The results also showed that the proportion of the population among age groups
starting from 20-24 years generally decreases in each subsequent age group. The highest
proportion of the male and female population was also within the age category of 20-24. The La
Nkwantanang Madina Municipality is generally urban with 84 percent of the population resident
in urban areas, particularly those aged between 75-79 years. It has a total dependency ratio of
47.2, which was lower than that of the region with 53.4. Total dependency ratio was higher in
rural (52.7) than urban areas (46.2).

17
Table 2.1: Population by age, sex and type of locality
Age Group Both Sexes Male Female Sex
ratio
Urban Rural
Number Percent Number Percent Number Percent Number Percent Number Percent
All Ages 111,926 100.0
54,271 48.5
57,655 51.5 94.1
93,987 84.0
17,939 16.0
0 – 4 12,001 10.7
6,027 50.2
5,974 49.8 100.9
9,790 81.6
2,211 18.4
5 – 9 9,834 8.8
4,926 41
4,908 40.9 100.4
8,032 81.7
1,802 18.3
10 – 14 10,250 9.2
4,706 39.2
5,544 46.2 84.9
8,546 83.4
1,704 16.6
15 – 19 11,191 10.0
4,998 41.6
6,193 51.6 80.7
9,569 85.5
1,622 14.5
20 – 24 14,533 13.0
7,019 58.5
7,514 62.6 93.4
12,412 85.4
2,121 14.6
25 – 29 13,991 12.5
6,780 56.5
7,211 60.1 94
11,807 84.4
2,184 15.6
30 – 34 10,274 9.2
5,196 43.3
5,078 42.3 102.3
8,597 83.7
1,677 16.3
35 – 39 7,910 7.1
4,012 33.4
3,898 32.5 102.9
6,556 82.9
1,354 17.1
40 – 44 5,804 5.2
2,887 24.1
2,917 24.3 99
4,868 83.9
936 16.1
45 – 49 4,409 3.9
2,165 18.0
2,244 18.7 96.5
3,704 84.0
705 16.0
50 – 54 3,630 3.2
1,731 14.4
1,899 15.8 91.2
3,091 85.2
539 14.8
55 – 59 2,432 2.2
1,181 9.8
1,251 10.4 94.4
2,078 85.4
354 14.6
60 – 64 1,839 1.6
884 7.4
955 8.0 92.6
1,583 86.1
256 13.9
65 – 69 1,230 1.1
565 4.7
665 5.5 85
1,069 86.9
161 13.1
70 – 74 1,096 1.0
528 4.4
568 4.7 93
973 88.8
123 11.2
75 – 79 653 0.6
311 2.6
342 2.8 90.9
594 91.0
59 9.0
80 – 84 428 0.4
181 1.5
247 2.1 73.3
369 86.2
59 13.8
85 – 89 259 0.2
104 0.9
155 1.3 67.1
220 84.9
39 15.1
90 – 94 118 0.1
51 0.4
67 0.6 76.1
97 82.2
21 17.8
95 – 99 44 0.0
19 0.2
25 0.2 76
32 72.7
12 27.3
All Ages 111,926 100.0
54,271 48.5
57,655 51.5 94.1
93,987 84.0
17,939 16.0
0-14 32,085 28.7
15,659 48.8
16,426 51.2 95.3
26,368 82.2
5,717 17.8
15-64 76,013 67.9
36,853 48.5
39,160 51.5 94.1
64,265 84.5
11,748 15.5
65+ 3,828 3.4
1,759 46
2,069 54 85
3,354 87.6
474 12.4
Age-dependency ratio 47.2 47.3 47.2 46.2 52.7 Source: Ghana Statistical Service, 2010 Population and Housing Census
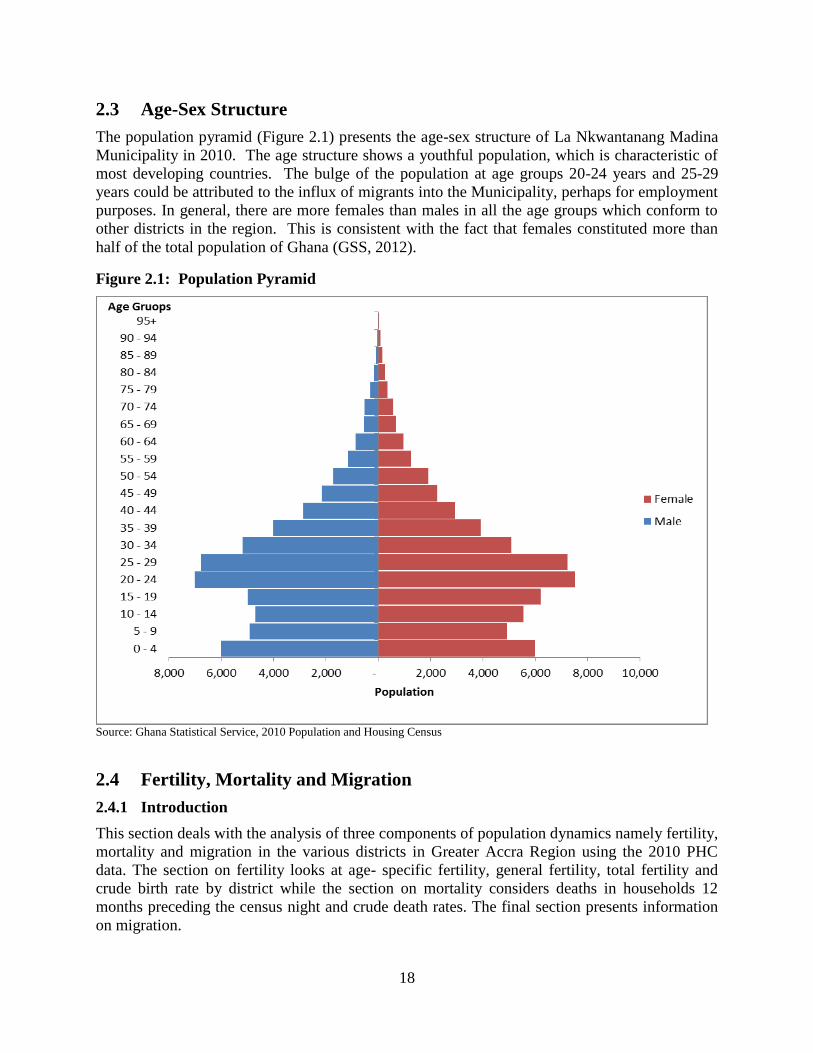
18
2.3 Age-Sex Structure
The population pyramid (Figure 2.1) presents the age-sex structure of La Nkwantanang Madina
Municipality in 2010. The age structure shows a youthful population, which is characteristic of
most developing countries. The bulge of the population at age groups 20-24 years and 25-29
years could be attributed to the influx of migrants into the Municipality, perhaps for employment
purposes. In general, there are more females than males in all the age groups which conform to
other districts in the region. This is consistent with the fact that females constituted more than
half of the total population of Ghana (GSS, 2012).
Figure 2.1: Population Pyramid
Source: Ghana Statistical Service, 2010 Population and Housing Census
2.4 Fertility, Mortality and Migration
2.4.1 Introduction
This section deals with the analysis of three components of population dynamics namely fertility,
mortality and migration in the various districts in Greater Accra Region using the 2010 PHC
data. The section on fertility looks at age- specific fertility, general fertility, total fertility and
crude birth rate by district while the section on mortality considers deaths in households 12
months preceding the census night and crude death rates. The final section presents information
on migration.

19
2.4.2 Fertility
Information on fertility is key in analyzing the growth of a country’s population. Some
definitions on fertility were proposed in the 2010 census. Lifetime fertility was defined as the
total number of live births that females 12 years and older had ever had during their life time
while current fertility refers to the number of live births that females 12-54 years and old had in
the 12 months preceding the Census Night. Total Fertility Rate (TFR) was defined as the total
number of births a woman would have by the end of her childbearing period if she were to pass
through those years bearing children at the currently observed age-specific fertility rates. General
Fertility Rate (GFR) was given as the number of live births occurring during a specified period
per 1,000 women aged between 15-49 while, Crude Birth Rate (CBR) was defined as the number
of births per 1,000 population during a specified period. Women were asked some questions to
determine the total number of live births they had in their lifetime, children surviving and births
in the past 12 months. Data collected included that of females 12-14 years, which is below the
recommended age-specific fertility range of 15-19 years usually used in computing adolescent
fertility.
Table 2.2 has shown that the total fertility rate for the La Nkwantanang Madina Municipality was
2.5, which was slightly lower than the regional average of 2.6 and the National average of 3.3.
Also, both the GFR and CBR of the Municipality (GFR= 71.7 and CBR=22.5) were lower than
that of the region (GFR=75.7 and CBR=22.7). The low levels of TFR, GFR and CBR in the La
Nkwantanang Madina Municipality compared to the regional averages could be due to the use of
contraceptives among females to prevent pregnancy, out-migration of males or increase in male
mortality (Table 2.2).
Table 2.2: Reported total fertility rate, general fertility rate and crude birth rate by
District
District Population
Number of
women 15-
49 years
Births in last 12
month *General
Fertility
Rate
**Crude
Birth
Rate Number Percent
All Districts 4,010,054 1,203,838 91,077 2.6 75.7 22.7
Ga South Municipal 411,377 117,377 13,078 3.9 111.4 31.8
Ga West Municipal 219,788 64,817 5,783 2.9 89.2 26.3
Ga East Municipal 147,742 44,036 3,703 2.8 84.1 25.1
Accra Metropolis 1,665,086 514,523 32,770 2.2 63.7 19.7
Adenta Municipal 78,215 23,158 2,033 2.7 87.8 26
Ledzokuku/Krowor Municipal 227,932 69,038 4,990 2.4 72.3 21.9
Ashaiman Municipal 190,972 57,936 4,489 2.6 77.5 23.5
Tema Metropolis 292,773 89,924 6,138 2.3 68.3 21
Shai Osudoku 51,913 13,269 1,222 3 92.1 23.5
Ada East 71,671 17,576 1,817 3.5 103.4 25.4
Ga Central Municipal 117,220 34,365 3,193 3.1 92.9 27.2
La Dade Kotopon Municipal 183,528 56,845 3,466 2 61 18.9
La Nkwantanang Madina Municipal 111,926 35,055 2,514 2.5 71.7 22.5
Kpone Katamanso 109,864 32,751 2,681 2.6 81.9 24.4
Ningo Prampram 70,923 18,932 1,558 2.8 82.3 22
Ada West 59,124 14,236 1,642 4 115.3 27.8 Source: Ghana Statistical Service, 2010 Population and Housing Census
Note: * Number of live births per 1,000 women aged 15-49 years, ** Number of live births per 1,000 population
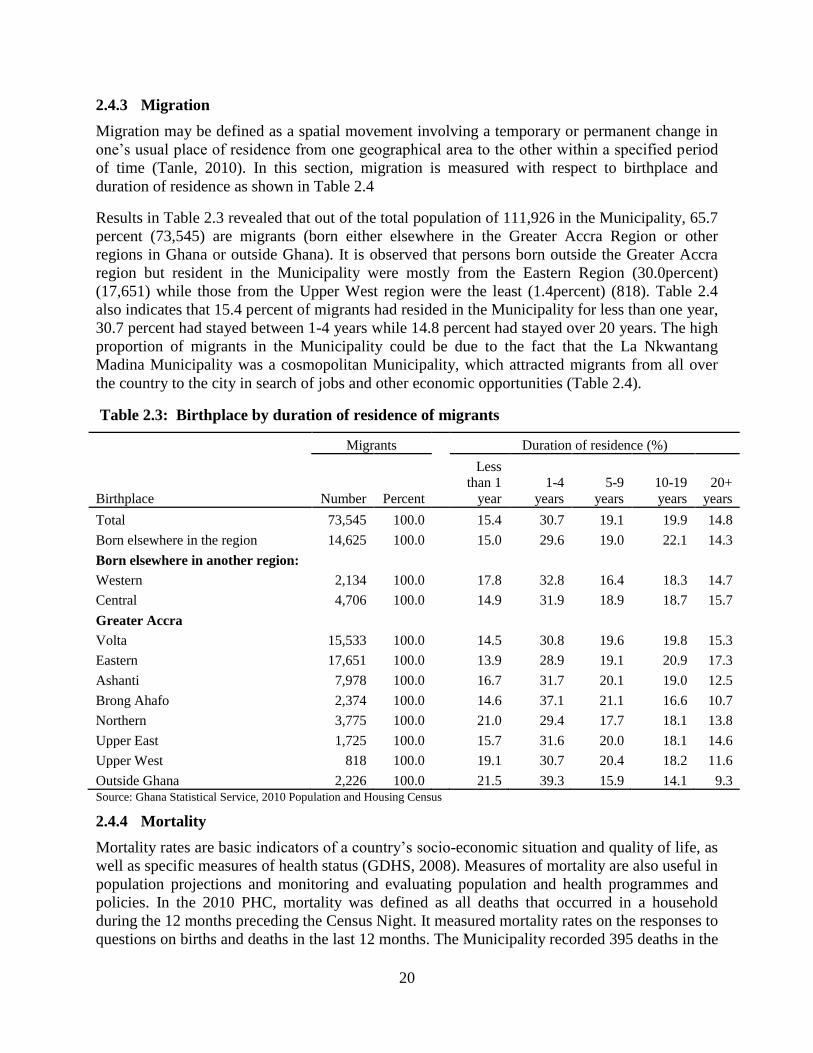
20
2.4.3 Migration
Migration may be defined as a spatial movement involving a temporary or permanent change in
one’s usual place of residence from one geographical area to the other within a specified period
of time (Tanle, 2010). In this section, migration is measured with respect to birthplace and
duration of residence as shown in Table 2.4
Results in Table 2.3 revealed that out of the total population of 111,926 in the Municipality, 65.7
percent (73,545) are migrants (born either elsewhere in the Greater Accra Region or other
regions in Ghana or outside Ghana). It is observed that persons born outside the Greater Accra
region but resident in the Municipality were mostly from the Eastern Region (30.0percent)
(17,651) while those from the Upper West region were the least (1.4percent) (818). Table 2.4
also indicates that 15.4 percent of migrants had resided in the Municipality for less than one year,
30.7 percent had stayed between 1-4 years while 14.8 percent had stayed over 20 years. The high
proportion of migrants in the Municipality could be due to the fact that the La Nkwantang
Madina Municipality was a cosmopolitan Municipality, which attracted migrants from all over
the country to the city in search of jobs and other economic opportunities (Table 2.4).
Table 2.3: Birthplace by duration of residence of migrants
Birthplace
Migrants Duration of residence (%)
Number Percent
Less
than 1
year
1-4
years
5-9
years
10-19
years
20+
years
Total 73,545 100.0
15.4 30.7 19.1 19.9 14.8
Born elsewhere in the region 14,625 100.0
15.0 29.6 19.0 22.1 14.3
Born elsewhere in another region:
Western 2,134 100.0
17.8 32.8 16.4 18.3 14.7
Central 4,706 100.0
14.9 31.9 18.9 18.7 15.7
Greater Accra
Volta 15,533 100.0
14.5 30.8 19.6 19.8 15.3
Eastern 17,651 100.0
13.9 28.9 19.1 20.9 17.3
Ashanti 7,978 100.0
16.7 31.7 20.1 19.0 12.5
Brong Ahafo 2,374 100.0
14.6 37.1 21.1 16.6 10.7
Northern 3,775 100.0
21.0 29.4 17.7 18.1 13.8
Upper East 1,725 100.0
15.7 31.6 20.0 18.1 14.6
Upper West 818 100.0
19.1 30.7 20.4 18.2 11.6
Outside Ghana 2,226 100.0 21.5 39.3 15.9 14.1 9.3 Source: Ghana Statistical Service, 2010 Population and Housing Census
2.4.4 Mortality
Mortality rates are basic indicators of a country’s socio-economic situation and quality of life, as
well as specific measures of health status (GDHS, 2008). Measures of mortality are also useful in
population projections and monitoring and evaluating population and health programmes and
policies. In the 2010 PHC, mortality was defined as all deaths that occurred in a household
during the 12 months preceding the Census Night. It measured mortality rates on the responses to
questions on births and deaths in the last 12 months. The Municipality recorded 395 deaths in the

21
last 12 months preceding the 2010 PHC (Table 2.4). Deaths in households in La Nkwantanang
Madina Municipality was the fourth highest of mortality cases among the districts in the region.
The table shows that the Municipality had a crude death rate of 3.5 per 1000 population, which
was by far lower than the regional average of 4.3 per 1000 population. The low level of mortality
in the Municipality compared to the regional average may be attributed to many factors including
improved sanitation and access to clean water.
Table 2.4: Total population, deaths in households and crude death rate by district
District
Total
Population
Deaths in
households
*Crude
death rate
All Districts 4,010,054 17363 4.3
Ga South Municipal 411,377 1739 4.2
Ga West Municipal 219,788 727 3.3
Ga East Municipal 147,742 504 3.4
Accra Metropolis 1,665,086 7276 4.4
Adenta Municipal 78,215 265 3.4
Ledzokuku/Krowor Municipal 227,932 818 3.6
Ashaiman Municipal 190,972 738 3.9
Tema Metropolis 292,773 1300 4.4
Shai Osudoku 51,913 318 6.1
Ada East 71,671 742 10.4
Ga Central Municipal 117,220 360 3.1
La Dade Kotopon Municipal 183,528 807 4.4
La Nkwantanang Madina Municipal 111,926 395 3.5
Kpone Katamanso 109,864 441 4
Ningo Prampram 70,923 550 7.8
Ada West 59,124 383 6.5 Source: Ghana Statistical Service, 2010 Population and Housing Census
Note: * Number of deaths per 1,000 population
Figure 2.2 shows reported age-specific death rates by sex. Age-specific death rates were the
same for both sexes from age 0-29 years but mortality was higher among females than males
from age group 30-49 years. The high mortality rate among females in that age group could be
attributed to maternal mortality since those ages fall within the reproductive period among
females. However, higher proportions of deaths were recorded among males than females after
age 49 years. This is expected because in Ghana males generally have a lower life expectancy
than females due to the nature of the work that they do which usually expose them to the risk of
dying earlier than females as age increased (Vallin, 2007).
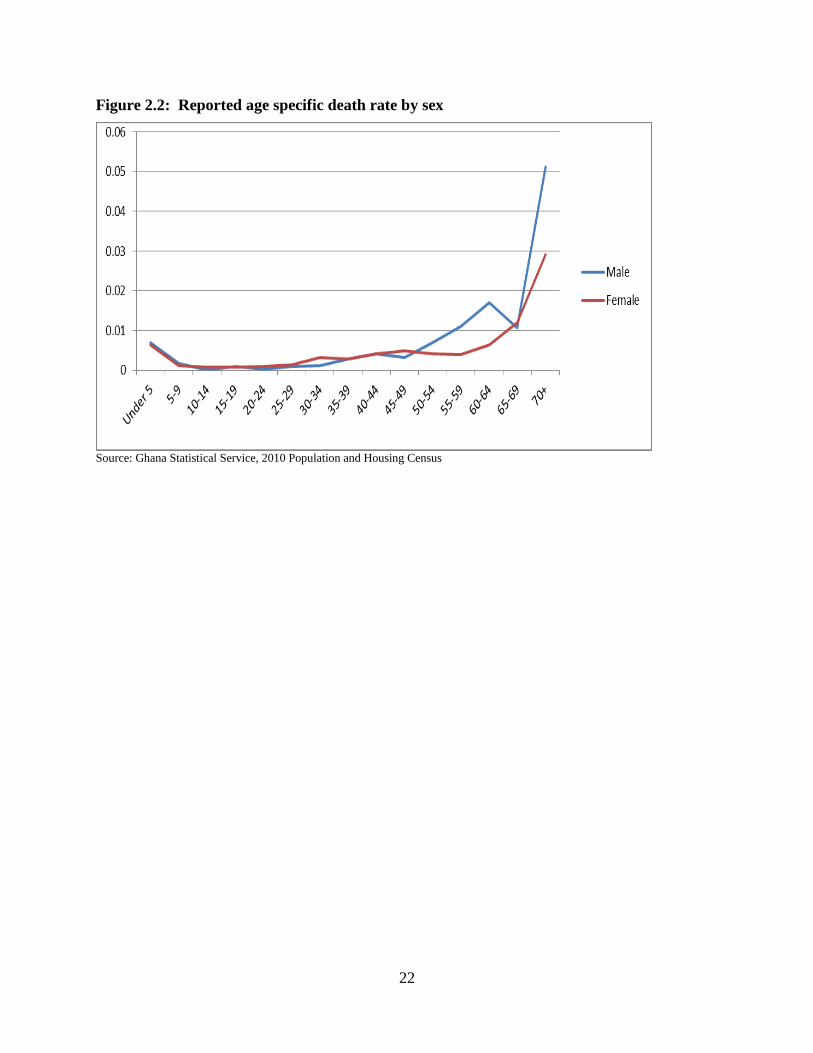
22
Figure 2.2: Reported age specific death rate by sex
Source: Ghana Statistical Service, 2010 Population and Housing Census

23
CHAPTER THREE
SOCIAL CHARACTERISTICS
3.1 Introduction
Knowledge of household structure is important in social and economic planning. In Ghana for
instance, some social intervention programmes target household size and composition. Some of
these interventions include cash transfers to the extremely poor and the vulnerable, i.e., the
Livelihood Empowerment Against Poverty Programme (LEAP) and the National Health
Insurance Scheme (NHIS) in which household data provide opportunities to target beneficiaries
and exempt them from payment of premium. Households are also central to the study of income,
economic dependency, savings, fertility, migration and social welfare.
This chapter therefore describes household characteristics of the La Nkwantanang Madina
Municipality based on the 2010 PHC results. This includes household size, composition and
headship, marital status, nationality, religious affiliation, literacy and education.
3.2 Household Composition and Structure
3.2.1 Household Size
Household size provides important information to policy makers and planners in allocating
resources for social services such shelter, health and education. This section focuses on the
analysis of data on household structure, size, and composition. As shown in Table 3.1, there are
28,870 households in the municipal with 84.1 percent located in urban areas. While the average
household size for rural dwellers (3.8) are slightly higher than the district’s figure of 3.7, which
is the same as that of the urban.
Table 3.1: Household size by type of locality
Categories Total Country Region District Urban Rural
Total household population 24,076,327 3,888,512 108,051 90,732 17,319
Number of households 5,467,054 1,036,370 28,870 24,269 4,601
Average households per house 1.6 2.2 2.1 2.2 1.8
Average household size 4.4 3.8 3.7 3.7 3.8 Source: Ghana Statistical Service, 2010 Population and Housing Census
3.2.2 Household Composition and Sex
The structure and composition of households are influenced by social, economic and
demographic factors while the total size of a population and its characteristics are a reflection of
what pertains at the household level. Table 3.1 displays the household population by relationship
to head. The total household population of the La Nkwantanang Madina Municipality in 2010 is
108, 051.More than one-third (35.3%) of household population in the Municipality are children,
while household heads constitute 26.7 percent, spouse (11.1%), and other relatives (9.8%).

24
Almost the same proportion (5.0 %) is observed for grandchildren and brother/sister, with
adopted/foster children (0.4%) constituting the least of all the members of household.
The household composition by sex follows a similar pattern as observed with that of both sexes.
More than two-thirds of the male household population comprises household heads (36.5%) and
children (sons) (35.8%). The composition of female household population is dominated by
children (daughters) (34.8%), followed by spouse (19.5%) and household heads (17.6%). Male
headship is more common (19,094) than female headship (9,777) in the Municipality (Table 3.2).
This is expected because within the Ghanaian cultural settings, males are heads of households
not females. A female may become a head of household under the following circumstances:
when she is not married or when she is widowed, divorced or separated or where her husband
has migrated (Tanle, 2010).
Table 3.2: Household population by composition and sex
Household composition
Total Male Female
Number Percent Number Percent Number Percent
Total 108,051 100.0
52,361 100.0
55,690 100.0
Head 28,871 26.7
19,094 36.5
9,777 17.6
Spouse (wife/husband) 11,976 11.1
1,094 2.1
10,882 19.5
Child (son/daughter) 38,101 35.3
18,721 35.8
19,380 34.8
Parent/Parent in-law 864 0.8
133 0.3
731 1.3
Son/Daughter in-law 538 0.5
166 0.3
372 0.7
Grandchild 5,524 5.1
2,686 5.1
2,838 5.1
Brother/Sister 5,906 5.5
3,007 5.7
2,899 5.2
Step child 744 0.7
363 0.7
381 0.7
Adopted/Foster child 379 0.4
173 0.3
206 0.4
Other relative 10,572 9.8
4,667 8.9
5,905 10.6
Non-relative 4,576 4.2 2,257 4.3 2,319 4.2 Source: Ghana Statistical Service, 2010 Population and Housing Census
3.2.3 Household structure by sex
Household structure presented in this section refers to the type of relationship (whether related or
unrelated) among household members who were present on census night. Classification of
households depend on whether it is a single person household, household that consists of head
and spouse only, nuclear household (head, spouse(s) and their children) or nuclear extended
among other combinations.
Table 3.3 shows that nuclear family households (composed of head, spouse and children)
makeup one-quarter (25.3 %) of the household population, followed by about one-fifth
constituting extended family households (Head, spouse(s), children and Head's relatives)
(19.3%), and “Head and other composition but no spouse” (14.6%) and Single parent extended
(13.3%).
A similar pattern of the distribution of household population by structure can be observed for the
sexes. The proportions of population by household structure is evenly distributed among the
sexes, with female population dominating in single parent (either extended, nuclear or with non-
relative) and extended family (either with or without non-relatives), whereas the male population
is noted to be relatively higher in proportions for the other categories.

25
Table 3.3: Household population by structure and sex
Household structure Total Male Female
Number Percent Number Percent Number Percent
Total 108,051 100.0
52,361 100.0
55,690 100.0
Nuclear Family
Head only 6,105 5.7
4,049 7.7
2,056 3.7
Head and a spouse only 2,652 2.5
1,325 2.5
1,327 2.4
Nuclear (Head spouse(s) children) 27,383 25.3
13,837 26.4
13,546 24.3
Single parent Nuclear 9,769 9.0
4,020 7.7
5,749 10.3
Extended Family
Extended (Head spouse(s) children
Head's relatives) 20,834 19.3
9,946 19.0
10,888 19.6
Extended + non relatives 3,326 3.1
1,564 3.0
1,762 3.2
Head spouse(s) and other
composition 5,102 4.7
2,466 4.7
2,636 4.7
Single parent Extended 14,351 13.3
5,520 10.5
8,831 15.9
Single parent Extended + non
relative 2,714 2.5
1,098 2.1
1,616 2.9
Head and other composition but no
spouse 15,815 14.6 8,536 16.3 7,279 13.1
Source: Ghana Statistical Service, 2010 Population and Housing Census
3.3 Marital Status
3.3.1 Introduction
Marriage may be defined as a social institution, which establishes the legitimacy of children
(Gough, 1959 cited in GSS 2012 PHC National Analytical Report). It serves as a means for
procreation, mutual support and companionship. Marriage in Ghana is based on legal contractual
relations between a man and a woman. The three forms of marriages in Ghana are the customary,
ordinance and Islamic marriages. There are also informal co-habiting unions with no legal
obligations. The 2010 PHC collected data on marital status for persons aged 12 years and older.
The data is classified into ‘never married’, ‘consensual union’, ‘married’, separated’, ‘divorced’
and ‘widowed’.
3.3.2 Marital status and age
Figure 3.1 present marital status of the population 12 years and older in the La Nkwantanang
Madina Municipality. The Figure shows that, about half (51.2%) of the population 12 years and
older are never married, 37.2 percent are formally married (customary, church or ordinance),
while 11.6 percent constitute the population that are either separated (1.8%), divorced (2.7%),
widowed (3.3%) or in consensual union (3.8%).
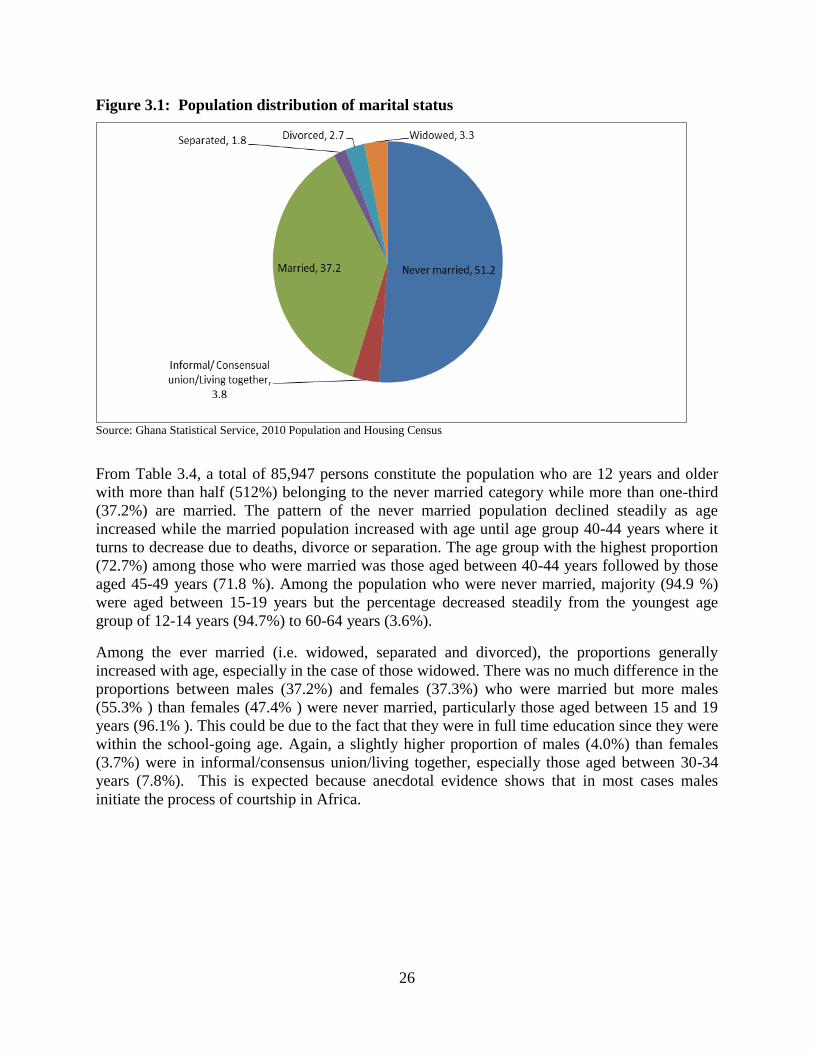
26
Figure 3.1: Population distribution of marital status
Source: Ghana Statistical Service, 2010 Population and Housing Census
From Table 3.4, a total of 85,947 persons constitute the population who are 12 years and older
with more than half (512%) belonging to the never married category while more than one-third
(37.2%) are married. The pattern of the never married population declined steadily as age
increased while the married population increased with age until age group 40-44 years where it
turns to decrease due to deaths, divorce or separation. The age group with the highest proportion
(72.7%) among those who were married was those aged between 40-44 years followed by those
aged 45-49 years (71.8 %). Among the population who were never married, majority (94.9 %)
were aged between 15-19 years but the percentage decreased steadily from the youngest age
group of 12-14 years (94.7%) to 60-64 years (3.6%).
Among the ever married (i.e. widowed, separated and divorced), the proportions generally
increased with age, especially in the case of those widowed. There was no much difference in the
proportions between males (37.2%) and females (37.3%) who were married but more males
(55.3% ) than females (47.4% ) were never married, particularly those aged between 15 and 19
years (96.1% ). This could be due to the fact that they were in full time education since they were
within the school-going age. Again, a slightly higher proportion of males (4.0%) than females
(3.7%) were in informal/consensus union/living together, especially those aged between 30-34
years (7.8%). This is expected because anecdotal evidence shows that in most cases males
initiate the process of courtship in Africa.

27
Table 3.4: Population 12 years and older by age group and marital status
Sex/Age-
group Number Total
Never
married
Informal/
Consensual
union/Living
together Married Separated Divorced Widowed
Both Sexes
Total 85,947 100.0 51.2 3.8 37.2 1.8 2.7 3.3
12 – 14 6,106 100.0 94.7 0.6 4.7 0.0 0.0 0.0
15 - 19 11,191 100.0 94.9 0.8 4.0 0.2 0.0 0.1
20 - 24 14,533 100.0 84.4 4.1 10.5 0.5 0.3 0.1
25 - 29 13,991 100.0 62.2 6.5 29.2 1.0 0.9 0.3
30 - 34 10,274 100.0 34.8 6.5 54.1 1.8 1.9 0.9
35 - 39 7,910 100.0 18.6 5.2 67.7 2.8 4.1 1.5
40 - 44 5,804 100.0 10.6 3.9 72.7 4.2 5.7 2.8
45 - 49 4,409 100.0 7.5 3.5 71.8 4.5 7.5 5.2
50 - 54 3,630 100.0 5.5 1.8 70.7 4.8 9.2 8.0
55 - 59 2,432 100.0 3.5 2.9 68.5 4.1 8.6 12.3
60 - 64 1,839 100.0 3.4 1.1 64.1 4.1 8.7 18.6
65+ 3,828 100.0 6.8 1.4 50.6 2.6 6.1 32.7
Male
Total 41,309 100.0 55.3 4.0 37.2 1.1 1.5 0.9
12 – 14 2,697 100.0 93.8 0.8 5.4 0.0 0.0 0.0
15 - 19 4,998 100.0 96.1 0.4 3.4 0.1 0.0 0.0
20 - 24 7,019 100.0 92.4 2.5 4.8 0.2 0.1 0.0
25 - 29 6,780 100.0 75.0 6.1 18.0 0.5 0.2 0.1
30 - 34 5,196 100.0 42.7 7.8 47.2 1.1 0.9 0.3
35 - 39 4,012 100.0 22.5 6.1 67.2 1.5 2.3 0.3
40 - 44 2,887 100.0 11.6 4.8 77.6 2.1 3.1 0.8
45 - 49 2,165 100.0 7.8 4.2 78.6 3.2 5.0 1.2
50 - 54 1,731 100.0 5.8 2.5 80.9 3.5 5.1 2.2
55 - 59 1,181 100.0 3.6 3.3 84.4 2.0 4.1 2.5
60 - 64 884 100.0 2.6 1.8 81.7 4.6 5.1 4.2
65+ 1,759 100.0 8.1 2.1 72.5 1.8 5.2 10.3
Female
Total 44,638 100.0 47.4 3.7 37.3 2.4 3.7 5.5
12 – 14 3,409 100.0 95.4 0.4 4.2 0.0 0.0 0.0
15 - 19 6,193 100.0 94.0 1.1 4.5 0.2 0.1 0.1
20 - 24 7,514 100.0 77.1 5.7 15.9 0.7 0.5 0.2
25 - 29 7,211 100.0 50.1 6.8 39.7 1.4 1.6 0.4
30 - 34 5,078 100.0 26.8 5.2 61.1 2.5 3.0 1.5
35 - 39 3,898 100.0 14.7 4.2 68.3 4.1 6.0 2.6
40 - 44 2,917 100.0 9.7 3.0 67.8 6.3 8.3 4.9
45 - 49 2,244 100.0 7.2 2.8 65.2 5.8 9.8 9.1
50 - 54 1,899 100.0 5.2 1.2 61.3 6.0 12.9 13.4
55 - 59 1,251 100.0 3.4 2.6 53.5 6.1 12.8 21.7
60 - 64 955 100.0 4.1 0.4 47.9 3.7 12.0 31.9
65+ 2,069 100.0 5.7 0.7 31.9 3.2 6.9 51.6 Source: Ghana Statistical Service, 2010 Population and Housing Census

28
3.3.3 Marital status by sex and level of education
The level of education that one attains before marriage is key to the socio-economic status of a
family and to some extent influences fertility. It is assumed that, when couples are educated they
tend to have well-planned families and leave together happily in the community. Table 3.5 shows
that 46.6 percent of the never married population 12 years and older had attained Basic School
education (Primary, Middle and JSS/JHS), while 11.1 percent had attained tertiary level
education.
Table 3.5 also shows that, the proportion of female married population (12 years and older) who
have never been to school is relatively higher than that of males (15.7 % against 6.2%).
Similarly, the proportion of divorced population with no education is higher for females (12
years and older) (19.0%) than their male counterparts (8.0%).
Table 3.5: Persons 12 years and older by sex, marital status and level of education
Sex/Marital status Number
All
levels
No
Education Basic1
Secon-
dary2
Voc/
Tech/
Comm
Post middle/
secondary
certificate/
diploma3 Tertiary
4
Both Sexes
Total 85,947 100.0 8.8 47.3 20.3 4.5 8.9 10.1
Never married 43,986 100.0 4.7 46.6 25.3 3.1 9.2 11.1
Informal/Consensual
union/Living together 3,299
100.0 9.5 58.0 17.0 4.0 7.0 4.6
Married 31,996 100.0 11.1 46.8 15.9 6.3 9.1 10.8
Separated 1,517 100.0 14.1 55.2 12.4 6.9 6.9 4.6
Divorced 2,300 100.0 16.0 54.7 11.8 6.7 7.3 3.5
Widowed 2,849 100.0 36.5 41.9 7.4 4.4 7.2 2.7
Male
Total 41,309 100.0 4.6 45.1 22.6 4.5 9.9 13.4
Never married 22,834 100.0 3.0 45.0 26.5 3.0 9.6 12.9
Informal/Consensual
union/Living together 1,643
100.0 6.1 55.8 18.6 4.7 8.5 6.3
Married 15,363 100.0 6.2 43.6 18.0 6.4 10.5 15.3
Separated 460 100.0 8.0 51.7 16.1 8.3 7.2 8.7
Divorced 635 100.0 8.0 54.8 13.9 6.6 10.1 6.6
Widowed 374 100.0 19.3 41.2 10.4 8.8 10.4 9.9
Female
Total 44,638 100.0 12.7 49.4 18.2 4.6 8.0 7.1
Never married 21,152 100.0 6.5 48.4 24.0 3.2 8.7 9.1
Informal/Consensual
union/Living together 1,656
100.0 12.8 60.1 15.4 3.3 5.4 2.9
Married 16,633 100.0 15.7 49.7 14.0 6.2 7.8 6.6
Separated 1,057 100.0 16.7 56.7 10.8 6.2 6.7 2.8
Divorced 1,665 100.0 19.0 54.7 11.1 6.7 6.3 2.3
Widowed 2,475 100.0 39.1 42.0 7.0 3.7 6.7 1.6 Source: Ghana Statistical Service, 2010 Population and Housing Census
1 Basic: Primary, Junior High School 2 Secondary: Senior Secondary School/Senior High School and Secondary Education
3 Post Middle/ Sec. Cert./Diploma: Teacher training/ College of education, Agric, Nursing, University Diploma, HND, etc.
4 Tertiary: Bachelors Degree and Post Graduate or higher

29
Table 3.5 further reveals that the proportion of male married population had attained tertiary
education is more than twice that of female married population (15.3% against 6.6%). Again, a
relatively higher proportion of females than males is observed for those in informal/Consensual
union/Living together who have no formal education (12.8% against 9.5%).
3.3.4 Marital Status and Economic Activity
Table 3.6 presents marital status of persons 12 years and older by economic activity status. The
results show that about 59.4 percent of them were employed, 4.9 percent were unemployed and
35.6 percent were economically not active. With the exception of the never married and
widowed population, the other categories have not less than 74 percent of its population who are
employed. Particularly, the married population who are 12 years and older has the highest
proportion (80.3%) belonging to the employed population.
Table 3.6: Marital status of persons 12 years and older by economic activity status
Sex/Marital Status All status
Employed
Unemployed
Economically not
active
Number Percent Number Percent Number Percent Number Percent
Total Both Sexes
Total 85,947 100.0
51,095 59.4
4,252 4.9
30,600 35.6
Never married 43,986 100.0
18,531 42.1
2,716 6.2
22,739 51.7
Informal/Consensual
union/Living together 3,299 100.0
2,612 79.2
203 6.2
484 14.7
Married 31,996 100.0
25,678 80.3
1,092 3.4
5,226 16.3
Separated 1,517 100.0
1,146 75.5
78 5.1
293 19.3
Divorced 2,300 100.0
1,718 74.7
88 3.8
494 21.5
Widowed 2,849 100.0
1,410 49.5
75 2.6
1,364 47.9
Male
Total 41,309 100.0
25,227 61.1
2,144 5.2
13,938 33.7
Never married 22,834 100.0
9,991 43.8
1,578 6.9
11,265 49.3
Informal/Consensual
union/ Living together 1,643 100.0
1,425 86.7
72 4.4
146 8.9
Married 15,363 100.0
12,820 83.4
423 2.8
2,120 13.8
Separated 460 100.0
348 75.7
29 6.3
83 18
Divorced 635 100.0
467 73.5
30 4.7
138 21.7
Widowed 374 100.0
176 47.1
12 3.2
186 49.7
Female
Total 44,638 100.0
25,868 58
2,108 4.7
16,662 37.3
Never married 21,152 100.0
8,540 40.4
1,138 5.4
11,474 54.2
Informal/Consensual
union/ Living together 1,656 100.0
1,187 71.7
131 7.9
338 20.4
Married 16,633 100.0
12,858 77.3
669 4
3,106 18.7
Separated 1,057 100.0
798 75.5
49 4.6
210 19.9
Divorced 1,665 100.0
1,251 75.1
58 3.5
356 21.4
Widowed 2,475 100.0 1,234 49.9 63 2.5 1,178 47.6
Source: Ghana Statistical Service, 2010 Population and Housing Census

30
The Table also reveals that among the various categories of the marital status, the never married
population has the highest proportion that is unemployed and economically not active (6.2 % and
51.7% respectively). This may be attributed to the youthful population in full time schooling.
For the male population, those in consensual union/ living together have relatively the highest
proportion employed (86.7%) which is slightly higher than that of married population (83.4%).
The reverse is rather the case for female population; employed (77.3%) and economically not
active (71.7%). The Table further reveals that, almost half the population who are widowed,
whether for the separate sexes or both sex, are economically not active. The information
presented in Table 3.5, confirm the general expectation that married males are supposed to be
gainfully employed because they are traditionally considered as bread winners of their families.
3.4 Nationality
Nationality is defined as the country to which a person belongs. Ghanaian nationals are classified
as Ghanaian by birth, Ghanaian by dual nationality and Ghanaian by naturalization. Table 3.7
shows that 91.6 percent of the population in the Municipality are Ghanaians by birth, 4.0 percent
had dual nationality, while 3.2 percent of the population was made up of foreigners. The
population of foreigners comprised a higher percentage of ECOWAS nationals (2.6%). The
proportion of ECOWAS nationals who are males (3.0%) is higher compared to that of their
female counterpart (2.2%). but the proportion of both male and female Africans other than
ECOWAS nationals in the Municipality was the same (0.4% each).
Table 3.7: Population by nationality and sex
Nationality
Both sexes Male Female
Number Percent Number Percent Number Percent
Total 111,926 100.0
54,271 100.0
57,655 100.0
Ghanaian by birth 102,536 91.6
49,494 91.2
53,042 92.0
Dual nationality (Ghanaian & Other) 4,470 4.0
2,157 4.0
2,313 4.0
Ghanaian by naturalization 1,327 1.2
630 1.2
697 1.2
ECOWAS 2,916 2.6
1,638 3.0
1,278 2.2
African other than ECOWAS 470 0.4
240 0.4
230 0.4
Other 207 0.2 112 0.2 95 0.2 Source: Ghana Statistical Service, 2010 Population and Housing Census
3.5 Religious Affiliation
Religion refers to the individual’s religious affiliation as reported by the respondent irrespective
of the religion of the household head or the head’s spouse or the name of the person. Table 3.8
presents population by religious affiliation and sex in the La Nkwantanang Madina Municipality.
According to the Table, majority (79.2%) of the population in the Municipality are Christians
with Pentecostal/Charismatic dominating with a proportion of 38.7 percent, followed by the
Protestants (23.0%), Catholic (9.2%) and other Christians (16.0%). The population belonging to
the Islamic religion constitute 17.5%, while Traditionalist and others makeup about one percent.
For the sexes, there are relatively higher proportions of female Christians compared with male
Christians who are members of Pentecostal/Charismatic churches (39.9% against 37.5%) and
Protestant churches (23.3% against 22.8 %). Similarly, there are slightly more males (10,010)
than females (9,611) in the Islamic religion.

31
Table 3.8: Population by religion and sex
Religion
Both sexes Male Female
Number Percent Number Percent Number Percent
Total 111,926 100.0
54,271 100.0
57,655 100.0
No religion 2,287 2.0
1,487 2.7
800 1.4
Catholic 10,311 9.2
5,222 9.6
5,089 8.8
Protestants (Anglican Lutheran etc.) 25,789 23.0
12,366 22.8
13,423 23.3
Pentecostal/Charismatic 43,349 38.7
20,352 37.5
22,997 39.9
Other Christian 9,320 8.3
4,581 8.4
4,739 8.2
Islam 19,621 17.5
9,611 17.7
10,010 17.4
Traditionalist 214 0.2
116 0.2
98 0.2
Other 1,035 0.9 536 1.0 499 0.9 Source: Ghana Statistical Service, 2010 Population and Housing Census
3.6 Literacy and Education
Literacy and Education are an important aspect of societal development and forms the
foundation of individual advancement and self-actualization. While literacy is the ability to read
and write, education is viewed as the process of acquiring knowledge, skills, values and attitudes
to fully develop individual capacities for societal wellbeing. In the 2010 PHC, questions on
literacy were posed to persons 11 years and older. Questions on education on the other hand
were posed to persons 3 years and older. The questions on education were on school attendance
(past and present), educational level attained and grade/form/class completed at that level of
education.
3.6.1 Literacy
Figure 3.2 shows that a total of 80,121 persons representing 91.3 percent of the population 11
years and older in the Municipality are literate in at least one language, while the non- literate
population constitute 8.7 percent. Five out of every 10 persons (55.4%) could read and write in
English and Ghanaian language. Also, about seven out of every 10 persons (67.6 percent) who
were 65+ could read and write in English and Ghanaian language. The population who could
read and write in both English and French, and English, French and Ghanaian language are 1.0
percent and 3.0 percent respectively. The results further show that the number of non-literate
females (5,694) is about three times more than that of the males (1,921). Similarly, female
literate population (39,876) in the Municipality is slightly less than their male counterparts
(40,245).

32
Figure 3.1: Population distribution of literacy status
Source: Ghana Statistical Service, 2010 Population and Housing Census
Table 3.9 shows the population 11 years and older who are literate in one language or another by
sex and age. With the exception of population between the ages of (11 – 14 years) which has
about half ( 50.8%) being literate in English only, the other age categories have at least 53.9
percent being literate both the are literate in English and Ghanaian languages. Particularly,
persons aged between (60- 64) years have the highest (68.9%).
Among the various languages of literacy, relatively lower proportions of population in the
various age groups are literate in both English and French only, with the least proportion of 0.5
percent belonging to (60-64) year group. The foreign migrant population in Ghana may have
accounted for the lower proportion in literacy in English and French. It is evident from the Table
that, similar characteristic of language literacy can be observed among different age groups for
each of the sexes. However, the distribution for male category are higher compared with that of
the females
For persons 65 years and older living in the district, out of a total population of 7,125 more than
half are non-literate. The high proportion of non-literate persons among this age group may be
due to sight related problem attributable to old age and majority (75.7%) of this population is
females.

33
Table 3.9: Population 11 years and older by sex, age and literacy status
Sex/Age
group
None (Not
literate)
Literate
Number Total
English
only
Ghanaian
language
only
English and
Ghanaian
language
English
and
French
English
French and
Ghanaian
Language
Both Sexes
Total 7,615 80,121 100.0 35.7 4.8 55.4 1.0 3.0
11-14 206 7,689 100.0 50.8 2.3 43.0 1.0 2.9
15-19 540 10,651 100.0 38.5 2.4 53.9 1.1 4.1
20-24 820 13,713 100.0 34.6 3.3 57.1 1.4 3.6
25-29 951 13,040 100.0 35.5 5.0 55.6 1.2 2.7
30-34 809 9,465 100.0 35.2 6.3 55.5 1.0 2.1
35-39 730 7,180 100.0 35.7 7.3 53.8 0.8 2.4
40-44 587 5,217 100.0 34.7 7.0 54.6 1.2 2.6
45-49 508 3,901 100.0 30.2 7.2 59.3 0.9 2.3
50-54 438 3,192 100.0 29.5 5.7 61.3 0.6 2.9
55-59 333 2,099 100.0 26.4 4.7 65.5 0.7 2.7
60-64 374 1,465 100.0 21.4 5.9 68.9 0.5 3.2
65+ 1,319 2,509 100.0 21.0 7.7 67.6 0.7 2.9
Male
Total 1,921 40,245 100.0 34.6 3.3 57.7 1.2 3.1
11-14 43 3,511 100.0 51.3 2.2 42.6 1.1 2.9
15-19 117 4,881 100.0 38.2 1.8 54.9 1.3 3.7
20-24 237 6,782 100.0 33.5 3.0 58.8 1.4 3.3
25-29 279 6,501 100.0 34.4 3.4 57.9 1.5 2.8
30-34 208 4,988 100.0 33.1 4.7 58.6 1.2 2.3
35-39 185 3,827 100.0 34.4 4.5 57.5 0.9 2.7
40-44 125 2,762 100.0 33.6 4.1 57.6 1.4 3.3
45-49 117 2,048 100.0 29.6 4.3 61.7 1.2 3.1
50-54 95 1,636 100.0 29.8 3.2 62.7 0.9 3.5
55-59 78 1,103 100.0 26.8 1.8 67.5 0.6 3.3
60-64 87 797 100.0 21.8 2.1 70.6 0.9 4.5
65+ 350 1,409 100.0 21.2 2.9 71.1 0.7 4.0
Female
Total 5,694 39,876 100.0 36.8 6.4 53.1 0.9 2.8
11-14 163 4,178 100.0 50.4 2.4 43.3 1.0 2.9
15-19 423 5,770 100.0 38.8 2.9 52.9 0.9 4.5
20-24 583 6,931 100.0 35.8 3.7 55.5 1.3 3.8
25-29 672 6,539 100.0 36.7 6.7 53.2 0.9 2.6
30-34 601 4,477 100.0 37.5 8.1 51.9 0.7 1.9
35-39 545 3,353 100.0 37.1 10.5 49.6 0.7 2.1
40-44 462 2,455 100.0 35.8 10.2 51.2 0.9 1.8
45-49 391 1,853 100.0 30.8 10.4 56.6 0.7 1.5
50-54 343 1,556 100.0 29.2 8.4 60.0 0.2 2.2
55-59 255 996 100.0 26.0 7.9 63.4 0.7 2.0
60-64 287 668 100.0 21.0 10.5 66.8 0.1 1.6
65+ 969 1,100 100.0 20.8 13.9 63.1 0.6 1.5 Source: Ghana Statistical Service, 2010 Population and Housing Census

34
3.6.2 Level of Education
Table 3.10 provides information on population 3 years and older by level of education, school
attendance and sex. Out of the 38,150 persons enumerated as currently in school, 36.9 percent
are at the primary level, 16.9 percent were at the JSS/JHS level while 13.7 percent are at the
Senior High School level. With regards to those who have been to school in the past (57,731),
almost on-quarter (24.0%) had attained JSS/JHS level of education, while about one-fifth
(18.4%) have Middle school certificate, SSS/SHS (15.1%) and Tertiary (16.0%).
For the sexes, though there is an even distribution of persons who are currently in school, with
the exception of nursery, kindergarten and SHS the proportions of female population for the
various levels of education are slightly higher than that of the males. Particularly, 38.1 percent of
the females who are currently in school are in the primary school, while 35.7 percent is the case
for the males. In terms of information on past school attendance, the record is again in favour of
females, dominating at all levels of education except at the secondary level (SHS/SSS). For
instance, the results show that more than one-quarter (25.7% ) of the females ended their
education at the JHS/JSS levels, while for the males (22.3%). than (Table 3.9).

35
Table 3.10: Population 3 years and older by level of education, school attendance and sex
Level of education
Currently attending Attended in the past
Both sexes
Male
Female
Both sexes
Male
Female
Number Percent Number Percent Number Percent Number Percent Number Percent Number Percent
Total 38,150 100.0
19,053 100.0
19,097 100.0
57,731 100.0
29,082 100.0
28,649 100.0
Nursery 2,459 6.4
1,248 6.6
1,211 6.3
- 0.0
- 0.0
- 0.0
Kindergarten 4,098 10.7
2,117 11.1
1,981 10.4
- 0.0
- 0.0
- 0.0
Primary 14,093 36.9
6,808 35.7
7,285 38.1
6,603 11.4
2,473 8.5
4,130 14.4
JSS/JHS 6,458 16.9
3,081 16.2
3,377 17.7
13,841 24.0
6,475 22.3
7,366 25.7
Middle - 0.0
- 0.0
- 0.0
10,618 18.4
5,152 17.7
5,466 19.1
SSS/SHS 5,223 13.7
2,621 13.8
2,602 13.6
8,715 15.1
4,679 16.1
4,036 14.1
Secondary - 0.0
- 0.0
- 0.0
3,510 6.1
2,021 6.9
1,489 5.2
Vocational/Technical/
Commercial 262 0.7
122 0.6
140 0.7
3,633 6.3
1,734 6.0
1,899 6.6
Post middle/
secondary/Certificate 601 1.6
228 1.2
373 2.0
1,582 2.7
684 2.4
898 3.1
Tertiary 4,956 13.0 2,828 14.8 2,128 11.1 9,229 16.0 5,864 20.2 3,365 11.7
Source: Ghana Statistical Service, 2010 Population and Housing Census

36
3.6.3 School Attendance
Figure 3.3 displays school attendance by sex of the population in the Municipality. Generally
school attendance is in favour of the male population in the Municipality. For those who are in
school, the proportion of the males (37.7%) is higher than that of the females (35.4%). The same
characteristic is observed with the population who has been to school in the past, (57.6% against
53.2%). A relatively higher proportion of the female population than that of the male population
in the Municipality has never been to school in the past (11.4% against4.7%).
Figure 3.3: School attendance by sex
Source: Ghana Statistical Service, 2010 Population and Housing Census

37
CHAPTER FOUR
ECONOMIC CHARACTERISTICS
4.1 Introduction
The economic characteristics of a society are essential indicators of the level of economic
development of the area and people’s involvement in economic activities. This chapter looks at
the economic characteristics of the La Nkwantanang Madina Municipal as per the 2010 PHC.
The characteristics considered are economic activity status, occupation, industry, employment
status and employment sector of person’s aged 15 years and older.
4.2 Economic Activity Status
This section presents results on persons 15 years and older who were engaged in any legal
economic activity for pay (cash or kind) or profit or family gain during the seven days preceding
census night. Economically active are all persons (i) who worked for pay or profit or family gain
during the seven days preceding the census or (ii) who did not work but had jobs to return to,
such as those on leave with or without pay, temporarily ill persons, temporarily laid off persons
or (iii) who did not work during the reference period, but were actively looking for work (i.e. the
unemployed). On the other hand, economically not active are homemakers (persons who
engaged in household duties without pay), students, the aged, pensioners and persons with
disability (GSS, 2012).
4.2.1 Economic Activity Status by Sex
Table 4.1 shows that a total of 79,841 constitute the population 15 years or older living in the
municipality. Out of this total, 68.9 per cent are economically active, while 31.1 percent
constitute economically not active population.
Of the economically active population, 92.3 percent are employed while 7.7 percent are
unemployed. In the Municipality, the proportion of the females (92.4%) that are employed is
slightly higher than that of the males (92.2%). Furthermore, Table 4.1 reveals that more than half
of the economically not active population are in full time education (56.7 %) and the disabled or
sick constituted the least percentage (3.7 %). The large number of economically not active
population in full time education means that the Municipality has the potential human capital for
its future socio-economic development.

38
Table 4.1: Population 15 years and older by activity status and sex
Activity status
Total Male Female
Number Percent Number Percent Number Percent
Total 79,841 100.0
38,612 100.0
41,229 100.0
Economically active 55,012 68.9
27,293 70.7
27,719 67.2
Employed 50,770 92.3
25,154 92.2
25,616 92.4
Worked 49,049 96.6
24,438 97.2
24,611 96.1
Did not work but had job to go
back to 1,625 3.2
668 2.7
957 3.7
Did voluntary work without pay 96 0.2
48 0.2
48 0.2
Unemployed 4,242 7.7
2,139 7.8
2,103 7.6
Worked before, seeking work and
available 1,742 41.1
823 38.5
919 43.7
Seeking work for the first time and
available 2,500 58.9
1,316 61.5
1,184 56.3
Economically not active 24,829 31.1
11,319 29.3
13,510 32.8
Did home duties (household chore) 4,456 17.9
1,098 9.7
3,358 24.9
Full time education 14,090 56.7
7,236 63.9
6,854 50.7
Pensioner/Retired 1,430 5.8
912 8.1
518 3.8
Disabled/Sick 911 3.7
497 4.4
414 3.1
Too old/young 1,769 7.1
496 4.4
1,273 9.4
Other 2,173 8.8 1,080 9.5 1,093 8.1 Source: Ghana Statistical Service, 2010 Population and Housing Census
Table 4.2 shows the population 15years and older by age group, sex and activity status in the
Municipality. The data for both sexes reveal that, the employment levels among the various age
groups exhibit a normal distribution. The proportion of persons employed among the various age
groups is observed to increase from 18.1 percent (for 15-19 years) and peaks at 89.0 percent (for
40-44 years) then decreases gradually to 32.8 percent (for persons 65 years and older).
The table again shows that, unemployment levels are generally low among the different age
groups. However, the highest unemployment rate of 8.7 percent exists among the (20-24) year
age-group. For the population economically not active, higher proportions are concentrated
within the younger ages of 15-19 years (78.9%) and 20-24 years (44.4%) and also among the
older ages of 65+ years (66.1%).
Similar patterns are observed for the sexes among the different age groups, with the male group
having higher levels of the various activity statuses than their female counterpart.

39
Table 4.2: Population 15 years and older by sex, age and activity status
Sex/Age
group All status
Employed
Unemployed
Economically not
active
Number Percent Number Percent Number Percent Number Percent
Both Sexes
Total 79,841 100.0
50,770 63.6
4,242 5.3
24,829 31.1
15-19 11,191 100.0
2,031 18.1
335 3.0
8,825 78.9
20-24 14,533 100.0
6,813 46.9
1,261 8.7
6,459 44.4
25-29 13,991 100.0
10,212 73.0
1,206 8.6
2,573 18.4
30-34 10,274 100.0
8,622 83.9
545 5.3
1,107 10.8
35-39 7,910 100.0
6,940 87.7
290 3.7
680 8.6
40-44 5,804 100.0
5,164 89.0
178 3.1
462 8.0
45-49 4,409 100.0
3,861 87.6
132 3.0
416 9.4
50-54 3,630 100.0
2,993 82.5
106 2.9
531 14.6
55-59 2,432 100.0
1,884 77.5
70 2.9
478 19.7
60-64 1,839 100.0
996 54.2
77 4.2
766 41.7
65+ 3,828 100.0
1,254 32.8
42 1.1
2,532 66.1
Male
Total 38,612 100.0
25,154 65.1
2,139 5.5
11,319 29.3
15-19 4,998 100.0
728 14.6
145 2.9
4,125 82.5
20-24 7,019 100.0
3,192 45.5
616 8.8
3,211 45.7
25-29 6,780 100.0
4,902 72.3
646 9.5
1,232 18.2
30-34 5,196 100.0
4,474 86.1
270 5.2
452 8.7
35-39 4,012 100.0
3,585 89.4
157 3.9
270 6.7
40-44 2,887 100.0
2,647 91.7
90 3.1
150 5.2
45-49 2,165 100.0
1,936 89.4
76 3.5
153 7.1
50-54 1,731 100.0
1,519 87.8
49 2.8
163 9.4
55-59 1,181 100.0
988 83.7
37 3.1
156 13.2
60-64 884 100.0
542 61.3
35 4.0
307 34.7
65+ 1,759 100.0
641 36.4
18 1.0
1,100 62.5
Female
Total 41,229 100.0
25,616 62.1
2,103 5.1
13,510 32.8
15-19 6,193 100.0
1,303 21.0
190 3.1
4,700 75.9
20-24 7,514 100.0
3,621 48.2
645 8.6
3,248 43.2
25-29 7,211 100.0
5,310 73.6
560 7.8
1,341 18.6
30-34 5,078 100.0
4,148 81.7
275 5.4
655 12.9
35-39 3,898 100.0
3,355 86.1
133 3.4
410 10.5
40-44 2,917 100.0
2,517 86.3
88 3.0
312 10.7
45-49 2,244 100.0
1,925 85.8
56 2.5
263 11.7
50-54 1,899 100.0
1,474 77.6
57 3.0
368 19.4
55-59 1,251 100.0
896 71.6
33 2.6
322 25.7
60-64 955 100.0
454 47.5
42 4.4
459 48.1
65+ 2,069 100.0 613 29.6 24 1.2 1,432 69.2 Source: Ghana Statistical Service, 2010 Population and Housing Census

40
4.3 Occupation
Occupation refers to the type of work a person is engaged in or a person’s principal or usual
work or business especially as a means of earning a living. In the 2010 PHC, occupation was
asked only of persons who worked for at least one hour during the seven days before the census
night, and those who did not work but had a job to return to, as well as those who were
unemployed but had worked before. All persons who worked during the seven days before the
census night were classified by the kind of work they were engaged in. The emphasis was on the
work the person did during the reference period.
Table 4.3 shows the employed population 15 years and older by occupation in the Municipality.
The results indicate that more than one-third (35.5 %) of the population (of both sexes) was
engaged in service and sales work, especially females (51.8 %). This was expected because
traditionally, such occupations are associated with females. Higher proportions of males than
females are engaged in craft and related trades (28.3% and 15.7% respectively) and plant and
machine operators and assemblers (14.3% and 0.4% respectively). This shows some level of
gender stereotype in occupation in the Municipality. Table 4.3 also reveals that total population
employed in skilled agriculture, forestry and fisheries was the least (1.8%).
Table 4.3: Employed population 15 years and older by occupation and sex
Occupation
Both sexes Male Female
Number Percent Number Percent Number Percent
Total 50,770 100.0
25,154 100.0
25,616 100.0
Managers 2,897 5.7
1,584 6.3
1,313 5.1
Professionals 5,348 10.5
3,254 12.9
2,094 8.2
Technicians and associate professionals 2,311 4.6
1,736 6.9
575 2.2
Clerical support workers 1,964 3.9
960 3.8
1,004 3.9
Service and sales workers 18,013 35.5
4,743 18.9
13,270 51.8
Skilled agricultural forestry and fishery
workers 921 1.8
561 2.2
360 1.4
Craft and related trades workers 11,147 22.0
7,115 28.3
4,032 15.7
Plant and machine operators and assemblers 3,716 7.3
3,607 14.3
109 0.4
Elementary occupations 4,282 8.4
1,478 5.9
2,804 10.9
Other occupations 171 0.3 116 0.5 55 0.2 Source: Ghana Statistical Service, 2010 Population and Housing Census
4.4 Industry
In the 2010 PHC, information on industry was collected on the main products or services
produced during the seven days before the census night. Table 4.4 shows employed population
15 years and older by industry and sex. Majority (29.2%) of persons 15 years and older who are
employed are engaged in wholesale and retail, repair of motor vehicles and motor cycles
category, particularly females (38.1%), indicating that females prefer working in those
industries. A higher proportion of males (13.6 %) working the construction industry compared to
the number of females who are involve (0.5 %). This is expected because jobs involving
construction require much energy and are often regarded in most societies as male related
occupations (Yendaw et al., 2013). In general, the informal sector was predominant in the
Municipality.

41
Table 4.4: Employed population 15 years and older by Industry and sex
Industry
Both sexes Male Female
Number Percent Number Percent Number Percent
Total 50,770 100.0
25,154 100.0
25,616 100.0
Agriculture forestry and fishing 1,220 2.4
762 3.0
458 1.8
Mining and quarrying 141 0.3
108 0.4
33 0.1
Manufacturing 7,133 14.0
3,099 12.3
4,034 15.7
Electricity gas stream and air conditioning
supply 188 0.4
149 0.6
39 0.2
Water supply; sewerage waste management
and remediation activities 212 0.4
152 0.6
60 0.2
Construction 3,529 7.0
3,413 13.6
116 0.5
Wholesale and retail; repair of motor vehicles
and motorcycles 14,824 29.2
5,056 20.1
9,768 38.1
Transportation and storage 3,292 6.5
3,081 12.2
211 0.8
Accommodation and food service activities 4,415 8.7
740 2.9
3,675 14.3
Information and communication 806 1.6
586 2.3
220 0.9
Financial and insurance activities 1,153 2.3
704 2.8
449 1.8
Real estate activities 100 0.2
90 0.4
10 0.0
Professional scientific and technical activities 1,166 2.3
823 3.3
343 1.3
Administrative and support service activities 824 1.6
663 2.6
161 0.6
Public administration and defence;
compulsory social security 1,722 3.4
1,193 4.7
529 2.1
Education 3,068 6.0
1,568 6.2
1,500 5.9
Human health and social work activities 1,397 2.8
617 2.5
780 3.0
Arts entertainment and recreation 639 1.3
552 2.2
87 0.3
Other service activities 4,225 8.3
1,481 5.9
2,744 10.7
Activities of households as employers;
undifferentiated goods and services -
producing activities of households for own use
611 1.2
248 1.0
363 1.4
Activities of extraterritorial organizations and
bodies 105 0.2 69 0.3 36 0.1
Source: Ghana Statistical Service, 2010 Population and Housing Census
4.5 Employment Status
Employment status referred to the position of a person in the establishment where he/she
currently works or previously worked. In the 2010 PHC, eight employment status categories
were provided: employee, self-employed without employees, self-employed with employees,
casual worker, contributing family worker, apprentice and domestic employee (house-help).
From Table 4.5, majority (43.4%) of the working population constitute self-employed without
employees, followed by employees (38.7%). For the sexes, the proportion male working
population belonging to the employee category is relatively higher than that of their female
counterpart (50.6% against 27.1%). For the self-employed without employees, 55.0 percent are

42
females while 31.6 percent are males, signifying that more females are engaged in petty trading
where employees are not needed. On self-employed with employee (s), the proportion is higher
among the males (9.0%) than the females (7.9%). The results further show a higher percentage of
the females (3.6%) than the males (1.4%) in the contributing family worker category. In the same
way, a higher proportion of the females (0.9%) than the males (0.5%) are engaged as domestic
employees (House helps). This is expected because females are mostly associated with family or
domestic work (Tanle and Awusabo-Asare, 2007).
Table 4.5: Employed population 15 years and older by employment status and sex
Employment Sector
Both sexes Male Female
Number Percent Number Percent Number Percent
Total 50,770 100
25,154 100
25,616 100
Employee 19,667 38.7
12,717 50.6
6,950 27.1
Self-employed without employee(s) 22,029 43.4
7,937 31.6
14,092 55
Self-employed with employee(s) 4,293 8.5
2,262 9
2,031 7.9
Casual worker 1,039 2
681 2.7
358 1.4
Contributing family worker 1,286 2.5
353 1.4
933 3.6
Apprentice 1,989 3.9
1,004 4
985 3.8
Domestic employee (House help) 365 0.7
133 0.5
232 0.9
Other 102 0.2 67 0.3 35 0.1 Source: Ghana Statistical Service, 2010 Population and Housing Census
4.6 Employment Sector
Table 4.6 reveals that in the Municipality, majority (69.7%) of the working population are
engaged in the private informal sector, while 17.6 percent are engaged in the private formal
sector with the least are engaged in semi-parastatal (0.3%). Higher proportion of the females
(78.8%) compared with the males (60.5%) are employed in the private informal sector. This
could be due to inadequate employment opportunities in the formal sector coupled with the fact
that some people had low educational and professional training that did not meet the requisite
qualifications for employment in the formal sector, particularly females (Tanle and Awusabo-
Asare, 2007). The proportion of males (13.5%) employed in the public sector is far higher than
that of the females (8.7%). This could be attributed to the fact that generally illiteracy level is
higher among females than males in Ghana (GSS, 2012).
Table 4.6: Employed population 15 years and older by employment sector and sex
Employment Sector Both sexes Male Female
Number Percent Number Percent Number Percent
Total 50,770 100.0
25,154 100.0
25,616 100.0
Public (Government) 5,626 11.1
3,401 13.5
2,225 8.7
Private Formal 8,947 17.6
5,970 23.7
2,977 11.6
Private Informal 35,412 69.7
15,219 60.5
20,193 78.8
Semi-Public/Parastatal 89 0.2
60 0.2
29 0.1
NGOs (Local and International) 586 1.2
421 1.7
165 0.6
Other International Organisations 110 0.2 83 0.3 27 0.1 Source: Ghana Statistical Service, 2010 Population and Housing Census

43
CHAPTER FIVE
INFORMATION COMMUNICATION TECHNOLOGY
5.1 Introduction
Information Communication Technologies (ICT) have become important tools in the daily
activities of the people of La Nkwantanang Madina Municipality. In recent times, the
Municipality, like the national level, has witnessed a rapid increase in ICT. The use of mobile
phone, Internet and desktop computers by households and businesses was increasing because
ICT infrastructure had improved significantly in the Municipality. Almost all the mobile phone
companies, namely MTN, Vodafone, Tigo, Airtel etc were present in the La Nkwantanang
Madina Municipality.
It is for this reason that for the first time in the country, the 2010 PHC collected data on access to
and use of ICT by individuals and households. Information was sought from persons 12 years
and older on access to and use of mobile phones, Internet facilities at home, in an Internet café,
on mobile phones or other devices. Households with desktops/laptop computers, and access to
fixed telephone lines were also determined. This chapter therefore analyses access and use of
these ICT technologies/facilities by age and sex.
5.2 Ownership of Mobile Phones
During the 2010 PHC, data on both individuals aged 12 years and older and households was
collected in order to assess ownership and use of mobile phones. A total of 85,947 persons who
are 12 years or older live in the Municipality (Table 5.1). Out of this total, 78.1 percent have
mobile phone. Furthermore, ownership of mobile phone by sex reveals that a relatively higher
proportion of the male population compared to the female population who are 12 years or older
have mobile phone (82.0% against 74.4%).
Table 5.1: Population 12 years and older by mobile phone ownership, Internet facility
usage, and sex
Sex
Population 12
years and older
Population
having mobile
phone
Population using
internet facility
Number Percent Number Percent Number Percent
Total 85,947 100.0
67,096 78.1
21,376 24.9
Male 41,309 100.0
33,877 82.0
13,025 31.5
Female 44,638 100.0 33,219 74.4 8,351 18.7 Source: Ghana Statistical Service, 2010 Population and Housing Census

44
5.3 Use of Internet
Persons using internet facility refers to those who had access to internet facility at home, internet
café, and mobile phone or by other mobile devices. Internet access is assumed not to be only via
computer but also by mobile phone, game machine and digital televisions.
From Table 5.1, about one-quarter (24.9 %) of the population 12 years or older in the La
Nkwantanang Madina Municipality use Internet facilities compared to a lower percentage of
18.6 percent in the region. The proportion of the male population (32.0%) that use internet is
higher than that of the female population (18.7%). This might be due to the fact that males were
more economically empowered than females (GSS, 2012).
5.4 Household Ownership of Fixed Telephone Lines
Despite the widespread use of the mobile phone, fixed line telephones remained important,
particularly at workplaces and parts of the country where mobile phone network access was poor
or non-existent. Table 5.2 shows that there are 28,871 households in the Municipality, of which
5.6 percent own fixed telephone lines which is relatively lower compared to the regional average
(43.3%). The proportion of male-headed households (5.8%) that are connected to fixed telephone
lines in the Municipality is slightly higher than their female counterparts (5.2%).
Table 5.2: Households having desktop/laptop computers and fixed telephone lines by sex
Sex of
household
head
Number of
households
Households having
desktop/laptop
computers
Households
having fixed
telephone lines
Number Percent Number Percent Number Percent
Total 28,871 100.0
6,592 22.8
1,626 5.6
Male 19,094 100.0
4,832 25.3
1,115 5.8
Female 9,777 100.0 1,760 18 511 5.2 Source: Ghana Statistical Service, 2010 Population and Housing Census
5.5 Household ownership of Desktop/Laptop computer
From Table 5.3, an average of 22.8 percent of the total number of households own at least a
laptop or desktop computer in the Municipality, and this is relatively higher compared to the
regional figure (17.0%). Again, male-headed households have a higher proportion (25.3 %)
relative to the female-headed households (18.0 %).

45
CHAPTER SIX
DISABILITY
6.1 Introduction
Persons with disabilities (PWD) have been defined as those who are unable to or are restricted in
the performance of specific tasks/activities due to loss of function of some part of the body as a
result of impairment or malformation (Ghana Statistical Service, 2012). Governments over the
years have formulated policies aimed at creating a better livelihood and opportunities for persons
with disabilities. This chapter discusses the characteristics of population with disability, types of
disability, distribution by type of locality, disability and activity and disability, education and
literacy for PWDs within the La Nkwantanang Madina Municipality.
6.2 Types of Disability
Table 6.1, shows the distribution of PWDs over the different types of disabilities in the
Municipality. Of all the cases of disability, sight impairment constitutes the highest percentage
(42.1%) with more than half being females (55.5%). Also, the proportion of persons living with
physical disability (22.9%) is quite significant. This is followed by intellectual (19.8%)
disability. Speech impairment (11.2%) has the least proportion of PWDs in the Municipality. In
general, with the exception of Speech and Physical impairment, the distribution of male PWDs
over the different types of disabilities exhibits higher proportions compared to that of the female
PWDs.
6.3 Population with Disability
It should be noted that, data on disability is a multiple response data and therefore total types of
disability will not produce population with disability. Table 6.1 shows that, there are 3,068
persons with disability (PWD) accounting for 2.7 percent of the entire population of La
Nkwantanang Madina Municipality. Of this total, about 52.0 percent are females while 48.0
percent are males. Similarly, the proportion of female population that are PWDs is slightly
higher than that of the male population (2.8% against 2.7%).
Table 6.1: Population by type of locality, disability type and sex
Type of disability
Both sexes
Male
Female
Number Percent Number Percent Number Percent
Total 111,926 100.0
54,271 100.0
57,655 100.0
No disability 108,858 97.3
52,790 97.3
56,068 97.2
With a disability 3,068 2.7
1,481 2.7
1,587 2.8
Sight 1,293 42.1
575 38.8
718 45.2
Hearing 348 11.3
176 11.9
172 10.8
Speech 343 11.2
184 12.4
159 10.0
Physical 703 22.9
306 20.7
397 25
Intellectual 608 19.8
334 22.6
274 17.3
Emotional 445 14.5
215 14.5
230 14.5
Other 349 11.4 167 11.3 182 11.5

46
6.4 Distribution by Type of Locality and sex
The locality of residence of persons with disability has impact on their ability to access social
services. This is particularly critical in Ghana, where most of the social service agencies are
concentrated in the urban areas. As shown in Table 6.2, disability varies by locality of residence
in the Municipality. Overall, the table indicates that the population of PWDs living in urban
localities (2,496) is almost five times the population of PWDs living in the rural localities (572).
The distribution of PWDs over the types of disabilities varies at the locality. While sight
impairment (47.6%) is the commonest type of disability in the urban communities, intellectual
challenge is rather the case in the rural communities (52.6%). However, in the urban areas,
higher proportion of female PWDs suffer from sight impairment compared to their male
counterparts (49.3% against 45.4%). The reverse is the case in the rural, as male PWDs dominate
in the commonest disability (intellectual) (56.9% against 46.3%). The high proportion of PWDs
in the urban localities of the Municipality may be attributable to lack of economic opportunities
in the rural areas, giving rise to a syndrome that motivate PWDs to beg for arms rather than
being involved in economic ventures.
Table 6.2: Population by type of locality, disability type and sex
Type of disability
Both sexes Male Female
Number Percent Number Percent Number Percent
Urban
Total 93,987 100.0
45,400 100.0
48,587 100.0
No disability 91,491 97.3
44,262 97.5
47,229 97.2
With a disability 2,496 2.7
1,138 2.5
1,358 2.8
Sight 1,187 47.6
517 45.4
670 49.3
Hearing 313 12.5
153 13.4
160 11.8
Speech 291 11.7
150 13.2
141 10.4
Physical 612 24.5
261 22.9
351 25.8
Intellectual 307 12.3
139 12.2
168 12.4
Emotional 408 16.3
195 17.1
213 15.7
Other 285 11.4
130 11.4
155 11.4
Rural
Total 17,939 100.0
8,871 100.0
9,068 100.0
No disability 17,367 96.8
8,528 96.1
8,839 97.5
With a disability 572 3.2
343 3.9
229 2.5
Sight 106 18.5
58 16.9
48 21.0
Hearing 35 6.1
23 6.7
12 5.2
Speech 52 9.1
34 9.9
18 7.9
Physical 91 15.9
45 13.1
46 20.1
Intellectual 301 52.6
195 56.9
106 46.3
Emotional 37 6.5
20 5.8
17 7.4
Other 64 11.2 37 10.8 27 11.8 Source: Ghana Statistical Service, 2010 Population and Housing Census
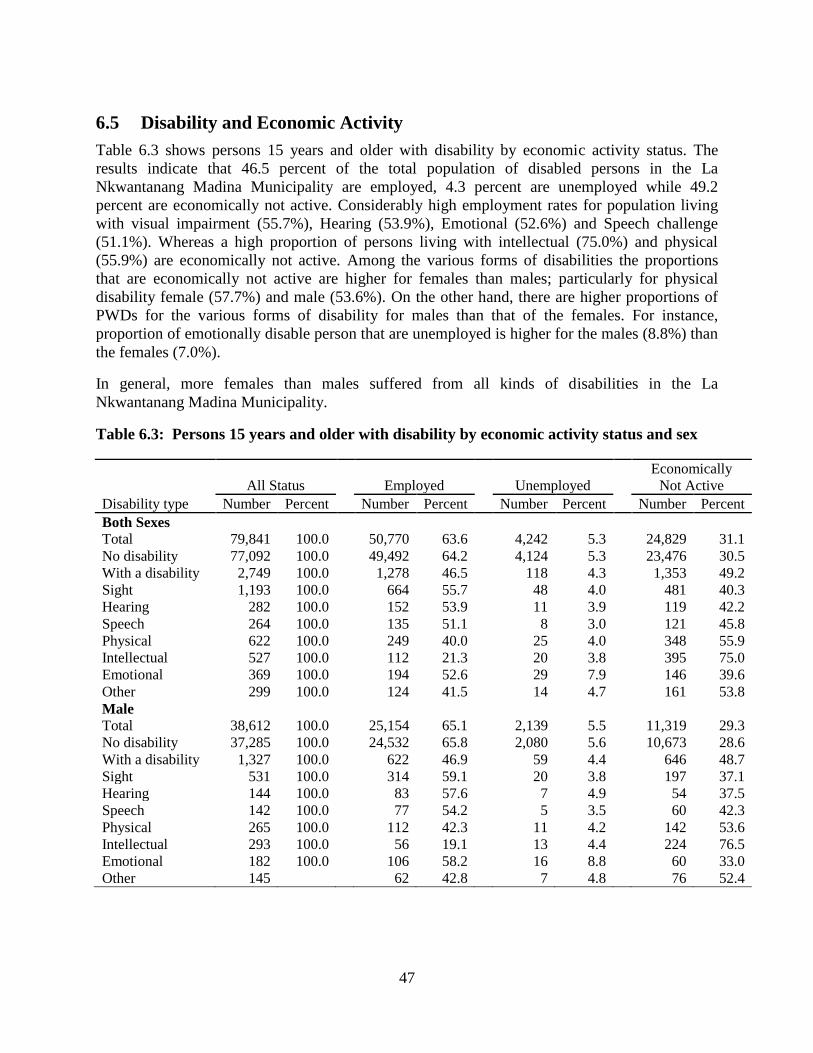
47
6.5 Disability and Economic Activity
Table 6.3 shows persons 15 years and older with disability by economic activity status. The
results indicate that 46.5 percent of the total population of disabled persons in the La
Nkwantanang Madina Municipality are employed, 4.3 percent are unemployed while 49.2
percent are economically not active. Considerably high employment rates for population living
with visual impairment (55.7%), Hearing (53.9%), Emotional (52.6%) and Speech challenge
(51.1%). Whereas a high proportion of persons living with intellectual (75.0%) and physical
(55.9%) are economically not active. Among the various forms of disabilities the proportions
that are economically not active are higher for females than males; particularly for physical
disability female (57.7%) and male (53.6%). On the other hand, there are higher proportions of
PWDs for the various forms of disability for males than that of the females. For instance,
proportion of emotionally disable person that are unemployed is higher for the males (8.8%) than
the females (7.0%).
In general, more females than males suffered from all kinds of disabilities in the La
Nkwantanang Madina Municipality.
Table 6.3: Persons 15 years and older with disability by economic activity status and sex
Disability type
All Status
Employed
Unemployed
Economically
Not Active
Number Percent Number Percent Number Percent Number Percent
Both Sexes
Total 79,841 100.0
50,770 63.6
4,242 5.3
24,829 31.1
No disability 77,092 100.0
49,492 64.2
4,124 5.3
23,476 30.5
With a disability 2,749 100.0
1,278 46.5
118 4.3
1,353 49.2
Sight 1,193 100.0
664 55.7
48 4.0
481 40.3
Hearing 282 100.0
152 53.9
11 3.9
119 42.2
Speech 264 100.0
135 51.1
8 3.0
121 45.8
Physical 622 100.0
249 40.0
25 4.0
348 55.9
Intellectual 527 100.0
112 21.3
20 3.8
395 75.0
Emotional 369 100.0
194 52.6
29 7.9
146 39.6
Other 299 100.0
124 41.5
14 4.7
161 53.8
Male
Total 38,612 100.0
25,154 65.1
2,139 5.5
11,319 29.3
No disability 37,285 100.0
24,532 65.8
2,080 5.6
10,673 28.6
With a disability 1,327 100.0
622 46.9
59 4.4
646 48.7
Sight 531 100.0
314 59.1
20 3.8
197 37.1
Hearing 144 100.0
83 57.6
7 4.9
54 37.5
Speech 142 100.0
77 54.2
5 3.5
60 42.3
Physical 265 100.0
112 42.3
11 4.2
142 53.6
Intellectual 293 100.0
56 19.1
13 4.4
224 76.5
Emotional 182 100.0
106 58.2
16 8.8
60 33.0
Other 145
62 42.8
7 4.8
76 52.4

48
Table 6.3: Persons 15 years and older with disability by economic activity status and sex
(Cont’d)
Disability type
All Status
Employed
Unemployed
Economically
Not Active
Number Percent Number Percent Number Percent Number Percent
Female
Total 41,229 100.0
25,616 62.1
2,103 5.1
13,510 32.8
No disability 39,807 100.0
24,960 62.7
2,044 5.1
12,803 32.2
With a disability 1,422 100.0
656 46.1
59 4.1
707 49.7
Sight 662 100.0
350 52.9
28 4.2
284 42.9
Hearing 138 100.0
69 50.0
4 2.9
65 47.1
Speech 122 100.0
58 47.5
3 2.5
61 50.0
Physical 357 100.0
137 38.4
14 3.9
206 57.7
Intellectual 234 100.0
56 23.9
7 3.0
171 73.1
Emotional 187 100.0
88 47.1
13 7.0
86 46.0
Other 154 100.0 62 40.3 7 4.5 85 55.2 Source: Ghana Statistical Service, 2010 Population and Housing Census
6.6 Disability, Education and Literacy
Educational status is generally low in the population with disability in the region (GSS, 2012),
but the case is different in the La Nkwantanang Madina Municipality. The table shows that
3,010 persons constituting 2.9 percent of population 3 years and older in the Municipality are
PWDs. Out of this total, 18.0 percent has never attended school, with a greater proportion of
them being females (67.8%). Again, majority (45.8%) has basic school level certificate, followed
by Secondary level certificate and higher (34.8%), and Primary level (1.4%). The general
educational status among the disabled population in the district is very high. Table 6.3 indicates
the educational level attained by PWDs 3 years and older in the Municipality. Among the PWDs,
majority of those who have attained higher levels of education belong to the sight and physical
impairments. Particularly, over 100 sight impaired persons have had either post-secondary (97
persons) or bachelor degree (12 persons) or postgraduate (6 persons).
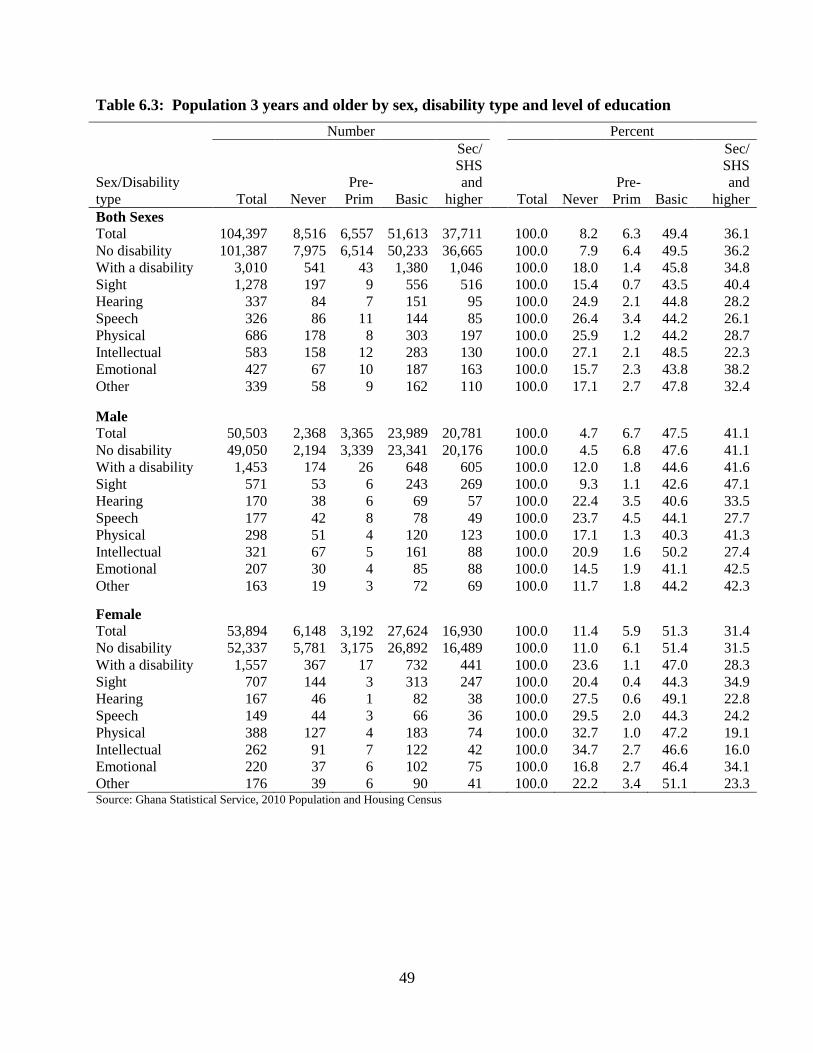
49
Table 6.3: Population 3 years and older by sex, disability type and level of education
Sex/Disability
type
Number Percent
Total Never
Pre-
Prim Basic
Sec/
SHS
and
higher Total Never
Pre-
Prim Basic
Sec/
SHS
and
higher
Both Sexes
Total 104,397 8,516 6,557 51,613 37,711
100.0 8.2 6.3 49.4 36.1
No disability 101,387 7,975 6,514 50,233 36,665
100.0 7.9 6.4 49.5 36.2
With a disability 3,010 541 43 1,380 1,046
100.0 18.0 1.4 45.8 34.8
Sight 1,278 197 9 556 516
100.0 15.4 0.7 43.5 40.4
Hearing 337 84 7 151 95
100.0 24.9 2.1 44.8 28.2
Speech 326 86 11 144 85
100.0 26.4 3.4 44.2 26.1
Physical 686 178 8 303 197
100.0 25.9 1.2 44.2 28.7
Intellectual 583 158 12 283 130
100.0 27.1 2.1 48.5 22.3
Emotional 427 67 10 187 163
100.0 15.7 2.3 43.8 38.2
Other 339 58 9 162 110
100.0 17.1 2.7 47.8 32.4
Male
Total 50,503 2,368 3,365 23,989 20,781
100.0 4.7 6.7 47.5 41.1
No disability 49,050 2,194 3,339 23,341 20,176
100.0 4.5 6.8 47.6 41.1
With a disability 1,453 174 26 648 605
100.0 12.0 1.8 44.6 41.6
Sight 571 53 6 243 269
100.0 9.3 1.1 42.6 47.1
Hearing 170 38 6 69 57
100.0 22.4 3.5 40.6 33.5
Speech 177 42 8 78 49
100.0 23.7 4.5 44.1 27.7
Physical 298 51 4 120 123
100.0 17.1 1.3 40.3 41.3
Intellectual 321 67 5 161 88
100.0 20.9 1.6 50.2 27.4
Emotional 207 30 4 85 88
100.0 14.5 1.9 41.1 42.5
Other 163 19 3 72 69
100.0 11.7 1.8 44.2 42.3
Female
Total 53,894 6,148 3,192 27,624 16,930
100.0 11.4 5.9 51.3 31.4
No disability 52,337 5,781 3,175 26,892 16,489
100.0 11.0 6.1 51.4 31.5
With a disability 1,557 367 17 732 441
100.0 23.6 1.1 47.0 28.3
Sight 707 144 3 313 247
100.0 20.4 0.4 44.3 34.9
Hearing 167 46 1 82 38
100.0 27.5 0.6 49.1 22.8
Speech 149 44 3 66 36
100.0 29.5 2.0 44.3 24.2
Physical 388 127 4 183 74
100.0 32.7 1.0 47.2 19.1
Intellectual 262 91 7 122 42
100.0 34.7 2.7 46.6 16.0
Emotional 220 37 6 102 75
100.0 16.8 2.7 46.4 34.1
Other 176 39 6 90 41 100.0 22.2 3.4 51.1 23.3 Source: Ghana Statistical Service, 2010 Population and Housing Census

50
CHAPTER SEVEN
AGRICULTURAL ACTIVITIES
7.1 Introduction
Ghana’s economy is regarded as agrarian, largely due to the sector’s contribution to Gross
Domestic Product (GDP), labour absorption and foreign exchange earnings. The contribution of
agriculture to foreign exchange earnings averaged 45 percent in the 1990s but dropped to 40
percent in the 2000s (ISSER 2000, 2011). The sector’s contribution to GDP also declined from
over 40 percent in the 1990s to 30 percent in the 2000s (ISSER, 2000, 2011). The objective of
this chapter is to analyze households in agriculture and type of farming activities in the La
Nkwantanang Madina Municipality. The census data analyzed and discussed in this chapter on
agricultural activity include households who are engaged in agricultural activities by locality
(rural/urban), types of crops cultivated, tree planting, rearing of livestock and breeding of fish.
7.2 Households in Agriculture
The 2010 PHC defines an Agricultural household as a household having at least a member
engaged in any type of agricultural activities such as crop farming, tree growing, livestock
rearing and aquaculture. Table 7.1 shows the distribution of agricultural households by locality
of residence. There are 1,516 agricultural households, representing 5.3 percent of all households
in the Municipality. Unexpectedly, majority (75.3%) of agricultural households in the
Municipality are located in the urban localities.
Table 7.1: Households by agricultural activities and locality
Agriculture Activity
Total Urban Rural
Number Percent Number Percent Number Percent
Total Households 28,871 100.0
24,270 100.0
4,601 100.0
Households engages in Agriculture 1,516 5.3
1,142 4.7
374 8.1
Crop Farming 1,144 75.5
890 77.9
254 67.9
Tree Planting 44 2.9
38 3.3
6 1.6
Livestock Rearing 439 29.0
293 25.7
146 39.0
Fish Farming 13 0.9 13 1.1 0 0.0 Source: Ghana Statistical Service, 2010 Population and Housing Census
7.3 Types of Agricultural Activities
Figure 7.1 identified four types of agricultural activities in the Municipality namely crop
farming, livestock rearing, fish farming and tree planting. The major agricultural activity in the
Municipality is crop farming (75.5%), followed by livestock rearing (29.0%). Less than one
percent of agricultural households are engaged in fish farming (0.9%) and while almost 3.0
percent are engaged in tree planting. A relatively higher proportion of urban agricultural
households are engaged in crop farming (77.9%) compared to that of rural agricultural
households (67.9%). Livestock rearing is also relatively more common in the rural areas (39.0%)
than urban areas (25.7%).

51
Figure 7.1: Household Agriculture activities by locality
75.5
2.9
29.0
0.9
77.9
3.3
25.7
1.1
67.9
1.6
39.0
0.00.0
10.0
20.0
30.0
40.0
50.0
60.0
70.0
80.0
90.0
Crop Farming Tree Planting Livestock Rearing Fish Farming
Figure 7.1: Household Ariculture activities by locality, (%)
Total
urban
rural
7.4 Types of Farming Activities
Table 7.2 shows the distribution of livestock and keepers in the La Nkwantanang Madina
Municipality. The total number of animals reared in the Municipality is 35,192 and the number
of keepers was 628 with an average of 56 animals per keeper. As shown in table 7.2, chicken
(56.2 %) are the most reared animals in the Municipality, followed by goats (7.9 %) and cattle
(7.5%). Doves, beehives and guinea fowl recorded 0.1 percent each while Ostrich and Snails
were not reared or kept in the Municipality. This implies that non-traditional livestock such as
ostriches and snails were not reared in the Municipality.

52
Table 7.2: Distribution of animal reared and keepers
Animal reared and
keeper
Animals
Keepers Average
Animal per
Keeper Number Percent Number Percent
Total 35,192 100.0
628 100.0 56
Beehives 18 0.1
3 0.5 6
Cattle 2,634 7.50
54 8.6 49
Chicken 19,784 56.20
250 39.8 79
Dove 25 0.10
1 0.2 25
Duck 889 2.50
11 1.8 81
Goat 2,772 7.90
125 19.9 22
Grass-cutter 1,516 4.30
32 5.1 47
Guinea fowl 25 0.10
4 0.6 6
Ostrich 0 0.00
0 0 0
Pig 2,373 6.70
45 7.2 53
Rabbit 2,387 6.80
17 2.7 140
Sheep 1,023 2.90
63 10 16
Silk worm 700 2.00
1 0.2 700
Snail 0 0.00
0 0 0
Turkey 146 0.40
5 0.8 29
Other 5 0.00
3 0.5 2
Fish farming 766 2.20
6 1 128
Inland fishing 96 0.30
6 1 16
Marine fishing 33 0.10 2 0.3 17 Source: Ghana Statistical Service, 2010 Population and Housing Census

53
CHAPTER EIGHT
HOUSING CONDITIONS
8.1 Introduction
In 2010, the Ghana Shared Growth and Development Agenda which is the policy framework of
the Government of Ghana emphasized the need for increased access of the population to safe,
adequate and affordable housing and shelter (National Development Planning Commission,
2010). Earlier frameworks also underscored the important role of housing in social development.
For example, in the Ghana Poverty Reduction Strategy (2003 – 2005) policy framework, housing
interventions were prescribed implicitly within the context of social development objectives
(National Development Planning Commission, 2002). The achievement of health objectives was
linked, among others, to the provision of safe water supply and sewerage, improved housing, and
well planned settlements. The provision of periodic information on housing and housing
conditions is therefore important both to assess what has been achieved and to plan ahead.
The 2010 PHC in Ghana is the second national census, following the 2000 census, which
included a comprehensive housing census. The two censuses provided an official count of all
structures (permanent and temporary) within the nation. This chapter presents a description of
housing conditions in the La Nkwantanang Madina Municipality. Specifically, the chapter
discusses housing stock, type of dwelling and ownership, main construction materials, room
occupancy, access to utilities and household facilities, main source of water for drinking and for
other domestic purposes, bathing and toilet facilities and method of waste disposal.
8.2 Housing stock, Households and Household Size
8.2.1 Housing Stock
The total housing stock in the Municipal is 13,647, representing 2.9 percent of the Greater Accra
regional stock of 474,621. From Table 8.1, the distribution of housing units by locality shows
that, 81.6 percent of the total housing stock in the Municipality is located in urban localities
(11,134) while 18.4 percent accounts for those in the rural areas.
8.2.2 Household and Household size
As shown in Table 8.1, there are 28,270 households with population of 108,051 in the
Municipality; which accounts for an estimated average of 3.9 persons per house. The
Municipality average household size is the same compared to the regional average (3.9) but
lower relative to the national average (4.5).
At the locality level, while the rural average (1.8) is slightly fewer than the municipal’s average
(2.1), the urban average of 2.2 households per house is more but the same compared with the
regional average. Again, considering the population living in a house, the same pattern
characterizes by household per house is reflected. In the municipal, the average population per

54
house for the urban area (8.4) is the same as that for regional average but more relative to
municipal’s average (8.2) and rural average (7.1).
Table 8.1: Stock of houses and households by type of locality
Categories
Total
Country Region District Urban Rural
Total population 24,658,823 4,010,054 111,926 93,987 17,939
Total household population 24,076,327 3,888,512 108,051 90,732 17,319
Number of houses 3,392,745 474,621 13,647 11,134 2,513
Number of households 5,467,054 1,036,370 28,870 24,269 4,601
Average households per house 1.6 2.2 2.1 2.2 1.8
Population per house 7.3 8.4 8.2 8.4 7.1
Average household size 4.5 3.9 3.9 3.9 3.9 Source: Ghana Statistical Service, 2010 Population and Housing Census
8.3 Type of Dwelling, Holding and Tenancy Arrangement
8.3.1 Types of Dwelling Units
Table 8.2 shows more than half (52.6%) of the dwelling units in the La Nkwantanang Madina
Municipality are compound houses, while separate houses constitute almost one-fifth (19.8%)
and improvised home (kiosk/container etc.) accounting for about one-tenth (10.8%).
Huts/Buildings (different compound) (0.1%) constitute the least common type of dwelling units
in the Municipality.
Considering the type of dwelling units by sex of head of households the pattern of distribution is
similar to that discussed earlier. The proportion of female headed households living in compound
house is higher compared to that of the male headed households (54.4% against 51.7%).
Similarly, the proportion of female headed households living in improvised home
(kiosk/container etc.) is slightly higher compared to that of male headed households (10.9%
against 10.8%). In the case of separate house however, the reverse is the case; the proportion for
male headed households (20.4%) is higher than that of female headed household (18.6%).
Furthermore, Table 8.2 shows that, in terms of distribution of type of dwelling by locality, the
results show that 54.2 percent of the households lived in compound houses in urban areas as
against 44.6 percent in rural areas. A higher proportion rural dweller live in separate house
compared with urban dwellers (21.9% against 19.4%), while the reverse is the case for
Improvised home (kiosk/container etc.); urban (11.1%) and rural (9.3%).
8.3.2 Holding and Tenancy Arrangement
Table 8.3 shows that about 83.2 percent of housing unit in the Municipality are either owned by
private individuals (45.0%) or household members (38.2%). Whereas about 1.0 percent of
dwelling units are either owned by private agency (0.4%) or being purchased by household
(mortgage) (0.7%).
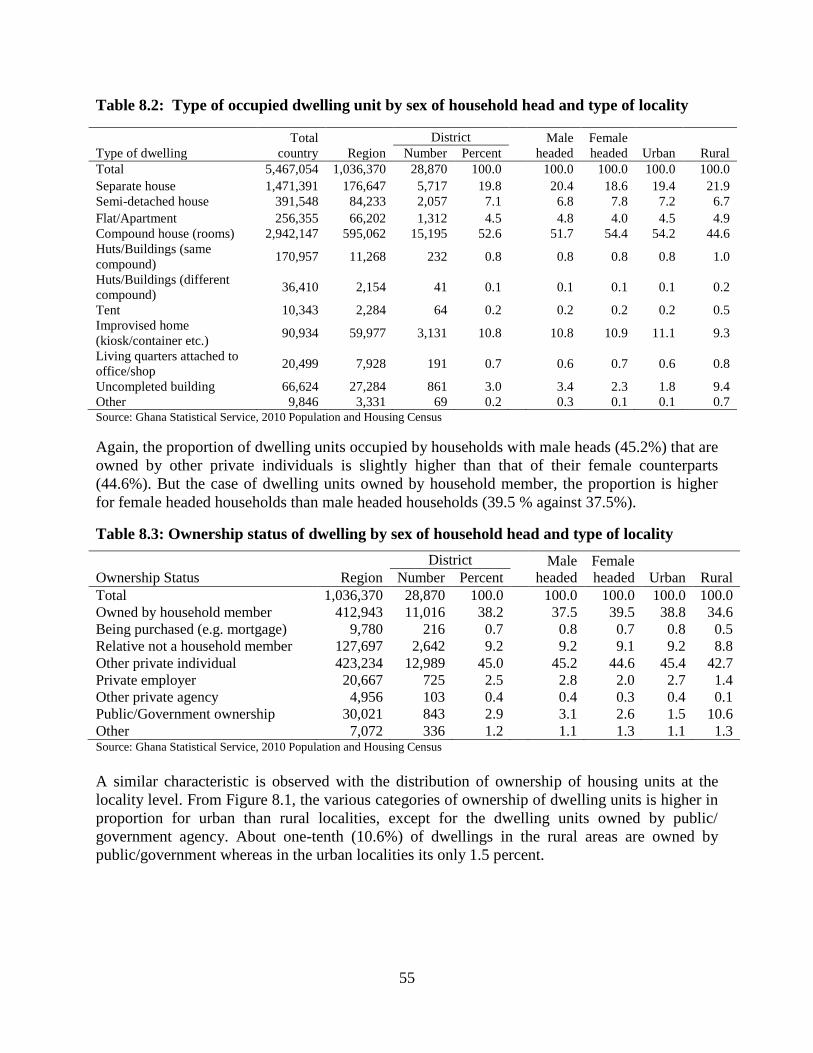
55
Table 8.2: Type of occupied dwelling unit by sex of household head and type of locality
Type of dwelling
Total
country Region
District Male
headed
Female
headed Urban Rural Number Percent
Total 5,467,054 1,036,370 28,870 100.0
100.0 100.0 100.0 100.0
Separate house 1,471,391 176,647 5,717 19.8
20.4 18.6 19.4 21.9
Semi-detached house 391,548 84,233 2,057 7.1
6.8 7.8 7.2 6.7
Flat/Apartment 256,355 66,202 1,312 4.5
4.8 4.0 4.5 4.9
Compound house (rooms) 2,942,147 595,062 15,195 52.6
51.7 54.4 54.2 44.6
Huts/Buildings (same
compound) 170,957 11,268 232 0.8
0.8 0.8 0.8 1.0
Huts/Buildings (different
compound) 36,410 2,154 41 0.1
0.1 0.1 0.1 0.2
Tent 10,343 2,284 64 0.2
0.2 0.2 0.2 0.5
Improvised home
(kiosk/container etc.) 90,934 59,977 3,131 10.8
10.8 10.9 11.1 9.3
Living quarters attached to
office/shop 20,499 7,928 191 0.7
0.6 0.7 0.6 0.8
Uncompleted building 66,624 27,284 861 3.0
3.4 2.3 1.8 9.4
Other 9,846 3,331 69 0.2 0.3 0.1 0.1 0.7 Source: Ghana Statistical Service, 2010 Population and Housing Census
Again, the proportion of dwelling units occupied by households with male heads (45.2%) that are
owned by other private individuals is slightly higher than that of their female counterparts
(44.6%). But the case of dwelling units owned by household member, the proportion is higher
for female headed households than male headed households (39.5 % against 37.5%).
Table 8.3: Ownership status of dwelling by sex of household head and type of locality
Ownership Status Region
District Male
headed
Female
headed Urban Rural Number Percent
Total 1,036,370 28,870 100.0
100.0 100.0 100.0 100.0
Owned by household member 412,943 11,016 38.2
37.5 39.5 38.8 34.6
Being purchased (e.g. mortgage) 9,780 216 0.7
0.8 0.7 0.8 0.5
Relative not a household member 127,697 2,642 9.2
9.2 9.1 9.2 8.8
Other private individual 423,234 12,989 45.0
45.2 44.6 45.4 42.7
Private employer 20,667 725 2.5
2.8 2.0 2.7 1.4
Other private agency 4,956 103 0.4
0.4 0.3 0.4 0.1
Public/Government ownership 30,021 843 2.9
3.1 2.6 1.5 10.6
Other 7,072 336 1.2 1.1 1.3 1.1 1.3 Source: Ghana Statistical Service, 2010 Population and Housing Census
A similar characteristic is observed with the distribution of ownership of housing units at the
locality level. From Figure 8.1, the various categories of ownership of dwelling units is higher in
proportion for urban than rural localities, except for the dwelling units owned by public/
government agency. About one-tenth (10.6%) of dwellings in the rural areas are owned by
public/government whereas in the urban localities its only 1.5 percent.
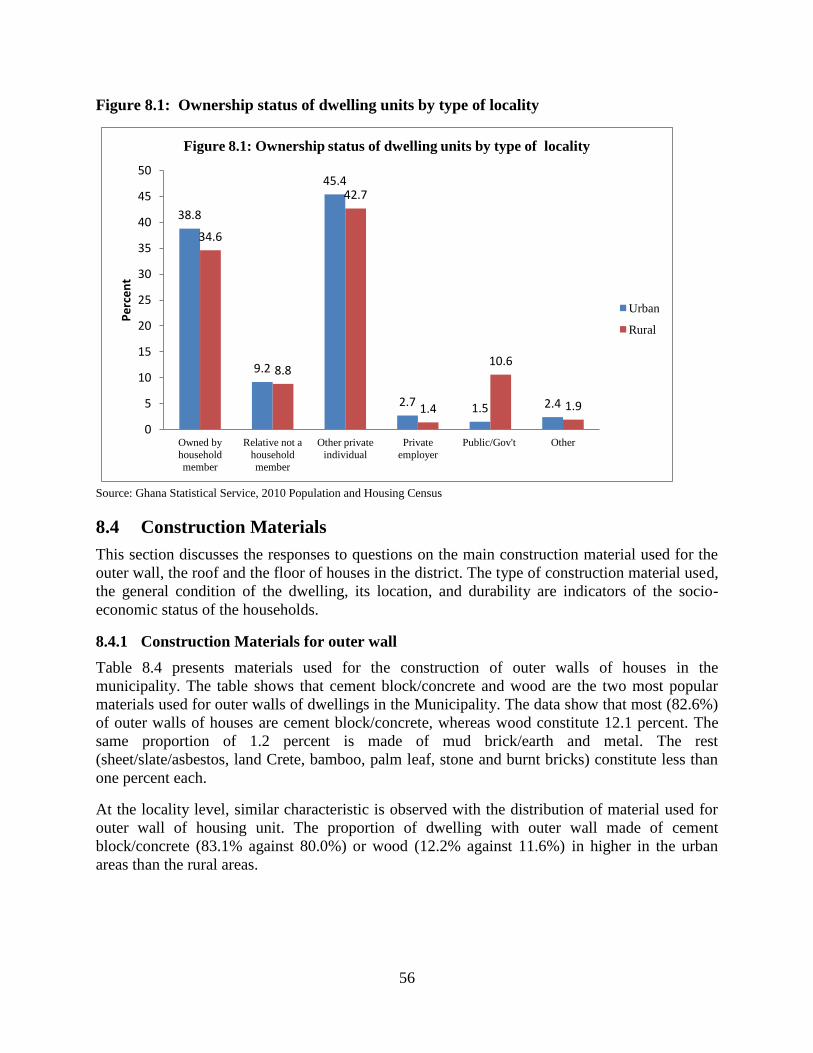
56
Figure 8.1: Ownership status of dwelling units by type of locality
38.8
9.2
45.4
2.7 1.5 2.4
34.6
8.8
42.7
1.4
10.6
1.9
0
5
10
15
20
25
30
35
40
45
50
Owned by
household
member
Relative not a
household
member
Other private
individual
Private
employer
Public/Gov't Other
Pe
rce
nt
Figure 8.1: Ownership status of dwelling units by type of locality
Urban
Rural
Source: Ghana Statistical Service, 2010 Population and Housing Census
8.4 Construction Materials
This section discusses the responses to questions on the main construction material used for the
outer wall, the roof and the floor of houses in the district. The type of construction material used,
the general condition of the dwelling, its location, and durability are indicators of the socio-
economic status of the households.
8.4.1 Construction Materials for outer wall
Table 8.4 presents materials used for the construction of outer walls of houses in the
municipality. The table shows that cement block/concrete and wood are the two most popular
materials used for outer walls of dwellings in the Municipality. The data show that most (82.6%)
of outer walls of houses are cement block/concrete, whereas wood constitute 12.1 percent. The
same proportion of 1.2 percent is made of mud brick/earth and metal. The rest
(sheet/slate/asbestos, land Crete, bamboo, palm leaf, stone and burnt bricks) constitute less than
one percent each.
At the locality level, similar characteristic is observed with the distribution of material used for
outer wall of housing unit. The proportion of dwelling with outer wall made of cement
block/concrete (83.1% against 80.0%) or wood (12.2% against 11.6%) in higher in the urban
areas than the rural areas.
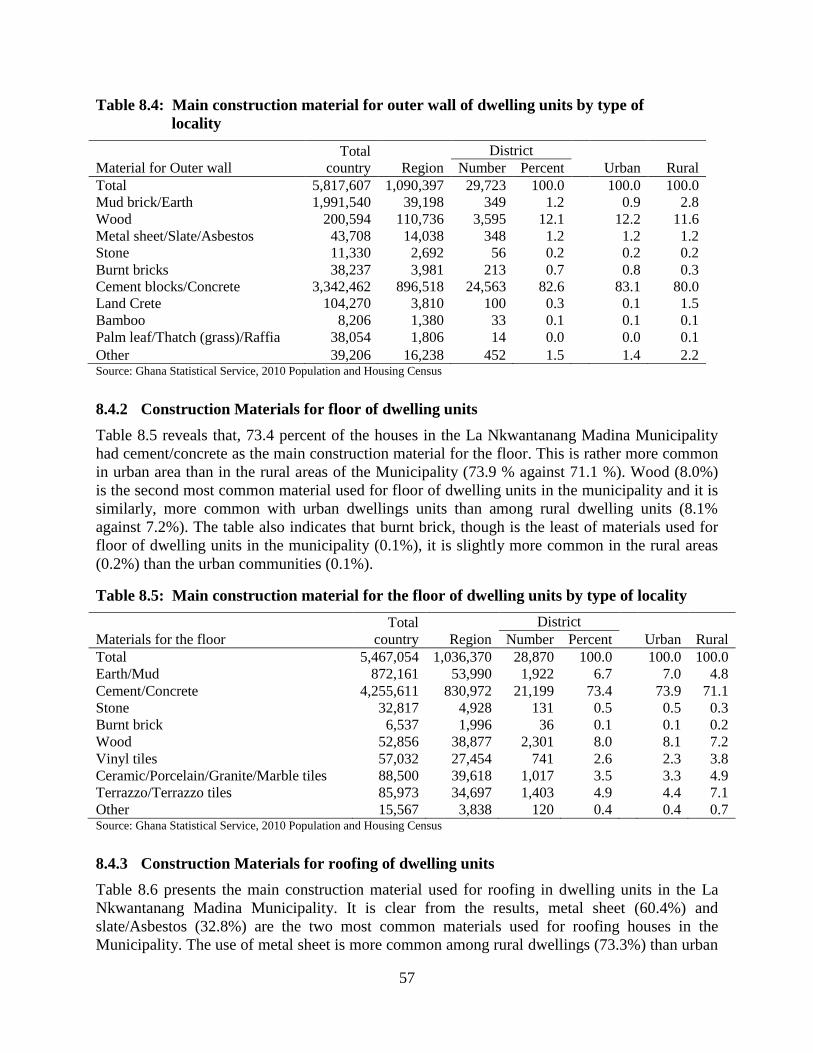
57
Table 8.4: Main construction material for outer wall of dwelling units by type of
locality
Material for Outer wall
Total
country Region
District Urban Rural Number Percent
Total 5,817,607 1,090,397 29,723 100.0
100.0 100.0
Mud brick/Earth 1,991,540 39,198 349 1.2
0.9 2.8
Wood 200,594 110,736 3,595 12.1
12.2 11.6
Metal sheet/Slate/Asbestos 43,708 14,038 348 1.2
1.2 1.2
Stone 11,330 2,692 56 0.2
0.2 0.2
Burnt bricks 38,237 3,981 213 0.7
0.8 0.3
Cement blocks/Concrete 3,342,462 896,518 24,563 82.6
83.1 80.0
Land Crete 104,270 3,810 100 0.3
0.1 1.5
Bamboo 8,206 1,380 33 0.1
0.1 0.1
Palm leaf/Thatch (grass)/Raffia 38,054 1,806 14 0.0
0.0 0.1
Other 39,206 16,238 452 1.5 1.4 2.2 Source: Ghana Statistical Service, 2010 Population and Housing Census
8.4.2 Construction Materials for floor of dwelling units
Table 8.5 reveals that, 73.4 percent of the houses in the La Nkwantanang Madina Municipality
had cement/concrete as the main construction material for the floor. This is rather more common
in urban area than in the rural areas of the Municipality (73.9 % against 71.1 %). Wood (8.0%)
is the second most common material used for floor of dwelling units in the municipality and it is
similarly, more common with urban dwellings units than among rural dwelling units (8.1%
against 7.2%). The table also indicates that burnt brick, though is the least of materials used for
floor of dwelling units in the municipality (0.1%), it is slightly more common in the rural areas
(0.2%) than the urban communities (0.1%).
Table 8.5: Main construction material for the floor of dwelling units by type of locality
Materials for the floor
Total
country Region
District
Urban Rural Number Percent
Total 5,467,054 1,036,370 28,870 100.0
100.0 100.0
Earth/Mud 872,161 53,990 1,922 6.7
7.0 4.8
Cement/Concrete 4,255,611 830,972 21,199 73.4
73.9 71.1
Stone 32,817 4,928 131 0.5
0.5 0.3
Burnt brick 6,537 1,996 36 0.1
0.1 0.2
Wood 52,856 38,877 2,301 8.0
8.1 7.2
Vinyl tiles 57,032 27,454 741 2.6
2.3 3.8
Ceramic/Porcelain/Granite/Marble tiles 88,500 39,618 1,017 3.5
3.3 4.9
Terrazzo/Terrazzo tiles 85,973 34,697 1,403 4.9
4.4 7.1
Other 15,567 3,838 120 0.4 0.4 0.7 Source: Ghana Statistical Service, 2010 Population and Housing Census
8.4.3 Construction Materials for roofing of dwelling units
Table 8.6 presents the main construction material used for roofing in dwelling units in the La
Nkwantanang Madina Municipality. It is clear from the results, metal sheet (60.4%) and
slate/Asbestos (32.8%) are the two most common materials used for roofing houses in the
Municipality. The use of metal sheet is more common among rural dwellings (73.3%) than urban

58
dwellings (58.0%); relatively higher compared to 49.3 percent in the region. Slate/Asbestos is
rather more common in the urban areas than rural areas (36.4% against 14.5%). The rationale for
using quite a large number of slate/Asbestos materials aside the metal sheets for roofing might be
due its resistant to the corrosive effects of the sea. The Table also shows that quiet a number of
houses in the Municipality had been roofed with concrete (3.2percent) and roofing tiles
(1.5percent).
Table 8.6: Main construction material for roofing of dwelling unit by type of locality
Main Roofing material
Total
country Region
District
Urban Rural Number Percent
Total 5,817,607 1,090,397 29,723 100.0
100.0 100.0
Mud/Mud bricks/Earth 80,644 3,162 83 0.3
0.3 0.4
Wood 45,547 8,895 203 0.7
0.7 0.5
Metal sheet 4,152,259 537,503 17,963 60.4
58.0 73.3
Slate/Asbestos 759,039 454,300 9,764 32.8
36.4 14.5
Cement/Concrete 141,072 41,671 957 3.2
2.7 6.1
Roofing tile 31,456 18,041 447 1.5
1.2 3.1
Bamboo 71,049 2,284 50 0.2
0.2 0.1
Thatch/Palm leaf or Raffia 500,606 16,797 102 0.3
0.2 0.9
Other 35,935 7,744 154 0.5 0.4 1.1 Source: Ghana Statistical Service, 2010 Population and Housing Census
8.5 Room Occupancy
The relationship between a household size and the number of rooms available for sleeping
provides an indication of the extent of crowding in households. Overcrowded rooms have health
implications arising from, among others, disturbed sleep, infectious diseases and respiratory
infections (GSS, 2012).
8.5.1 Household size and room occupancy
Table 8.7 presents household size with sleeping rooms occupied in each household. The table
shows that 58.7percent of households in the Municipality occupied only one sleeping room while
24.3 percent had two sleeping rooms. There was clear evidence of overcrowding in the sleeping
rooms in the Municipality. For instance, 52 percent of the household size of four and 38.9
percent of household sizes of five used only one sleeping room (Table 8.7).
Generally, it is observed as expected that the larger the household size the more sleeping rooms
used by household and the reverse is the case. For one member households, 91.0 percent of use
one room for sleeping and about 6.3 percent use two rooms for sleeping. Similarly, about 76.3
percent of two member households use one room for sleeping, and 18.6 percent of the same
household use two sleeping rooms followed by 2.3 percent use three rooms for sleeping. Also,
78.1 percent of five member households sleep in either one room (38.9%) or two rooms (39.2%).
Household size of ten or more, 9.2 percent sleep in one room, 2 rooms (17.6%), and three rooms
(16.2%) and 4 rooms (15.7%).

59
Table 8.7: Households by size and number of sleeping rooms occupied in dwelling unit
House-
hold
Size
Number of Sleeping Rooms
Total
One
Room
Two
Rooms
Three
Rooms
Four
Rooms
Five
Rooms
Six
Rooms
Seven
Rooms
Eight
Rooms
Nine
Rooms
or more
Total 28,870 100.0 58.7 24.3 7.6 5.1 2.2 1.1 0.5 0.2 0.3
1 6,105 100.0 91.0 6.3 1.1 0.7 0.3 0.3 0.3 0.0 0.0
2 4,878 100.0 76.3 18.6 2.3 1.8 0.5 0.3 0.1 0.0 0.0
3 4,563 100.0 63.9 25.1 6.7 2.9 0.9 0.3 0.1 0.1 0.0
4 4,081 100.0 52.0 32.6 8.4 4.8 1.4 0.4 0.2 0.1 0.0
5 3,336 100.0 38.9 39.3 11.7 6.9 2.2 0.8 0.1 0.1 0.1
6 2,319 100.0 31.0 39.5 14.4 9.4 3.1 1.4 0.7 0.2 0.3
7 1,382 100.0 24.2 35.6 18.2 12.9 5.4 2.0 0.7 0.5 0.4
8 833 100.0 17.4 30.7 18.8 17.3 8.8 4.0 1.4 0.8 0.7
9 502 100.0 12.5 24.3 18.3 21.3 12.0 6.8 3.0 1.2 0.6
10+ 871 100.0 9.2 17.6 16.2 15.7 15.6 10.7 6.3 3.8 4.9 Source: Ghana Statistical Service, 2010 Population and Housing Census
8.6 Access to Utilities and Household Facilities
8.6.1 Main Source of Lighting by District
This section describes data on household amenities, cooking space and sanitation issues in
dwelling units in the La Nkwantanang Madina Municipality. Table 8.8 shows the main source of
lighting in the Municipality. Majority (85.8%) of dwelling units use electricity (through the
national grid) as the main source of lighting in the Municipality; which is lower than the regional
figure (87.1%). This is followed by flash/light torch (6.0%) and kerosene lamp (4.3%), with
firewood (0.1%) and crop residue (0.1%) being the least patronized source of lighting of
dwellings in the municipality. The three main sources of lighting in the Municipality were
consistent with that of the region (Table 8.8).
Table 8.8: Main source of lighting of dwelling units by type of locality
Main source of light
Total
country Region
District
Urban Rural Number Percent
Total 5,467,054 1,036,370 28,870 100.0 100.0 100.0
Electricity (mains) 3,511,065 902,831 24,776 85.8 87.7 75.9
Electricity (private generator) 36,142 6,644 189 0.7 0.6 0.8
Kerosene lamp 971,807 61,509 1,237 4.3 3.6 8.1
Gas lamp 9,378 1,463 50 0.2 0.1 0.3
Solar energy 9,194 1,023 46 0.2 0.1 0.3
Candle 41,214 19,251 664 2.3 2.0 3.8
Flashlight/Torch 858,651 39,942 1,744 6.0 5.3 9.9
Firewood 13,241 1,036 31 0.1 0.1 0.2
Crop residue 4,623 443 22 0.1 0.1 0.1
Other 11,739 2,228 111 0.4 0.3 0.6 Source: Ghana Statistical Service, 2010 Population and Housing Census
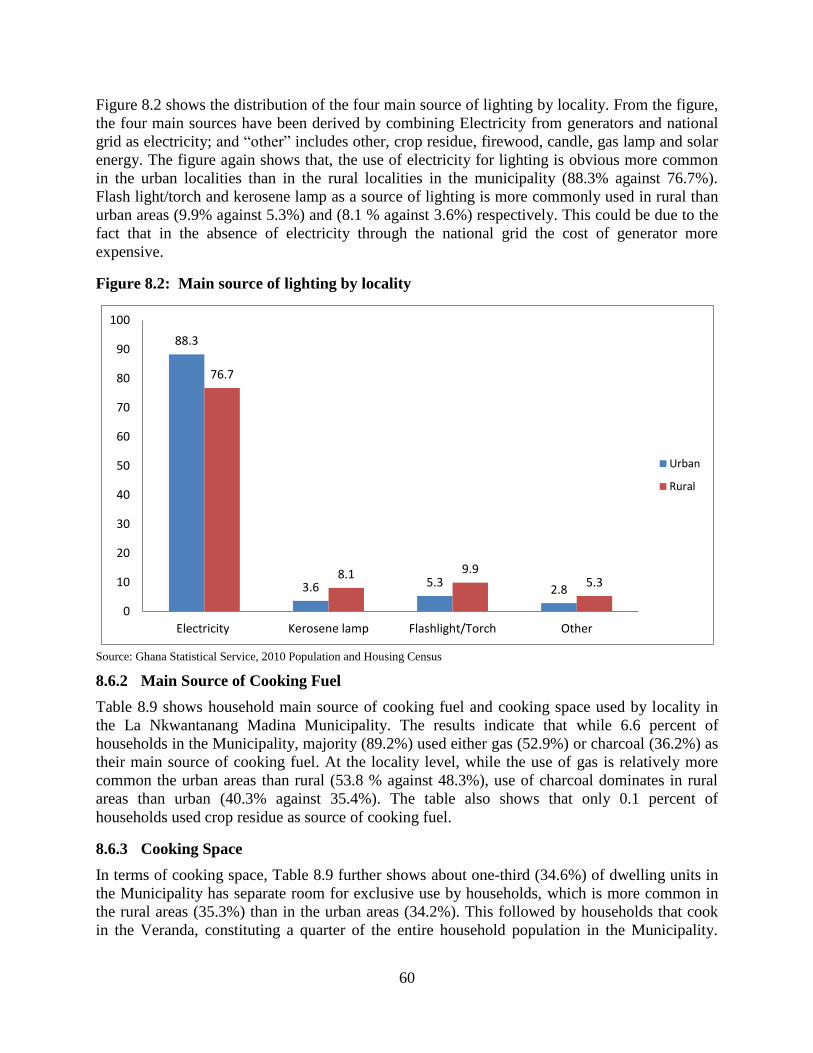
60
Figure 8.2 shows the distribution of the four main source of lighting by locality. From the figure,
the four main sources have been derived by combining Electricity from generators and national
grid as electricity; and “other” includes other, crop residue, firewood, candle, gas lamp and solar
energy. The figure again shows that, the use of electricity for lighting is obvious more common
in the urban localities than in the rural localities in the municipality (88.3% against 76.7%).
Flash light/torch and kerosene lamp as a source of lighting is more commonly used in rural than
urban areas (9.9% against 5.3%) and (8.1 % against 3.6%) respectively. This could be due to the
fact that in the absence of electricity through the national grid the cost of generator more
expensive.
Figure 8.2: Main source of lighting by locality
88.3
3.6 5.32.8
76.7
8.1 9.95.3
0
10
20
30
40
50
60
70
80
90
100
Electricity Kerosene lamp Flashlight/Torch Other
Urban
Rural
Source: Ghana Statistical Service, 2010 Population and Housing Census
8.6.2 Main Source of Cooking Fuel
Table 8.9 shows household main source of cooking fuel and cooking space used by locality in
the La Nkwantanang Madina Municipality. The results indicate that while 6.6 percent of
households in the Municipality, majority (89.2%) used either gas (52.9%) or charcoal (36.2%) as
their main source of cooking fuel. At the locality level, while the use of gas is relatively more
common the urban areas than rural (53.8 % against 48.3%), use of charcoal dominates in rural
areas than urban (40.3% against 35.4%). The table also shows that only 0.1 percent of
households used crop residue as source of cooking fuel.
8.6.3 Cooking Space
In terms of cooking space, Table 8.9 further shows about one-third (34.6%) of dwelling units in
the Municipality has separate room for exclusive use by households, which is more common in
the rural areas (35.3%) than in the urban areas (34.2%). This followed by households that cook
in the Veranda, constituting a quarter of the entire household population in the Municipality.

61
Similarly, use of veranda as cooking space is more common in the rural households than urban
households (28.5% against 24.3%). While about one-fifth (20.5%) of households cook in an
open space in compound. This phenomenon is almost equally common in both localities (urban,
20.3%) and (rural, 19.9%).
Furthermore, about one percent of household has separate room shared with no roof as their
cooking and this proportion is the same with urban household (1.0%) but almost twice in the
rural households (1.8%).
Table 8.9: Main source of cooking fuel, and cooking space used by households
Source of cooking
fuel/cooking space
Total
country Region
District
Urban
Rural
Number Percent Number Percent Number Percent
Main source of cooking fuel for household
Total 5,467,054 1,036,370 28,870 100.0
24,269 100.0
4,601 100.0
None no cooking 306,118 71,797 1,781 6.2
1,609 6.6
172 3.7
Wood 2,197,083 36,560 588 2.0
381 1.6
207 4.5
Gas 996,518 429,464 15,283 52.9
13,062 53.8
2,221 48.3
Electricity 29,794 9,645 210 0.7
179 0.7
31 0.7
Kerosene 29,868 11,627 316 1.1
268 1.1
48 1.0
Charcoal 1,844,290 470,277 10,444 36.2
8,592 35.4
1,852 40.3
Crop residue 45,292 724 15 0.1
10 0.0
5 0.1
Saw dust 8,000 2,713 77 0.3
62 0.3
15 0.3
Animal waste 2,332 919 32 0.1
16 0.1
16 0.3
Other 7,759 2,644 124 0.4
90 0.4
34 0.7
Cooking space used by household
Total 5,467,054 1,036,370 28,870 100.0
24,269 100.0
4,601 100.0
No cooking space 386,883 86,433 2,433 8.4
2,171 8.9
262 5.7
Separate room for exclusive
use of household 1,817,018 319,998 9,994 34.6
8,371 34.5
1,623 35.3
Separate room shared with
other household(s) 410,765 30,270 819 2.8
725 3.0
94 2.0
Enclosure without roof 117,614 17,007 359 1.2
329 1.4
30 0.7
Structure with roof but
without walls 349,832 15,465 319 1.1
238 1.0
81 1.8
Bedroom/Hall/Living room) 74,525 27,948 1,720 6.0
1,470 6.1
250 5.4
Verandah 1,173,946 302,863 7,212 25.0
5,900 24.3
1,312 28.5
Open space in compound 1,115,464 230,843 5,844 20.2
4,930 20.3
914 19.9
Other 21,007 5,543 170 0.6 135 0.6 35 0.8
Source: Ghana Statistical Service, 2010 Population and Housing Census
8.7 Main Source of Water for drinking and for other domestic use
The availability and accessibility to improved drinking water is an important aspect of the health
of household members. The UN Millennium Development Goal (MDG7) is to reduce by half the
proportion of people without sustainable access to safe drinking water by 2015 based on 1990
levels. This section examines the various sources of drinking water for the La Nkwantanang
Madina Municipality.

62
8.7.1 Source of Water for Drinking and other Domestic Uses
Table 8.10 presents the sources of drinking water and for other domestic purposes. The results
show that majority (61.9%) of households in the Municipality depend on sachet water as their
main source of drinking water. This is followed by about one-tenth (11.9 %) drinking from pipe-
borne water outside the dwelling unit and the same proportion depending on tanker supply/
vendor. The tankers supply service is more patronized by urban households than rural
households (11.7% against 3.1%), whereas sachet water is rather on a higher demand in the rural
areas than urban areas (64.0% against 61.5%). This may perhaps be due to inadequate supply of
pipe-borne water; evident in table 8.10, rural (4.2%) and urban (8.5%). In additional, the use of
sachet water for drinking could have some health implications since some of them were not
produced under hygienic conditions.
Table 8.10: Main source of drinking water and other domestic purposes for dwelling unit
Sources of water
Total
country Region
District
Urban Rural Number Percent
Main source of drinking water for household
Total 5,467,054 1,036,370 28,870 100.0 100.0 100.0
Pipe-borne inside dwelling 790,493 272,766 2,246 7.8 8.5 4.2
Pipe-borne outside dwelling 1,039,667 291,107 3,436 11.9 12.1 11.0
Public tap/Standpipe 712,375 103,356 807 2.8 1.8 8.2
Bore-hole/Pump/Tube well 1,267,688 15,989 615 2.1 1.7 4.7
Protected well 321,091 7,167 304 1.1 0.9 1.9
Rain water 39,438 1,833 62 0.2 0.1 0.6
Protected spring 19,345 3,513 103 0.4 0.4 0.3
Bottled water 20,261 10,952 389 1.3 1.3 1.5
Satchet water 490,283 290,342 17,866 61.9 61.5 64.0
Tanker supply/Vendor provided 58,400 29,843 2,975 10.3 11.7 3.1
Unprotected well 112,567 2,314 20 0.1 0.1 0.1
Unprotected spring 12,222 318 3 0.0 0.0 0.0
River/Stream 502,804 4,179 20 0.1 0.1 0.0
Dugout/Pond/Lake/Dam/Canal 76,448 1,677 8 0.0 0.0 0.1
Other 3,972 1,014 16 0.1 0.1 0.1
Main source of water for other domestic purposes
Total 5,467,054 1,036,370 28,870 100.0 100.0 100.0
Pipe-borne inside dwelling 905,566 363,174 3,945 13.7 14.8 7.8
Pipe-borne outside dwelling 1,089,030 384,657 6,926 24.0 24.6 20.9
Public tap/Standpipe 704,293 127,980 1,507 5.2 3.7 13.1
Bore-hole/Pump/Tube well 1,280,465 41,441 2,515 8.7 7.0 17.8
Protected well 465,775 24,489 3,542 12.3 11.1 18.2
Rain water 39,916 3,538 153 0.5 0.4 1.2
Protected spring 18,854 2,674 67 0.2 0.2 0.2
Tanker supply/Vendor provided 100,048 64,630 9,715 33.7 36.7 17.7
Unprotected well 152,055 5,804 278 1.0 0.8 1.8
Unprotected spring 15,738 1,586 62 0.2 0.2 0.2
River/Stream 588,590 11,331 82 0.3 0.3 0.5
Dugout/Pond/Lake/Dam/Canal 96,422 3,765 50 0.2 0.1 0.5
Other 10,302 1,301 28 0.1 0.1 0.2 Source: Ghana Statistical Service, 2010 Population and Housing Census

63
8.7.2 Main sources of water for other domestic use for household
With regards to water for other domestic purposes, a little more than one-third (37.7%) of
households in the municipality are either connected to the pipe-borne water outside dwelling
(24.0%) or pipe-borne water inside dwelling (13.7%). Again, about one-third (33.7%) rely on
tanker supply/vendor, while 12.3 percent uses water from protected well. Less than one percent
of households depend on Rain water (0.5%), protected spring (0.2%), unprotected spring (0.2%),
River/Stream (0.3%), and Dugout/Pond/Lake/Dam/Canal (0.2%).
From Figure 8.3, the proportions of household that depend on tanker supply (36.7%), pipe-borne
outside (24.6%) and inside (14.8%) dwelling for water for domestic purposes are higher relative
to that of rural households. However, rural households have higher proportions that depend on
bore-hole/ pump/ tube well (17.8%), Public tap / standpipe (13.1%) and protected well (18.2%)
compared to that of urban households (7.0 %, 3.7, and 11.1% respectively).
Figure 8.3: Main source of water for other domestic use by locality
Source: Ghana Statistical Service, 2010 Population and Housing Census
8.8 Bathing and Toilet Facilities
8.8.1 Toilet Facilities
An efficient and hygienic method of human waste disposal available in a dwelling unit provides
a critical indicator for assessing sanitary condition of the unit and is an indirect measure of the
socio-economic status of a household (GSS, 2012).
Bathing facility type in the Municipality is described in Table 8.11. About one-third of the
people (32.1%) in La Nkwantanang Madina Municipality use shared separate bathroom in same
house, while 31.1 percent of households used own bathroom for exclusive use. A significant
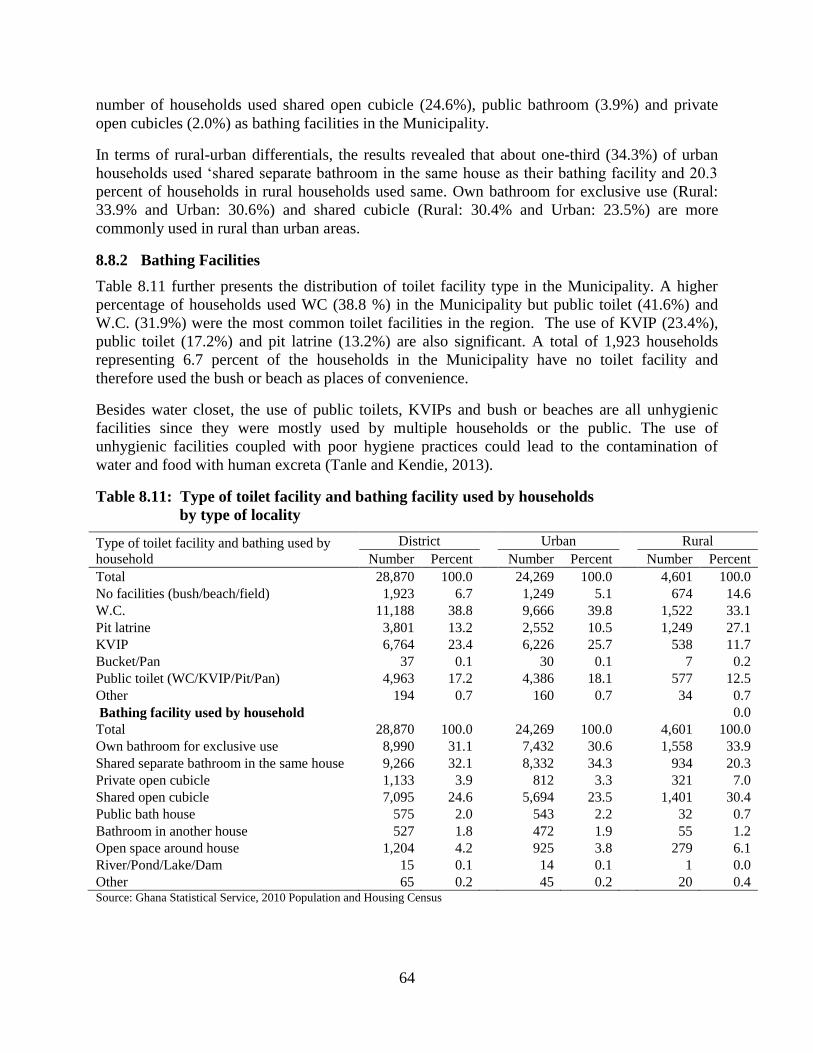
64
number of households used shared open cubicle (24.6%), public bathroom (3.9%) and private
open cubicles (2.0%) as bathing facilities in the Municipality.
In terms of rural-urban differentials, the results revealed that about one-third (34.3%) of urban
households used ‘shared separate bathroom in the same house as their bathing facility and 20.3
percent of households in rural households used same. Own bathroom for exclusive use (Rural:
33.9% and Urban: 30.6%) and shared cubicle (Rural: 30.4% and Urban: 23.5%) are more
commonly used in rural than urban areas.
8.8.2 Bathing Facilities
Table 8.11 further presents the distribution of toilet facility type in the Municipality. A higher
percentage of households used WC (38.8 %) in the Municipality but public toilet (41.6%) and
W.C. (31.9%) were the most common toilet facilities in the region. The use of KVIP (23.4%),
public toilet (17.2%) and pit latrine (13.2%) are also significant. A total of 1,923 households
representing 6.7 percent of the households in the Municipality have no toilet facility and
therefore used the bush or beach as places of convenience.
Besides water closet, the use of public toilets, KVIPs and bush or beaches are all unhygienic
facilities since they were mostly used by multiple households or the public. The use of
unhygienic facilities coupled with poor hygiene practices could lead to the contamination of
water and food with human excreta (Tanle and Kendie, 2013).
Table 8.11: Type of toilet facility and bathing facility used by households
by type of locality
Type of toilet facility and bathing used by
household
District Urban Rural
Number Percent Number Percent Number Percent
Total 28,870 100.0
24,269 100.0
4,601 100.0
No facilities (bush/beach/field) 1,923 6.7
1,249 5.1
674 14.6
W.C. 11,188 38.8
9,666 39.8
1,522 33.1
Pit latrine 3,801 13.2
2,552 10.5
1,249 27.1
KVIP 6,764 23.4
6,226 25.7
538 11.7
Bucket/Pan 37 0.1
30 0.1
7 0.2
Public toilet (WC/KVIP/Pit/Pan) 4,963 17.2
4,386 18.1
577 12.5
Other 194 0.7
160 0.7
34 0.7
Bathing facility used by household
0.0
Total 28,870 100.0
24,269 100.0
4,601 100.0
Own bathroom for exclusive use 8,990 31.1
7,432 30.6
1,558 33.9
Shared separate bathroom in the same house 9,266 32.1
8,332 34.3
934 20.3
Private open cubicle 1,133 3.9
812 3.3
321 7.0
Shared open cubicle 7,095 24.6
5,694 23.5
1,401 30.4
Public bath house 575 2.0
543 2.2
32 0.7
Bathroom in another house 527 1.8
472 1.9
55 1.2
Open space around house 1,204 4.2
925 3.8
279 6.1
River/Pond/Lake/Dam 15 0.1
14 0.1
1 0.0
Other 65 0.2 45 0.2 20 0.4 Source: Ghana Statistical Service, 2010 Population and Housing Census

65
Figure 8.3 shows the type of toilet facilities used by households by locality. The figure shows
that, use of pit latrine is more common among rural households (27.1%) than urban households
(10.5%), while among the urban households other toilet facilities like KVIP, W.C and public
toilet are more commonly used compared to as observed in rural households.
Figure 8.4: Type of toilet facility use by households by locality
Source: Ghana Statistical Service, 2010 Population and Housing Census
8.9 Method of Waste Disposal
8.9.1 Solid waste disposal
Table 8.12 presents the various methods by which solid and liquid waste was disposed of by
households in the Municipality. It shows that 67.9 percent of households collected their solid
waste, 12.1 percent dispose theirs through public dump (container), while 1.1 percent dumped
indiscriminately. A similar pattern of solid waste disposal is observed in all the localities.
However, indiscriminate disposal of solid waste is more common in the rural areas compared to
urban areas (3.2% against 0.7%) in Municipality.
8.9.2 Liquid waste disposal
According to Table 8.12, while only 8.7 percent of the entire households in the municipality
dispose their liquid waste through the sewage system, almost seventy percent dispose liquid
waste either by throwing into gutters (26.2%), throwing onto compounds (22.3%) or throwing
onto the streets (21.0%). With regard to type of locality, while throwing of liquid waste into
gutter (28.8%) is the commonest method of disposal of liquid waste, majority (46.5%) of rural
households resort to throwing of liquid waste unto compounds. It can be concluded that liquid
waste was improperly disposed of in the Municipality.
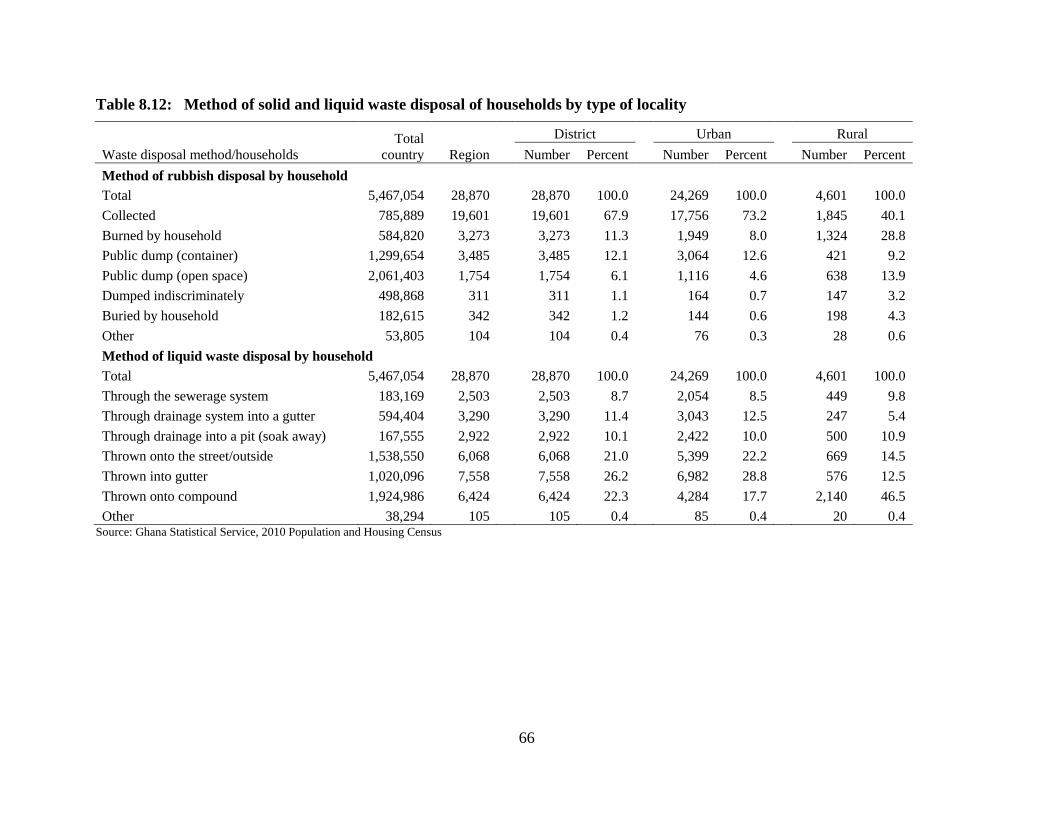
66
Table 8.12: Method of solid and liquid waste disposal of households by type of locality
Waste disposal method/households
Total
country Region
District
Urban
Rural
Number Percent Number Percent Number Percent
Method of rubbish disposal by household
Total 5,467,054 28,870
28,870 100.0
24,269 100.0
4,601 100.0
Collected 785,889 19,601
19,601 67.9
17,756 73.2
1,845 40.1
Burned by household 584,820 3,273
3,273 11.3
1,949 8.0
1,324 28.8
Public dump (container) 1,299,654 3,485
3,485 12.1
3,064 12.6
421 9.2
Public dump (open space) 2,061,403 1,754
1,754 6.1
1,116 4.6
638 13.9
Dumped indiscriminately 498,868 311
311 1.1
164 0.7
147 3.2
Buried by household 182,615 342
342 1.2
144 0.6
198 4.3
Other 53,805 104
104 0.4
76 0.3
28 0.6
Method of liquid waste disposal by household
Total 5,467,054 28,870
28,870 100.0
24,269 100.0
4,601 100.0
Through the sewerage system 183,169 2,503
2,503 8.7
2,054 8.5
449 9.8
Through drainage system into a gutter 594,404 3,290
3,290 11.4
3,043 12.5
247 5.4
Through drainage into a pit (soak away) 167,555 2,922
2,922 10.1
2,422 10.0
500 10.9
Thrown onto the street/outside 1,538,550 6,068
6,068 21.0
5,399 22.2
669 14.5
Thrown into gutter 1,020,096 7,558
7,558 26.2
6,982 28.8
576 12.5
Thrown onto compound 1,924,986 6,424
6,424 22.3
4,284 17.7
2,140 46.5
Other 38,294 105 105 0.4 85 0.4 20 0.4 Source: Ghana Statistical Service, 2010 Population and Housing Census

67
CHAPTER NINE
SUMMARY OF FINDINGS, CONCLUSION AND
POLICY IMPLICATIONS
9.1 Introduction
This chapter presents a summary of the main findings, conclusions and policy implications of the
report based on analysis of selected topics of the 2010 PHC for the La Nkwantanang Madina
Municipality. The 2010 PHC, the fifth in the history of modern census-taking in the country,
derived its basic features from the United Nations Principles and Recommendations (2010) for
countries taking part in the 2010 round of population and housing census and experiences from
previous censuses.
9.2 Summary of Main Findings
9.2.1 Demographic characteristics
The La Nkwantanang Madina Municipality has a total population of 111,926 comprising 48.5
percent males as against 51.5 percent females with a sex ratio of 94.1, indicating that for every
100 female there are 94 males in the Municipality. The population of the Municipality is a
youthful one with a total dependency ratio of 47.2, which was lower than that of the region
(53.4). It has a total fertility rate of 2.5 and a crude birth rate of 22.5 per 1000 population, which
were slightly lower than the regional rates (TFR 2.6 and TDR 22.7 per 1000 respectively).
Mortality level is high in the Municipality. About six out of every ten persons in the
Municipality are migrants, mostly from the Eastern region.
9.2.2 Social Characteristics
The Municipality had a total of 108,051 households. Most households in the Municipality are
composed of head, spouse and children; male headship is found to be more common (36.5%) as
compared to female headship (17.6%). Households are mainly nuclear (Head, spouse(s) and
children). Of the population 12 years or older, more than half (51.2%) are never married while
37.2 percent are formally married (customary, church or ordinance). The population in the
Municipality was mostly Ghanaian by birth. On religious count, Christianity dominates
(Catholic, Protestant, Pentecostal/Charismatic and other Christians) in the Municipality.
About half of the never married population had attained Basic School (Primary, Middle and
JSS/JHS) while about 16 percent who are married had never been to school. A higher proportion
of males than females who are married had attained tertiary education. More than half (50.3%) of
the married population is employed. Seven out of ten of those never married are economically
not active perhaps because they were in full time schooling. The proportion of males who are
married but unemployed (19.7%) is less than that of their female counterparts (31.7%). More
than nine out of ten (91.3%) of the population 11 years or older are literates in English, any
Ghanaian language, or French. Non-literate females (5,694) are about three times more than that
of the males (1,921).

68
9.2.3 Economic Characteristics
The main occupation of most of the employed population in the Municipality is service and sales
work (35.5%). There are more males (12.9%) in professional occupation than females (8.2%).
More than a quarter (29.2%) of the working population are engaged in the wholesale, retail and
repair of motor vehicles and motor cycles, especially females (38.1%). This was consistent with
findings by the Ghana Statistical Service (2012) that females outnumbered their male
counterparts in wholesale and retail trade. Out of the economically active population, 92.3
percent are employed. Among the economically not active population, majority are persons in
full time education (56.7%). The age group 25-29 years had the highest number of employed
population (20.1%) in the Municipality. The private sector (both formal and informal) was the
main employer in the Municipality, with females forming the majority (55.0%) in self-employed
without employees, implying that more females are into petty trading where employees are not
needed.
9.2.4 Information Communication Technology
About eight out of ten persons (78.1%) livings in the Municipality have a mobile phone, with
most of them being males (82.0percent). Almost a quarter (24.9%) of the population 12 years
and older have access to Internet facility but more common among males (31.5%) than females
(18.7%). About six percent (5.6%) of the households have fixed telephone lines and 22.8 percent
of the households have desktop/laptop computers at home.
9.2.5 Disability
Almost three percent (2.7%) of the total population are disabled. Visual impairment (42.1%) is
the most common disability in the Municipality, especially among females. The proportion of
the population with disability in the rural localities (3.2%) is slightly higher than that of the
urban (2.7%).
Evidence also shows that 15.4 percent of PWDs indicated that highest level of education is
primary level, 12.3 percent attained JSS/JHS education, whereas 5.2 percent had attained
secondary education. A significant proportion (18.0%) of PWDs had never been to school, with
females (23.6%). About half (49.2%) of the persons with disability were economically not
active. However, among the economically active persons with disability, 46.5 percent are
employed while 4.3 percent were unemployed.
9.2.6 Agricultural Activities
Agricultural activity was not common in the Municipality due to its urban characteristics.
However, households who were engaged in agriculture were mainly into crop farming. Among
households who are into crop farming, 77.8 percent were found in urban localities compared to
22.2 percent in rural areas.
9.2.7 Housing
In the Municipality, a total of 28,270 households constitute an average of eight (8.2) persons
living in each house, with an average household size of 3.9. Household members (38.2%) own
majority of the houses in the Municipality.

69
The main construction material for outer walls and floors of dwelling units are Cement blocks/
Concrete. The main material for roofing of dwelling units is Metal Sheets (60.4%). Most
households (58.7%) occupy a single room, and nearly a quarter (24.3%) of total number of
households occupied two rooms.
Almost nine in every ten households (85.8%) are connected to the electricity main grid as their
main source of lighting. Though only one-third (34.6%) of households cook in their own separate
rooms, majority (89.1%) of them patronize either gas (52.9%) or charcoal (36.2%) as their fuel
for cooking.
Access to Water
Sachet water (61.9percent) was the main source of drinking water for most households in the
Municipality. Again, one-third (33.7%) of households depend on tanker supply/vendor for
supply of water for other domestic purposes, while 24.0 percent fetches water from pipe-borne
outside their dwelling unit.
Sanitary condition
With regard to toilet facilities, only 38.8 percent households in the Municipality use WC, while
23.4 percent resort to KVIP toilets. However, a significant proportion of households use public
toilet while other households lack toilet facilities and therefore used bushes/beaches. A close
percentage of households either share separate bathroom in the same house as their bathing
facility (32.2 %) or own bathroom for exclusive use only (31.1%).
Furthermore, about eighty percent of households their solid waste collected (67.9%) or thrown
into a container located at a designated public dump (12.1%). More also, almost half of
households either throw their liquid waste into gutters (26.2%) or unto their compounds (22.3%).
9.3 Conclusion
The La Nkwantanang Madina Municipality has a youthful population. Fertility and mortality
levels in the Municipality are generally low compared to both the regional and the national
averages. A significant proportion of the population of the Municipality are internal migrants.
Household members or private individuals own most houses in the Municipality. There is some
evidence of overcrowding in sleeping rooms as most people have only one sleeping room. The
private sector was the main employer in the Municipality. Females form a larger proportion of
population constituting self-employed without employees.
Sight impairment is the most common form of disability in the Metropolis, especially among
females. A higher proportion of males than females have access to formal education in the
Municipality. Public place of convenience is of great necessity to every society. In the
municipality, lack of hygienic toilet facilities or in some case no toilet facility in some localities
has contributed to outbreak of diarrhoea and cholera.
Repercussion of open defecation in bushes/beaches open is aggravated disposal of liquid waste
into residential gutters and compounds and this calls for imperative measures by community and
opinion leaders. This problem can partly be attributed to the significant level of literacy among
both the youth and elderly in the Municipality.
70
9.4 Policy Implications
The La Nkwantanang Madina Municipality had a youthful population and it also attracted a
significant proportion of migrants. The Municipal Assembly needs to make provision for basic
socio-economic infrastructure such as schools, healthcare centres, water and sanitation facilities
and recreational grounds for the growing population. There is the need for government to
intensify the decentralization process in the country to ensure that the provision of requisite
infrastructure and development projects are distributed across the country, paying attention to
needs preferences. This could reduce inter-regional migration into the La Nkwantanang Madina
Municipality.
Both fertility and mortality levels are slightly lower in the Municipality as compared to the
regional and national averages. This notwithstanding, there is still the need to reduce the rate of
child births in the Municipality in order to promote and sustain socio-economic development.
The Municipal Assembly needs to ensure that children are immunized through the national
immunization programme and also pregnant women access anti-natal care regularly to reduce
childhood and maternal morbidity and mortality.
Although literacy level in the Municipality was quite high, more males than females had access
to formal education resulting in a small proportion of female employees in the public sector
employment. There was therefore the need to encourage female education beyond the basic
school education to enable them contribute their quota to the socio-economic development of the
Municipality and the country as a whole. It has been noted that the level of education that a
female attains before or after marriage was key to the socio-economic status of the family and for
that matter the community.
Although there was low level of unemployment in the Municipality, opportunities for skills
training should be developed by the Municipal Assembly to provide job opportunities for the
teaming youth. Since the private sector was the main employer in the Municipality, public-
private partnership programmes should be encouraged to create job opportunities for the youth.
Given the high proportion of females who are mostly into self-employed businesses without
employees, the Municipal Assembly can organize them into associations so that financial
organizations could provide them with loans to expand their businesses.
Given the low level of ICT in the Municipality, there is the need for Private-Public Partnerships
(PPP) and other interventions to expand computer ownership and the use of Internet in the
Municipality. It is recommended that the Assembly should increase investment in ICT
infrastructure and services in schools and selected public places. This would not only increase
knowledge and application of ICT among the youth in particular but also it will link the
population of the Municipality to the rest of the region, nation and the world at large.
Although the proportion of the population living with disabilities was low (2.7percent) in the
Municipality, there is the need to address their plight and incorporate them into the development
agenda of the Municipality. The causes of the emotional, sight, physical and other disabilities
may be due to poor environmental conditions and lack of immunization of children at the right
ages. The Assembly should intensify its educational campaigns on immunization and sanitation
to reduce some preventable forms of disabilities in the Municipality.
71
The data on bathing and toilet facilities show that attention should be paid to the provision of
modern housing with bathing and toilet facilities. The Assembly should educate the people on
the consequences of disposing liquid waste into the gutters but in the long-run it should provide
an alternative means for disposing liquid waste. The use of gas as the main source of cooking
fuel in the Municipality was quiet impressive but the use of charcoal as the second major source
of cooking fuel has negative implications on the environment. It could lead to rapid deforestation
if not addressed. The use of gas should be encouraged to curb the use of wood and charcoal in
the Municipality.

72
REFERENCES
Dickson, K. B. Benneh, G. (2001). A new geography of Ghana, Revised edition. Longman
Group Ltd, England.
Ghana Statistical Service (2012). 2010 Population and Housing Census. Summary Report of
Final Results, GSS, Accra.
Institute of Statistical, Social and Economic Research (2000). The State of the Ghanaian
Economy in 1999. Legon: University of Ghana.
Institute of Statistical, Social and Economic Research (2011). The State of the Ghanaian
Economy in 2010. Legon: University of Ghana.
Tanle, A. & Awusabo-Asare, K. (2007): The kaya yei phenomenon in Ghana: Female migration
from the Upper-West region to Kumasi and Accra. The Oguaa Journal of Social Science.
4 (2): 139-164.
Tanle, A. (2010). Livelihood status of migrants from the northern savannah zone resident in the
Obuasi and Techiman Municipalities. A Ph.D. Thesis submitted to the Department of
Population and Health, University of Cape Coast, Cape Coast, Ghana.
Tanle, A. and Kendie, S. B. (2013). Sanitation: A drawback to achieving the Millennium
Development Goals? The situation in Ghana. Journal of Arts and Social Sciences,
1(2):125-147.
Vallin, J. (2007). Commentary: ‘epidemiologic transition’ interrupted or sweep to the second
stage of health transition? International Journal of Epidemiology,
doi:10.1093/ije/dym054.
Yendaw, E., Tanle, A. and Kumi-Kyereme, A. (2013). Socio-Economic Status of International
Return Migrants to the Berekum Municipality, Ghana. International Journal of Business
and Social Science, 4(10): 272-284.
www.ijbssnet.com/update/index.php/archive.html

73
APPENDICES
Table A1: Household composition by type of locality
Household Composition
Total Urban Rural
Number Percent Number Percent Number Percent
Total 108,051 100.0
90,732 100.0
17,319 100.0
Head only 6,105 5.7
5,225 5.8
880 5.1
Household with head and a spouse
only 2,652 2.5
2,172 2.4
480 2.8
Household with head and
biological/adopted children only 9,769 9.0
8,101 8.9
1,668 9.6
Household with head spouse(s) and
biological/adopted children only 27,383 25.3
22,039 24.3
5,344 30.9
Household with head spouse(s)
biological/adopted children and
relatives of the head only
20,834 19.3
17,706 19.5
3,128 18.1
Household with head spouse(s)
biological/adopted children relatives
and nonrelatives of the head
3,326 3.1
2,890 3.2
436 2.5
Household with head spouse(s) and
other composition 5,102 4.7
4,184 4.6
918 5.3
Household with head
biological/adopted children and
relatives of the head only
14,351 13.3
12,420 13.7
1,931 11.1
Household with head
biological/adopted children relatives
and nonrelatives of the head
2,714 2.5
2,436 2.7
278 1.6
Household with head and other
composition but no spouse 15,815 14.6 13,559 14.9 2,256 13.0
Source: Ghana Statistical Service, 2010 Population and Housing Census

74
Table A2: Population 3 years and older by sex, disability type and level of education
Sex/Disability type Total
Educational level attained
Never
attended Nursery
Kinder
garten Primary
Middle
/JSS/
JHS
Sec.
/SSS
/SHS
Voc./
Tech./
Comm.
Post
sec
Bachelor
degree
Post graduate
(Cert. Diploma
Masters PHD etc.)
Both Sexes
Total 104,397 8,516 2,459 4,098 20,696 30,917 17,448 3,895 7,661 7,166 1,541
No disability 101,387 7,975 2,437 4,077 20,232 30,001 17,031 3,758 7,425 6,983 1,468
With a disability 3,010 541 22 21 464 916 417 137 236 183 73
Sight 1,278 197 6 3 130 426 174 60 130 101 51
Hearing 337 84 3 4 63 88 42 12 15 18 8
Speech 326 86 3 8 63 81 33 16 14 15 7
Physical 686 178 5 3 100 203 80 33 42 28 14
Intellectual 583 158 9 3 149 134 84 13 12 16 5
Emotional 427 67 7 3 74 113 72 19 28 36 8
Other 339 58 6 3 63 99 46 18 27 8 11
Male
Total 50,503 2,368 1,248 2,117 9,281 14,708 9,321 1,856 4,087 4,358 1,159
No disability 49,050 2,194 1,236 2,103 9,067 14,274 9,081 1,786 3,967 4,242 1,100
With a disability 1,453 174 12 14 214 434 240 70 120 116 59
Sight 571 53 3 3 53 190 80 30 64 57 38
Hearing 170 38 2 4 28 41 25 6 9 10 7
Speech 177 42 1 7 36 42 17 8 8 10 6
Physical 298 51 2 2 27 93 54 18 19 20 12
Intellectual 321 67 4 1 90 71 58 4 7 14 5
Emotional 207 30 3 1 29 56 33 6 19 22 8
Other 163 19 2 1 24 48 29 9 14 7 10
Female
Total 53,894 6,148 1,211 1,981 11,415 16,209 8,127 2,039 3,574 2,808 382
No disability 52,337 5,781 1,201 1,974 11,165 15,727 7,950 1,972 3,458 2,741 368
With a disability 1,557 367 10 7 250 482 177 67 116 67 14
Sight 707 144 3 0 77 236 94 30 66 44 13
Hearing 167 46 1 0 35 47 17 6 6 8 1
Speech 149 44 2 1 27 39 16 8 6 5 1
Physical 388 127 3 1 73 110 26 15 23 8 2
Intellectual 262 91 5 2 59 63 26 9 5 2 0
Emotional 220 37 4 2 45 57 39 13 9 14 0
Other 176 39 4 2 39 51 17 9 13 1 1 Source: Ghana Statistical Service, 2010 Population and Housing Census
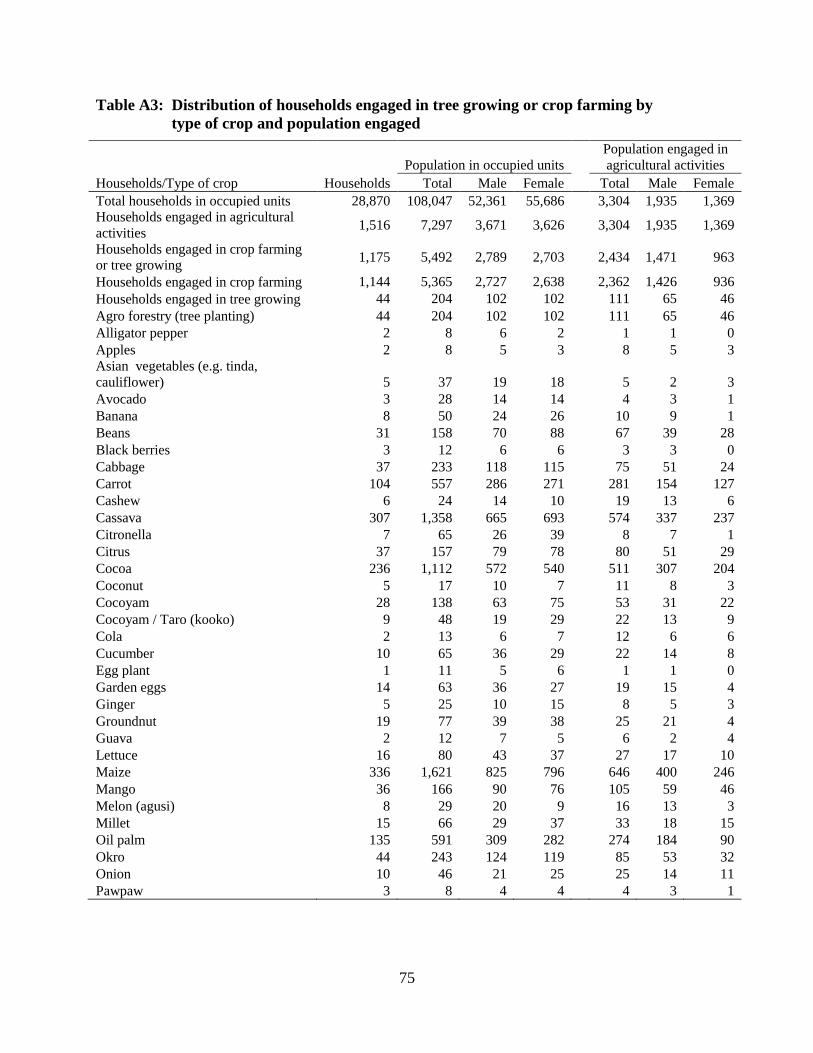
75
Table A3: Distribution of households engaged in tree growing or crop farming by
type of crop and population engaged
Households/Type of crop Households
Population in occupied units
Population engaged in
agricultural activities
Total Male Female Total Male Female
Total households in occupied units 28,870 108,047 52,361 55,686
3,304 1,935 1,369
Households engaged in agricultural
activities 1,516 7,297 3,671 3,626
3,304 1,935 1,369
Households engaged in crop farming
or tree growing 1,175 5,492 2,789 2,703
2,434 1,471 963
Households engaged in crop farming 1,144 5,365 2,727 2,638
2,362 1,426 936
Households engaged in tree growing 44 204 102 102
111 65 46
Agro forestry (tree planting) 44 204 102 102
111 65 46
Alligator pepper 2 8 6 2
1 1 0
Apples 2 8 5 3
8 5 3
Asian vegetables (e.g. tinda,
cauliflower) 5 37 19 18
5 2 3
Avocado 3 28 14 14
4 3 1
Banana 8 50 24 26
10 9 1
Beans 31 158 70 88
67 39 28
Black berries 3 12 6 6
3 3 0
Cabbage 37 233 118 115
75 51 24
Carrot 104 557 286 271
281 154 127
Cashew 6 24 14 10
19 13 6
Cassava 307 1,358 665 693
574 337 237
Citronella 7 65 26 39
8 7 1
Citrus 37 157 79 78
80 51 29
Cocoa 236 1,112 572 540
511 307 204
Coconut 5 17 10 7
11 8 3
Cocoyam 28 138 63 75
53 31 22
Cocoyam / Taro (kooko) 9 48 19 29
22 13 9
Cola 2 13 6 7
12 6 6
Cucumber 10 65 36 29
22 14 8
Egg plant 1 11 5 6
1 1 0
Garden eggs 14 63 36 27
19 15 4
Ginger 5 25 10 15
8 5 3
Groundnut 19 77 39 38
25 21 4
Guava 2 12 7 5
6 2 4
Lettuce 16 80 43 37
27 17 10
Maize 336 1,621 825 796
646 400 246
Mango 36 166 90 76
105 59 46
Melon (agusi) 8 29 20 9
16 13 3
Millet 15 66 29 37
33 18 15
Oil palm 135 591 309 282
274 184 90
Okro 44 243 124 119
85 53 32
Onion 10 46 21 25
25 14 11
Pawpaw 3 8 4 4
4 3 1

76
Table A3: Distribution of households engaged in tree growing or crop farming by type of
crop and population engaged (cont’d)
Households/Type of crop Households
Population in occupied
units
Population engaged in
agricultural activities
Total Male Female Total Male Female
Peas 5
35 18 17
9 5 4
Pepper 74
397 206 191
143 86 57
Pineapple 18
84 41 43
35 22 13
Plantain 159
723 359 364
317 189 128
Potatoes 7
50 26 24
17 9 8
Rice 22
91 47 44
35 25 10
Rubber 3
24 7 17
2 1 1
Shallot 2
10 7 3
8 5 3
Sorghum 3
5 4 1
3 3 0
Soya beans 1
1 1 0
1 1 0
Spinach 1
5 1 4
5 1 4
Sugarcane 9
27 16 11
9 9 0
Sun flower 2
10 8 2
10 8 2
Sweet pepper 3
13 7 6
3 3 0
Sweet potatoes 3
11 7 4
4 4 0
Tobacco 3
12 8 4
4 3 1
Tomatoes 49
242 127 115
90 65 25
Water melon 6
31 17 14
16 12 4
Yam 48
216 109 107
78 52 26
Other (specify) 55 264 136 128 110 68 42 Source: Ghana Statistical Service, 2010 Population and Housing Census

77
Table A4: Population by sex, number of households and houses in the
20 largest communities
S/No. Community Name Total
Sex House
holds Houses Male Female
1 Madina 79,832 38,515 41,317 20,586 8,486
2 Adenta West 12,495 6,074 6,421 3,289 2,313
3 Oyarifa 4,283 2,052 2,231 1,109 553
4 Amanfrokoo 2,073 1,027 1,046 547 342
5 Pantang Hospital 1,714 872 842 398 60
6 Pantang Village 1,478 741 737 390 182
7 Oshiyie 1,441 715 726 363 220
8 Teiman 1,067 519 548 269 149
9 Damfa 1,062 533 529 238 173
10 Amrahia 983 490 493 256 168
11 Adoteiman 930 483 447 275 156
12 Nyamekrom 824 410 414 187 162
13 Amanfro 816 403 413 240 119
14 Aboman 627 301 326 157 116
15 Adenta 588 296 292 144 117
16 Kplenkoo 557 278 279 146 89
17 Malejor 422 202 220 103 95
18 Otinibi 381 179 202 78 67
19 Kweiman 269 134 135 69 56
20 New Kweiman 84 47 37 26 24 Source: Ghana Statistical Service, 2010 Population and Housing Census

78
Table A5: Population by age group in the 20 largest communities
S/No.
Community
Name
All
ages
Age group
0-4 5-9 10-14 15-19 20-24 25-29 30-34 35-39 40-44 45-49 50-54 55-59 60-64 65-69 70-74 75+
1 Madina 79,832 8,087 6,712 7,304 8,235 10,805 10,104 7,248 5,448 4,090 3,161 2,610 1,781 1,340 920 829 1,158
2 Adenta West 12,495 1,484 1,139 1,096 1,187 1,441 1,515 1,202 959 672 480 422 271 217 133 138 139
3 Oyarifa 4,283 561 468 430 402 472 495 404 308 221 144 115 90 55 38 32 48
4 Amanfrokoo 2,073 246 199 159 217 239 240 218 156 94 86 84 36 26 15 11 47
5
Pantang
Hospital 1,714 150 78 109 117 342 296 153 140 79 63 58 59 35 16 9 10
6
Pantang
Village 1,478 211 192 175 128 116 148 119 109 70 67 52 27 27 12 12 13
7 Oshiyie 1,441 209 134 146 132 136 169 131 135 82 53 37 26 19 13 12 7
8 Teiman 1,067 111 109 87 90 156 151 104 82 60 38 24 22 17 4 7 5
9 Damfa 1,062 126 115 88 95 127 131 114 71 54 45 32 20 17 15 4 8
10 Amrahia 983 113 111 96 88 98 119 86 70 58 43 35 12 16 10 13 15
11 Adoteiman 930 106 102 84 77 124 122 82 76 53 29 30 20 9 7 3 6
12 Nyamekrom 824 120 84 97 69 92 84 74 51 46 37 19 15 13 12 6 5
13 Amanfro 816 89 68 98 93 102 86 68 56 48 49 20 10 10 5 5 9
14 Aboman 627 93 67 72 55 52 70 61 50 33 18 11 9 9 11 8 8
15 Adenta 588 63 59 46 56 68 69 49 55 29 27 22 14 11 9 5 6
16 Kplenkoo 557 66 67 56 47 57 66 53 45 33 28 20 7 3 2 1 6
17 Malejor 422 77 48 34 30 42 41 40 44 27 12 6 5 11 1 1 3
18 Otinibi 381 46 44 43 42 26 37 31 39 28 13 17 5 2 5 0 3
19 Kweiman 269 33 30 23 19 30 41 27 11 22 11 14 2 2 1 0 3
20
New
Kweiman 84 10 8 7 12 8 7 10 5 5 5 2 1 0 1 0 3 Source: Ghana Statistical Service, 2010 Population and Housing Census
79
LIST OF CONTRIBUTORS
Project Secretariat
Dr. Philomena Nyarko, Government Statistician
Mr. Baah Wadieh, Deputy Government Statistician
Mr. David Yenukwa Kombat, Acting Census Coordinator
Mr. Sylvester Gyamfi, DISDAP Project Coordinator
Mrs. Abena A. Osei-Akoto, Data Processing
Mr. Rochester Appiah Kubi Boateng, Data Processing
Mrs. Jacqueline Anum, Data Processing
Mrs. Samilia Mintah, Data Processing
Mr. Yaw Misefa, Data Processing
Mr. Ernest Enyan, Data Processing
Mr. Christian Assem, Regional Statistician
Ms. Hanna Frempong Konadu, Formatting/Typesetting
Ms. Justina Yeboah, Formatting/Typesetting
Ms. Georgina Anagli, Formatting/Typesetting
Writers
Mr. Osman Suleman
Mr. Ebenezer Akwasi Adarkwa
Consultant
Dr. A. Tanle
Editor/ Reviewers
Prof. Imoro Braimah
Mr. David Maxwell Bessah
Mr. Johnson Owusu Kagya