kurenai : kyoto university research information...
TRANSCRIPT
Title Detection of the gravitational lens magnifying a type Iasupernova.
Author(s)
Quimby, Robert M; Oguri, Masamune; More, Anupreeta;More, Surhud; Moriya, Takashi J; Werner, Marcus C; Tanaka,Masayuki; Folatelli, Gaston; Bersten, Melina C; Maeda,Keiichi; Nomoto, Ken'ichi
Citation Science (2014), 344(6182): 396-399
Issue Date 2014-04-25
URL http://hdl.handle.net/2433/186162
Right
© 2014 American Association for the Advancement ofScience.; This is not the published version. Please cite only thepublished version. この論文は出版社版でありません。引用の際には出版社版をご確認ご利用ください。
Type Journal Article
Textversion author
Kyoto University

Dete tion of the Gravitational Lens Magnifying a
Type Ia Supernova
Robert M. Quimby,
1∗Masamune Oguri,
1,2Anupreeta More,
1Surhud More,
1
Takashi J. Moriya,
3,4Mar us C. Werner,
1Masayuki Tanaka,
5Gaston Folatelli,
1
Melina C. Bersten,
1Keii hi Maeda,
6and Ken'i hi Nomoto,
1
1Kavli Institute for the Physi s and Mathemati s of the Universe (WPI),
Todai Institutes for Advan ed Study, The University of Tokyo,
5-1-5 Kashiwanoha, Kashiwa-shi, Chiba, 277-8583, Japan
2Department of Physi s, The University of Tokyo, Tokyo 113-0033, Japan
3Argelander Institute for Astronomy, University of Bonn
Auf dem Hugel 71, D-53121 Bonn, Germany
4Resear h Center for the Early Universe, Graduate S hool of S ien e
University of Tokyo, Hongo 7-3-1, Bunkyo, Tokyo 113-0033, Japan
5National Astronomi al Observatory of Japan
2-21-1 Osawa, Mitaka, Tokyo 181-8588, JAPAN
6Department of Astronomy, Kyoto University, Kitashirakawa-Oiwake- ho
Sakyo-ku, Kyoto 606-8502, Japan
∗To whom orresponden e should be addressed; E-mail: robert.quimby�ipmu.jp.
Obje ts of known brightness, like Type Ia supernovae (SNIa), an be used to
measure distan es. If a massive obje t warps spa etime to form multiple im-
ages of a ba kground SNIa, a dire t test of osmi expansion is also possible.
However, these lensing events must �rst be distinguished from other rare phe-
nomena. Re ently, a supernova was found to shine mu h brighter than normal
for its distan e, whi h resulted in a debate: was it a new type of superluminous
1
supernova or a normal SNIa magni�ed by a hidden gravitational lens? Here
we report that a spe trum obtained after the supernova faded away shows the
presen e of a foreground galaxy�the �rst found to strongly magnify a SNIa.
We dis uss how more lensed SNIa may be found than previously predi ted.
A pe uliar supernova, PS1-10afx, was dis overed by the Panorami Survey Teles ope &
Rapid Response System 1 (Pan-STARRS1) on 2010 August 31 (UT) (1). The unusually red
olor of the obje t spurred the Pan-STARRS1 team to ondu t an array of follow-up observa-
tions in luding opti al and near infrared spe tros opy, whi h yielded a redshift of z = 1.39.
Combined with relatively bright photometri dete tions, this redshift would imply a peak lumi-
nosity of 4× 1044 erg s−1, whi h is 400 times brighter than the typi al ore- ollapse supernova.
A rare lass of superluminous supernovae (SLSN) (2) have shown similarly high bolometri
outputs, but PS1-10afx distinguishes itself from all other SLSN on two important ounts: PS1-
10afx is mu h redder ( ooler) and evolved mu h faster than any SLSN. A generi feature of
SLSN models (3�9) is that they employ high temperatures and/or large photospheri radii to
generate high luminosities (re alling that L ∝ T 4R2). The observations of PS1-10afx do not �t
with these models, suggesting that if it is a SLSN, it is in a lass of its own.
An alternate hypothesis (10) is that PS1-10afx is a tually a regular Type Ia supernova (SNIa)
with a normal luminosity, but its apparent brightness has been magni�ed by a gravitational lens.
Spe tra of PS1-10afx are well �t by normal SNIa templates, as are the olors and light urve
shapes. However, normal SNIa exhibit a tight relation between the widths of their light urves
and their peak luminosities (11�14), and PS1-10afx appears 30 times brighter than expe ted
a ording to this relation. Su h a large magni� ation of brightness an only o ur naturally
from strong gravitational lensing, whereby the light emanating from the supernova is bent to
form an Einstein-Chwolson ring, or several dis rete magni�ed images (typi ally two or four)
if the alignment is not axisymmetri . Pan-STARRS1 has surveyed suf� ient volume to expe t
2
su h a han e alignment (15, 16) and it is possible that the angular extent of the lensed images
was simply too small to be resolved by the observations available. However, for this hypothesis
to be on�rmed, we must explain why the existing observations give su h on lusive photo-
metri and spe tros opi eviden e for the presen e of the supernova's host galaxy, but the same
observations fail to obviously indi ate the presen e of a foreground lens.
We used the Ke k-I teles ope with the Low-Resolution Imaging Spe trograph (LRIS) (17)
with the upgraded red hannel (18) to observe the host galaxy and any foreground obje ts at
the sky position of PS1-10afx on 2013 September 7 (see Fig. S1) (16). As illustrated in �gure
1, there are two narrow emission features that persist at the lo ation of PS1-10afx now that the
supernova itself has faded away. The [O II℄ emission doublet (λλ = 3726.1, 3728.8
A in the
rest frame) from the host galaxy previously identi�ed (1) is learly re overed (Fig. S2), but
we additionally dete ted a se ond emission line at about 7890
A. Be ause there are no strong
emission lines expe ted from the host at this wavelength (∼3300
A in the host frame), this
dete tion suggests the presen e of a se ond obje t oin ident with PS1-10afx.
The most probable identi� ation for the 7890
A feature is [O II℄ at z = 1.1168 ± 0.0001.
At this redshift, other strong emission lines su h as H-beta or [O III℄ would lie outside of
our wavelength overage. However, as depi ted in �gure 1, we dete ted a Mg II absorption
doublet (λλ = 2795.5, 2802.7
A in the rest frame) at z = 1.1165 ± 0.0001. Blueshifted ab-
sorption out�ows are typi al of star-forming galaxies (19), so this estimate is ompatible with
that derived from the emission lines. We also identify possible Mg I (λ = 2853.0) and Fe II
(λ = 2344.2, 2373.7, 2382.8, 2586.7, 2600.2) lines with a mat hing redshift. Given these identi-
� ations and the extended nature of the emission (see Fig. S3), it is lear that the se ond obje t
is a galaxy lying in front of PS1-10afx and its host. Indeed, the near maximum light spe tra of
PS1-10afx (1) show what ould be Ca II absorption from this foreground galaxy (Fig. 1).
With its redshift se ure, we next he ked whether the foreground galaxy an satisfy the lens
3
requirements of PS1-10afx (10). To do this, we derived a stellar mass for the foreground galaxy
and used an empiri al relation between stellar mass and 1-D velo ity dispersion as explained
below. We �tted a set of single stellar population (SSP) models to the ombined spe tra to mea-
sure the stellar masses of the host and foreground galaxies (see Figs. 2 and S4) (16). The best-�t
SSP ombination was a ∼1Gyr old foreground galaxy with a stellar mass of (9± 2)× 109M⊙
and a more distant host galaxy with (7 ± 1) × 109M⊙ and a younger (∼0.1Gyr) population.
The extin tion in the foreground galaxy is onsistent with zero (AV = 0.28+0.48−0.28), but the host
galaxy requires signi� ant reddening (AV = 1.62± 0.18).
Stellar mass ontributes only a fra tion of a galaxy's total mass, whi h is usually domi-
nated by dark matter. The ratio of these masses varies from galaxy to galaxy, but they are
strongly orrelated. Using the stellar-mass-to-velo ity-dispersion relation measured from the
SDSS DR7 spe tros opi sample (20, 21) (see Fig. S5), we inferred a probability distribution
for the foreground galaxy's velo ity dispersion (16). We then used this as input to a Monte Carlo
simulation from whi h we derived the posterior distributions for the lens parameters (Fig. 3).
We �nd that the redshift and mass of the foreground galaxy make it fully onsistent with a grav-
itational lens that is apable of satisfying the magni� ation, image separation limits, and time
delay onstraints of PS1-10afx (10). We thus on luded that PS1-10afx is not a superluminous
supernova but a normal SNIa magni�ed by a strong gravitational lens at z = 1.1168.
Our new data further explain why the lensing galaxy was not evident in prior observations.
Even though the host galaxy is slightly less massive, more extinguished, and farther away than
the lensing galaxy, it harbors a younger stellar population that shines more brightly per unit
mass. Be ause of this, the foreground obje t is only omparable in brightness to the host over a
narrow range of wavelengths longer than the lensing galaxy's 4000
A break but shorter than the
host's. This makes it dif� ult to see the light from the lens galaxy over the glare from the host
galaxy.
4

The la k of multiple images or signs of time delay from PS1-10afx an also be explained
from our Monte Carlo simulations. The high total magni� ation of PS1-10afx is best re overed
from alignments that produ e four images (79% probability of a �quad� system), but the maxi-
mum separation between the different multiple images is small (∆θ < 0.12′′ at 95% on�den e)
and the maximum phase delay is short (∆t < 1.3 day at 95% on�den e). The available ob-
servations of PS1-10afx are thus likely insuf� ient to resolve any effe ts from the gravitational
lensing other than its magni� ation.
In the future, high angular resolution imaging enabled by adaptive opti s (AO) or spa e-
based resour es like the Hubble Spa e Teles ope (HST) ould be used to spatially resolve the
multiple images of gravitational lensed SNIa like PS1-10afx. This would not only provide
immediate on�rmation that gravitational lensing is at play, but it would also provide important
onstraints on the nature of the lens. In theory, multiple epo hs of high resolution imaging
ould be used to measure the time delay between ea h image and the magni� ation fa tors for
ea h. Su h observations ould yield strong onstraints on osmi expansion.
Be ause the universe is expanding, the path lengths of the more delayed images will be
stret hed more by osmi expansion, and the magnitude of this delay is dire tly tied to the
Hubble parameter (22). However, the time delay is also dependent on the mass density pro�le
of the lens, whi h will be di tated by unobservable dark matter. For obje ts of known brightness,
like SNIa, we an use the readily measurable magni� ation to break this degenera y (23). As is
likely the ase for PS1-10afx, spe tra taken near maximum light an reveal not only the redshift
of the supernova but, using absorption line spe tros opy, the redshift and velo ity dispersion of
the lens as well. (Note that at maximum light, the resolving power available from Ke k/LRIS
may have been suf� ient to resolve the Ca II K line from the lens, but the signal-to-noise ratio
and resolution of the available observations is too low: σ < 125 km s
−1at 95% on�den e.)
Thus, future dis overies of gravitationally lensed SNIa may be used to make a dire t and pre ise
5

measurement of the Hubble onstant, but only if the needed follow-up observations ommen e
in a timely manner.
To begin follow-up observations of lensed SNIa andidates while they are still on the rise
(needed for a urate delay time measurements) or near maximum light (the optimal phase for
absorption line spe tros opy), an ef� ient vetting pro ess must be employed to eliminate the
non-lensed supernovae that out number lensed SNIa by a few thousand to one. A means to
a omplish this feat was demonstrated by the sele tion of PS1-10afx for follow-up by the Pan-
STARRS1 team � they were �rst motivated to examine PS1-10afx based on its unusually red
olor (1). In �gure 4 we show a olor-magnitude diagram for observed supernovae (16). PS1-
10afx showed a olor near maximum light of r−i ∼ 1.7whereas un-lensed supernovae brighter
than the Pan-STARRS1 dete tion limits have r − i < 0.5. (Note that quies ent galaxy light is
removed from these measurements using pre-supernova images). Sin e the lensing probability
in reases with redshift and, for a given sky area, the number of supernovae also in reases with
redshift (be ause of both rates and in reased volume), the majority of lensed SNIa expe ted
from a �ux limited survey will be high redshift events that will typi ally appear mu h redder
than the more nearby population of un-lensed supernovae. We thus propose that sele ting su-
pernovae with olors redder that the bold line in �gure 4 (for a given i-band magnitude) during
their rise to peak may be an effe tive way to identify lensed supernovae. This will bypass the
need to dete t multiple, resolved images and will thus in rease the expe ted number of lensed
SN Ia from future surveys by a fa tor of 5 over traditional sele tion te hniques.
The large magni� ation and relatively low-mass lens galaxy of PS1-10afx may prove typi al
of gravitationally lensed SNIa that will be dis overed by future, �ux-limited surveys given
sele tion bias: brighter obje ts are easier to dete t, and unresolved images formed by a low-
mas lens effe tively make a single, brighter obje t (16) (see Fig. S6). Alternatively, the lens
mass and high magni� ation of PS1-10afx may indi ate a problem with our understanding of
6

the starlight to dark matter onne tion in the early universe. Further studies of this system are
thus warranted. A multi-wavelength, high-angular-resolution study of the lens and host galaxies
with HST, ground based AO, and the Ata ama Large Millimeter/submillimeter Array (ALMA)
ould further onstrain the lensing model and provide an important referen e for future studies
of gravitationally lensed SNIa.
Referen es and Notes
1. R. Chorno k, et al., ApJ 767, 162 (2013).
2. A. Gal-Yam, S ien e 337, 927 (2012).
3. G. Rakavy, G. Shaviv, Z. Zinamon, ApJ 150, 131 (1967).
4. Z. Barkat, G. Rakavy, N. Sa k, Physi al Review Letters 18, 379 (1967).
5. S. E. Woosley, S. Blinnikov, A. Heger, Nature 450, 390 (2007).
6. S. E. Woosley, ApJ 719, L204 (2010).
7. D. Kasen, L. Bildsten, ApJ 717, 245 (2010).
8. R. A. Chevalier, C. M. Irwin, ApJ 729, L6 (2011).
9. T. J. Moriya, et al., MNRAS 428, 1020 (2013).
10. R. M. Quimby, et al., ApJ 768, L20 (2013).
11. M. M. Phillips, et al., AJ 118, 1766 (1999).
12. S. Jha, A. G. Riess, R. P. Kirshner, ApJ 659, 122 (2007).
13. M. Hi ken, et al., ApJ 700, 1097 (2009).
7

14. M. Sullivan, et al.,MNRAS 406, 782 (2010).
15. M. Oguri, P. J. Marshall,MNRAS 405, 2579 (2010).
16. Additional information is available in the supplementary materials.
17. J. B. Oke, et al., PASP 107, 375 (1995).
18. C. Ro kosi, et al., So iety of Photo-Opti al Instrumentation Engineers (SPIE) Conferen e
Series (2010), vol. 7735 of So iety of Photo-Opti al Instrumentation Engineers (SPIE)
Conferen e Series.
19. D. K. Erb, A. M. Quider, A. L. Henry, C. L. Martin, ApJ 759, 26 (2012).
20. G. Kauffmann, et al.,MNRAS 341, 33 (2003).
21. M. R. Blanton, et al., AJ 129, 2562 (2005).
22. S. Refsdal, MNRAS 128, 307 (1964).
23. M. Oguri, Y. Kawano,MNRAS 338, L25 (2003).
24. A. V. Filippenko, PASP 94, 715 (1982).
25. R. W. Hanus hik, A&A 407, 1157 (2003).
26. IRAF is distributed by the National Opti al Astronomy Observatory, whi h is operated
by the Asso iation of Universities for Resear h in Astronomy (AURA) under ooperative
agreement with the National S ien e Foundation.
27. C. Buton, et al., A&A 549, A8 (2013).
28. P. G. van Dokkum, PASP 113, 1420 (2001).
8

29. D. D. Kelson, PASP 115, 688 (2003).
30. V. C. Rubin, W. K. J. Ford, N. . Thonnard, ApJ 238, 471 (1980).
31. M. Cappellari, E. Emsellem, PASP 116, 138 (2004).
32. G. Bruzual, S. Charlot,MNRAS 344, 1000 (2003).
33. S. D. J. Gwyn, PASP 120, 212 (2008).
34. B. C. Kelly, ApJ 665, 1489 (2007).
35. M. Oguri, PASJ 62, 1017 (2010).
36. R. Bezanson, et al., ApJ 737, L31 (2011).
37. W. Li, et al., MNRAS 412, 1441 (2011).
38. See http://supernova.lbl.gov/∼nugent/nugent templates.html.
39. E. Y. Hsiao, et al., ApJ 663, 1187 (2007).
40. O. Graur, et al.,MNRAS 417, 916 (2011).
41. M. Bernardi, et al.,MNRAS 404, 2087 (2010).
42. J. Guy, et al., A&A 523, A7 (2010).
43. S. Belli, A. B. Newman, R. S. Ellis, ArXiv e-prints (2013).
44. A knowledgments: This work was supported in part by the Kakenhi Grant-in-Aid for
Young S ientists (B)(24740118) from the Japan So iety for the Promotion of S ien e, the
World Premier International Resear h Center Initiative, MEXT, Japan, the FIRST program,
�Subaru Measurements of Images and Redshifts (SuMIRe),� and by the Japan So iety for
9

the Promotion of S ien e Resear h Fellowship for Young S ientists (23-5929). The data
presented herein were obtained at the W.M. Ke k Observatory, whi h is operated as a s i-
enti� partnership among the California Institute of Te hnology, the University of Califor-
nia and the National Aeronauti s and Spa e Administration. The Observatory was made
possible by the generous �nan ial support of the W.M. Ke k Foundation. The data pre-
sented in this paper are available from the Weizmann Intera tive Supernova Data Repository
(www.weizmann.a .il/astrophysi s/wiserep).
10
host [O II]
lens [O II]
PS1−10afxPS1−10afx (smoothed)host + lenshost + lens (smoothed)
4000 6000 8000 10000Observed wavelength (Å)
−1
0
1
2
3
4
5
6
Flu
x (1
0−1
8 erg
s−1
cm
−2 Å
−1)
2780 2790 2800 2810Lens−frame wavelength (Å)
Mg II
2780 2790 2800 2810Host−frame wavelength (Å)
Mg II
3900 3920 3940 3960 3980 4000Lens−frame wavelength (Å)
Ca II
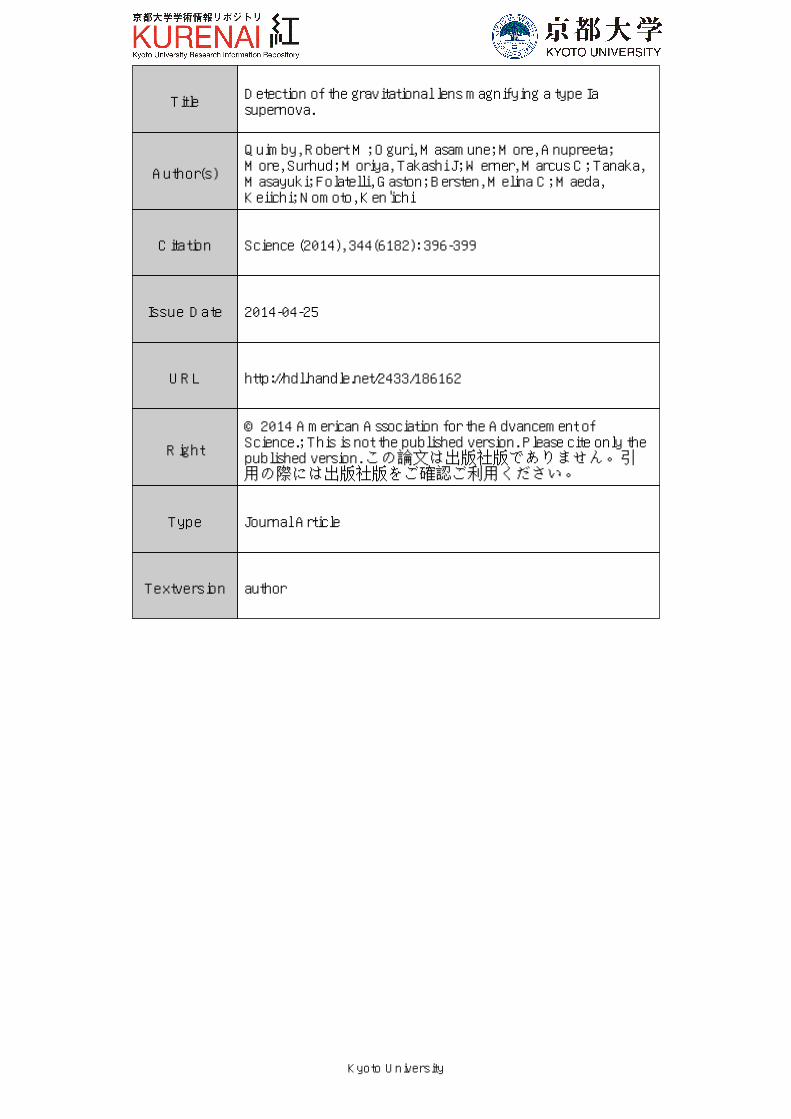
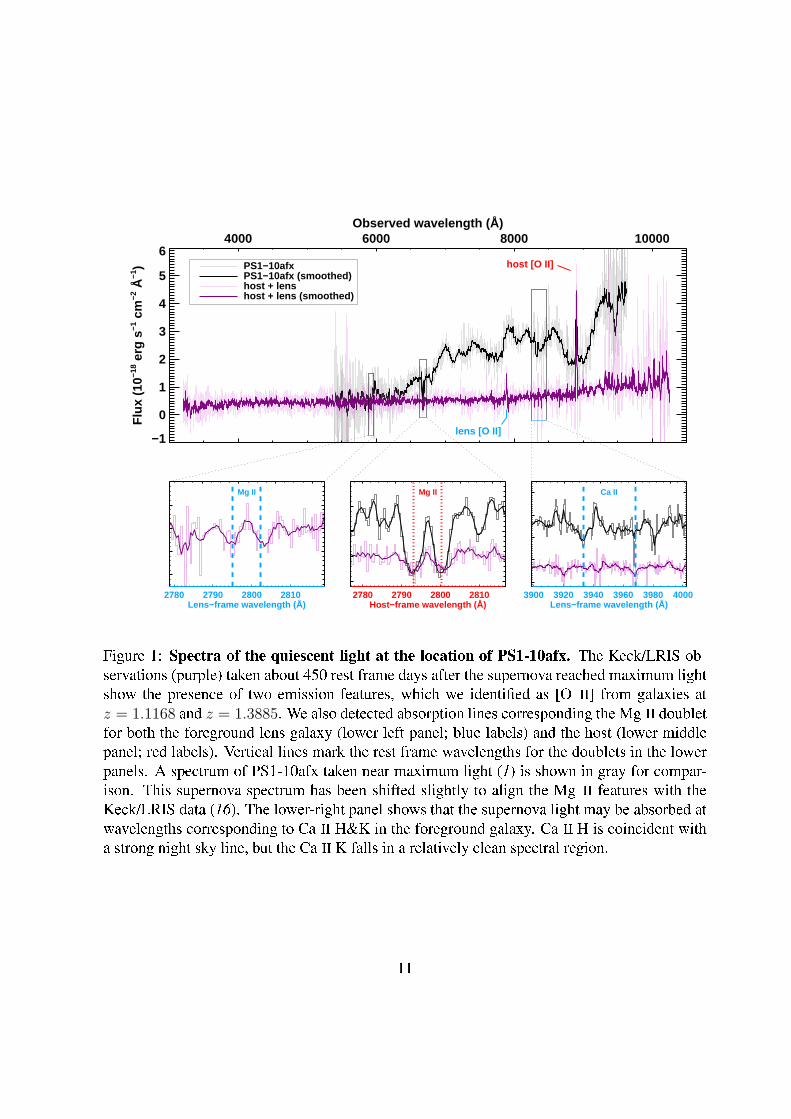
Figure 1: Spe tra of the quies ent light at the lo ation of PS1-10afx. The Ke k/LRIS ob-
servations (purple) taken about 450 rest frame days after the supernova rea hed maximum light
show the presen e of two emission features, whi h we identi�ed as [O II℄ from galaxies at
z = 1.1168 and z = 1.3885. We also dete ted absorption lines orresponding the Mg II doublet
for both the foreground lens galaxy (lower left panel; blue labels) and the host (lower middle
panel; red labels). Verti al lines mark the rest frame wavelengths for the doublets in the lower
panels. A spe trum of PS1-10afx taken near maximum light (1) is shown in gray for ompar-
ison. This supernova spe trum has been shifted slightly to align the Mg II features with the
Ke k/LRIS data (16). The lower-right panel shows that the supernova light may be absorbed at
wavelengths orresponding to Ca II H&K in the foreground galaxy. Ca II H is oin ident with
a strong night sky line, but the Ca II K falls in a relatively lean spe tral region.
11

datahost + lenshostlens
7500 8000 8500 9000 9500Observed wavelength (Å)
10−19
10−18
10−17
Flu
x (e
rg s
−1 c
m−2
Å−1
)
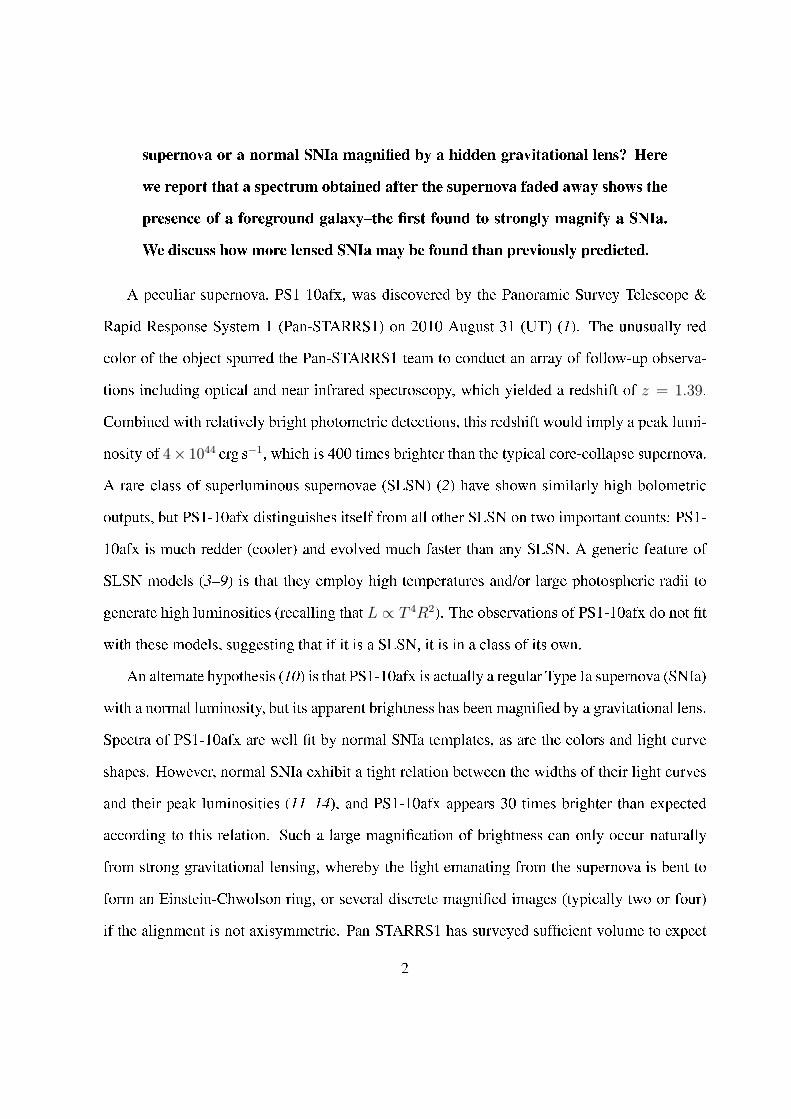
Figure 2: De omposition of the observed spe tra into lens and host galaxy omponents.
We modeled the lens (blue line) and host (red line) as single stellar populations at z = 1.1168and z = 1.3885, respe tively. We varied the age and total stellar mass of ea h galaxy in order
to �nd the sum (purple line) that best mat hed the observed spe tra (gray; smoothed spe tra in
bla k). The models only in lude starlight; light emitted by gas, su h as the [O II℄ lines seen at
about 8900
A and 7900
A, is negle ted.
12
30 100 300 Velocity dispersion (km s −1)
Pro
babi
lity
0.01 0.10Image separation ( ′′ )
0.01 0.1 1 10Time delay (days)
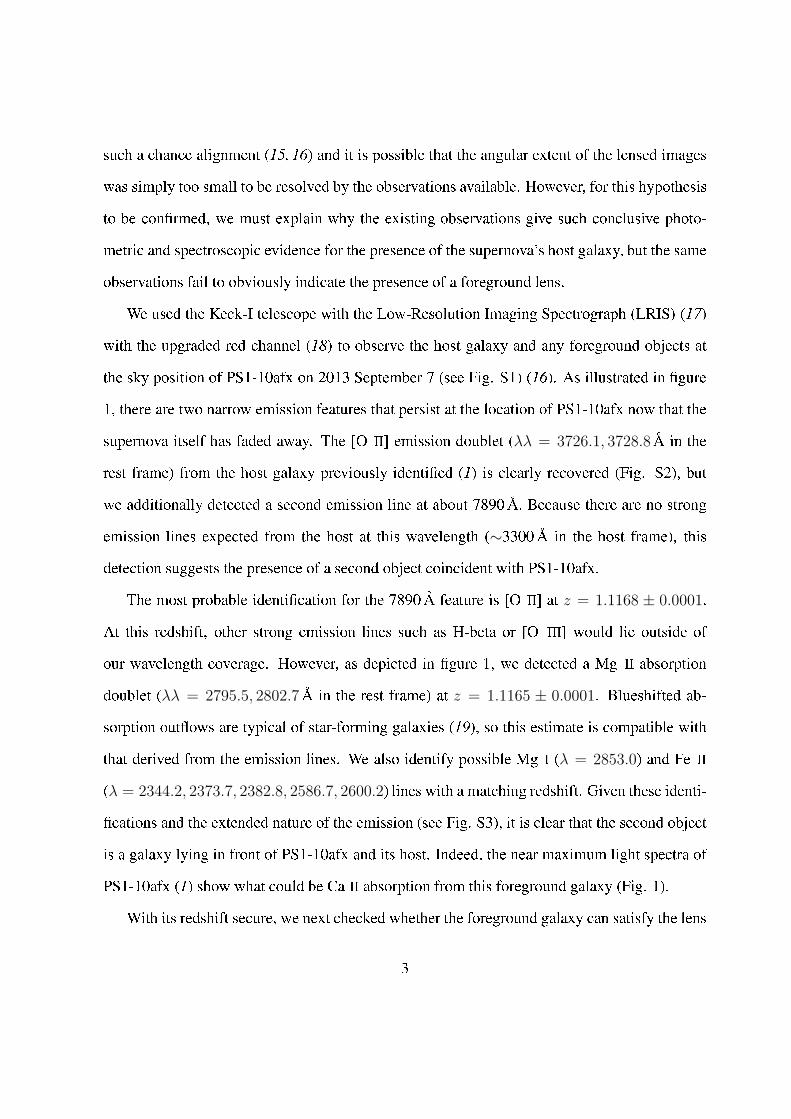
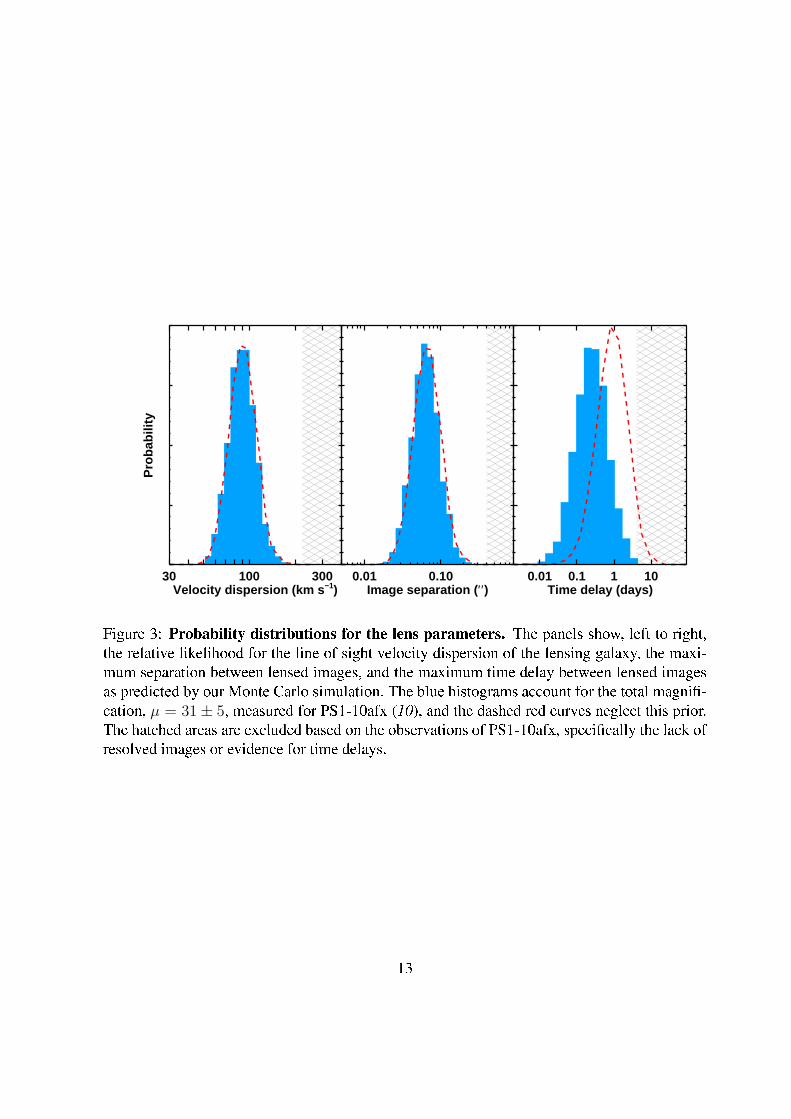
Figure 3: Probability distributions for the lens parameters. The panels show, left to right,
the relative likelihood for the line of sight velo ity dispersion of the lensing galaxy, the maxi-
mum separation between lensed images, and the maximum time delay between lensed images
as predi ted by our Monte Carlo simulation. The blue histograms a ount for the total magni�-
ation, µ = 31± 5, measured for PS1-10afx (10), and the dashed red urves negle t this prior.The hat hed areas are ex luded based on the observations of PS1-10afx, spe i� ally the la k of
resolved images or eviden e for time delays.
13

PS1−10afx
reddening
18 20 22 24 26Observed i−band magnitude
−0.5
0.0
0.5
1.0
1.5
2.0
2.5
Obs
erve
d r−
i col
or
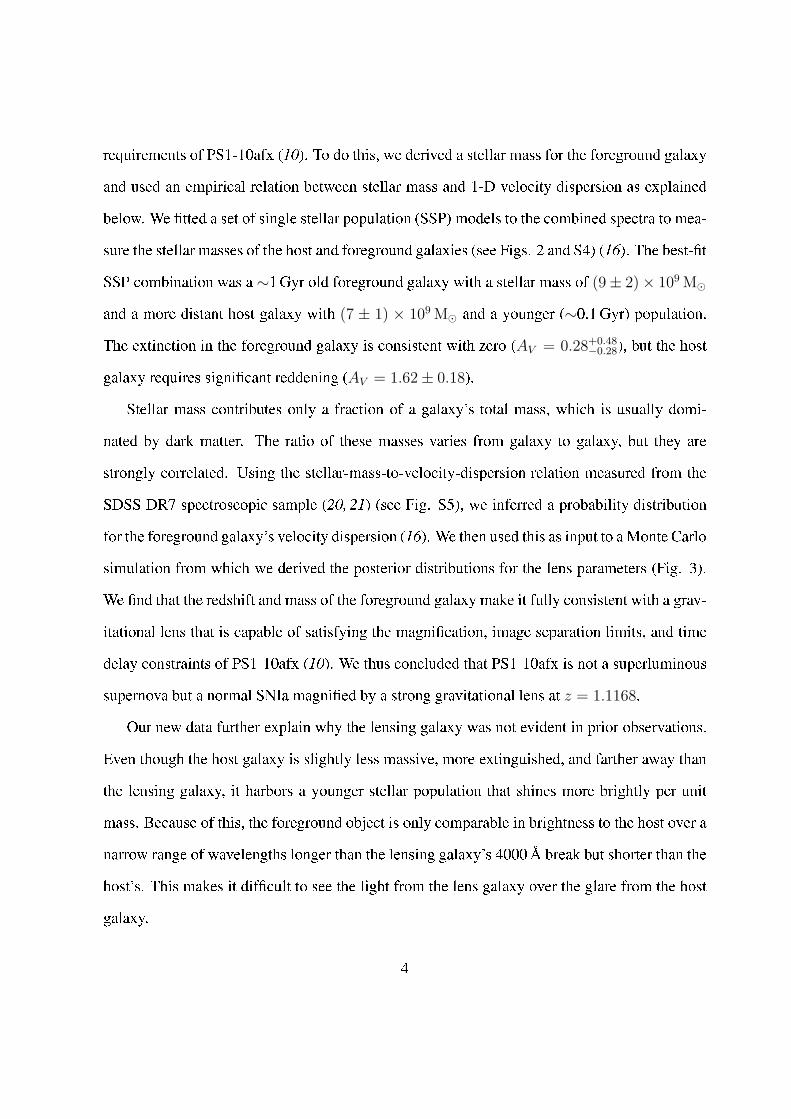
Figure 4: Color-magnitude diagram showing how lensed SNIa an be distinguished from
un-lensed events. The blue shaded area shows the expe ted olor-magnitude distribution for
un-lensed SNIa on a log s ale, and the red shaded area orresponds to ore- ollapse super-
novae. The r − i olors for low redshift supernovae are relatively blue. However, at higher
redshifts (fainter observed magnitudes), the olor be omes red as the peak of the rest-frame
spe tral energy distribution passes through the observer-frame bands. The red limit for un-
lensed supernovae at a given i-band magnitude is denoted by the thi k bla k line. Blue ir lesand red triangles show the distribution of lensed SNIa and ore- ollapse supernovae, respe -
tively, predi ted by Monte Carlo simulations (16). Filled symbols indi ate obje ts that ould be
resolved from ground based observations, su h as those planned by the Large Synopti Survey
Teles ope (LSST). Open symbols depi t obje ts that require high angular resolution follow-up
observations to resolve spatially. The open star marks the values orresponding to the peak i-band brightness of PS1-10afx, and the dash-dotted urve shows that the olor evolution within
one magnitude of this peak is minimal. The verti al dashed line marks the single epo h limit
predi ted for LSST. The arrow shows the reddening ve tor, assuming AV = 1.0mag.
14

Supplementary Materials for
Dete tion of the Gravitational Lens Magnifying a Type Ia Supernova
Robert M. Quimby,
∗Masamune Oguri, Anupreeta More, Surhud More,
Takashi J. Moriya, Mar us C. Werner, Masayuki Tanaka, Gaston Folatelli,
Melina C. Bersten, Keii hi Maeda, Ken'i hi Nomoto
∗To whom orresponden e should be addressed; E-mail: robert.quimby�ipmu.jp.
This PDF �le in ludes:
Supplementary Text
Figures S1 to S6
Referen es
15
Supplementary Text
Spe tros opy
The 2013 September 7 observations from the Ke k-I teles ope with the Low-Resolution
Imaging Spe trograph (LRIS) (17) employed an atmospheri dispersion orre tor to prevent
wavelength dependent losses for the non-paralla ti slit angles required (24). The 1.0′′ slit
was oriented to in lude a nearby star (see Fig. S1), and the teles ope was nodded ±2′′ along
the slit in an ABBA pattern in several sets over the observation. Light was sorted into red
and blue hannels using the 560 di hroi . We used the 400/3400 grism for the blue hannel,
giving a spe tral resolution, R = λ/λFWHM, of about 500 − 700 from 3200
A to 5600
A as
measured from ar lamp lines. On the red side, we used the 400/8500 grating to give a spe tral
resolution of about 1000− 1700 between 5600
A and 10300
A. The resolution was determined
by noting the FWHM of the Gaussian kernel that an best onvolve a high resolution night sky
spe trum (25) to mat h the sky lines in our data. We used spatial binning on the red hannel to
give a 0.27′′ pixel−1s ale, but left the blue side un-binned (0.135′′ pixel−1
). Integration times
were set to 847 s in the blue hannel and 817 s in the red hannel (per exposure) to a ommodate
differen es in readout speed. A total of 28 exposures (about 6.5 hours on target) were obtained
in ea h hannel under good sky onditions and ∼ 0.7′′ seeing.
Two of the blue spe tra were found to be anomalous; although the sky ounts are similar to
the other exposures in the blue, there is a pivot point at longer wavelengths beyond whi h the
ounts taper off signi� antly. These exposures were ex luded from our analysis. No problems
were found with the asso iated red hannel exposures, suggesting the problem is internal to the
blue side of the instrument.
At the end of our �rst 4 ABBA sets on PS1-10afx, we imaged the slit and found that the
16
referen e star (and thus the position of PS1-10afx) was slightly offset (about 0.4
′′West) from
the enter of the slit. We imaged the slit prior to and after the �nal 3 ABBA sets to ensure and
verify that the slit was properly aligned. The �rst 4 and se ond 3 sets are offset along the slit by
about 2′′, thus pla ing the target at 4 distin t positions in the dete tor plane.
We extra ted the spe tra using IRAF (26), alled through python s ripts using the PyRAF
pa kage, for basi de-trending and ustom IDL s ripts for the �nal target extra tion. We ob-
served the standard star, BD+28d4211, before, in the middle of, and after the PS1-10afx ob-
servation for use in spe trophotometri alibration and as a referen e for removing telluri
features. To orre t for atmospheri extin tion, we used the Mauna Kea extin tion urve (27).
LA-Cosmi (28) was used to mark pixels affe ted by osmi rays and parti le events on individ-
ual frames. We have implemented a 2-D sky subtra tion pro edure (29). Brie�y, the sky is �t
with B-splines to the two dimensional spe tra, with masking and iteration used to ex lude ob-
je t or otherwise deviant pixels. We redu e the data to a 1-D spe trum using optimal extra tion
applied to the full data set, without ever warping the 2-D spe tra. For some of our analysis, we
dire tly use the set of 2-D spe tra. The wavelength s ale was alibrated �rst using afternoon ar
lamp exposures, and then adjusted by ross- orrelating to the UVES night sky spe tra (25). By
ross- orrelating se tions of our �nal sky spe trum against the UVES templates, we estimate
the orre ted wavelengths are a urate to 0.4
A in the blue hannel (λ < 5600) and a urate
to 0.2
A in the red hannel. Finally, we apply a small (−5 km s
−1) orre tion to pla e the mea-
sured wavelengths into the Helio entri rest frame (this frame differs from the CMB rest frame
by about −350 km s
−1).
Figures S2 and S3 show the ombined 2-D data from the se ond (properly aligned) pointing
near the lo ation of the two emission lines. The spatial oordinate has been set by assuming a
separation of 19.13
′′between PS1-10afx and the referen e star in the slit (see Fig. S1). This
oordinate system is only approximate given the un ertainties in the entroid of PS1-10afx
17
(∼0.1′′) (1), the systemati offset to the CFHT oordinate system (assumed to be ∼0.1′′), and
non-linearities in the Ke k/LRIS dete tor plane (est. ∼0.1′′). The spatial lo ation of the host,
delineated by the extent of the emission line in �gure S2, is thus onsistent if not slightly
south of PS1-10afx. Similarly, the spatial extent of [O II℄ from the foreground obje t (Fig. S3)
overlaps the lo ation of PS1-10afx and appears to have its entroid some 0.5
′′north of the host's
[O II℄, whi h further suggests these represent physi ally distin t sour es.
For the host galaxy, we derive a redshift of z = 1.3885± 0.0001 from the [O II℄ doublet by
�tting a 2-D model to the set of individual exposures. We note that this redshift may be slightly
higher than previously reported (1). This systemati differen e ould be aused by alibration
differen es (e.g. sky lines in the supernova spe tra appear systemati ally offset in wavelength
by about 1.6
A ompared to the UVES night sky atlas). Figure S2 suggests a se ond possibility.
The host's [O II℄ doublet appears to shift in velo ity with spatial position. In other words, the
galaxy may be rotating and different slit orientations may thus lead to slightly biased redshift
measurements (we similarly �nd a systemati offset between our measurements of the Mg II
absorption line wavelengths and those previously reported).
By using the 2-D data to �t for the emission line, we an a ount for the velo ity gradi-
ent, whi h we found to be 127 ± 25 km−1s
−1ar se
−1along the slit. Assuming this tilt, the
[O II℄ doublet is resolved, but the individual line widths are onsistent with the instrumental
resolution. We measured a total [O II℄ �ux from the host light in the slit of (4.79 ± 0.05) ×
10−17erg s
−1 m
−2, whi h is onsistent with the value previously reported (1). With respe t to
the [O II℄ lines, we found that the Mg II absorption lines are blueshifted by 234±78±14 km s
−1,
where the �rst and se ond errors in lude only the un ertainty in the absorption minima and only
the un ertainty in the [O II℄ maximum, respe tively. This is a higher value than previously re-
ported, but, based on our analysis, we derived a onsistent value from the published supernova
spe trum (202± 13± 107 km s
−1). This blueshift is larger than measured for most star-forming
18

galaxies observed at z ∼ 1.5 (19), but the sample of su h obje ts with blueshift measurements
is small and shows a large s atter (the out�ow velo ity measured for PS1-10afx's host is less
than a standard deviation larger than the sample mean).
For the foreground galaxy, the best �t emission line model prefers a slight dependen e on
velo ity with position, but this is not signi� ant. The total [O II℄ �ux from the foreground
galaxy light in the slit is (1.48 ± 0.08) × 10−17erg m
−2s
−1. From the initial, slightly offset
pointing the measured �ux is about 50% lower, whi h suggests the East-West extent of the
obje t is limited.
We note that [O II℄ emission from the foreground galaxy is not signi� antly dete ted in
the published spe tra of PS1-10afx obtained near the supernova's peak brightness (1). If the
emitting region was fully ontained in the slit aperture, a weak dete tion of the [O II℄ line ould
have been possible. This earlier spe trum was, however, probably optimized for the extra tion
of the supernova signal and may therefore only ontain a fra tion of the extended foreground
galaxy's light. Considering this, the lower signal-to-noise ratio of the supernova spe trum, and
the oin ident lo ation of the [O II℄ line with the blue edge of a broader supernova bump, it is
not surprising that the [O II℄ line was not previously identi�ed.
Stellar Mass Estimates
To test whether the foreground galaxy an satisfy the lensing onstraints for PS1-10afx, we
must estimate its total mass. A galaxy's rotation urve an be used to estimate a total mass (30),
so we attempted to �t a 2-D model to the [O II℄ emission line in the observed spe trum (see
se tion above). However, we do not dete t a signi� ant dependen e on the emission line's
entral wavelength as a fun tion of position. Doppler broadening of the absorption lines ould
also indi ate the foreground galaxy's mass (31), but the data are onfused with the light of the
19
more distant host galaxy, and the signal-to-noise ratio available from the narrow strip outside
of the host's glare is prohibitively low. The Mg II lines noted above are not resolved, whi h
suggests a 1-D velo ity dispersion of less than about σ < 90 km s
−1; yet, if they form in an
out�ow, the widths of these lines may be de oupled from the galaxy's dynami al mass.
We instead use the foreground galaxy's stellar mass, whi h is orrelated with its 1-D velo ity
dispersion. We estimate stellar masses for the galaxies by �tting the Bruzual & Charlot (2003)
Single Stellar Population (SSP) models (32) to our data. We hoose models following the
Padova 1994 evolutionary tra ks, and we tested both Salpeter and Chabrier stellar initial mass
fun tions (IMF). We assume our spe tra are omposed of two galaxies � one at z = 1.3885
and the other at z = 1.1168 � ea h with its own internal extin tion. The observed spe tra
are then modeled as a linear ombination of a subset of the models with ages between 0.1 and
5Gyr. Initially, we assumed ea h galaxy ould be modeled by a bursty star formation history
and we allowed ea h to be omprised of SSP models at four distin t ages all with 0.4 solar
metalli ity. However, our �ts suggest that ea h galaxy an be well represented by a single age
population. We then allowed ea h galaxy to have any single stellar age in the 0.1− 5Gyr range
and metalli ities of 0.2, 0.4, or 1.0 solar. We �nd that young ages (∼0.1Gyr) are strongly
preferred for the Host galaxy, and the foreground galaxy omponent is best �t with ages lose
to 1Gyr.
To a ount for slit losses, we s aled our spe tra by a fa tor of 1.4 to mat h the zP1-band
magnitude reported for the �host� (1). As we have shown, this measurement must a tually be a
ombination of the light from the host and a foreground galaxy. Thus, this s aling may not be
perfe tly valid for one or both of the galaxies, but the signi� an e of this effe t should be small,
as noted below.
Assuming the Chabrier IMF, the best �t stellar masses are (9 ± 2) × 109M⊙ for the fore-
ground lens and (7 ± 1) × 109M⊙ for the more distant host. The metalli ities for the best �t
20

models are 0.2 solar for the lens and 0.4 solar for the host. These �ts are slightly preferred to
those with the Salpeter IMF, whi h gives higher but onsistent mass estimates: (13±3)×109M⊙
for the lens and (10± 1)× 109M⊙ for the host.
It should be noted that our spe tra have relatively less �ux below 7000
A as ompared to
the �host� olors reported (1). If we arti� ially de-redden our spe tra assuming E(B-V) = 0.3,
we an re over these olors to within the errors. However, these olors are not ompatible with
the measurements from the CFHT Lega y Survey (33), whi h, in parti ular, favor signi� antly
fainter g-band magnitudes for the host. It is thus possible that the integrated olor varies with
the size and lo ation of the aperture, with the bluer light lo ated outside of our slit (although
our two offset pointings show similar olors). Even with this adjustment, however, the derived
galaxy masses only hange at the 1 − 2σ level. If we, instead, normalize the photometry using
the reported g-band measurement (1), the galaxymasses in rease by less than a fa tor of 2. If the
olor dis repan y between our spe tra and the previous photometry is related to the fra tions of
the light ontributed to by the host and the lens, then this suggests that any error in lens mass due
to improperly s aling the light in the slit to the total light measured from the photometry should
also be around a fa tor of 2 or less. S aled to the g-band photometry, the JHK magnitudes
predi ted by the best �t SSP models would, like the redder opti al bands, be well in ex ess
of the observed onstraints. The predi ted IR magnitudes are in the best agreement with the
observations (all within 1σ) for the z-band s aled ase with no arti� ial reddening orre tion.
Higher masses for the foreground galaxy are possible if we assume an older stellar popula-
tion, but these produ e worse �ts to the data. For example, if we assume a 5Gyr old population
( lose to the maximum allowed for a z = 1.1168 obje t), the mass in reases to 50 × 109M⊙,
but the Ca II K line, whi h lies in a relatively lean spe tral range, would be mu h stronger in
the model than allowed by the data.
If we instead adopt a younger stellar population for the foreground galaxy, then a large
21

extin tion is required. In this ase, we would expe t the foreground galaxy to redden the light
from PS1-10afx, but as previously noted (10), the observed olors suggest no extin tion of the
supernova light. This problem ould be avoided by adopting an older age for the host's stellar
population, but older SSP models do not mat h the hydrogen Balmer absorption lines seen in
the break in the sky lines between 9000 and 9300
A (as shown in Fig. 2, we learly dete t
H9 and H10 from the host in luding both broadened absorption dips from the stars and narrow
emission lines from gas).
The strongest stellar features expe ted from the lens galaxy are the hydrogen Balmer and
Ca II H & K lines. The signal-to-noise ratio in this wavelength range is lower than in the range
overing the host features noted above, and the lens features are expe ted to be weaker. As
shown in �gure S4, there is a possible dete tion of H8, whi h lies in a relatively lean wave-
length range. The simple absorption dip predi ted by the SSP modeling ould be ompli ated
by nebular emission lines, whi h are not in luded in the model. The data in the wings of the
H8 feature appear onsistent with the SSP model, and there ould be a narrow emission feature
emerging from the ore of the line that would be onsistent with nebular light. A similar trend
may hold for Hδ and the Hǫ/Ca II H blend, but interferen e from bright sky lines pre ludes a
de�nitive on lusion.
Lens Constraints
We derive expe ted lens properties of PS1-10afx using a Monte Carlo approa h (15). We
�rst onvert our best stellar mass estimate ofM∗ = (9±2)×109M⊙ for the lensing galaxy to a
velo ity dispersion, σ. Using linmix err.pro (34), we �nd the best �t linear relation to the
stellar masses and velo ity dispersions of SDSS galaxies (20,21) is log σ = −1.4+0.33 logM∗,
with an intrinsi s atter of 0.081 (see Fig. S5). Propagating the error from the stellar mass es-
22

timate, we thus adopt a Gaussian distribution with a mean of 1.880 and dispersion of 0.088 for
log(σ[km s−1]) for the lensing galaxy. We assume the standard singular isothermal ellipsoid
mass distribution for the lens with an additional ontribution to the lens potential from external
shear. The ellipti ity is Gaussian distributed with a mean of 0.25 and dispersion of 0.2, and
the magnitude of external shear follows a log-normal distribution with a mean of 0.05 and dis-
persion of 0.2 dex. The position angles are assumed to be random. Fixing the lens redshift to
z = 1.1168, we randomly generate a list of lenses a ording to these probability distributions
of the velo ity dispersion, ellipti ity, and external shear. For ea h lens, we uniformly distribute
point sour es at z = 1.3885, solve the lens equation using the publi software, glafi (35),
and re ord any events that produ e multiple images. For all lenses we use the same angular
number density of sour es, whi h suggests that the output atalog of multiple images is auto-
mati ally weighted by strong lensing ross se tions.
With this pro edure we generate mo k atalog of over 500000 multiple image sets. We then
derive posterior distributions of any parameter X dire tly (e.g. the dashed red lines in Fig. 3)
or, for a onsisten y he k with PS1-10afx, by adding a ondition on the total magni� ation
µ, P (X) =∫
P (X|µ)P (µ)dµ (the blue histograms in Fig. 3), where P (µ) is assumed to be
Gaussian distribution with a mean of 31 and dispersion of 5, whi h orresponds to the best-
�t and error of the total magni� ation of PS1-10afx (10). When so weighted by the lensing
probability, the velo ity dispersion for the lensing galaxy is found to be log(σ) = 1.95 ± 0.09,
the image separation is log(∆θ) = −1.20 ± 0.18 (with ∆θ in ar se onds), and the time delay
is log(∆t) = −0.61 ± 0.44 (with ∆t in days). We also �nd that the entroid of the ombined
supernova images should be offset from the lens enter by log(θ) = −1.68 ± 0.26 (with θ in
ar se onds).
These values are fully onsistent with the observations of PS1-10afx. To be in onsistent, the
velo ity dispersion would have to be signi� antly larger than we have estimated. If we adopt
23
the velo ity dispersion implied by the highest stellar mass onsidered above (50 × 109M⊙ or
log(σ) = 2.13), for example, the expe ted lens parameters would still be onsistent with the
observations of PS1-10afx. This strengthens our on lusion that the foreground galaxy is the
gravitational lens that has magni�ed PS1-10afx.
We perform an additional plausibility he k that is ompletely independent of our stellar
mass estimate. We onsider the probability distribution of the 1-D velo ity dispersion of galax-
ies at z = 1.1168 that an a t as a lens for a z = 1.3883 sour e. For a spheri ally symmetri
gravitational lens with an isothermal density pro�le hara terized by a velo ity dispersion σ,
the Einstein radius is given by,
b = 4π(
σ
c
)2 Dls
Ds
, (1)
where Dls and Ds are angular diameter distan es from lens to the sour e and from observer to
the sour e, respe tively. The lens ross-se tion for a spheri al isothermal model is given by
Alens = πb2 ∝ σ4. Therefore, the probability distribution of the velo ity dispersion of a galaxy
at redshift zl to lens a ba kground galaxy at redshift zs is given by
P (σ|zl, zs) ∝ n(σ, zl)Alens ∝ n(σ, zl)σ4 . (2)
We use the inferred velo ity dispersion fun tion for the sample of galaxies in the redshift
range 0.9 ≤ z ≤ 1.2 (36). We �t a S he hter fun tion to these data points, and extrapolate the
resulting velo ity dispersion fun tion to lower values of the velo ity dispersion. The probability
distribution fun tion for the lens velo ity dispersion is then obtained by inserting this velo ity
dispersion fun tion into Equation 2. We have restri ted ourselves to those velo ity dispersions
whi h result in image separation distribution less than 0.4′′, given that PS1-10afx was not re-
solved by Pan-STARRS imaging data. The angular size of the SN photosphere must be smaller
than the SN−lens angular offset,∆θ, to avoid hanges in the effe tive magni� ation over time.
This puts a onstraint on the lower mass end of the velo ity dispersion. After the appli ation of
24
these priors, the median velo ity dispersion, σ = 177+32−47 km s
−1, is ompatible if not slightly
higher than the value derived through our Monte Carlo simulation. This value is also onsistent
(albeit at the higher end) of the σ −M∗ relation derived from the SDSS galaxies, whi h is not
entirely unexpe ted given that lensing probability grows rapidly as σ in reases (Eqn. 2).
Sele ting Lensed SNIa in Color-Magnitude Spa e
To determine the distribution of lensed and un-lensed supernovae in olor-magnitude spa e,
we �rst al ulate the observed magnitudes expe ted in the r and i-bands for SNIa and ore-
ollapse supernovae as a fun tion of redshift. For bandX , the observed magnitude is omputed
frommX = M +µ+KX , where µ is the distan e modulus,M is the absolute magnitude of the
supernova in some rest frame band, and the KX term a ounts for the offset between this band
and bandX in luding the effe ts of redshift. We allow for a range of peak absolute magnitudes
for ea h type of supernova (37). We al ulate the so- alledK- orre tions using spe tral energy
distribution templates for various supernovae (38, 39). We use the rates of supernovae (40) to
determine the relative numbers of ea h type of supernovae with redshift.
The sample of supernovae generated from this is then used as input to a Monte Carlo sim-
ulation that determines what fra tion of events are lensed and by how mu h. For the lensing
galaxies, we adopt the velo ity fun tion measured from SDSS galaxies (41). We assume no
redshift evolution. The strong lensing probability is al ulated assuming a singular isother-
mal ellipsoid with a �xed ellipti ity of 0.3. For ea h lensing event, the total magni� ation is
omputed using glafi (35). With the updated velo ity fun tion and ellipti ity, we �nd the
lensing probability is a fa tor of 2 higher than previously published (15). Our simulations show
that for a �ux limited survey, the r − i olors of most lensed supernovae an be signi� antly
larger (redder) than the un-lensed events. Obje ts found to lie above the bold line in �gure 4
25
an thus be onsidered lensed supernova andidates.
We an verify the purity of su h sele tion riteria using the published sample of supernova
dis overies from the Supernova Lega y Survey (SNLS) (42). Unfortunately, only the set of
well hara terized events (e.g. SNIa) is available but we an at least use these to verify that
the dominant produ t of similar supernovae surveys will be ex luded from our sele tion uts.
The �lters used in the SNLS Survey differ slightly from the standard SDSS band passes, whi h
leads to slightly different sele tion riteria than depi ted in �gure 4. A ounting for this, we
ompare the observed i-band magnitudes and r − i olors of the SNLS sample and �nd that
all events dete ted before maximum light have photometry that lies below our sele tion line at
some point before de lining. At late times, the olors an be redder, but sele ting only those
obje ts that are onsistently above our (appropriately modi�ed) sele tion line during their rise
to maximum light eliminates the entire SNLS sample. The sele tion riteria thus su eeds in
weeding out normal supernovae during their rising phase and enables the sele tion of lensed
SNIa on the rise, whi h will enable good onstraints on the date of and �ux at maximum light.
Sele tion Bias and the Expe ted Number of Lensed SNIa from Pan-STARRS1
Even though the magni� ation of PS1-10afx is larger than expe ted from a random, strong-
lensing system in a given volume and the lens galaxy is less massive than a random draw
weighted by lensing ross se tion would predi t, the system may well prove typi al of the grav-
itationally lensed SNIa dis overies that will be found by future surveys. Flux limited surveys
like Pan-STARRS1 have a strong bias against less magni�ed SNIa, whi h are fainter thus harder
to dete t. Be ause both lensing opti al depth and the number of SNIa is a steep fun tion of red-
shift (espe ially around z ∼ 1) due to in reasing omoving volume and, in the ase of SNIa,
rates, there are more strongly lensed SNIa at higher redshifts with large magni� ations than at
26
lower redshifts with lower magni� ations (and thus similar observed magnitudes). There is thus
a strong overall bias for highly magni�ed SNIa. Also, the angular resolution of Pan-STARRS1
is suf� ient to resolve lensed SNIa with large image separations, whi h are ne essarily seen
through the most massive lens galaxies, but the SN images seen through smaller lens galaxies
are more likely to be unresolved. Small lens galaxies thus have a sele tion advantage in �ux
limited sear hes as the multiple supernova images will blend together to form a single point
sour e with a �ux equal to the sum of its parts; in the ase of resolved images, the individual
images must be dete ted, but these will of ourse be fainter.
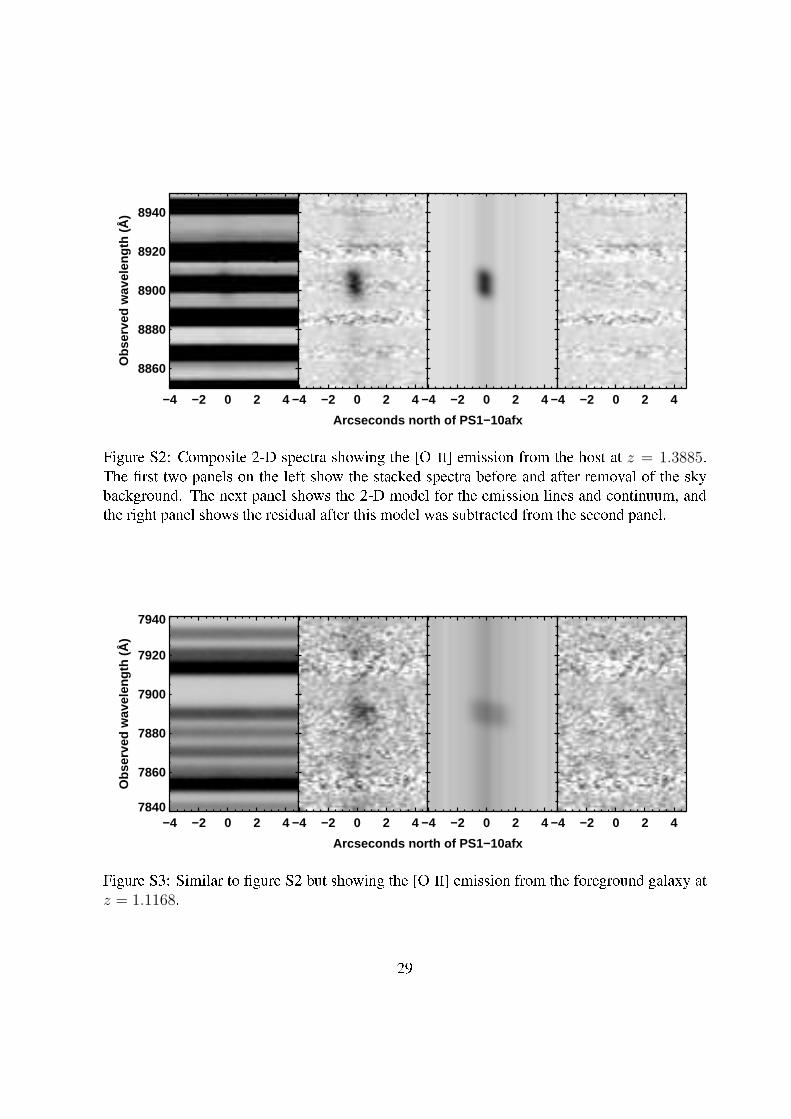
We illustrate this point in �gure S6, whi h shows the distribution of gravitationally lensed
SNIa expe ted to be dete ted by the Pan-STARRS1 Medium Deep Survey (PS1-MDS). We
�rst used a Monte Carlo simulation similar to one previously published (hereafter OM10) (15)
to predi t the distribution that would be found using prior sele tion te hniques. Spe i� ally,
dete tion of the third brightest image was required for quads and dete tion of the se ond image
was required for doubles. Ex luding unresolved systems, the total number of gravitationally
lensed SNIa predi ted by this method is 0.1 over the survey lifetime, whi h is onsistent with
the number published in OM10. However, if we only require dete tion of a single image (or a
single blend in the ase of unresolved images), the expe ted number of gravitationally lensed
SNIa from the PS1-MDS jumps to 0.9. About half of these should be unresolved by the survey,
like PS1-10afx. The Monte Carlo simulation further predi ts that a SNIa sample sele ted in
this way will have a mean total magni� ation of 13.0, a median of 5.0, and 95% of the sample
will have total magni� ations in the range 2.0 < µ < 59.2. This, again, is onsistent with
PS1-10afx.
27

CFHT g−band r−band i−band
REF Star Host + Lens
z=1.0403z=0.4467
zhost
=1.3885z
lens=1.1168
−2
0
2
4
6
Offs
et e
ast (
′′)
Keck
−25 −20 −15 −10 −5 0 5Offset north ( ′′ )
0
2
4
6
8
Inte
nsity
Figure S1: Field setup for the Ke k/LRIS observation of PS1-10afx. The top panel shows a
olor- omposite image of the sky near PS1-10afx using g, r, and i-band data taken prior to
the outburst by the Canada-Fran e-Hawaii Teles ope Lega y Survey (33). The lines mark the
lo ation of the 1.0
′′slit mask deployed for spe tros opy. The lo ation of PS1-10afx is marked
with a white ir le, and the redshifts of nearby galaxies, as determined from the Ke k spe tra,
are indi ated. The lower panel shows the 1-D intensity along the slit as re orded by the Ke k
observation. The target pro�le (purple line) was de omposed into a marginally resolved host
omponent (red dotted line) and an extended foreground galaxy omponent (blue dashed line).
28
−4 −2 0 2 4
8860
8880
8900
8920
8940
Obs
erve
d w
avel
engt
h (Å
)
−4 −2 0 2 4
−4 −2 0 2 4
−4 −2 0 2 4
Arcseconds north of PS1−10afx
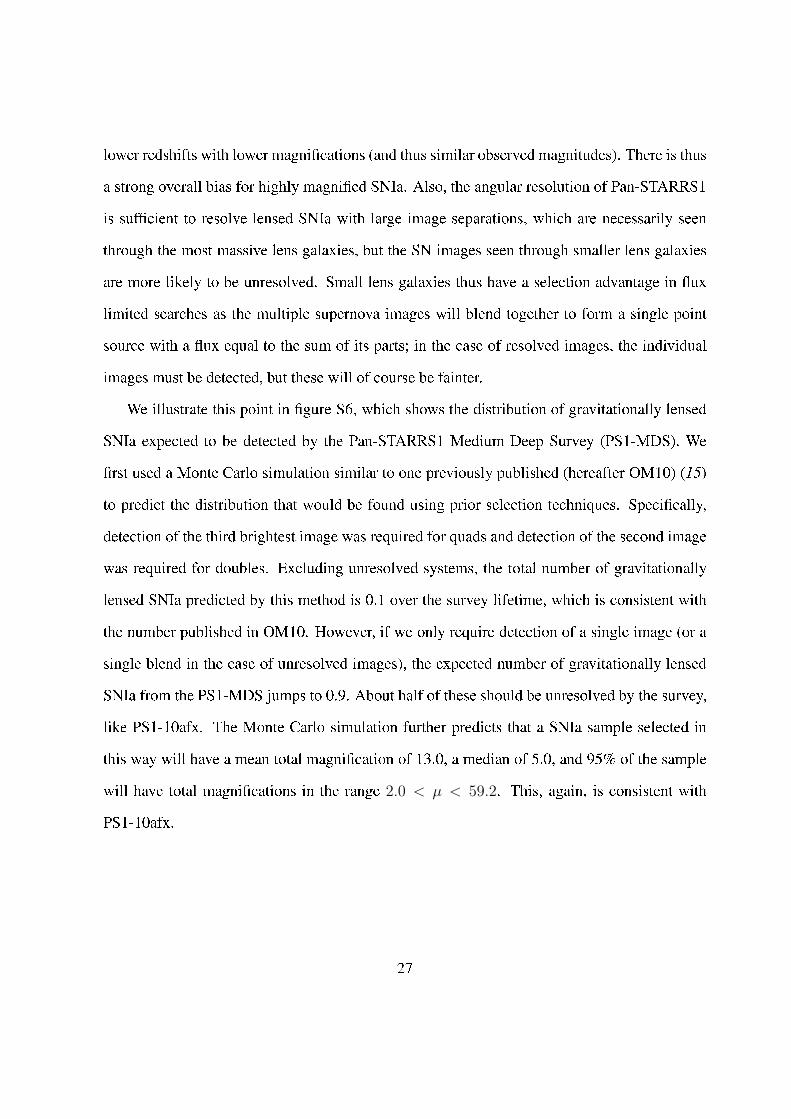
Figure S2: Composite 2-D spe tra showing the [O II℄ emission from the host at z = 1.3885.The �rst two panels on the left show the sta ked spe tra before and after removal of the sky
ba kground. The next panel shows the 2-D model for the emission lines and ontinuum, and
the right panel shows the residual after this model was subtra ted from the se ond panel.
−4 −2 0 2 4
7840
7860
7880
7900
7920
7940
Obs
erve
d w
avel
engt
h (Å
)
−4 −2 0 2 4
−4 −2 0 2 4
−4 −2 0 2 4
Arcseconds north of PS1−10afx
Figure S3: Similar to �gure S2 but showing the [O II℄ emission from the foreground galaxy at
z = 1.1168.
29

H14
H13
H12
H11
H10
H9
H8
CaK
CaH
Hε
Hδ
7800 8000 8200 8400 8600 8800Observed wavelength (Å)
3700 3800 3900 4000 4100Lens−frame wavelength (Å)
0
1
2
3
Flu
x (1
0−1
8 erg
s−1
cm
−2 Å
−1)
S/N = 0
S/N > 5
Color Key
Figure S4: Detail of the best �t SSP model showing the strongest stellar lines expe ted from the
lens galaxy. The data are olor oded by the signal-to-noise ratio (per Angstrom) as indi ated
in the legend. The dark gray urve is the best �t SSP model, whi h in ludes the total starlight
expe ted from the host and lens but negle ts emission from nebular gas.
30

9 10 11 12log(M * / MSun)
1.5
2.0
2.5
log(
σ / k
m s
−1)
Figure S5: Stellar mass (M∗) vs. velo ity dispersion (σ) relation for galaxies. The gray s ale
ontours show the density of galaxies from the SDSS (20,21) on a ube root s ale. The dashed
orange line shows the best �t linear relation. The blue star marks the most probable σ for
the lensing galaxy in luding the magni� ation prior from our Monte Carlo simulation, and the
green diamond is the estimated value from the analyti al ulation. The red ir les are for a
sample of galaxies at redshifts omparable to the lens (43).
31
µtot
µtot + µ1st
µ3rd (OM10)
0.0
0.2
0.4
0.6
0.8
1.0
Cum
ulat
ive
Num
ber
µtot µ1st
µ3rd (OM10)
0.0 0.5 1.0 1.5 2.0 2.5Image separation ( ′′ )
0.01
0.10
1.00
Num
ber
per
bin
Figure S6: Expe ted number distribution of lensed SNIa from the PS1-MDS as a fun tion
of image separation angle (the distan e between the two images in a double or the maximum
separation in a quad system). Predi tions from OM10 (15) were based on the dete tability of the
fainter image in a double and the third brightest image in a quad (gray lines in the �gure). Using
the olor sele tion, lensed supernovae an then be identi�ed solely from the brightest image in
the system (µ1st ; blue line). When the image separation is below the resolving power of the
survey (verti al dotted line), the relevant brightness is set by the sum of the individual images
(µtot; red lines). The total number of lensed SNIa dete table by PS1-MDS is then roughly an
order of magnitude larger than previously onsidered.
32