krispy kreme-case study solution finance.ppt
DESCRIPTION
Krispy Kreme-Case Study Solution Finance.pptTRANSCRIPT

Krispy Kreme Doughnuts, Inc
Marketing Case AnalysisCourse: MBA 524
Instructor: Mary A. HigbyDate: April 22, 2008
Presented by: Jack Szczepaniuk Chun-Chiang Chan

Summary
• Introduction to Krispy Kreme• Krispy Kreme Downturn• Krispy Kreme Finances• S.W.O.T.• What is the Problem?• Critical Issues• Alternatives• Our Recommendation

Introduction to Krispy Kreme• Founded by Vernon Carver Rudolph
in 1933
• First donut shop (partnered) was in Paducah, KY
• Operations were moved to Nashville, TN
• Focused on selling to grocery stores • Rudolph opened his own shop in
Winton-Salem,NC in 1937 with $25 dollars and a 1936 Pontiac

Introduction to Krispy Kreme• Out the door• Around the corner• Down the block

Introduction to Krispy Kreme• Automatic doughnut cutting
machine• Air-pressure doughnut pourer• Donut “hole” does not exist• Entire process is automated• “Hot Original Glazed”• The Red Light

Krispy Kreme U.S.
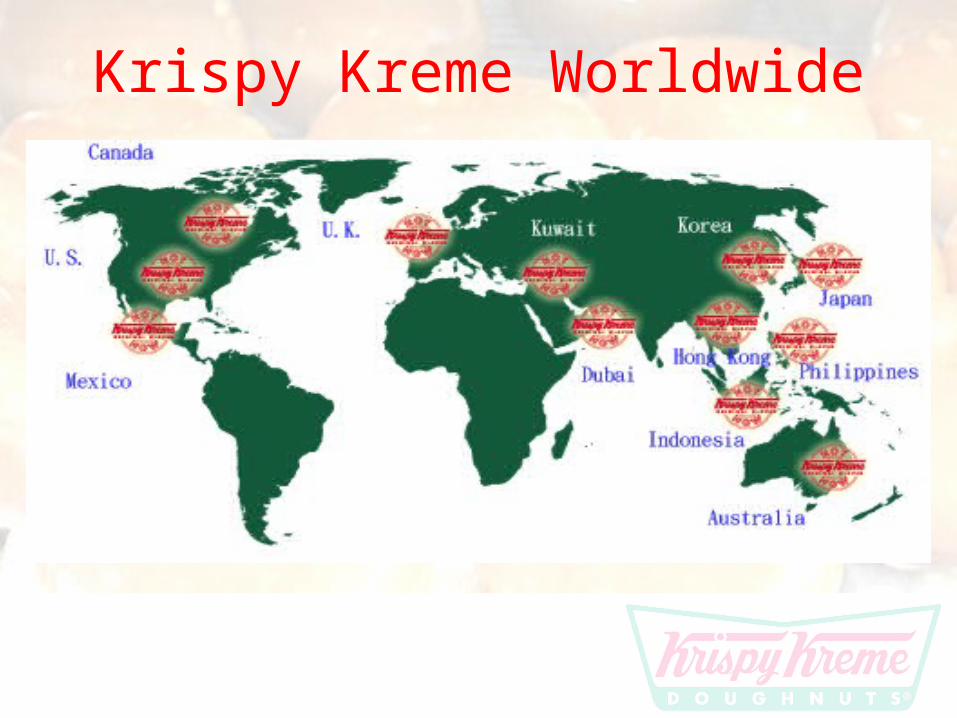
Krispy Kreme Worldwide

Krispy Kreme Stock
• Opened on the NASDAQ on April 5, 2000 (KREM)• Bought Digital Java Coffee Company in April 2001• Moved up to the NYSE on May 17, 2001 (KKD)

Krispy Kreme Downturn• Low-carb, low-sugar
doughnuts• Increase cost in ingredients• Too many stores in too little
time• Lack of advertising has
caught up with KK

Krispy Kreme FinanceIss 4/6/2000: $9.6012/28/2001: $45.751/31/2003: $30.418/18/2003: $49.3711/5/2003: $44.315/5/2004: $32.375/10/2004: $20.3010/27/2005: $4.051/16/2007: $11.421/16/2008: $2.23
4/18/2008: $3.11

Krispy Kreme Finance–Income Statement
2007 2006 2005 2004 2003
Revenue 461.2 543.36 707.77 649.35 490.73
Total Revenue 461.2 543.36 707.77 649.35 490.73
Cost of Revenue, Total 389.38 474.59 598.28 493.65 380.64
Gross Profit 71.82 68.77 109.49 155.7 110.08
Selling/General/Administrative Expenses, Total 48.86 67.73 55.3 45.23 30.07
Depreciation/Amortization 21.05 28.92 31.93 22.31 14.68
Unusual Expense (Income) 28.49 90.9 161.85 -0.53 9.08
Operating Income -26.58 -118.77 -139.6 88.68 56.26
Interest Income (Expense), Net Non-Operating -19.55 -23.44 -7.72 -5.85 -2.01
Other, Net 5.11 5.67 -0.06 0.16 -3.47
Income Before Tax -41.03 -136.54 -147.38 82.99 50.78
Income Tax - Total 1.21 -0.78 9.67 33.15 19.72
Income After Tax -42.24 -135.76 -157.05 49.85 31.06
Total Extraordinary Items 0 0 -41.29 -1.28 0
Accounting Change 0 0 -1.23 0 0
Discontinued Operations 0 0 -40.05 -1.28 0
Net Income -42.24 -135.76 -198.34 48.56 31.06

KK Finance–Balance Sheet (Asset) 2007 2006 2005 2004 2003
Assets
Cash and Short Term Investments 36.24 16.98 27.69 21.03 55.18
Cash & Equivalents 36.24 16.98 27.69 21.03 32.2
Short Term Investments 0 0 0 0 22.98
Total Receivables, Net 62.57 73.8 45.71 71.82 48.28
Accounts Receivable - Trade, Net 27.6 37.68 44.77 63.09 45.44
Accounts Receivable - Trade, Gross 29.51 39.18 40.64 46.09 35.83
Provision for Doubtful Accounts -2.75 -13.66 -11.38 -1.27 -1.45
Notes Receivable - Short Term 0 1.15 0.94 0.75 0
Receivables - Other 34.97 34.97 0 7.97 2.85
Total Inventory 21.01 23.76 28.59 29.82 24.37
Prepaid Expenses 0 0 0 0 3.48
Other Current Assets, Total 12 32.49 17.38 14.83 9.82
Total Current Assets 131.82 147.03 119.36 137.5 141.13
Property/Plant/Equipment, Total - Net 168.65 205.58 309.21 287.49 202.56
Goodwill, Net 28.09 29.18 32.69 197.16 0.2
Intangibles, Net 0.84 1.11 1.69 0 49.15
Long Term Investments 3.22 8.6 5.97 14.58 11.22
Note Receivable - Long Term 0 0.04 2.12 6.56 1
Other Long Term Assets, Total 16.86 19.32 9.23 13.31 5.23
Other Assets, Total 0 0 0 0 0
Total Assets 349.49 410.86 480.28 656.6 410.49

KK Finance – Balance Sheet (L+S) 2007 2006 2005 2004 2003
Liabilities and Shareholders' Equity
Accounts Payable 7.87 8.9 17.44 19.11 14.06
Accrued Expenses 125.25 140.48 43.62 23.3 20.98
Notes Payable/Short Term Debt 0 0.11 8.48 8.12 12.28
Current Port. of LT Debt/Capital Leases 1.73 4.43 48.1 8.14 3.3
Other Current Liabilities, Total 0.02 0 0 0 9.08
Total Current Liabilities 134.87 153.92 117.64 58.67 59.69
Total Long Term Debt 105.97 118.24 90.95 137.11 57.19
Long Term Debt 105.97 118.24 90.95 137.11 57.19
Deferred Income Tax 0 0.85 3.91 0 9.85
Minority Interest 0 0 0.39 2.15 5.19
Other Liabilities, Total 29.69 29.18 26.45 22.26 5.22
Total Liabilities 270.53 302.18 239.34 220.19 137.14
Redeemable Preferred Stock 0 0 0 0 0
Preferred Stock - Non Redeemable, Net 0 0 0 0 0
Common Stock 310.94 298.26 295.61 294.48 173.11
Additional Paid-In Capital 0 0 -0.2 -0.38 -0.56
Retained Earnings (Accumulated Deficit) -233.25 -191.01 -55.25 143.09 102.4
Other Equity, Total 1.27 1.43 0.78 -0.77 -1.61
Total Equity 78.96 108.67 240.94 436.41 273.35
Total Liabilities & Shareholders’ Equity 349.49 410.86 480.28 656.6 410.49

KK Finance – Cash Flow 2007 2006 2005 2004 2003
Net Income/Starting Line -42.24 -135.76 -198.34 48.56 31.06
Depreciation/Depletion 21.05 28.92 31.98 22.81 14.68
Deferred Taxes -0.01 -1.89 10.12 -3.49 0.06
Non-Cash Items 39.65 102.87 213.2 40.32 21.03
Accounting Change 0 0 1.23 0 0
Unusual Items 28.52 87.76 198.54 0.94 0.93
Equity in Net Earnings (Loss) -6.47 4.34 1.62 2.24 2.09
Other Non-Cash Items 17.6 10.77 11.8 37.14 18.01
Changes in Working Capital 3.66 7.73 27.97 -25.53 -14.92
Accounts Receivable 0.5 3.86 10.98 -18.73 -6.98
Inventories 2.56 4.12 2.14 -4.07 -8.52
Other Assets 6.85 -2.97 -4.06 -0.97 -0.33
Payable/Accrued -9.05 0.44 8.28 -7.12 0.74
Taxes Payable 0 0 7.97 1.03 0.57
Other Liabilities 2.8 2.28 2.65 4.32 -0.41
Cash from Operating Activities 22.11 1.87 84.92 82.67 51.91

Krispy Kreme Finance – Cash Flow 2007 2006 2005 2004 2003
Capital Expenditures -4.01 -10.38 -74.31 -78.32 -81.7
Purchase of Fixed Assets -4.01 -10.38 -74.31 -78.32 -81.7
Other Investing Cash Flow Items, Total 16.64 -2.32 29.92 -91.63 -9.94
Acquisition of Business -2.9 0.43 -3.62 -108.4 -4.97
Sale of Business 2.5 2.54 0 0 0
Sale of Fixed Assets 9.66 7.33 28.66 0.46 2.14
Sale/Maturity of Investment 9.59 0 0 33.14 33.1
Purchase of Investments -0.82 -12.22 -3.47 -13.96 -41.14
Other Investing Cash Flow -1.4 -0.4 8.35 -2.87 0.93
Cash from Investing Activities 12.63 -12.7 -44.39 -169.95 -91.64
Financing Cash Flow Items -0.43 -1.57 -0.18 -1.96 1.4
Other Financing Cash Flow -0.43 -1.57 -0.18 -1.96 1.4
Total Cash Dividends Paid 0 0 0 0 0
Issuance (Retirement) of Stock, Net 0 0.15 1.18 19.52 7.14
Issuance (Retirement) of Debt, Net -15.05 1.55 -35.21 58.55 41.5
Cash from Financing Activities -15.48 0.14 -34.21 76.11 50.03
Foreign Exchange Effects 0 -0.01 0.34 0 0
Net Change in Cash 19.26 -10.71 6.66 -11.17 10.3
Net Cash - Beginning Balance 16.98 27.69 21.03 32.2 21.9
Net Cash - Ending Balance 36.24 16.98 27.69 21.03 32.2

Krispy Kreme FinanceKrispyKrispyKremeKreme
DoughnutsDoughnutsStarbucksStarbucks TimTim
Horton’sHorton’s CaribouCaribou RestaurantsRestaurantsIndustryIndustry
SpecialtySpecialtyEateriesEateriesIndustryIndustry
Market Cap:Market Cap: 201.84M201.84M 12.81B12.81B 6.29B6.29B 53.85M53.85M 204.46M204.46M 1.29B1.29B
Employ ees:Employ ees: 3,8753,875 172,000172,000 525525 1,6031,603 4.70K4.70K 759759
Qtrly Rev Growth Qtrly Rev Growth (yoy)(yoy):: -11.70%-11.70% 17.50%17.50% 10.50%10.50% 5.20%5.20% 7.10%7.10% 20.90%20.90%
Revenue (ttm):Revenue (ttm): 430.56M430.56M 9.82B9.82B 1.86B1.86B 256.83M256.83M 402.90M402.90M 1.07B1.07B
Gross Margin (ttm):Gross Margin (ttm): 11.21%11.21% 57.24%57.24% 26.82%26.82% 16.13%16.13% 28.56%28.56% 32.41%32.41%
EBITDA (ttm):EBITDA (ttm): 19.00M19.00M 1.47B1.47B 461.55M461.55M 25.57M25.57M 41.75M41.75M 147.18M147.18M
Oper Margins (ttm):Oper Margins (ttm): 0.10%0.10% 9.72%9.72% 20.42%20.42% -3.47%-3.47% 5.72%5.72% 1.14%1.14%
Net Income (ttm):Net Income (ttm): -59.65M-59.65M 675.74M675.74M 264.34M264.34M -30.66M-30.66M 8.81M8.81M -22.36K-22.36K
EPS (ttm):EPS (ttm): -0.944-0.944 0.8880.888 1.4001.400 -1.586-1.586 0.590.59 N/AN/A
P/E (ttm):P/E (ttm): N/AN/A 19.8919.89 24.2224.22 N/AN/A 19.9219.92 23.9123.91
PEG (5 yr expected):PEG (5 yr expected): N/AN/A 11 1.471.47 N/AN/A 1.101.10 1.211.21
P/S (ttm):P/S (ttm): 0.470.47 1.311.31 3.453.45 0.200.20 0.540.54 1.211.21

Strengths of Krispy Kreme• Signature hot Original Glazed doughnut• People know Krispy Kreme• Hot light• January 28,2007, 395 Store worldwide, of whic
h 113 were owned, 282 were owned by franchisees

Weaknesses of Krispy Kreme• Not flexible – difficulties
reordering when non-Hot light stores are sold out
• Franchisees close stores • No other standout
products (weak menu)• Bad relations with
franchisees (cost of equipment, packaging, ingredients, etc)
• Corporate Structure (CEO retired)

Opportunities for Krispy Kreme• Reputation –Fundraising program has helped
non-profit organizations raise millions of dollars in needed funds
• Worldwide sales• May steal back customers• Untouched domestic locations

Threats to Krispy Kreme
• Dunkin’ Donuts, Tim Horton’s, Starbucks, and other National Chains/Specialty Eateries
• KK stores went up too fast• Store locations too scattered• Increasing cost of ingredients• Increasing utility and fuel costs

What is the Problem?
How will Krispy Kreme return to profitability?
- Competitiveness
- Efficiency
- Franchisee relations

Critical Issues
• Banks saved KK in 4/08 extending life of loan agreement (interest rate higher)
• New CEO in fiscal 2008• Highly competitive w/ Dunkin Donuts, Tim
Horton’s and Starbuck’s• Focus on marketing• Closing of Franchises• Globalizing Krispy Kreme

Alternative 1
• Close unprofitable stores, and focus on other domestic areas and global market

A1 – Advantages and Disadvantages
Advantages• Increase capital from
sold locations and properties
• Decrease loss• Develop new market
Disadvantages• Lose domestic locations• Lose foothold in certain
regions• Risk for international
locations• Increase cost for new
locations

Alternative 2
• Diversify and expand product mix
• Develop culturally oriented products
• Redesign current product names and descriptions
• Redesign packaging (cups, wrappers, bags, etc.)

A2 – Advantages and Disadvantages
Advantages• Attracts new customers• Attractive to the
international market• More Competitive with
the market• May keep existing
customers• May increase items sold
per purchase• More efficient • More cost effective in the
long run
Disadvantages• New development and
packaging costs• New ideas may
discomfort old customers• Risk of not selling
Alternative 3
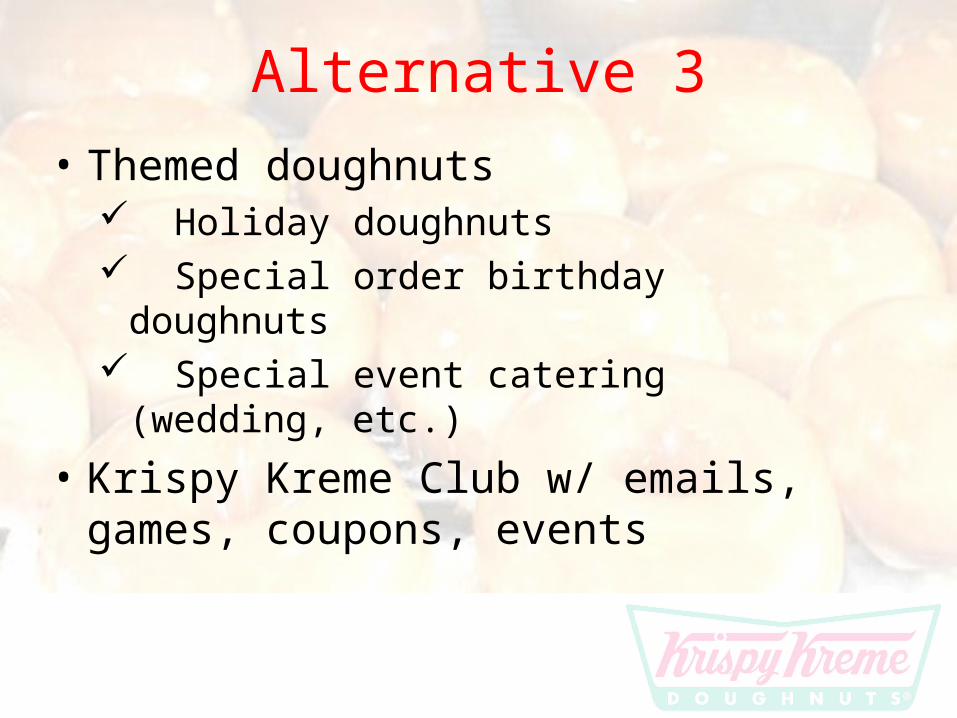
• Themed doughnuts Holiday doughnuts Special order birthday doughnuts Special event catering (wedding, etc.)
• Krispy Kreme Club w/ emails, games, coupons, events

A3 – Advantages and Disadvantages
Advantages• Attractive young ages• Increase the holidays'
sale• Loyal customers will
increase• Increase the
customers' database
Disadvantages• Remodel the
production line• Increase the website
setup cost• Need to find more
workforce to support new activities

Alternative 4
• Develop Krispy Kreme Mascot
• Formulate marketing strategy for mascot and 2008 Beijing Olympics
• Begin advertisements on TV and Radio

A4 – Advantages and DisadvantagesAdvantages
• Increase the visibility on market
• Increase sales• Increase celebrity/icon
marketing possibilities• More helpful on
increasing the international market
Disadvantages• A huge cost of
advertising expense• KK visibility is too low,
it may not have big help
• May be too late to plan for Olympics
• Olympic sponsors and partners were chosen years ago

Our Recommendation
Alternative 1
• Unprofitability must be realized• Back to the basics• Avoid being greedy again• Grow slowly• Other alternatives may be implemented in
the future

Krispy Kreme Doughnuts, Inc
Marketing Case Analysis
Course: MBA 524Instructor: Mary A. Higby
Date: April 22, 2008
Presented by: Jack Szczepaniuk Chun-Chiang Chan
Sources
Krispy Kreme website www.krispykreme.com
The Triangle Business Journal www.bizjournals.com
Investopedia www.investopedia.com