krbl corporate presentation july 2017 pptxcorporate presentation july 2017 . ... at vigyan bhawan,...
TRANSCRIPT

Corporate PresentationJuly 2017

Safe HarborThis presentation contains statements that contain “forward looking statements” including, but withoutlimitation, statements relating to the implementation of strategic initiatives, and other statements relating toKRBL Limited and its affiliated companies (“KRBL”) future business developments and economicperformance.
While these forward looking statements indicate our assessment and future expectations concerning thedevelopment of our business, a number of risks, uncertainties and other unknown factors could cause actualdevelopments and results to differ materially from our expectations.
These factors include, but are not limited to, general market, macro‐economic, governmental and regulatorytrends, movements in currency exchange and interest rates, competitive pressures, technological developments,changes in the financial conditions of third parties dealing with us, legislative developments, and other keyfactors that could affect our business and financial performance.
KRBL undertakes no obligation to periodically revise any forward looking statements to reflect future / likelyevents or circumstances.
IMPORTANT NOTICE
2

CONTENTS
3
Particulars Page No.
Industry Analysis 4
Investment Highlights 5
Business Overview 6-7
Awards and Recognition 8-9
Management & Board 10
Financial Overview 11-21
Highlights of Export & Domestic Market 22-26

INDUSTRY ANALYSIS No Threat of Substitute Products.
Basmati Rice is just 2% of total Rice Production in the World
Basmati Rice is GI Product and Grown only in India (70%) and Pakistan (30%).
Simple product – no hi-tech processing required / no fad / processed food.
Highest quality and high valued product, not commodity!
Threats
No China competition / other countries threat – Grown only in India and Pakistan.
Govt. regulations – no government / regulatory interference.
Economy, war, global crop patterns etc. – No major impact.
Hold on distributors
Largest and established player.
FMCG nature.
Trust with distributors
Hold on Farmers
R & D advantage – creator of 1121 variety.
Seed distribution – only player to distribute seeds.
Doing organic and contract farming.
Competition
Pricing Premium over competition.
New entrants – require huge marketing budgets and organizational management to manage entire supply chain.
4

Leading Market Position
5
World’s largest Rice Millers and Basmati Rice Exporters. India’s largest selling Branded Basmati Rice Company. Strong Brand presence through collaborations with global
retail chains. Leading position in Saudi Arabia’s market- world’s largest
Basmati Rice market. Exports to 73 Countries. One of the biggest manufacturer of Basmati Rice Seed.
Leading Brands
“India Gate”, the flagship brand of Company, is the topmostselling rice in the Branded Rice segment, both in India andOverseas market.
India Gate leads suite of well recognize and leader brands withcontinuous focus on improving visibility via ATL & BTL activities
Brand include – India Gate, Taj Mahal,Doon, Nur Jahan and manymore.
25% share in the Branded Basmati Rice sale in exports market. More than 30% share in the Branded Basmati Rice sale in domestic
market.
Best-in-Class Operations
India’s first fully integrated and scalable rice company. Rice manufacturing capacities of 195 MT per hour. Good realizations – export price per MT commands a
premium of more than 30% over the Industry average. Wide marketing network spread over all towns and cities
of the Country.
Strong Financial Performance
Short-term loan of the company rated [ICRA]A1+ by ICRA,indicating highest credit quality in the industry
Long Term Loan of the Company under (ICRA) AA- by ICRA,indicating high degree of safety.
Net Worth of the Company increased from Rs.14,983.40Millions in FY 2016 to Rs. 19,073.10 Millions in FY 2017
.
INVESTMENT HIGHLIGHTS

BUSINESS OVERVIEW Founded in 1889 in Faisalabad, Pakistan and incorporated in 1993, KRBL is India’s first integrated rice company. Engaged in seed development and multiplication, contact farming, production and marketing of Basmati rice. Being an integrated player, the Company generates value-added by-products like brain oil, de-oiled cakes and uses
rice husks for captive power plant. Branded Basmati rice Company, with manufacturing capacities of 195 MT / per hour. Last 5-year Net Sales Growth at CAGR of 14.06% and EBITDA Growth at CAGR of 22.47%. Last 5-years average Return on Capital Employed of 18.55% Last 5-years average Return on Equity of 23.50%.
Key Brands
6

BUSINESS OVERVIEW
State Of The Manufacturing Facilities With Distribution Network In India And Across the World
7
Rice BusinessPlant
LocationFunction Capacity
(MTn/hr)Grading &
Packing (MTn/hr)Gautam budh Nagar, UP
Rice Processing 45 30
Dhuri, Punjab Rice processing 150 60Alipur, Delhi Grading, Sorting
and Packaging-- 30
Sonipat, Haryana Grading, Sorting and Packaging
-- 20
Total 195 140Energy Business
Plant Location Function Capacity (MW)
Punjab Biomass 12.30Uttar Pradesh Biomass 5.25Sub-Total (A) Biomass 17.55Maharashtra Wind 33.50Rajasthan Wind 11.85
Tamil Nadu Wind 8.10Karnataka Wind 11.10
Andhra Pradesh Wind 10.50Madhya Pradesh Wind 12.00
Gujrat Wind 27.30Sub-Total (B) Wind 114.35
Madhya Pradesh Solar 15.00Sub-Total (C) Solar 15.00Total (A+B+C) Biomass/Wind/Solar 146.90
We export to 73 countries across the World
8
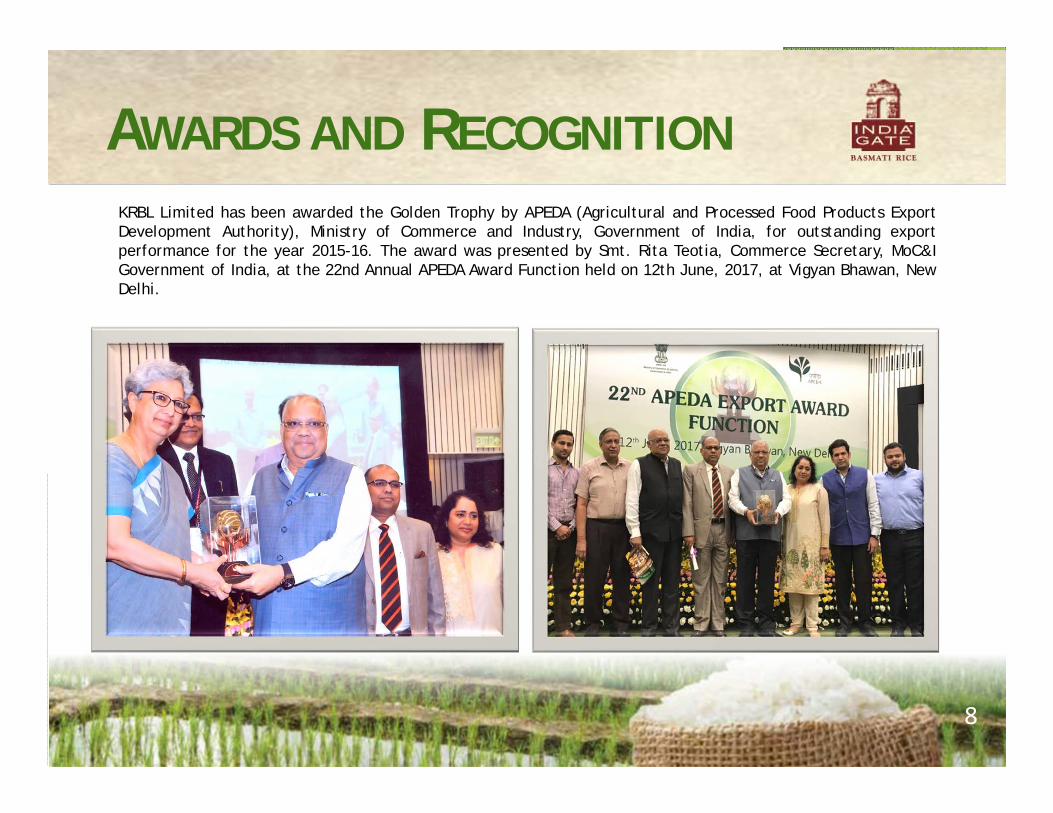
AWARDS AND RECOGNITIONKRBL Limited has been awarded the Golden Trophy by APEDA (Agricultural and Processed Food Products ExportDevelopment Authority), Ministry of Commerce and Industry, Government of India, for outstanding exportperformance for the year 2015-16. The award was presented by Smt. Rita Teotia, Commerce Secretary, MoC&IGovernment of India, at the 22nd Annual APEDA Award Function held on 12th June, 2017, at Vigyan Bhawan, NewDelhi.

9
AWARDS AND RECOGNITION
9

MANAGEMENT & BOARDExtensive Management Expertise in Rice Industry and Operation Across the Value Chain
Key ExecutiveAnil Kumar MittalChairman and Managing Director
Arun Kumar GuptaJoint Managing Director
Anoop Kumar GuptaJoint Managing Director
Priyanka MittalWhole-time Director
Rakesh MehrotraChief Financial Officer
Ashok ChandWhole-time Director
Back Ground
10
Visionary of the company, he provide strategic direction to all aspects of the business. Over 43 years of experience in the Rice industry. Founder & Former President of All India Rice Exporters Associations. He is a Art Graduate from Delhi University.
Expert on Basmati Paddy Supply Chain Management as well as on Paddy Milling Technology. Over 35 years of experience in the Rice industry. Executive Member of the Basmati Rice Farmers & Exporters Development Forum. He is a Commerce Graduate from Delhi University.
Financial Architect & the Chief Strategist of the Company. Over 34 years of experience in the Rice industry. Former Executive Committee Member of All India Rice Exporters Associations. He is a Science Graduate from Delhi University.
Overseas Brand Management of KRBL brand Handles corporate affairs and public engagement at Domestic & International level. Over 17 years of experience in the field of International Marketing & sales Management. Owner President Management Programme from Harvard Business School and BS in Business
Management from University of Southern California, LA.
USA Over 32 years of experience in the field of finance. Previously worked with some of the leading corporate like Surya Group, Lakhani Group, Sanjay
Dalmia Group, Mafatlal Group and Onida Group. He is a Chartered Accountants from ICAI and Commerce Graduate from BHU.
Over 43 years of experience in the field of engineering and food processing industry. Previously worked with some of the leading FMCG and consumer companies in the world. He has also obtained Certificate of Entrepreneurship from IIM, Ahmedabad.
10
FINANCIAL OVERVIEW
11
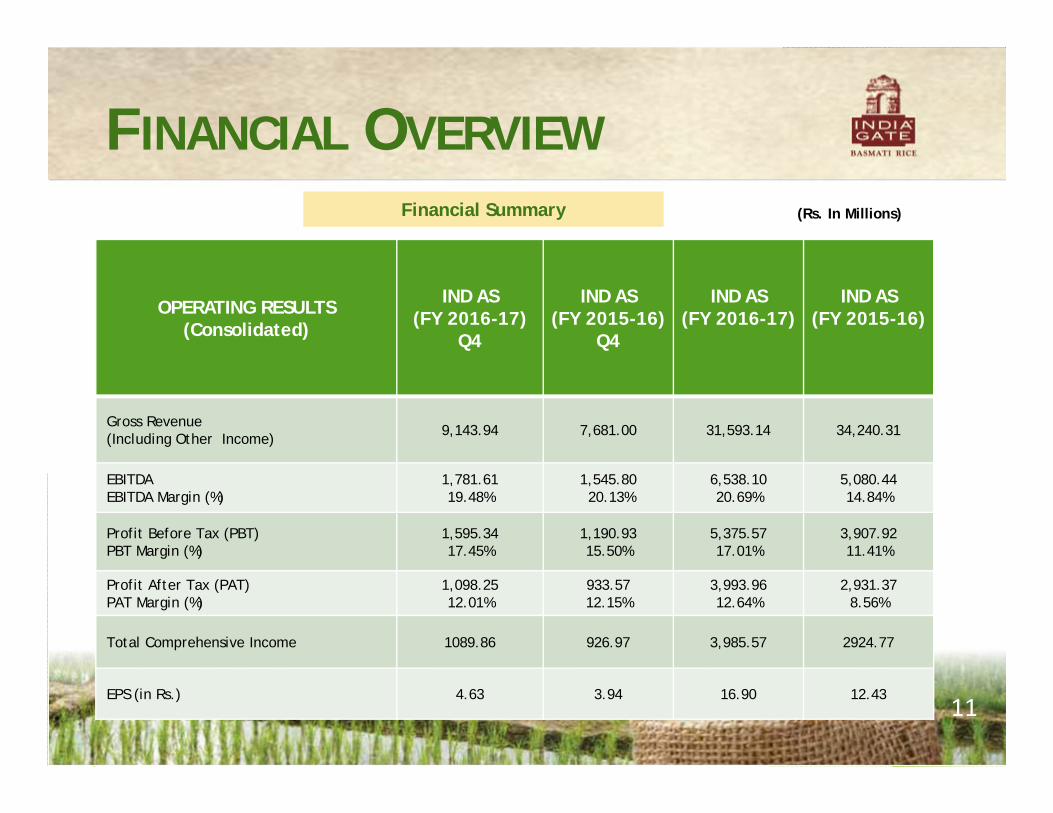
Financial Summary (Rs. In Millions)
OPERATING RESULTS (Consolidated)
IND AS(FY 2016-17)
Q4
IND AS(FY 2015-16)
Q4
IND AS(FY 2016-17)
IND AS(FY 2015-16)
Gross Revenue (Including Other Income) 9,143.94 7,681.00 31,593.14 34,240.31
EBITDAEBITDA Margin (%)
1,781.6119.48%
1,545.8020.13%
6,538.1020.69%
5,080.4414.84%
Profit Before Tax (PBT)PBT Margin (%)
1,595.3417.45%
1,190.9315.50%
5,375.5717.01%
3,907.9211.41%
Profit After Tax (PAT)PAT Margin (%)
1,098.2512.01%
933.5712.15%
3,993.9612.64%
2,931.378.56%
Total Comprehensive Income 1089.86 926.97 3,985.57 2924.77
EPS (in Rs.) 4.63 3.94 16.90 12.43

FINANCIAL OVERVIEW
12
(Rs. in Millions)
Operating Results (Consolidated) FY 2014 FY 2015 FY 2016 FY 2017
Operating Revenue from Operation 29,104.60 31,596.90 33,628.14 31,490.34
Other Income 145.40 61.10 612.16 102.80
Total Income 29,250.00 32,033.00 34,240.31 31,593.14
Operating Expenditure 24,699.10 26,714.50 29,159.86 25,054.97
EBITDA 4,550.90 5,318.60 5,080.44 6,538.17
EBIDTA Margin 15.56% 16.60% 14.84% 20.69%
Depreciation 576.60 526.90 497.76 614.19
Interest 760.20 808.90 674.75 548.40
Exceptional Items -currency Fluctuations(Gain)/Loss
(50.20) 41.90 - -
Profit Before Tax (PBT) 3,264.30 3941.00 3,907.92 5,375.57
Taxes 713.10 723.70 976.55 1,381.61
Profit After Tax (PAT) 2,551.20 3,217.30 2931.30 3,993.96
Net Items that will not be classified subsequently to PL
-- -- 6.60 8.40
Total Comprehensive Income -- -- 2924.77 3985.57

FINANCIAL OVERVIEW
13
Financial Result (Consolidated) FY 2014 FY 2015 FY 2016 FY 2017Fixed Assets (Incl. CWIP) 5,770.10 7,533.00 8,692.96 10,148.93
Current Assets, Loans & Advance 20,915.90 22,869.70 20,606.71 23,448.55
Gross Capital Employed 26,686.00 30,402.70 29,299.60 33,597.50
Current Liabilities & Provisions 3,369.50 4,437.90 2,869.82 3,355.69
Capital Employed 23,316.50 25,964.80 26,939.90 30,866.80
Share Capital 235.80 235.40 235.40 235.40
Reserves & Surplus 10,212.70 13,012.30 14,748.02 18,837.84
Share Holders Funds 10,448.50 13,247.70 14,983.40 19,073.20
Book Value (Rs.) 44.31 56.28 63.65 81.02
Long Term Loans 2,043.80 2,362.80 2,032.20 873.20
Working Capital Loans 11,111.70 10,451.60 8,913.89 9,650.51
ROCE (%) 18.26 19.50 17.99 20.52
Return on Equity (%) 27.81 27.64 21.68 23.39
No. of Share (in Million) 235.80 235.40 235.40 235.40
Earning Per Share (Rs.) 10.82 13.67 12.43 16.90
Cash EPS (Rs.) 13.29 15.91 14.55 19.51
(Rs. In Million)

FINANCIAL OVERVIEW
14
Key Performance Indicators (For the 12 months period Ended 31 March 2017)
COMPANY ACHIEVED HIGHEST EVER EBIDTA OF RS.6,538.17 MILLION IN THIS PERIOD AS COMPARED TORS.5,080.44 MILLION IN THE SAME PERIOD LAST YEAR, AN INCREASED OF 29%. EBIDA MARGININCREASED BY 565 BASIS POINTS FROM 14.84% TO 20.69%.
COMPANY EARNED PROFIT BEFORE TAX( PBT) OF RS. 5,375.57 MILLION AS COMPARED TO RS.3,907.92MILLION SAME PERIOD LAST YEAR, AN INCREASE OF 38%
PROFIT AFTER TAX(PAT) INCREASED BY 36 % TO RS.3,993.96 MILLION FROM RS.2,931.30 MILLION LASTYEAR.
IN SPITE OF DEPRESSED MARKET CONDITIONS KRBL HAS BEEN ABLE TO INCREASE THE EBIDTA MARGIN BY565 BASIS POINTS DUE TO STRONG BRAND IMAGE AND BETTER COST CONTROLS.
EARNING PER SHARE( EPS) INCREASED BY 36 % FROM RS.12.43 PER SHARE TO RS.16.90 PER SHARE THISYEAR.

FINANCIAL OVERVIEW
15
Revenue Growth and Margin Trends
29,105
31,597
33,628
31,490
FY 2014 FY 2015 FY 2016 FY 2017
Operating Revenue (Rs. In Million)
4,551 5,319 5,080
6,538
2,551 3,217 2,931
3,994
FY 2014 FY 2015 FY 2016 FY 2017
EBIDTA
PAT
15.5616.6
14.84
20.69
8.7210.04 8.56
12.64
FY 2014 FY 2015 FY 2016 FY 2017
EBIDTA Margin
PAT Margin
EBIDTA & PAT Margin (%)EBIDTA & PAT (Rs. In Million)

FINANCIAL OVERVIEW
16
Basmati Rice Export Value Realization per Unit (Rs./ Kg)
77.98 74.54
56.15 54.00
90.6697.91
73.0980.05
FY 2014 FY 2015 FY 2016 FY 2017
Industry KRBL

FINANCIAL OVERVIEW
17
Achieved Strong EPS Growth
10.8413.67 12.43
16.90
FY 14 FY 15 FY 16 FY 17
EPS ( in Rs.)

FINANCIAL OVERVIEW
18
Return on Capital Employed Return on Equity
27.81% 27.64%21.68% 23.39%
FY 14 FY 15 FY 16 FY 17
18.26% 19.50%17.99%
20.52%
FY 14 FY 15 FY 16 FY 17
Growth of the Company
16310
31490
FY 2012 FY 2017

Asset utilization to improve with higher capacity utilization
Dhuri Plant expected to be at 70% utilization level by FY20, leading to improved EBIDTA margin
UP plant at 100% utilization level
Strong Inventory build-up enabling extended storage period and hence enhanced margins. Very good inventory gains ascompany is carrying low-cost inventory in books
Inventory stood at Rs.20,199.60 Million in FY 2017
FINANCIAL OVERVIEW
19
(Rs.in Million)
Gross Fixed Assets Growth
8,985 11,251 12,962
14,880
FY 14 FY 15 FY 16 FY 17

FINANCIAL OVERVIEW
20
Balance Sheet Strength
10,459
13,248
14,983
19,073
FY 2014 FY 2015 FY 2016 FY 2017
Net Worth (Rs. In Million)

FINANCIAL OVERVIEW
Shareholding Pattern
21
Shareholding Pattern on 23-06-2017
Market Data (as on 4-7-2017)
58.81
0.020.12
6.74
17.47
16.84
Promoters
Bank, FI, Insurance &Mutual Funds
Foreign institutionalInvestors
Foreign Portfolio Investor
NRI/OCB/ForeignNational
Public / others
Market Cap (Rs. in Million) 91614
Share Price (Rs.) 389.20
Book Value Per Share (Rs) (31.03.2017) 81.02
52 Week High / Low (Rs.) 452.35/218.25
Outstanding Shares (Million) 235.40
BSE Ticker 530813
NSE Ticker KRBL

HIGHLIGHTS OF EXPORT MARKET
12% export share of the largestmarket of Basmati in the world –Saudi Arabia. India Gate Classicis the most aspirationalbrand in Saudi Arabia
India Gate #1 Indian Basmatibrand in Kuwait. 21% marketshare
India Gate #1 Indian Basmatibrand in UAE. 30% market share
India Gate #1 IndianBasmati brand in Qatar India Gate is #1 Indian
Basmati brand in Oman
India Gate #1 Indian Basmatibrand in Bahrain
22
(Source: Retail Data, Distributors Data, APEDA Data & KRBL Export Data)

HIGHLIGHTS OF EXPORT MARKET
Dominance in the Australasiaregion. India Gate # 1 brandin Australia and New Zealand
India Gate #1 Indian basmatibrand in Lebanon. Has 30%market share of Modern Trade.
India Gate #1 Indian Basmatibrand in Canada both in Modernand Ethnic market
KRBL brands have marketshare ranging 45%-15% inAfrican markets India Gate is the most
aspirational brand in Singaporeand Hong Kong
India Gate Classic mostaspirational brand inScandinavia
23
(Source: Retail Data, Distributors Data, APEDA Data & KRBL Export Data)

HIGHLIGHTS OF DOMESTICMARKET
24
(Source: AC Nielsen MAT March 2016 data)

HIGHLIGHTS OF DOMESTICMARKET
25
(Source: AC Nielsen MAT March 2016 data)

26
HIGHLIGHTS OF DOMESTICMARKET
26
(Source: AC Nielsen MAT March 2016 data)

Contact Details
KRBL LimitedC-32, 5th Floor, Sector – 62, Noida
Uttar Pradesh (U.P.) - 201 301
Contact Person
Rakesh MehrotraChief Financial Officer
Tel: +91-120- 4060 371, Mob. +91 98736 87721E-mail: [email protected]
27