komi tsowou economic analyst, special unit on commodities, unctad 3-4 and 6 -7 november, 2014 accra,...
TRANSCRIPT

Komi Tsowou Economic analyst,
Special Unit on Commodities, UNCTAD
3-4 and 6 -7 November, 2014
Accra, Ghana
Global minerals and metals commodity market : trends and their implications for Africa
Workshop and Policy Dialogue on AMV and EMDP for Public Officials and CSOs in ECOWAS

OutlineCommodity dependence across developing
regions;
Historical trends in MOM prices;
The recent boom in MOM prices and economic performance in selected countries ;
Outlook in MOM markets;
Way forward, policy options;
UNCTAD's work on commodity and development in line with AMV, EMDP

East
ern
Afr
ica
Cent
ral A
fric
a
Nor
ther
n A
fric
a
Sout
hern
Afr
ica
Wes
tern
Afr
ica
Cari
bbea
n
Cent
ral A
mer
ica
Sout
h A
mer
ica
East
ern
Asi
a
Sout
hern
Asi
a
Sout
h-Ea
ster
n A
sia
Wes
tern
Asi
a
Oce
ania
LDCs
0
20
40
60
80
100 All commodity exports as a share of total merchandise
2010-2011 2012-2013
Commodity dependence in selected developing regions
Commodity sector => 95%
Government revenues; Employment and income
for population; Foreign exchange
revenues across regions.
97-98%
Source :UNCTADStat
… In Western and Central Africa,
commodity dependence remains strong

Minerals, Ores and Metals ( MOM) dependence in West Africa
For many West African countries, MOM exports represent a large, if not the largest, share of merchandise exports over the past years
Benin
Burki
na F
aso
Cabo
Verde
Côte
d'Iv
oire
Gambi
a
Ghana
Guine
a
Guine
a-Biss
au
Liber
iaM
ali
Mau
ritan
ia
Niger
Niger
ia
Seneg
al
Sierr
a Leo
neTog
o -
10
20
30
40
50
60
70
80
11 12
1 1
11
20
69
1 3
49 50
30
0
6
53
14
23
46
3 4
19 18
52
0
20
53
60
23
1
13
52
23
Minerals, ores and metals exports vs. all merchandise exports in ECOWAS, (average in per cent)
2005-2009 2010-2013
Source :UNCTADStat
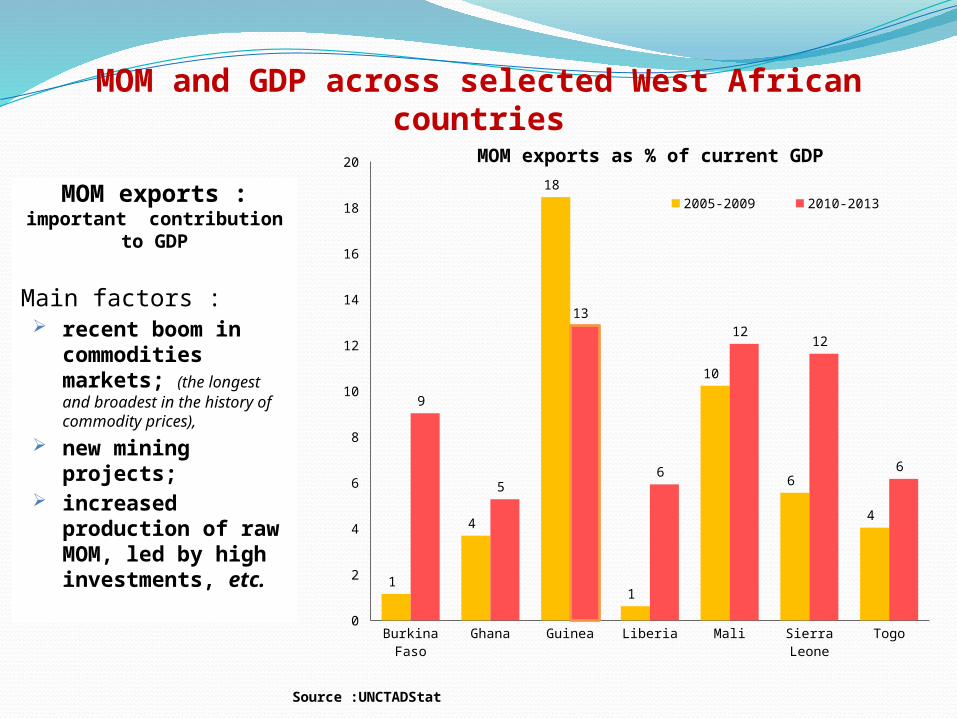
MOM and GDP across selected West African countries
MOM exports : important contribution
to GDP
Main factors : recent boom in
commodities markets; (the longest and broadest in the history of commodity prices),
new mining projects;
increased production of raw MOM, led by high investments, etc.
Burkina Faso
Ghana Guinea Liberia Mali Sierra Leone
Togo0
2
4
6
8
10
12
14
16
18
20
1
4
18
1
10
6
4
9
5
13
6
12 12
6
2005-2009 2010-2013
Source :UNCTADStat
MOM exports as % of current GDP

1980
1982
1984
1986
1988
1990
1992
1994
1996
1998
2000
2002
2004
2006
2008
2010
2012
0
50
100
150
200
250
300
350
400
Nominal and real price indexes of mineral, ores and metals (UNCTAD), 1980-2013 (2000=100)
Nominal price index(left axis) Real price index (right axis)
Historical trends in MOM prices
Nominal terms 1980-2002: indecisive path..
(?)
2003-2011
Boom period (peak: 2011)
Break : financial crisis:2007/08
2011-2013…
Relative easing; but strong prices compared to long term trends;
Real terms 1980…2002: overall
downward trend with short term fluctuations
Post-2000 … Boom: Strong upward trend
Source :UNCTADStat
Financial crisis (07/08); and
economic recession
(2008/2009)
2002: 87
2008: 332
2009:232
2011:375
2013:306

Historical trends in selected MOM prices
Aluminium (US$/t): 2000 : 1549 2007 : 2638
( 1.7 fold)
Copper (US$/t): 2000 : 1813 2011 : 8822
(5 fold)
Gold (US$/ounce ): 2000 : 279 2012 : 1669
(6 fold)
0.00
500.00
1000.00
1500.00
2000.00
2500.00
3000.00
0.00
1000.00
2000.00
3000.00
4000.00
5000.00
6000.00
7000.00
8000.00
9000.00
10000.00
Aluminium, USD/tonne (left axis) Gold, USD/ounce (left axis)
Copper, USD/tonne(right axis)
Nominal prices of selected metals, 1970-2013
Source :UNCTADStat and IMF, IFS
US$

Historical trends in selected MOM prices
Iron ores (US$/t ): 2000 : 12 2010 : 169 ;
14 fold
Nickel (US$/t): 2000 : 7959 2007 : 33809
4.25 fold Phosphate rock (US$/t)
2000 : 12 2008 : 346
29 fold
1970
1972
1974
1976
1978
1980
1982
1984
1986
1988
1990
1992
1994
1996
1998
2000
2002
2004
2006
2008
2010
2012
0
5000
10000
15000
20000
25000
30000
35000
40000
0
50
100
150
200
250
300
350
400
Nominal prices of selected metals, 1970-2013
Nickel, USD/tonne (left axis) Iron ore, USD/tonne (right axis)
Phosphate rock (USD/tonne (right axis))

Not only high prices… but also high price volatility from 2000High volatility: intrinsic feature of commodity prices
Source :data from UNCTADStat
1981
1982
1983
1984
1985
1986
1987
1988
1989
1990
1991
1992
1993
1994
1995
1996
1997
1998
1999
2000
2001
2002
2003
2004
2005
2006
2007
2008
2009
2010
2011
2012
2013
-100.00
-50.00
0.00
50.00
100.00
150.00
Inter-annual price variability for selected commodities in international markets,1981-2013
Minerals, ores and metals Iron ore Copper Zinc Gold
Per cent

Main drivers of minerals, ores and metals pricesMarket "fundamentals" :
Demand, led by increased industrial production;
Supply factors : supply constraints (due to low investments during 1980s-1990s);
Macroeconomic policy in developed economies : Expansionary policy in US and other developed economies => low
interest rates ==> :
i) lowering the cost of holding inventories => higher demand;ii) shifting financial investments away from bond markets to commodity-backed
portfolio investments ;
Financialization of commodities (derivative markets); Increased number of contracts traded on world exchange markets :
Share of commodities as a proportion of the global derivatives market :
MOM : as collateral for loans;
Speculative trading;
=> Upward pressure on volatility in MOM prices

Main drivers of MOM prices …focus on demand side
Strong global economic growth led by developing economies and the group of emerging economies;
2000-2001
2001-2002
2002-2003
2003-2004
2004-2005
2005-2006
2006-2007
2007-2008
2008-2009
2009-2010
2010-2011
-10
-5
0
5
10
15
20
25 GDP growth in groups of countries (2005 US dollars at constant exchange rate).
Developing economies Developed economies Emerging economies
Source :data from UNCTADStat

…especially China
Increased importance of China
China accounted for 60 % and 30 % respectively of total imports of iron ore and copper in 2011-2012 from nearly 10% and 5 % in 1995-1996
Share in world imports of copper and iron ores for selected countries over 1995/96-2011/12, per cent.
Source :data from UNCTADStat

China, leading importer in global commodity markets
Petroleum oils, crude
Coal
Aluminium ores
Natural rubber
Copper ores
Nickel ores
Cotton
Iron ore
1.1%
0.3%
4.3%
5.3%
4.4%
0.0%
12.7%
10.0%
3.9%
0.3%
9.0%
12.0%
11.9%
0.7%
1.7%
14.2%
12.6%
17.2%
22.7%
24.2%
32.4%
45.7%
52.1%
60.5%
China's share in world imports for selected commodities (1995-2012, current dollars)
2012 2000 1995
Source :data from UNCTADStat

Increased exports from ECOWAS to developing economies, especially …to China
-
1,000,000
2,000,000
3,000,000
4,000,000
5,000,000
6,000,000
MOM exports from ECOWAS by destination, 2000-2013
Developing economies Developed economies China20
0020
0120
0220
0320
0420
0520
0620
0720
0820
0920
1020
1120
1220
13 -
10
20
30
40
50
60
70
80
90
MOM exports from ECOWAS by destination, 2000-2013 (per cent)
Developing economies Developed economies China
Source : Data from UNCTADStat
%

MOM price trends and economic performance of selected resource rich countries (ECOWAS)
ECOWAS countries Improved economic
performance ; High correlation between
commodity prices, export earnings and economic performance;
But… did not lead to
enhanced productive capacity development (UNCTAD,2013)
-
2,000,000,000
4,000,000,000
6,000,000,000
8,000,000,000
10,000,000,000
12,000,000,000
MaliGross domestic product (GDP)Household consumption expenditureGovernment final consumption expenditureGross fixed capital formationExport revenues (MOM)
-500,000,000
-
500,000,000
1,000,000,000
1,500,000,000
2,000,000,000
2,500,000,000
3,000,000,000
3,500,000,000
4,000,000,000
4,500,000,000
Sierra LeoneGross domestic product (GDP)
Household consumption expen-diture
Source :data from UNCTADStat

… Economic performance elsewhere in Africa
1970
1973
1976
1979
1982
1985
1988
1991
1994
1997
2000
2003
2006
2009
2012
0
5000
10000
15000
20000
25000
Zambia
Gross domestic product (GDP)
Household consumption expenditure
Government final consumption expenditure
Gross fixed capital formation
Export revenues (copper)
Bil
lion U
SD
1970
1973
1976
1979
1982
1985
1988
1991
1994
1997
2000
2003
2006
2009
2012
0
500
1000
1500
2000
2500
3000
3500
4000
4500
5000
Mauritania
Gross domestic product (GDP)
Household consumption expen-diture Government final consumption expen-diture
Bil
lions
Source :data from UNCTADStat

Performance in the industry : turnover and EBIT of selected MNCs
Source : Bloomberg (accessed on 23/10/2014)
1995
1996
1997
1998
1999
2000
2001
2002
2003
2004
2005
2006
2007
2008
2009
2010
2011
2012
2013
0
10000
20000
30000
40000
50000
60000
70000
Rio Tinto
EBIT Turnover
1995
1997
1999
2001
2003
2005
2007
2009
2011
2013
-10000
0
10000
20000
30000
40000
50000
60000
70000
80000
BHP Billiton Ltd
EBIT Turnover
Significant increases in Turnover and EBIT of mining companies
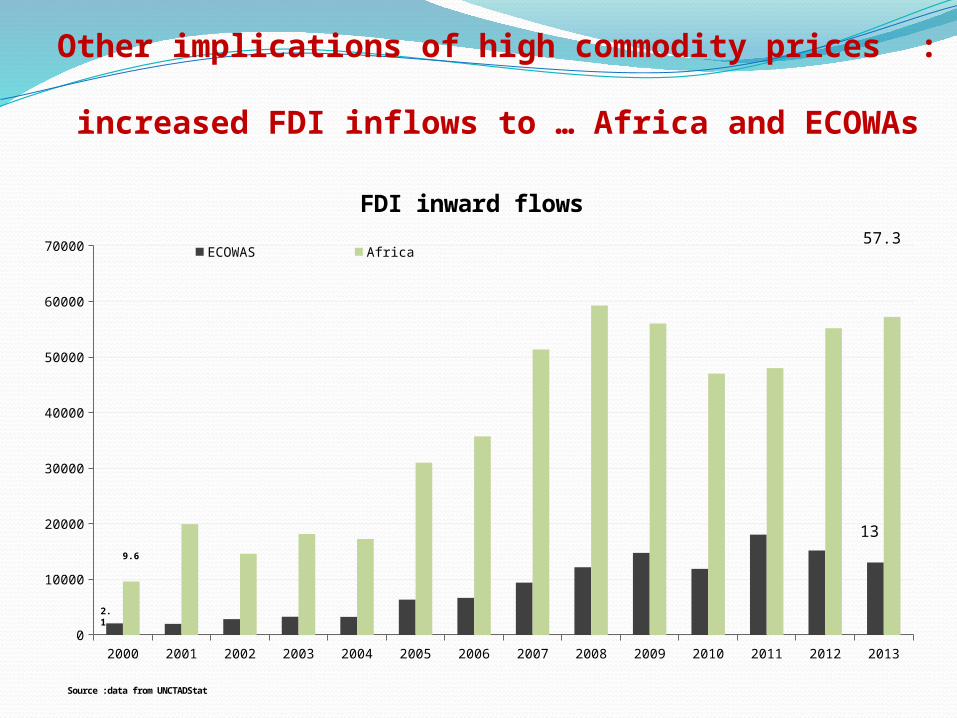
Other implications of high commodity prices : increased FDI inflows to … Africa and ECOWAs
2000 2001 2002 2003 2004 2005 2006 2007 2008 2009 2010 2011 2012 20130
10000
20000
30000
40000
50000
60000
70000
FDI inward flows
ECOWAS Africa
Source :data from UNCTADStat
2.1
13
57.3
9.6

…though slight increase in the share of world FDI flows to ECOWAS countries
2000 2001 2002 2003 2004 2005 2006 2007 2008 2009 2010 2011 2012 2013
18.84
27.00 27.41
32.68
38.58
34.26
29.22 29.53
36.77
43.5945.58
42.64
54.84 53.61
80.73
72.03 70.97
64.34
57.47
62.49
66.70 66.07
56.76
50.63 49.4651.79
38.84 38.96
7.51
11.13 10.67 11.3514.41
10.058.45 8.77 8.25 8.89
13.5512.15
17.32 17.00
0.15 0.24 0.45 0.54 0.44 0.64 0.45 0.47 0.67 1.21 0.84 1.06 1.14 0.900.68 2.38 2.32 3.01 2.34 3.11 2.41 2.57 3.26 4.59 3.31 2.83 4.15 3.94
FDI inward flow, as a share of world total, to selected group of countries,
Developing economies Developed economies Emerging economies ECOWAS Africa
Source :data from UNCTADStat
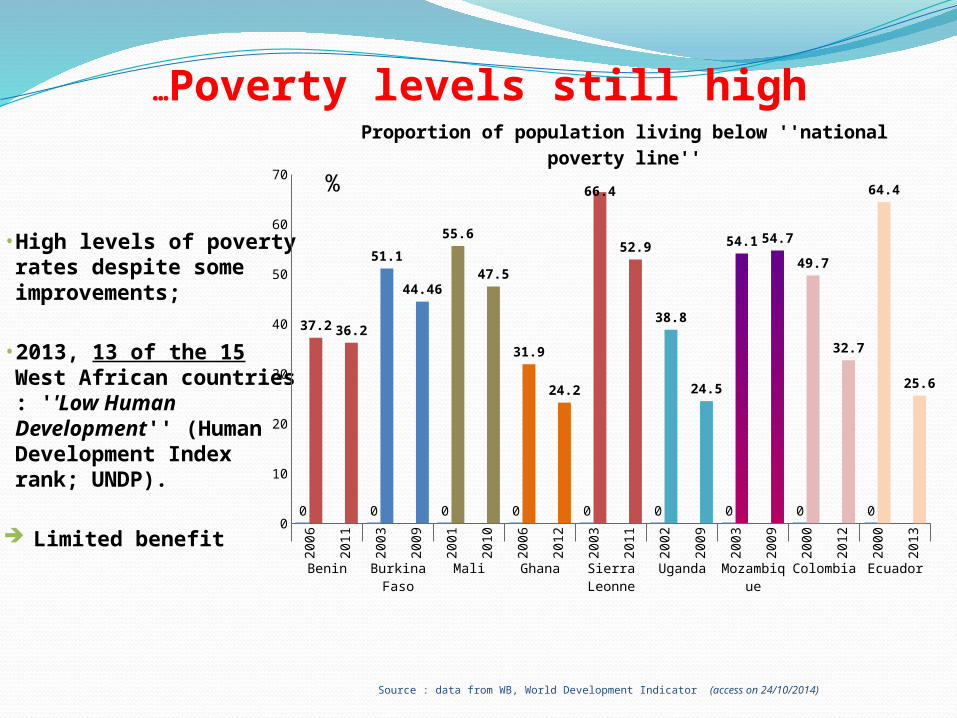
…Poverty levels still high
Source : data from WB, World Development Indicator (access on 24/10/2014)
•High levels of poverty rates despite some improvements;
• 2013, 13 of the 15 West African countries : ''Low Human Development'' (Human Development Index rank; UNDP).
Limited benefit
2006
2011
2003
2009
2001
2010
2006
2012
2003
2011
2002
2009
2003
2009
2000
2012
2000
2013
Benin Burkina Faso
Mali Ghana Sierra Leonne
Uganda Mo-zam-bique
Colombia Ecuador
0
10
20
30
40
50
60
70
0 0 0 0 0 0 0 0 0
37.2 36.2
51.1
44.46
55.6
47.5
31.9
24.2
66.4
52.9
38.8
24.5
54.1 54.7
49.7
32.7
64.4
25.6
Proportion of population living below ''national poverty line''
%

Benin
Burki
na Fa
so
Cape V
erde
Côte d
'Ivoi
re
Gambi
a
Ghana
Guine
a
Guine
a-Biss
au
Liberi
aM
aliNig
er
Nigeri
a
Sene
gal
Sierr
a Leo
neTog
o
Zambi
a
Sout
h Afri
ca
Indo
nesia
Chile
36 36
11
28 2630
25
48
71
3844
34
16
5243
21
3
15
4
1420
22
26
15
21 34
14
9
2314
41
24
1120
30
31
46
39
5045
67
46
60
4941
38
19
39 42
24
59
38 38
49
66
39
57
Value Added by economic activity as a percentage of the GDP, average 2000-2012 Agriculture, hunting, forestry, fishing Industry Services
What about local value addition…? not much promotion of economic diversification (industry) …
Source : UNCTADStat

Limited benefit from recent boom in MOM prices : some potential causes
Highly volatile and unpredictable commodity prices Increased vulnerability to market
swings (dependency on few raw minerals/metals );
Volatile foreign exchanges earnings;
Þ Macro economic instability;
Low value created at domestic levels;Lack of/ weak industrial growth
strategies;Few linkages of MOM industry to
local economy
Unequal distribution of resource rents; along the global value chains; at domestic levels;
Vulnerability to high prices
Broad based commodity boom; Many countries are low income
countries, and at the same time net-importers of commodities (incl. agricultural commodities, energy);
Resource curse; Succession of imbalances in the
economy of resource-rich countries; Low levels of investment in education,
vulnerability of resource-rich countries to commodity dependency, political instability;

Outlook in MOM prices : high level of uncertainty
Downside risk factors; Gloomy economic prospects
of industrialized economies (Euro zone)
Slower growth in China; Economic restructuring in
China away from I to C; => iron ores, copper prices
End of economic stimulus operation in the US : Gold prices;
… strong US dollar, high interest rate;
Upside risk factors Possible recovery (?) in US
economy; Demand from other
emerging economies such as India;
Export bans ; Economic restructuring in
China away from I to C zinc, aluminium, tin , lead
MOM prices : global downward trends since 2011 despite short-term fluctuations
MOM prices are likely to trend further down, however, they would remain high compared to their long term trends and
should remain so, from short to medium run…

Key messages
Commodities in particular MOM sector remain vital for Africa countries and ECOWAS;
Recent boom in global commodity markets, especially in MOM markets have been led by a number of factors;
Higher demand ; Supply constraints; Macro economic policies in
developed economies; Increased financialization of
commodity markets;
Such high MOM prices have contributed to economic growth in resource rich-countries across the continent;
However, in many cases, the transmission of these windfall gains to a path for sustainable socio-economic development has not been successfully achieved … yet;
MOM prices have been trending down over the past 2-3 years but remain high compared to their long term trends;
Way forward : (re)-establish the link between high MOM prices, real sectors and sustained growth of incomes through policies that give greater priority to
national development.The AMV and EMDP offer some relevant action plans to
achieve these objectives.

Way forward, policy options…short-medium term
Strategic vision and policy development:Regional, national levels Multi-stakeholder approach
Increase the shares of the rents generated by commodity production : Revising existing investment or mining contracts;More efficient form of taxing extractives industries
e.g.: progressive taxation on profits ;
Policies to retain values locally, targeting a broadening and deepening linkages (Upstream, Sidestream; Downstream) from commodity production :Local content policies

Local content policies : win-win strategies promoting upstream and downstream
industries; Create friendly environment with local
community; Increased employment, and technology
spillovers;
=> maximize the economic benefits made by the extractive industries in host countries;
But, critical challenges remain : Adopt a multi-stakeholder approach in devising local
content strategies/policies; Establish realistic local content strategies taking into
account local capacities and needs of extractive industries;
Create an independent authority to monitor and enforce local content policies;
Develop framework to accelerate innovation and appropriation of technology (R&D centers, skills development…);
Promote infrastructure development (critical for the establishing new, inclusive, and developmental growth path).
promoting forward and backward linkages with MOM sector;
Some lessons : Nigeria, Ghana, Zambia, Chile…
Way forward, policy options…short-medium term

Harness windfall gains from high MOM prices in the way that facilitate wider economic transformations and boost economic growth that is not driven by commodities alone : promote structural transformation incl. economic diversification
=> sustainable growth and development;
=> reduced vulnerability to commodity; Successful experiences in East and South East Asian economies
Investments in industrial/infrastructure projects ; Investments in domestic capital markets ( available capital to financing productive assets)
=> long term growth ;
Invest in Sovereign Wealth Funds (SWFs) (?) : to cope with instability in global commodity markets; to smooth inter-temporal imbalances in domestic spending and revenues;
But, not fully uncontroversial… opportunity costs in terms of investment in productive assets ; spending on health and
education and finance for real sector growth;…..appropriate strategy and balance needed.
Way forward, policy options…medium to long term

Way forward, policy options
Multi-stakeholder approach
…imperative to adopt …

UNCTAD's works on commodity and development in line AMV, EMDP
Research and analysis
Price trends and market developments: price formation, challenges facing CDDCs ;
Natural Resources Market Information Systems, UNCTAD NRIE
Commodity Finance and Exchanges:
Commodity policy reviews, resources management (rents, SWF, local content), Commodity development strategies, etc…
Capacity building and Technical cooperation
UNCTAD Africa Oil, Gas, Minerals Trade and Finance Conference ;
Multiyear Expert Meetings on Commodities and Development;
Global commodity forum; Projects ;
On-going : Strengthening the capacity of countries to enhance domestic production linkages from the mineral resources sector Pilot phase : 3 countries
Multi-stakeholder approach

UNCTAD, Special Unit on Commoditieshttp://unctad.org/commodities
Some selected publications (ref. to CDs)

Consulted documents
African Development Bank and African Union (2009). Oil and gas in Africa. United Nations publication. Sales No. HD9577.A2 O355 2009. Oxford ; New York
Africa Progress Report 2013: Equity in Extractives: Stewarding Africa's natural resources for all. Africa Progress Panel. 2013
Esteves, A.M., Coyne, B. and Moreno, A. (2013). Local Content Initiatives: Enhancing the subnational benefits of the oil, gas and mining sectors. Briefing note, July 2013. New York: Revenue Watch Institute.
Gylfason T (2001). Natural resources, education, and economic development. European Economic Review. 45 847–859.
UNCTAD (2013). Commodities and Development Report: Perennial problems, new challenges and evolving perspectives. March 2013. No. UNCTAD/SUC/2011/9. United Nations. New York and Geneva.
UNCTAD (2013). Trade and development report, August 2013. No. UNCTAD/TDR/2013 United Nations. New York and Geneva.
Morris M, Kaplinsky R and Kaplan D (2012). One Thing Leads to Another: Promoting Industrialisation by Making the Most of the Commodity Boom in Sub-Saharan Africa.
Sigam C and Garcia L (2012). Extractive Industries: Optimizing Value Retention in Host Countries. UNCTAD Discussion Papers, No. UNCTAD/SUC/2012/1. United Nations. New York and Geneva.

THANK YOUFOR YOUR
ATTENTION UNCTAD, Special Unit on Commodities
http://unctad.org/commodities