kirubi ms paper final 3 - renewable & appropriate...
TRANSCRIPT


ii
Abstract In this study I explore the relationship between modern energy and
economically productive activities in rural Kenya. Research is based on surveys done in Mpeketoni Village in Summer 2005, complimented by review of the literature. The findings reveal that access to electricity, in combination with simultaneous access to markets and other infrastructure (roads, communication, schools, etc), have contributed to robust growth of microenterprises in clear and compelling ways. For instance, productivity per worker and gross revenues per day increased by the order of over 200% for both carpentry and tailoring microenterprises.
Despite high tariffs [Ksh22.50 (US$0.30)/kWh or nearly 3 times the national grid tariff], Mpeketoni Electricity Project has demonstrated that there exists substantial unmet rural demand for electricity. My key policy recommendation is that small-scale power generation and distribution projects below a pre-determined capacity (say, 1000 kW) should be permitted to operate license-free in rural areas under a revised Electricity Power Act as is the case in India and Nepal. Removal of licensing bureaucracy for such small-scale mini-grids would make it possible for owners of diesel generators in rural areas to sell power “over-the-fence” to households and enterprises, thus increasing access to rural electrification.

iii
Table of contents List of Figures--------------------------------------------------------------------- List of Tables---------------------------------------------------------------------- Acknowledgements-------------------------------------------------------------- Chapter 1: Introduction------------------------------------------------------- 1.1 Research overview and statement of the problem----------------------- 1.2 Motivation and significance of the study--------------------------------- Chapter 2: Methodology------------------------------------------------------ 2.1 Nature and sources of data------------------------------------------------- 2.1 Definition of terms---------------------------------------------------------- Chapter 3: Literature review------------------------------------------------ 3.1 Modern energy as a catalyst for micro-enterprises--------------------- 3.2 Barriers and enabling factors experienced by micro-enterprises----- 3.3 Current rural electrification status and policy in Kenya--------------- 3.4 Key findings and conclusion from the literature reviewed------------ Chapter 4: Background to the project------------------------------------- 4.1 The study area--------------------------------------------------------------- 4.2 Project history, current status and customer base----------------------- Chapter 5: Results and discussion------------------------------------------ 5.1 Impact of electricity on micro-enterprises------------------------------ 5.2 Impact of electricity on agricultural and agro-processing activities- 5.3 Impact of electricity on education services ------------------------------ 5.4 Impact of electricity on banking and communication services-------- 5.5 Impact of electricity on women------------------------------------------- 5.6 The interactive effect between access to electricity, markets and other infrastructure vis-à-vis micro-enterprise development at Mpeketoni 5.7 Regulation policy implications of MEP’s experience ----------------- Chapter 6: Key findings and recommendations ------------------------- 6.1: Key findings----------------------------------------------------------------- 6.2: Policy recommendation and ideas for further research --------------- References------------------------------------------------------------------------ List of Figures: Figure 1: Map of Lamu District------------------------------------------------ Figure 2: MEP generators and transmission line at Mpeketoni village Figure 3: MEP annual electricity generation, sales and loses-------------- Figure 4: Trend in cost of electricity to MEP customers------------------- Figure 5: Electricity enduses by customer type------------------------------ Figure 6: MEP daily load profile----------------------------------------------- Figure 7: Typical farm today with harvested simsim and mango trees--- Figure 8: Variety of cash crops grown and marketed at Mpeketoni------- Figure 9: Trend in academic performance at Mpeketoni Secondary School------------------------------------------------------------------ List of Tables Table 1: Electricity demand summary at Mpeketoni------------------------ Table 2: Effect of electricity on productivity in carpentry workshop at Mpeketoni-------------------------------------------------------------- Table 3: Effect of electricity on productivity in tailoring shops at Mpeketoni-------------------------------------------------------------- Table 4: Variety of crops grown and income earned by farmers at Mpeketoni-------------------------------------------------------------- Table 5: Roads constructed in settlement schemes by GTZ/GASP-------
iii iii iv 1 1 2 3 3 4 6 6 10 12 16 17 17 18 26 26 29 32 36 36 38 44 46 46 47 49 18 20 21 21 24 25 30 31 32 23 27 27 39 40

iv
Acknowledgement I incurred many debts of gratitude as I researched and wrote this paper, the largest
of which is to the e7 Network for funding my studies at UC Berkeley. Very special thanks to my advisor, reader and inspiration: Prof Dan Kammen. I owe special thanks to Prof Arne Jacobson for being an excellent reader and a friend. I thank, Kenyatta University, the Scottish Power (UK), Energy for Sustainable Development (ESD) and Energy for Sustainable Development Africa (ESDA) for funding and valuable institutional support. I am particularly grateful to Andy Riley (Scottish Power), Jonathan Curren (ESD), Mark Hankins, Charles, Murefu Barasa (ESDA) for remarkable goodwill and tirelessly responding to my questions. Special thanks to Stephen Karekezi (AFREPREN) for encouragement and great insights on energy policy in Africa. For the extra-ordinary gesture of support and inspiration from Patrick Karani (BEA International), I say thank you.
I want to acknowledge the splendid help given to me by the Mpeketoni Electricity Project (MEP) committee members. I extend this gratitude to all the respondents, from whom I learned a great deal. I wish, too, to express my appreciation to my colleagues Amber Kerr, Renee Kuriyan and Andrew Mills for excellent feedback on my earlier drafts. Additional thanks to the entire ERG community and to Naim – my America 101 teacher. Finally, I must express my deepest appreciation to my family for enduring my long absence from home. Thank you for willing to sacrifice so much so graciously. I hope I will make it up to you!

1
CHAPTER 1: INTRODUCTION
1.1 Research overview and statement of the problem
Broad agreement exists that for global poverty to be addressed the poor must have
access to modern energy services1. A number of researchers claim that for modern energy
to make a difference on poverty, it must necessarily contribute to “productive uses” that
generate income and create jobs. IDS (2001) asserts that the “vicious cycle of poverty
will only be broken by combining improved energy services with end-uses that generate
cash income.” Martinot et al (2002) add that applications of renewable energy that
provide income generation and social benefits such as clean drinking water, cottage
industry, distance education, and improved agricultural productivity, “will appeal to
increasing segments of rural populations”.
While these claims are compelling, data on the broader benefits of modern energy
for micro-enterprises, income generation, and sustainable livelihoods for the poor in
Africa is extremely limited (Meadows et al, 2003; Martinot et al, 2002). The Mpeketoni
Electricity Project (MEP) in Kenya, where diesel generators and a mini-grid distribution
network delivers power for use in a remote rural village, was selected for this study to
explore the impact of modern energy on micro-enterprises. This particular case study was
selected because it permits a direct exploration of the connections between the supply of
modern energy, in this case electricity, and microenterprises for rural development.
One hypothesis was that “modern energy plays an important role in the start-up
and growth of microenterprises in rural areas.” In testing this hypothesis, I examined the
relationship between rural electrification and micro-enterprise development. In other
words, I was interested to understand the degree to which rural electrification may
contribute to sustainable livelihoods and poverty reduction in a rural setting. Various
aspects of the energy-enterprise-livelihoods nexus were examined, including the value of
energy for enterprise, income and employment creation, and other development goals
such as education.
The second hypothesis is drawn from the literature reviewed (see section 3.5). A
key conclusion from the literature is that modern energy, in this case electricity, should
1 The term modern energy refers to a variety of improved energy sources e.g., liquefied petroleum gas (LPG), kerosene, electricity- whether from fossils fuels or renewables (Meadows et al, 2003)

2
be viewed as one of a suite of critical enabling factors that act individually and/or in
concert to create a suitable environment in which micro-enterprises can operate. In other
words, access to electricity is a necessary but not sufficient condition for the start-up and
development of SMEs. A testable hypothesis arising from this assertion is that: “an
interactive and synergic effect exist between access to electricity, markets and other
infrastructure which is essential for microenterprise development2.” In testing this
hypothesis at Mpeketoni, I will use three metrics for which data is available: (i) markets
for agricultural produce; (ii) roads; and (iii) facilities for social amenities (schools,
polytechnic, and communication services)
1.2 Motivation and significance of the study
Small and micro-enterprises (SMEs)3, also known as the informal sector, have
become an integral player in the African economy. In Kenya, for instance, this sector
accounted for 20% of the GDP in 1999 (CBS et al, 1999) and 64% of the urban
employment by 2002 (Karekezi and Majoro, 2002). Studies in India have also shown that
SMEs enable rural households to generate non-farm income which can largely contribute
to poverty reduction (Lanjouw and Shariff, 2002). In general, SMEs purchase (rather than
harvest or collect) their energy, including electricity, LPG, kerosene, firewood, charcoal,
etc. This is true even in rural areas. Moreover, despite energy being one of the significant
factors for most microenterprises, there is knowledge gap on how much energy is being
consumed; neither is it systematically documented what role energy plays in diversifying
production and expanding employment opportunities by microenterprises, both in urban
and rural areas (Clany and Dutta, 2005). Motivating my study was the need to address
this knowledge gap within the broader discourse of productive energy uses.
Another motivation is that the MEP project has been hailed as a “successful”
project and selected for scaling-up into a wind-diesel hybrid energy system by the e7
2 When two components of a production program interact to make each other viable, their simultaneous access is imperative (see Leonard, 1991) 3Refers to very small businesses, employing less that 10 people each, and produces goods or services for cash income (Allerdice and Rogers, 2000). SMEs are often grouped and referred by different categories and acronyms, but for this study microenterprises and SMEs are conveniently used interchangeably.

3
Group4 in conjunction with Ministry of Energy (Kenya), ScottishPower Plc (UK) and
Energy for Sustainable Development (Scottish Power, 2005). Thus understanding how
and why the project has been “successful” and documenting its local micro-enterprise and
livelihoods impacts is both critical and timely. The findings will provide policy makers,
rural development practitioners and entrepreneurs with insights and lessons regarding the
role and value of modern energy in facilitating and supporting the establishment and
growth of micro-enterprises and how and why these can be linked to sustainable
livelihoods and poverty reduction in Kenya.
CHAPTER 2. METHODOLOGY
2.1 Nature and sources of data
The study combined quantitative and qualitative methods, including surveys,
electricity generation and consumptions analysis as well as changes in SMEs’
productivity to analyze the social and economic significance of access to electrification in
rural Kenya. The field survey was conducted in the summer of 2005 at Mpeketoni
village, where a community-owned and managed diesel-powered mini-grid has been in
operation since 1994. The guiding questions framing the survey were: (i) What difference
did access to electricity make to the SMEs and other social institutions like schools? (ii)
How did SMEs and other residents themselves assess and experience the difference? (iii)
What are the policy implications for rural electrification arising from MEP experience?
Primary data was collected using participatory rural appraisal (PRA), combined
with secondary electricity consumption data from the MEP’s records. The PRA used a
combination of techniques to collect a consistent set of data from direct observations and
interviews. Semi-structured interviews with operators of SMEs and MEP management
committee elicited much of the information on the impact of electricity on the startup and
growth of SMEs in the village. Separate interviews with key informants (including
government officials, teachers, community leaders, agricultural extension officers)
provided supplementary information and helped in cross-validation of data collected from
the questionnaires.
4 A group of electricity companies in the national territories of the G8 countries. The Group supports demonstration sustainable energy projects in developing countries (see www.e7.org)

4
The impact of electricity was assessed using two types of SMEs: carpentry and
tailoring. As the supply of electricity at Mpeketoni is very erratic, the two trades are
always switching back and forth between using electricity and manual labor for their
production5.
Thus, the erratic power supply permitted me to observe and compare the production
patterns of workers in the two trades as they consistently operated on two modes, i.e.,
“with” and “without” electricity. Unexpectedly, the frequent outages presented a unique
“experimental” opportunity to observe two distinct production scenarios within the same
sample group; yielding a more reliable data set used to estimate the cause-and-effect
relationship between electricity and production of typical SMEs.
In other situations where the effects of “with” and “without” electricity could not
be observed within the time constraints of the study (e.g., in agriculture and education), a
less reliable recall method of “before” and “after,” using key informants, was applied.
The possible unreliability of recall data, exacerbated by the absence of a comparable
control study village, suggests that often the directions of (positive) changes I describe
are of more significance than the absolute figures presented.
2.2 Definition of terms
In this section, I define key terms and concepts related to study of electrification
and economic development in Mpeketoni Village.
2.2.1 Modern Energy
The term “modern energy” as used in the literature can be taken to refer to a
variety of energy sources including liquefied petroleum gas (LPG), kerosene, and
electricity, either grid or off-grid – whether generated by burning fossil fuels or by using
renewable sources such as solar, biomass, hydro or wind (Meadows et al, 2003).
Generally speaking, however, modern energy is most commonly associated with and
sometimes (wrongly) used as a synonym for “electricity” or “electrification”. The
5 Outages are the rule rather than the exception – lasting from a few hours to several days (Kirubi, personal observation). In Feb 2004, one outage lasted 3 weeks due to a major technical breakdown.

5
literature review for this study will relate to modern energy in general, while my case
study will specifically focus on a rural electrification project using a diesel-powered
mini-grid at the Mpeketoni Settlement Scheme.
2.2.2 Micro-enterprise
The term “micro-enterprise” refers to a very small business that produces goods
or services for cash income (Allerdice and Rogers, 2000). Micro-enterprises can be
identified on the basis of a number of characteristics. For example, they usually operate
in the informal sector of the economy, require little in the way of initial start-up capital,
and have few employees, usually defined as less than ten (CBS et al, 1999). Micro-
enterprises are often home-based (Karekezi and Majoro, 2002), and as a result the
employees are usually family or household members working on a casual basis
(sometimes without cash wages). It is also often difficult to distinguish between
household expenditure and that of the micro-enterprise. SMEs operate in a number of
economic sectors, including commerce (e.g., retail and trading in new and second-hand
goods, agricultural produce), manufacture (i.e., production activities), and service
(including personal and non-personal services).
2.2.3 Productive uses of energy
The conceptual understanding and knowledge base linking energy and productive
uses have expanded over the past decade. Traditional understanding emphasizes direct
income generation as the primary goal of productive uses of energy (Barnes, 1988;
Rogerson, 1997; FAO, 2000; IDS, 2001). For instance, according to Kittelson (1998)
productive use is any use of electricity that helps generate income for the end-user. It may
be a huge “cement factory or a tiny juice stand with an electric blender.” However, in
order to respond to international development goals which go beyond income, (e.g., the
Millennium Development Goals), and to also keep pace with an updated understanding of
what development is, other researchers have expanded the traditional thinking to
encompass the tremendous impact that energy services have on education, health and
gender equality (Cabraal et al 2005; Etcheverry, 2003). For instance, Kapadia (2004)
defines “productive uses” of energy to involve the utilization of energy – both electric

6
and non-electric in the forms of heat or mechanical energy – for activities that enhance
income and welfare. The activities are typically in the sectors of agriculture, rural
enterprise, health and education. Examples of such activities are pumping water for
agriculture, agro-processing, lighting, information and communications, vaccine
refrigeration, etc. In using this definition, Kapadia is cautious that the distinction
between “productive uses” and “consumptive uses” is by no means clear-cut because
overlaps can occur. To permit broader exploration of the impact of electrification and
economic development, including micro-enterprises, agriculture and education at
Mpeketoni, this study adopts the expanded view of productive energy uses.
CHAPTER 3: LITERATURE REVIEW
3.1 Modern energy as a catalyst for micro-enterprise
Reviewed literature demonstrates that access to modern energy is a necessary but
not sufficient condition for the start-up and development of micro-enterprises. Another
key finding is that, while lack of modern energy is often characterized as a barrier to
micro-enterprise development, removing this barrier (through, for example, energy
development such as (rural) electrification) does not necessarily result in micro-enterprise
development. In other words, access to modern energy is neither the only nor even
necessarily the most important factor influencing micro-enterprise development. Other
factors such access to finance, markets, and other infrastructure are also very important.
Support for the notion that modern energy can and does act as a stimulus for the
emergence, growth and continued development of micro-enterprises is relatively strong
in the literature reviewed (Fakira, 1994; Foley, 1990; Karekezi and Majoro, 2002). Fakira
(1994 cited in Meadows, et al 2003), for example, claims that “energy is one of the
critical resources needed to liberate micro-enterprises from low value, low productivity
and low income activities.” Allerdice and Rogers (2000) suggest that “access to even
limited amounts of electricity for micro-enterprises in non-grid–connected areas can be
important to the establishment and growth of those businesses.”
Khan (2001) demonstrated the significance of better lighting for increased
income-generation attributable to extension of business hours into the evenings. The
author cites examples of tailors who worked for four more hours and thereby increased

7
their revenue by 30% in Bangladesh. Opening hours for shops were also found to
increase by an average of three hours a day and in terms of new businesses, Khan
concluded that adequate lighting is a “deciding factor” in whether or not people opened a
home-based business. Foley’s (1990) study reports increased economic activity and
higher living standards following electrification and concludes that “the arrival of an
electricity supply in certain areas seems to be a crucial factor in precipitating decisions by
local entrepreneurs to invest in a variety of productive enterprises.”
Rogerson (1997) cites evidence from KwaZulu/Natal of positive impacts of on
existing SMEs that benefited from the switch to electricity including welding shops and
tailors. In other sectors such as brickmaking and garment manufacturing, the availability
of electricity determines levels of technology and also has strong influence on cost and
levels of production. In Northern Province of South Africa, the contrast between rural
SMEs without access to electricity and those in electrified industrial estates is instructive.
Rural SME owners indicated that lack of electricity was among the main limitations to
their competitiveness while those operating in the industrial estates mentioned the
presence of electric service as one of the benefits of location in the estate, in addition to
other important infrastructure available there (Rogerson, 1997).
Anecdotal evidence is commonly used to support the argument that modern
energy can and does play an important role in stimulating micro-enterprise. For example,
Rana-Deuba (2001) suggests that access to modern energy produced by micro-
hydropower in Nepal has been found to result in or contribute to the establishment of
bakeries, photo studios, battery charging, grocery stores, agricultural and saw mills and
small-scale agricultural activities such as poultry farming and goat keeping. Balla (2003)
reports a similar variety of SMEs established and/or expanded following micro-hydro
rural electrification projects in Kirinyaga and Meru Districts of Kenya.
Dube (2001, cited in Karekezi & Majoro, 2002) suggests that the security lighting
on high-masts (poles) in poor urban areas of South Africa has resulted in the urban poor
setting up small enterprises in the evenings. Similarly, the Nairobi City Council in Kenya
has embarked on a program to repair and install streetlights along the inner roads,
walkways and slums with a view to relocating hawking businesses from the congested
central business district into the outer parts of the city. Installation of streetlights has

8
increased visibility, attracted more customers, improved security and extended the hours
of operating businesses into the night, thus improving sales and profitability (Kirubi,
personal observation, July 2005; Daily Nation, 12/16/2005).
Several case studies from Grameen Shakti’s PV program illustrate well the value
of modern energy to microenterprises (Meadows et al, 2003). For example, a local
appliance repair shop, using solar power to undertake repairs, was reported to increase
income by US$25 per day. A lamp-renting enterprise which rented out 5 solar lamps
earned an extra US$12.50 a month and the operation of solar powered cellular phone
system earned the owner an estimated US$30 a day extra. Extended working hours at a
local barbershop using solar lighting was found to increase income by US$5 a day. In
addition to these financial indicators, other direct impacts experienced by these
enterprises included better work quality and efficiency, a better working environment and
greater income from ancillary sales associated with attracting customers in the evenings.
Other indirect impacts of these enterprises using solar systems were identified as greater
customer satisfaction, increased income for workers, increased social status of owners
and customers, increased living standards for locals and increased employment
opportunities.
Nevertheless, there are conflicting reports and differences of opinion in the
literature regarding the impact that modern energy can and does have on entrepreneurial
activities, and hence its developmental importance. Several authors have offered
explanations for these differences. One view is that modern energy is one of a number of
critical enabling factors necessary for micro-enterprise development. For example,
Barnes (1988) reports finding greater numbers of businesses in rural areas with electricity
than those without it, but also highlights that there were other complimentary local
conditions such as “ready availability of adequate credit finance and access to markets”.
Another perspective is that while electricity is crucial to existing and well-
established micro-enterprises, it is not so much a contributing factor in the emergence of
new ones. Following a literature review of international work on rural electrification,
Rogerson (1997) concludes that access to electricity encourages the “modernization” of
existing rural SMEs but “it exerts only a modest stimulus for the growth of new
enterprises.” This skepticism is echoed by Wamukonya and Davis (2001) who observed

9
that “overall, rural electrification does not seem to have had significant impact on the
growth of income-generating activities in Namibia”. They note that very few home-based
businesses used electricity and when they did, they mainly made use of electrical
“lighting only”. In their view, access to finance and markets are more important for
SMEs than electricity.
Other studies strongly question the developmental value of modern energy (e.g.,
solar PV) that provides “lighting only” in rural areas6 Karekezi and Kithyoma (2002)
have observed that, while typical solar PV systems (40-100Wp) are useful for lighting in
rural SMEs, they cannot meet the “heating and shaft/motive” power needs of the SMEs,
which are 100-1000 times higher. PV technology, they contend, is thus unsuitable and
uneconomical for agro-processing activities that often represent the most attractive
options for generating incomes in rural areas (emphasis added). An FAO study (2000
cited in Cecelski, 2000) on the impact of solar PV on rural development shares this view
and emphasizes the need to go “beyond the light bulb” in order to have an impact on
poverty reduction. While acknowledging the limitation of solar PV as an anti-poverty
intervention, Jacobson (2004), nonetheless concludes that “solar PV appears to play a
small but potentially significant role in supporting income and work related activities in
rural Kenya” (emphasis added). He cites a 2003 survey (n=76 households) where 32% of
the households with solar PV reportedly used “lights for income generation or work
related activities.” In total, 48% of the households in the same sample reported some
“sort of work or income-related activity” that was supported by use of solar PV. In
addition to lighting services, Jacobson further draws our attention to another important
application of solar PV: supporting “connective” appliances such as TV, radio and
cellular phones in rural areas. The (economic) value of information from the use of these
appliances is particularly difficult to evaluate, however.
To bring better clarity and reconciliation in the energy-SMEs debate, it is
methodologically insightful to bear in mind that while the term “micro-enterprise” may
be useful to describe a broad spectrum of similar income-generating activities, the
businesses themselves are not homogenous but often have different characteristics and
6 Technically, solar PV can provide a wide range of energy services beyond lighting. However, due to its prohibitive cost, rural households/SMEs can only afford small systems (20-50Wp range) adequate to power a few lights, radio, and TV (Jacobson, 2004).

10
different needs. Consequently, it is inevitable that there will be differences in the degree
to which access to modern energy affects each micro-enterprise. In fact, Meadows et al
(2003) questions the validity of studying small or micro-enterprises as a group, arguing
that a sub-sector approach is more useful. It may be more relevant, for instance, to look at
milling, information communication and technology (ICT), carpentry or metalworking
businesses (see, for example, a study on SMEs in metal work by Kabecha, 1999),
irrespective of their size. According to this view, modern energy may be good for some
sub-sectors, neutral for others and perhaps negative for others7.
3.2 Barriers and enabling factors experienced by micro-enterprises
Many of the examples cited above seem to suggest a common conclusion in the
literature, namely that modern energy is neither the only nor even necessarily the most
important factor influencing micro-enterprise development. Rough evidence to this effect
is provided by Rogerson (1997) who reports on the findings of a study which asked
micro-enterprise businesses to rate the various constraints facing their businesses in
South Africa. The findings showed that on a scale from 0 (completely satisfied) to 100
(completely dissatisfied), lack of electricity received a rating of only 12 and was ranked
34th out of the 46 possible business problems listed by the survey. While more contextual
information is required to meaningfully interpret this ranking (e.g., quality and cost of
energy relative to other infrastructural or business services), the findings are important
because they reflect the value of energy as subjectively assessed by SMEs.
On the other hand, this type of ranking could also be highly misleading,
underestimating as it does, the indirect value of energy. Energy, unlike water or food, is
valued as a means not an end; only valuable for delivering the energy services that end-
users need. Thus it is not surprising that most households and micro-enterprises rarely
ranked energy as top priority compared to say water or security. A point reinforced by
noting that none of the eight Millennium Development Goals (MDGs) directly refers to
energy, yet energy is critical to the achievement and sustainability of all MDGs
(Ogunlande, 2005; McDade, 2004). In a report to the 2005 G8 Meeting, Practical
7 ESD (2000) contends that introduction of modern energy such as LPG to displace traditional biomass fuels may have negative livelihoods impacts on the producers and traders of the latter who are poor, mostly women, for whom there are very few alternative employment options.

11
Action(2005) notes that “at the individual or community level people may not express
their needs in terms of demand for energy, but they do desire the services that it provides,
such as cooked food, pumped clean water, lighting, heating, radio, telephone, transport,
reduced drudgery and time saved.” Moreover, at the national level energy is seldom the
most visible issue on the national development policy agenda, yet it can help facilitate
stable economic development, allow access to global markets, impact on the national and
global environment and affect national budget allocations.
The international literature suggests a number of other critical enabling factors for
micro-enterprises. A key enabling factor and one that is frequently discussed is access to
financial resources, especially credit for raw materials, fixed assets and working capital
(Rogerson, 1997; Allerdice and Rogers, 2000; Wamukonya and Davis, 2001). Indeed, it
has been contended “access to credit is probably the most frequently cited constraint
across the SME sector” (RWEDP, 1999 cited in Meadows et al, 2003).
In discussing the technological capability of micro-enterprises in Kenya’s
informal sector, Kabecha (1999) identifies and then classifies the constraints into two
categories: (i) internal constraints (e.g., lack of entrepreneurial ability, historical
underdevelopment of the micro-enterprise sector, entrenchment of expensive private
foreign capital, lack of organization), and (ii) external constraints (e.g., technological
gaps, dependence on foreign sources of equipment, low levels of education and training,
limited markets for products, lack of working space and infrastructure to expand
operations, lack of suitable premises, lack of electricity and water – found to impose a
severe constraint on the level of technology that can be adopted, and uncertainty in the
informal sector not conducive to private investment).
Lack of access to modern energy that is reliable and affordable may act in concert
with and/or contribute to the occurrence of additional barriers to micro-enterprise
development. For example, the benefits of ICT such as computers and the internet for
obtaining information and reaching markets are restricted to users with access to an
effective electricity supply (Duncombe and Heeks, 2001; Heeks and Duncombe, 2001).
Similarly, getting the goods or services to the markets requires transport, which in turn
requires energy. Thus, Rogerson (1997) suggests that the effect of technological

12
constraints and inadequate infrastructure in limiting modern energy services for micro-
enterprise is but one of the “myriad constraints” that confront micro-enterprises.
Access to modern energy per se is also not the only significant issue in
considering the effect of modern energy on micro-enterprises. The energy, as well as the
electric tools and equipment, need to be reliable and affordable to be effective enabling
factors for micro-enterprise (Kittelson, 1998). Osunbitan et al (2000) illustrate the
importance of energy supply reliability in their examination of the energy used to power
machinery in agro-allied micro-enterprises, in this case cassava and palm oil processing.
They found that despite the availability of electricity via grid connection in urban and
semi-urban areas of Nigeria, the processing centers studied did not depend on or use
electric engines because of unstable power supplies, preferring instead to rely on diesel
engines. An unreliable energy service was cited by micro-entrepreneurs in Uganda as one
of a number of common energy-related problems that they encountered (Meadows, et al
2003).
Others constraints included unstable voltage (which necessitates use of voltage
stabilizers to protect equipment from damage during surges); non-transferable power
connections (resulting in situations where new tenants inherit the previous tenant’s bill);
having to pay bribes to get connected to power and high tariffs. Karekezi and Majoro
(2002) also report that in Zimbabwe the tariff categories for electricity supply are
“particularly unfavorable” for micro-enterprises. These authors conclude that the
provision of modern energy to SMEs and the agricultural sector could be enhanced by
progressive policies such as liberalization of distribution and tariff setting. In the next
section, I review the policy environment relating to rural electrification in Kenya.
3.3 Current rural electrification status and policy in Kenya
In 2001, Kenyan’s national population was 30 million and 66% lived in rural
areas with a very low ($350) national GDP per capita (Nyoike, 2004). Electrification
statistics are depressing: only 15% have of the population has access to grid electricity,
less than 4% have access in rural areas, and electricity consumption per capita is a mere
104 kWh (Kamfor, 2002). Started in 1973, the Rural Electrification Program (REP) is the
primary means of electrifying rural areas in Kenya (Walubengo and Oyango, 1992). The

13
Kenya Government, via the Ministry of Energy (MoE), contracts the services of the
national utility, the Kenya Power & Lighting Company (KPLC), to oversee the planning,
execution, operation and management of REP countrywide (MoE, 2003). From the
outset, a deliberate policy decision was made to prioritize electrification of the
administrative district headquarters, public and commercial services (e.g., market centers,
schools, hospitals, etc) as well as rural industries (e.g., coffee, tea and sugar factories)
(Walubengo and Oyango, 1992). According to these authors, the early phase of REP was
“very successful” as all the administrative headquarters, main market centers and rural
agricultural factories had been electrified by early 1990s.
Despite the extensive grid network reaching majority of towns along major roads,
access to electricity by the rural poor households remains a pipe dream. For decades,
strategies for increasing the rate of new connections to cover upcoming towns and
households have engaged the minds of researchers, policy makers, and politicians.
Available data indicate that, since 1973, only about 80,000 consumers (inclusive of
households, industrial, commercial and public services) had been connected by the year
2002 at a total cost of Ksh 10 billion (US$14.2million). (Balla, 2003). Funding for REP is
generated primarily through a 5% cross-subsidy levy imposed on each electricity
consumer. This support is supplemented by donor support, which accounts for 18% of the
funding for the program. (MoE, 2003).
Another major policy concern is that despite a steady growth in revenue for REP,
new connections have slowed or stagnated. For instance, despite a staggering five-fold
increase in revenue from Ksh200 million (1993) to Ksh1 billion (2001), the number of
new connections remained relatively constant. In other words, the cost per connection in
1993 was about Ksh40,000 while in 2001 it had risen to Ksh200,000 (Karekezi et al,
2003). A Rural Energy Task Force appointed by the MoE in year 2003 sheds
considerable light on the challenges facing REP and how they could be overcome. The
Task Force identifies lack of appropriate and effective institutional framework, high
operating costs, and high capital costs as the three key constraints to accelerated rural
electrification in Kenya (MoE, 2003).

14
The current arrangement whereby REP is managed by the Permanent Secretary8
in the MoE, supported by a committee comprising members from MoE, Office of the
President, Ministries of Finance and Planning, and KPLC, is one key institutional
weakness (MoE, 2003). The Task Force claims that the Committee has not been effective
as it lacks well-equipped full-time technical staff and a secretariat to manage the REP. To
address this institutional weakness, the Task Force recommends creation of an
autonomous body, such as a Rural Electrification Agency, to be directly and fully
responsible and accountable for the REP.
Prohibitively high operating cost is another key constraint. Under the contractual
agreement signed in 1973 between the KPLC and the Kenyan Government, the latter
owns assets created through the implementation of rural electrification9(MoE, 2003). The
Government is also required to underwrite any operating losses attributable to rural
electrification incurred by KPLC. As proportion of total REP resources, the losses have
dramatically grown from 14% (1973-83 period) to 54% (1999-2002 period). This
analysis makes it evident that the bulk of REP funds are significantly depleted by KPLC
operating losses; leaving very little for system expansion. Moreover, the Task Force
claims that the operating losses are inflated. To address the operating losses problem, the
Task Force recommends that REP assets be transferred to KPLC and REP tariff be
(marginally) adjusted to cover the losses. Hypothetically, if the REP assets had been
owned by KPLC between 1998 and 2002, and if the losses for the same period had been
covered by the tariff, the Task Force estimates that this would have resulted in a tariff
increase of only Ksh0.20 per unit or 2.5% of the current average tariff of Ksh8 (MoE,
2003).
Except for a few isolated diesel stations in northern parts of the country, REP is
primarily implemented by capital-intensive grid extension. On average, it currently costs
Ksh1.0 million (US$13,333) to construct one kilometer of an 11kV or 33kV line while
the average cost of connecting a rural customer is Ksh80,000 to 150,000 (US$1066 -
2000) (MoE, 2003). The diesel stations are equally prohibitive requiring approximately
8 Permanent Secretary is the chief executive government officer heading a ministry in Kenya. 9 The report does not specify the assets in question. But from the report context, it can be inferred assets refer to the distribution network serving REP customers in addition to stand-alone diesel generators installed in the remote districts.

15
Ksh500,000 (US$6666) initial capital costs; while their operating costs [Ksh39 or
US$0.52/kWh] is more than double compared to the hydro-based rural grid [Ksh16 or
US$0.21/kWh]. To reduce capital costs, the Task Force recommends diversification of
REP energy sources portfolio to include small hydro, solar, wind, and biomass.
The current energy policy and legal framework embedded in the Electric Power
Act (EPA) of 1997 is also considered a serious impediment to accelerated rural
electrification. EPA is the legislation governing the generation, transmission and
distribution of electrical energy. The Act’s main thrust is liberalizing the electricity
power sector by attracting private investors into the electricity market. Independent
power producers (IPPs) can and do generate electricity and sell it to KPLC for
distribution. However, a number of authors have identified a couple of material
weaknesses in the Act which impact negatively on rural electrification (Balla, 2003;
Nyoike, 2004; Karekezi et al, 2003, EAA10, 2002).
First, the de facto distribution monopoly enjoyed by KPLC limits the potential of
increased rural electrification. By virtue of KPLC holding distribution licenses covering
most of Kenya, if not the whole of it, this implies that no other entity can establish a rural
mini-grid or decentralized system without express permission of KPLC. KPLC was only
recently salvaged from near bankruptcy by the State (Karekezi et al, 2003). In effect, it is
likely to take a while for the utility to upgrade its overloaded distribution system before
embarking on expansion of its rural electrification program. Second, not only are the
prescribed licensing procedures bureaucratic, cumbersome, centralized and expensive,
they also fail to differentiate between small-scale (e.g., <1000kW) and large scale
generation (EAA, 2002).
UNDP (2002) reports additional weaknesses in the EPA (1997) revealed by the
implementation process of micro-hydro schemes in Kirinyaga and Meru, jointly done by
MoE, Intermediate Technology Development Group (ITDG)11 and local communities.
The Act permits only one standard for electricity accessories which would be wasteful for
minigrids. Moreover, the Act neither encourages competition in tariffs nor provides
incentives to attract IPPs to rural areas. The good news is that remarkable progress is
10 EAA has since changed to ESDA (Energy for Sustainable Energy Africa). 11 ITDG has since changed to Practical Action.

16
being made in revising the Act. Drawing from the Kirinyaga and Meru experience and
the recommendations from the Task Force on Rural Energy, the proposed Sessional
Paper No.4 on Energy (2004) will, when passed by Parliament, dramatically transform
the REP (GoK, 2004). First, a Rural Electrification Agency (REA) to mange REP will be
established while DG minigrids, powered by a wide range of renewables and/or diesel,
are permitted. Second, the need for electrifying productive uses such as irrigation and off-
farm income generating activities is made more explicit. With respect to incentives for
DG minigrids for rural electrification, a one-off financial subsidy will be provided to
support communities or the private sector.
Despite the reported progress on the policy front, my key claim is that licensing
barriers, among others, have discouraged investments in small-scale mini-grids in rural
areas, hence contributed to slow rural electrification12. Thus, the question at this juncture
is what policy implications for revising the EPA, particularly on licensing, can be drawn
from the MEP’s ‘success’ story? We turn to this question later in section 5.8.
3.4 Key findings and conclusions from the literature review
In terms of linkages between modern energy and micro-enterprises, the literature
reviewed in the study highlight a number of important findings. First and foremost is that
modern energy can, but does not necessarily, affect the emergence, development,
productivity and efficiency of micro-enterprises. Secondly, while lack of modern energy
is often characterized as a barrier to micro-enterprise development, removing this barrier
(through, for example, energy development such as (rural) electrification) does not
necessarily result in micro-enterprise development.
Modern energy should, therefore, be viewed as one of a suite of critical enabling
factors that act individually and/or in concert to create a suitable environment in which
micro-enterprises can operate. This suggests the importance of assessing the significance
of modern energy in relation with the presence or absence of other enabling factors
needed for micro-enterprise development. The importance of integrated infrastructure 12 Licensing barriers to mini-grid is of course only part of much broader set of complex and interrelated power-sector reform processes underway in Kenya. Other notable factors include privatization, poor sequencing of reforms, misappropriation of rural electrification funds, political interference, low priority for the poor, etc ( see Karekezi et al, 2003; Marundu and Kayo, 2004; Wamukoya, 2003; Nyoike, 2004; World Bank, 2000 and others for detailed discussion).

17
planning and development particularly in rural areas to achieve and sustain economic
development is another recurring theme in the literature. Despite the creation of a REP
nearly 4 decades ago, the rate of rural electrification (4%) in Kenya is dismal. Clearly,
myriad factors (e.g., power-sector reforms, mismanagement, underfunding, corruption,
etc), account for the slow rate; and licensing barriers to DG is but one of the important
policy constraints. Before turning to policy lessons from MEP, a brief geographical and
historical background of the study area is in order.
CHAPTER 4: BACKGROUND TO THE PROJECT
4.1 The Study area
Geographically, the Lake Kenyatta Settlement Scheme 1 at Mpeketoni is located
west of Lamu Island in Lamu District, Coast Province of Kenya. Figure 1 shows a map of
Lamu District, indicating Mpeketoni located in the southern part of the district.
Mpeketoni is part of a resettlement program initiated in early 1970s in an area with high
agricultural potential. Mpeketoni is the largest town and is surrounded by many
smallholdings and villages. The physical land area is 14,224 ha with population of 28,000
in 1997 rising to over 31,000 by 2004. Ecologically, the area experiences bimodal rainfall
at an average of 1000mm per annum with long rains from April to August and short rains
from October to December13. January to March are the hottest and driest periods with
temperatures reaching 32o C. Vegetation is mainly cultivated farmlands with patches of
bush and savannah grassland with red loams and sandy soils (Illy et al, 1997).
The area has low altitude of 4-17m above sea level and is generally flat with the
highest point at Bomani Hill at 29 m above sea level. Other key physical features include
a lake (2km2) and sand dunes along the shores of the Indian Ocean. Administratively, the
Scheme is located within Mpeketoni Division which is further sub-divided into 3
locations (Mpeketoni, Baharini and Mkunumbi) and six sub-locations –which are small
manageable village blocks.
13 Rainfall pattern in Kenya is bi-modal, i.e., two rainy seasons per year characterized as short and long-rains based on the amount of precipitation received.

18
Figure 1: Map of Lamu District (source: Data Exchange Platform for the Horn of Africa (DEPHA), www.depha.org.)
4.2 Project history, current status and customer base
The idea of starting a community owned and operated electricity company at
Mpeketoni Settlement Scheme was conceived in 1991 in partnership between the
Mpeketoni Jua Kali Association and the German Assisted Settlement Project (GASP) via
GTZ (German Technical Cooperation Agency). The initial capital cost (in constant
2005Ksh)14 was Ksh2.7 million (US$36,000). GASP contributed Ksh1.8 million
(US$24,000) and the Mpeketoni Jua Kali Association, in conjunction with other
community members, raised Ksh0.9 million (US$12,000). The contribution by the
community was mobilized as equity capital through selling of shares to individuals, who
became the shareholders of MEP. The project was commissioned in 1994.
14 Money values are in constant 2005 Ksh and Exchange rate: US$1 =Ksh75 (August 2005). I maintain this conversion throughout the paper, unless otherwise indicated.
Mpeketoni town

19
MEP has a simple management structure. At the top are the shareholders who
elect an executive committee of seven members. They have an accountant-cum-manager
who is responsible for accounting and administrative issues. Reporting to the manager are
two technicians, who operate and maintain the gensets, and one night security watchman.
There is also an internal audit committee for strengthening financial oversight. Meter
reading is done using hired casual labor while the accountant is responsible for
processing monthly bills and collecting payments. MEP operates for 18hrs per day: 5am
to 12am.
The present mini-grid operates using three Deutz-brand generating sets: 150kVA,
57kVA and 60kVA (Figure 2). A pre-feasibility study commissioned by Scottish Power
(2005) established that the system is designed such that the 2 smaller gensets (57kVA and
60kVA) are manually synchronized and used as backup when the 150kVA fails.
However, synchronization has been problematic and the load has continued to increase,
with peak loads sometimes reaching 200kW15. Electricity is transmitted without
transformers (at 415VAC-three phase and 240VAC-single phase), leading to power
surges which can be destructive to electronic equipment.16. The study estimated the
distribution system is 6km (3,152m of 75mm conductor and 15,882 of 50mm conductor).
The main weaknesses identified with the system design include lack of service parts for
the aging Deutz gensets, faulty power correction unit, use of different-sized transmission
cables, poor earthing, voltage drops, leaning poles and sagging cables, automation of
control systems and air and noise pollution (gensets are located near residential area). The
study concludes “each of these items contributes to the poor performance of the system
and increases the hazards to the operators and users of the electricity generated.”
15 This refers to frequent instantaneous sharp loads attributable to frequent turning on and off of electric motors particularly for milling and welding. Otherwise, average peaks are much lower at 50kW max (Figure 6). 16 Fuses had been installed to in the system to prevent surges from destroying equipment but were later removed due to their frequent blow rate (sub-standard). Complaints of damaged equipment are common from customers (Scottish Power, 2005).

20
Figure 2. MEP generators and transmission line at Mpeketoni village (Photos: courtesy of
ESDA)
Figure 3 below provides an overview of power generated, sold and the
distributional losses by MEP from 1994 to 2003. There was a dramatic growth in
generation and sales of over 300% between 1994 and 1995. A steep increase in price,
coupled with severe capacity constraints, started to slow down new connections as early
as 1997. Nonetheless, the average growth in both generation and sales remained high at
nearly 50% per year. As shown in Figure 4, the cost of power has steadily increased by
nearly 28% per year from Ksh11 (US$0.15)/kWh in 1994 to the current Ksh22.50
(US$0.3) per kWh, which is approximately 3 times the average national grid tariff of
Ksh8 (US$0.11)/kWh (MoE, 2003)17. The increase, according to MEP, is primarily due
17 The Ksh10/kWh tariff is exclusive of a cross-subsidy which Mpeketoni customers would enjoy if they were connected to the rural electrification program, meaning they are effectively paying much more that 3 times. On equity grounds, innovative ways should be found to extend the publicly-funded cross-subsidy to community owned mini-grids. One way would be to provide them with a one-off financial subsidy to enable them procure and install high-quality the systems as recommended by proposed Sessional No. 4 2004 on Energy (GoK, 2004). Another would be to waive and/or reduce import duties on spare parts. For instance, as part of scaling-up the generation capacity, the PS, MoE, has pledged to support MEP with two gensets (250kVA each) to replace the current old ones (MEP, ESDA officials, personal comm.).

21
to corresponding rise in cost of diesel from Ksh27 (US$0.36)/liter in 1994 to Ksh65
(US$0.87)/liter by early 2005 or 24% average price increase per year.
0
50000
100000
150000
200000
250000
Year19
9419
9519
9619
9719
9819
9920
0020
0120
0220
03
Year
Ann
ual e
lect
ricty
gen
erat
ion
(KW
h)
KWh generatedKWh soldKWh losses
Figure 3. MEP annual electricity generation, sales and loses
0.00
5.00
10.00
15.00
20.00
25.00
30.00
1994 1996 1997 2000 2004 2005
Year
Uni
t cos
t of e
lect
ricity
(Ksh
/kw
h)
Figure 4: Trend in cost of electricity to MEP customers (cost adjusted to constant 2005 Ksh)
This high cost of electricity, the relatively high connection charges of Ksh10,500
(US$140) (at time of study), and the limited mini-grid capacity to serve more customers

22
have reduced its ability to grow with hundreds of new connection applications pending at
the MEP office. An important insight is that the Ksh10,500 connection fee is nearly the
price of 20 months of power for the lowest level of users, mainly households18. MEP has
two tariff rates divided into single-phase and three-phase. Single phase customers,
representing over 90% of all connections, are levied a service charge of Ksh250 ($3.30)
per month in addition to their consumption charges. Another important finding is that
only 10% of MEP customers have three-phase connection, yet they provide the critical
anchor loads. These customers are levied Ksh500 ($6.70) monthly service charge in
addition to their consumption charges. MEP further imposes a fine of Ksh200 ($2.70) for
any late payment.
MEP is literally the life-line of the local economy, with a very diverse customer
base as summarized in Table 1 below. The data in Table 1 allows some important
observations to be made. First, the use of power by most customers is limited to a
relatively small time each day, ranging from 6 to 9 hours. This is perhaps a deliberate
response to saving costs and/or just the nature of their business operations. Second, the
top eleven single customers with consumption above 100kWh/month [ranging from the
secondary school (2700kWh/month to post office (125kWh/month)] account for nearly
40% of the power produced, indicating that they provide strong anchor loads19. For
instance, Mpeketoni Secondary School, the largest single customer (2700 kWh/month),
consumes approximately 45% of total demand by all households (6060kWh/month).
Third is the wide variation in consumption across the households, i.e., the average
demand per household is approximately 143kWh/month, 60kWh/month and
24kWh/month for high-, medium-, and low-demand households respectively.
18 For customers that use <100kWh per month (170 out of 240), Scottish Power (2005) recommends use of a single tariff and load limiters and do away with individual meters. This could reduce both the costs of meter reading and installation costs. At time of study, MEP used 2 casual laborers for meter reading at a cost of Ksh200/person/day for 2 days/month. This works to Ksh800/month or Ksh4 per customer (there are 224 customers in total). The customers with the lowest use levels pay an average of Ksh525/month. Eliminating meter reading would therefore have a negligible saving of < 1.0%. However, I did not establish how the Ksh10,500 connection fee is determined. Balla (2003) noted the used of single-tariff enhanced access to low income SMEs in the Tungu Kabiru (Mbuiru) community micro-hydro project. 19 TSS ginnery has its own genset in addition to being connected to MEP. The genset supplies power for cotton processing and MEP power is used for lighting and other low loads (Scottish Power, 2005).

23
Table 1: Electricity demand summary at Mpeketoni
Customer type
Estimated no. of
customersLoad (kW)
Total load (kW)
Hours /day kWh/day
Estimated use (kWh/month)*
High-demand households (>89kWh/month) 23 0.6 13.8 8 110 3300
Mpeketoni Sec. School 1 10 10 9 90 2700 Retail shops 40 0.25 10 6 60 1800
Low-demand households (0-21kWh/month) 60 0.1 6 8 48 1440 Medium-demand households (22-88kWh/month) 22 0.25 5.5 8 44 1320 MEP posho mill 1 8 8 6 48 1200
TSS cotton ginnery 1 5 5 9 45 1125 Petrol stations/welding
shops 6 1.2 7.2 6 43 1075 Bar, lodging, restaurant 4 1.2 4.32 6 26 780
Repair shops 24 0.2 4.8 6 29 725 Mpeketoni hospital 1 3.5 3.5 8 28 700
Posho mill 1 1 4 4 6 24 600 workshops
(woodworks/carpentry) 2 1.8 3.6 6 22 550 Big hotel 1 1.5 1.5 9 14 420
Posho mill 2 4 4 4 4 16 400 Tea/coffee café 20 0.1 2 6 12 300 Mosque/church 3 0.6 1.8 6 11 270
Big garage 1 1.3 1.3 8 10 250 Catholic church 1 1.5 1.5 6 9 225
Telekom 1 1 1 8 8 200 Non governmental
organisations 2 0.5 1 6 6 150 Mpeketoni Youth
polytechnic 1 0.8 0.8 6 5 125 Post office 1 0.8 0.8 6 5 125
Police station 1 0.5 0.5 6 3 90 Bank (Kenya commercial
Bank Ltd) 1 0.5 0.5 6 3 75 District Officer office 1 0.5 0.5 6 3 75
Total 224 50 103 175 722 20,020 *A month is assumed to be 25 days for public offices which normally don’t work over weekends (such as post office, DO’s office), and 30 days for SMEs. Source: data adopted from Scottish Power (2005).

24
MEP customers can be further ranked by monthly consumption as shown in
Figure 520. One striking observation is that the three grain mills in town consume slightly
less (2200kWh/month) than the demand by both the 60 low-, and 22-medium-demand
households combined (2760kWh/month). Results in Table 1 and Figure 5 are consistent
with an important point made earlier in the literature that SMEs have higher intensity of
energy use than households (see Karekezi and Kithyoma, 2002; Mapako and Mbewe,
2004, TERI, 2003). The data further amplifies the important benefits of going “beyond
the light bulb” by targeting SMEs which provide better anchor loads, thus improving the
techno-commercial viability of rural electrification – either via grid or off-grid.
0500
100015002000250030003500
High-de
mand H
H (23)
Mpeke
toni S
ec S
ch
Grain m
ills (3
)
Retail s
hops
Low-de
mabd H
H (60)
garag
es & w
elding
shop
s
Medium
deman
d HH (2
2)
Cotton
ginn
ery
Hospit
al
customer type
kWh/
mon
th
Figure 5: Electricity enduses by customer type
The distribution of load in Figure 5 has serious implications on both
administration and unit costs of service delivery because each customer, irrespective of
load, is connected to a meter. This being a community owned and run project, it is much
more convenient and cost effective to encourage and/or enforce end-use efficiency 20 Data extracted from: Scottish Power, “Prefessibility Study: Mpeketoni wind project Kenya, 4th April, 2005

25
measures in a few heavy consumers such as Mpeketoni Secondary, grain mills or TSS
cotton ginnery than dealing with hundreds of low-load households scattered in town.
Multiple peak loads are experienced throughout the day but the critical peak occurs
between 5pm-9pm (Figure 6). This can mainly be explained by the typical trend of
customers, particularly the school, turning on their lights and other devices in the
evenings.
0
10
20
30
40
50
60
kW
1 3 5 7 9 11 13 15 17 19 21 23
Time
Large Industry
Institutional
Medium Industryand Business
Small and Micro-Enterprise
Household
Figure 6: MEP daily load profile Source: Scottish Power (2005).
Also, grain mills reported brisk business after 5pm because parents tend to send
their children to the mills after school’s hours. MEP has for instance attempted to work
out a negotiated operating schedule as a pragmatic way of re-distributing the peak loads,
hence improving quality of service to as many customers as possible, especially in the
evenings. One possibility is to discontinue milling past 6pm and advice customers to
deliver their grains much earlier in the day. The mill operators have accepted the idea but
implementation has not been without hitches. As expected, it will take a while before all
their customers make this “cultural” change of not expecting milling services in the
evenings.
In spite of high tariffs, MEP boasts over 90% timely repayment rate. However,
the inability to make new connections and meet the high and growing demand for power
results in substantial opportunity cost in lost revenues; a crisis that threatens MEP’s

26
sustainability. Hence the motivation to appeal for assistance from the Government, via
the Ministry of Energy, to enable MEP to expand the system, supply new customers
while improving the quality and reliability of power supply. Having discussed the
historical and current status of MEP, I now turn to my key question of this study: how
important is modern energy for stimulating growth of micro-enterprises and rural
development?
CHAPTER 5: RESULTS AND DISCUSSION
5.1 Impact of electricity on micro-enterprises
An attempt was made to investigate both the qualitative and quantitative impact of
electricity on the production of various micro-enterprises at Mpeketoni. Observations
were made and questions were asked to elicit data on production of both carpentry and
tailoring businesses during the “with” and “without” electricity scenarios. Using this
criterion, twelve carpentry artisans and five tailors were selected to provide a
comparative assessment of the impact of electricity on the productivity of micro-
enterprises. Three production efficiency indicators, namely increased productivity per
worker, price reduction per unit and increase in gross revenue per day were used to
estimated the impact of electricity on micro-enterprises (Tables 2 and 3).
I found that introduction of modern technology in form of machinery and tools
provided the most dramatic and significant beneficial impact of electricity on micro-
enterprises studied at Mpeketoni. The productivity per worker increased, both in the
quantity and quality of products made, leading to increase in volume of sales, hence
higher gross revenues per day. Taking a typical carpentry workshop (Table 2),
productivity per artisan increased by a simple average of 243% while increase in gross
revenues ranged from 30% to 480% with an average of 213% per day.

27
Table 2: Effect of electricity on productivity in carpentry workshops at Mpeketoni Production with
electricity (n=12) Production without
electricity (n=12)
Efficiency indicators
Typical carpentry product
Average production
time per unit per artisan
Average unit price (Ksh)
Average production
time per unit per artisan
Average21 unit price
(Ksh)
Increase in productivit
y per artisan
Price reduction per unit
Increase in gross
revenue per day
Stool 2 hrs 300 6 hrs 400 300% 25% 167% Bed (6x4
feet) 1 day 4000 2 days 4500 200% 11% 311%
Sofa set 2 days 7000 5 days 9000 250% 22% 151% Door
(6x3 feet) 1 day 2000 2.5 days 3500 250% 43% 137%
Window (3 x 3 feet)
0.5 day 2000 1 day 2500 200% 20% 480%
Coffee table 1 day 1500 3 days 2500 300% 40% 213% Wardrobe 6 days 13000 12 days 18000 200% 28% 30% Wall-unit 12 days 20000 N/A N/A N/A N/A N/A
Average % change
243% 27% 213%
Exchange rate: US$1 = Ksh75 (August 2005) N/A = carpenters indicated that it was “not possible” to make wall-units without electricity because electric machines are necessary to form the “complex” designs demanded by upmarket customers.
Table 3: Effect of electricity on productivity in tailoring shops at Mpeketoni Production with
electricity (n=5)
Production without electricity (n=5)
Efficiency indicators
Typical tailoring product
Average production per tailor per day
Average unit price (Ksh)
Average production
per tailor/day
Average price per
unit (Ksh)
Increased productivity
per tailor
Price reduction per unit
Increase in gross
revenue per day
Men pair of
trousers
8 pieces 500 3 pieces 600 270% 17% 367%
Men suit 1.5 piece 1700 1 piece 2000 150% 15% 28% Women
dress 6 pieces 200 4 pieces 250 150% 20% 80%
School uniform
10 pieces 150 4 pieces 200 250% 25% 350%
Average % change
205% 19% 206%
21 This reflects the current price of a product made without electricity. It turns out that micro-enterprises still make and sell products without electricity owing to frequent and often pro-longed blackouts. This permits direct comparison of data for the 3 selected indicators (see methods section 2.1)

28
Of note also was the average 27% reduction in prices per unit despite the reported
superior quality of products made using electricity vis-à-vis those made without. It turns
out that workers are paid on piece wage and because electricity enabled them to make
more products per day than they could previously, it was more profitable to lower prices,
leading to higher and faster sales.
Another added advantage was the ability to make more sophisticated and custom-
made products targeting the upmarket clientele such as salaried employees like teachers,
bankers, and other civil servants working in the area. A wall-unit, a custom-made and
high-cost (US$250 per unit) piece of furniture used to store a wide variety of household
items such as cutlery, utensils, TV and video, etc., is a good example of upmarket
products that could not be made without electricity (Table 2). Thus lack of power
deprives micro-enterprises of additional income by limiting the quantity, quality and
variety of products that artisans can make. Moreover, making of superior quality products
at competitive prices has enabled the micro-enterprises to access more lucrative external
markets in Lamu town and Mombasa City.
A similar pattern is observed for the tailoring shops (Table 3) where average
increase in productivity per worker was in the same order of magnitude (205%), prices
dropped by about 19% while increases in gross revenues ranged from 28% to 367%, with
an average of 206% per day. The impact of access to power can further be appreciated
when one considers the time and effort required to iron a piece of clothing. It takes 30
minutes to iron a typical men’s coat using an electric iron-box but 1.5 hours to do the
same job with a charcoal iron-box, exclusive of the extra time and effort taken to prepare
and light the latter. Put differently, the 1.5 hours taken to do a coat with a charcoal iron-
box is enough to make one pair of men’s trousers using an electric machine. In other
words, for every 3 coats ironed using charcoal, the tailor forgoes 2 pairs of trousers he
would have made with power. At a unit price of Ksh500 (US$6.7) per pair of trousers,
this, translates to an opportunity cost of Ksh1,000 (US$13). Other advantages include
more convenience and superior quality associated with an electric iron-box vis-à-vis a
charcoal one.

29
5.2 Impact of electricity on agriculture and agro-processing activities
Interviews with over fifteen farmers helped to probe and document their distinct
experiences “before” and “after” electricity was installed. Their views were corroborated
and tri-angulated by additional interviews with a set of three key informants who played
central, albeit different, roles in setting up and coordinating the Settlement Scheme: (i)
the first District Agricultural Officer (DAO); (ii) the first Government Administrative
Chief and his Assistant; (iii) a cross-section of professional employees22 attached to
GTZ/GASP. At the start of the Settlement scheme in 1972, each family was allocated 20
acres of land and, without the advantage of tractors, the early settlers relied exclusively
on human labor using the traditional hand tools of axe, hoe and panga (machete). There is
unanimous recollection that reliance on manual labor to clear and convert a 20-acre
bushland (Figure 7) into a farm was an uphill, if not impossible, task. Recalls the DAO:
“Farmers complained the land was overwhelming and we reduced it to 10 acres per family. We encouraged them to work co-operatively and first clear only a small portion to cater for their subsistence. Nearly 50% of the early settlers abandoned their farms and returned to where they had come from. One farmer from Kisumu sold his 10-acre farm for Ksh100 – barely enough for fare back home23!”
The first two tractors appeared in 1988 and, despite a low cost of diesel at Ksh80
(US$1.10) per liter, they were rented out to farmers at high cost of Ksh2,300-4,000
(US$31-53) per acre (in constant 2005Ksh). Moreover, due to the limited number of
tractors, farmers had to wait for weeks or months before their land could be cultivated.
Such inordinate delays made it extremely difficult for farmers to plan, plant and harvest
on time resulting in huge losses taking into account that farming at Mpeketoni is 100%
rain-fed. “I was compelled to buy my own tractor when by the time I found a tractor for
hire, the season was over and rains stopped. I lost that season completely,” recalls one
farmer who is also a founding member of MEP.
22 Include teachers, surveyors, planners, etc. All the interviewees, though originally from different parts of Kenya, have purchased land and settled at Mpeketoni for periods ranging from 12 to 30 yrs. 23 Quotations are paraphrased translations from unrecorded interviews conducted in Swahili or Kikuyu. A ten-acre farm at that time (early 1970s) was valued at approximately Ksh5000 (Okoth, Lands Officer, Mpeketoni, personal comm.). This claim obviously discounts other dynamics that might have led to this drastic action, but taking into account the regularity with which similar frustrations were (independently) expressed, I found it useful and credible in highlighting the farmers experiences. (Nb: In constant 2005 Ksh, Ksh100 (1974) = Ksh4,000 and Ksh500 (1974) = Ksh21,000.

30
Within a few months after MEP was commissioned in 1994, there were over ten
tractors at Mpeketoni. But what has electricity got do with diesel-powered tractors? It
turns out that electricity made it possible to start garages for repair and maintenance of
tractors while previously simple repair and welding jobs could only be done in Mombasa,
450 km away. Therefore, the availability of garages with electricity for maintenance was
an important complimentary infrastructure that has dramatically boosted agricultural
production in this area.
Figure7: Typical farm today with harvested simsim and mango trees (inset – bush that early settlers had to clear before they could start farming).(Photo: courtesy of ESDA).
More importantly to the farmers, the tractors are available on demand without the
previous constraints of advance booking and/or queuing for service. The multiplier
effects of improved farm production combined with local agro-processing has
transformed the fortunes of local farmers, catalyzed trading, and boosted the generation
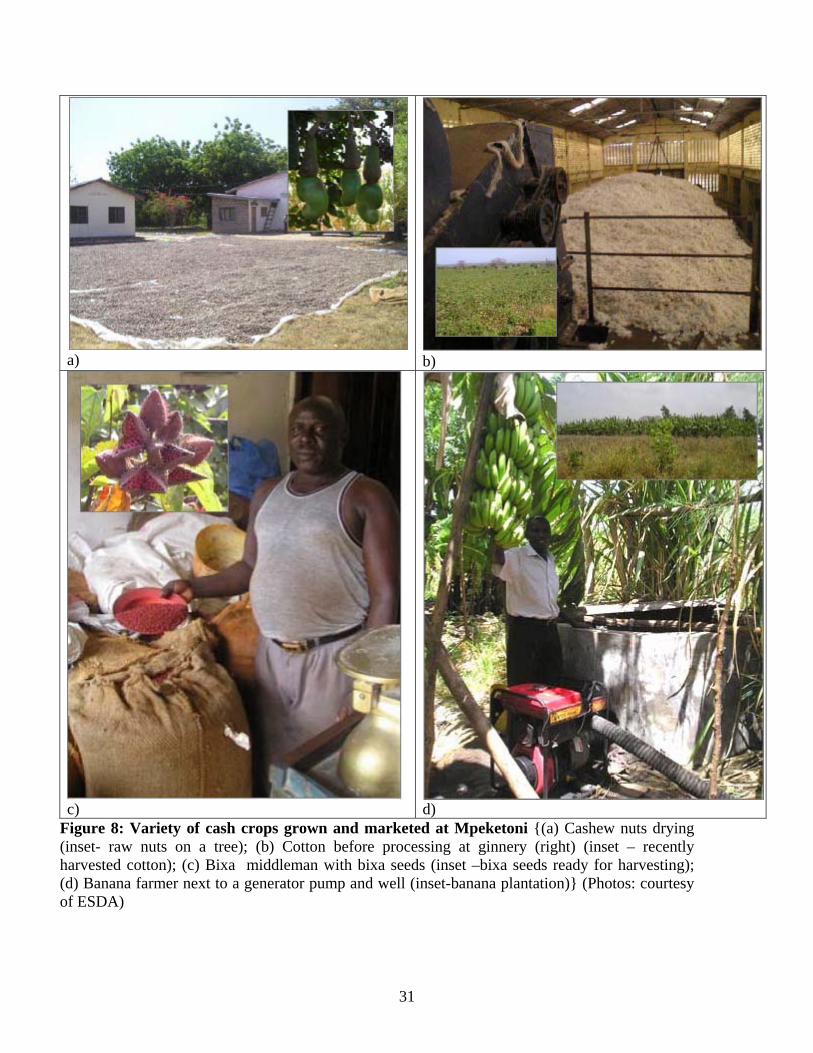
of non-farm income in this small remote town. Major cash crops grown include cashew
nuts, cotton, maize, bananas, bixa and simsim (Figure 8).
31
a) b)
c) d)
Figure 8: Variety of cash crops grown and marketed at Mpeketoni {(a) Cashew nuts drying (inset- raw nuts on a tree); (b) Cotton before processing at ginnery (right) (inset – recently harvested cotton); (c) Bixa middleman with bixa seeds (inset –bixa seeds ready for harvesting); (d) Banana farmer next to a generator pump and well (inset-banana plantation)} (Photos: courtesy of ESDA)

32
Access to electricity has boosted agriculture in other ways, too. The ability to
process the maize in the local mills gives them competitive advantage when selling to the
external markets at prices far better than they would previously fetch without milling. For
example, for every 10kg of maize, one gets 2kg of chaff as a by-product of milling. The
chaff, a valuable animal feed particularly for cows and poultry, retails at Ksh10/kg
(US$0.13/kg). This is an extra stream of revenue available to farmers which would not
have been possible without mechanical milling, whether provided by electricity or diesel-
powered gensets24.
Storage of perishable farm produce was a constant headache for local farmers and
traders. Without electricity, perishable produce such as milk and meat were the least
valuable products and farmers could only hope to get throw-away prices or literally throw
them away when spoilt due to lack of cold storage.With electricity and availability of
cold storage, the farm-gate price dramatically increased by 400% from Ksh10 to Ksh40
per liter within a couple of years. Also, the market for meat increased with numerous
butcheries opening up, mainly due to availability of refrigeration. It is not surprising that
animal production for both milk and meat are key sources of income for local farmers.
The findings at Mpeketoni demonstrate the powerful synergy between access to both
electricity and markets in stimulating agricultural-related SMEs.
5.3 Impact of electricity on education services
Availability of quality education is a crucial factor in determining not only the
economic well-being of a country but also the general welfare of a society. This is even
more critical in a remote rural village like Mpeketoni whose children have to compete for
placement in universities, colleges and jobs with their counterparts in the urban and more
resource-endowed areas of Kenya. Conscious of this fact, parents demanded that from the
outset, Mpeketoni Secondary School be given the first priority to electricity in 1994.
Figure 9 shows the trend in academic performance in Kenya Certificate of Secondary
Education (KCSE) national exams for 15 years from 1989 to 2004. Aware that improved
performance in a typical school is influenced by many factors, besides connection to
24 A related observation by Pandey (2004) in Nepal claims that, for crops like mustard seed, mechanical milling increases yields by >30% of the of much valued cooking oil over the traditional wooden kol.

33
electricity, I asked the Deputy Principal to account for the positive correlation between
access to power and improved performance as can be inferred from Figure 925. The
Deputy Principal, who has been at the school since 1991, recounts:
“Before we got power, water was an even bigger problem. We had no piped water and students would spend 2-3 hours daily in the evenings hauling water with ropes and buckets from deep boreholes while others walked far way in search of water. Hygiene was very poor and students, particularly girls, were reluctant to take part in sports because showering was a nightmare.”
0.001.002.003.004.005.006.007.00
1989
1991
1993
1995
1997
1999
2001
2003
Year
KC
SE m
ean
scor
e (m
ax 1
2 po
ints
)
Figure 9: Trend in academic performance at Mpeketoni Secondary School (Source: Mpeketoni Secondary school, 2005).
He adds that toilets would never be cleaned due to lack of water while water borne
diseases especially skin infections, typhoid and cholera were particularly common due to
poor hygiene, resulting in rampant absenteeism from school by both students and
teachers. What difference did power make? He continues:
“Obviously our first priority when we got power was water pumping and lighting. The 2-3 hours previously dedicated to gathering water are now dedicated to evening study, with better lighting and huge cost savings in
25 Other factors might be hiring of more and better trained teachers, improved access to library resources, improved students’ discipline, etc. Indeed, the Deputy Principal acknowledged that access to power both at the school and in the village had partly contributed to higher retention rate of more trained teachers since they could enjoy better social amenities such as lighting, TV, ironing, etc., like their peers in other urban areas.
Power installed in ‘94

34
kerosene bills when we switched from hurricane lamps to electricity26. Previously common water borne diseases have been eradicated.”
According to the Deputy Principal, notable academic improvements have been in
science subjects because of electrified laboratories. More importantly, Mpeketoni is
one of the very few schools in Kenya offering computer courses to students. Having
their own computers and photocopying machines has dramatically improved the
efficiency of processing information, particularly exams, at the school. This would
not have been possible without electricity27.
Another way of assessing improved academic performance at the School is to
track the number of students it sends to universities. Within the Kenyan education
system, the number of students a typical secondary school is able to send to the highly
competitive public universities is a highly valued metric of academic performance. For
Mpeketoni Secondary, the number of students admitted to public universities doubled
from 2 per year between 1991 to 1993 to an average of 4 per year between 1994 to 2005,
in addition to other admissions in diploma colleges28. School enrolment has also gone up
by 60% from 300 to 480 students in addition to much higher retention and completion
rates particularly for girls. One can therefore make a (prima facie) plausible connection
between access to electricity and improved academic performance at the School. Further
research is, however, needed to provide a more nuanced understanding of all the different
dynamics influencing the noted improved performance.
Further evidence of the direct impact of electricity can be observed at Mpeketoni
Polytechnic. Without electricity, the Polytechnic could only offer very limited technical
trades in carpentry but now they offer a wide variety of courses including engineering
and metal works. The polytechnic is a critical source of practical know-how and skills for
26 Pandey (1997) has also noted that switching from kerosene to electric lighting (partly) contributed to improved academic performance in the rural-micro-hydro-powered-villages of Nepal. 27 The school has purchased some computers whiles others have been donated by various organizations. It is common to find donors and NGOs donating computers to schools in Kenya. For instance, an NGO known as Computer Schools for Kenya, based at Starehe Boys Center, Nairobi is at the forefront of this initiative. But for a school to be eligible for this computer project, it must have access to power. 28 Lack of data prior to 1991 did not permit a longer-time comparison for the “without-electricity” scenario. Moreover, the education system changed from 7-4-2-3 to 8-4-4 in 1989 (reflecting the number of years spent at primary, secondary, high-school and university, respectively. In the previous system, after secondary school, students joined high-school while in the current system, they join university), thus further limiting direct historical comparisons of academic performance between the “with” and “with-out” electricity scenarios.

35
hundreds of youth who find employment in local SMEs. Results of this survey show that
over 70% of the youth employed and/or self-employed at the Mpeketoni Juakali (open-air
informal) sheds reportedly acquired their training at the Polytechnic.
Another relevant observation made was that failure to connect electricity to local
primary schools has had its drawbacks too as explained by the Assistant Education
Officer (AEO) and other teachers. Lack of electricity has made it impossible for the
schools to use mass media for supplementary teaching purposes. Despite glaring
inequalities in access to learning resources (Daily Nation, Jan, 2006), schools in Kenya
take standardized national exams. The examination system, as currently designed, is
therefore, heavily biased against children from rural and remote areas such as Mpeketoni
as noted by teachers and AEO:
“In national examinations, students get tested about what is assumed to be ‘common knowledge’ by examiners living in cities like Nairobi. For instance, last year (2004) there was a question on the colors and the workings of traffic lights. How can this be common knowledge in places like Lamu without roads, let alone vehicles? We find TV as the only medium for exposing our students to such ideas.”
To address this issue, Ngoi Primary, a remote school with 153 pupils in Mpeketoni, has
committed a Ksh100,000 ($1300) grant from the Constituency Development Fund
(CDF)29 for the installation of solar electricity to enable it enrich learning by using mass
media as teaching aids with effect from 200530. In addition, severe shortage of teachers in
rural and remote locations like Lamu is a perennial problem. The AEO is optimistic that
availability of power would enable teachers to provide extra teaching in early mornings
(6-7am) and late evenings (6-9pm) to make up for material not adequately covered during
normal teaching hours due to lack of teachers.
29 CDF is a grant from the Kenya Government allocated annually to every constituency represented in Parliament to meet local demand-driven development projects. It started in 2003 and was created by an Act of Parliament. 30 The views of Lamu AEO, combined by the high investment in PV at Ngoi Primary, contradicts Nakhooda (2003) who claimed that “electricity makes little impact” on primary education in Kenya and Uganda (p.87). This is probably because the author restricted her investigation to lighting needs only, thus missing the use of electricity for powering electronic teaching aids.

36
5.4 Impact of electricity on banking and communication services
The growth and vibrancy of the local trade and commerce at Mpeketoni is
reflected by the presence of a Kenya Commercial Bank branch, Postal Office and an up-
coming Teachers savings and credit organization. These commercial facilities are not
only connected to electricity, but were found to use electronic equipment such as
computers, printers, photocopiers, etc. This further demonstrates the vital role that MEP
is playing in creating an enabling environment for better business service delivery,
particularly in a rural setting. Internet services are easily available at the local postal
office at a competitive price of Ksh1(US$0.013)/minute, which is comparable to big
cities like Nairobi and Mombasa (Kirubi, personal observation, July 2005). It is
remarkable that MEP officials are able to shop for and purchase spare parts for the
generators on-line from Europe and South Africa. This indicates the difference
availability of power can make in communication and transaction costs as well as
enabling remote villages enjoy and access opportunities that were unthinkable a few
years back.
The Celtel mobile company has installed a base station locally using their own
diesel generator, while MEP has turned down an application for power from Safaricom
Ltd (a competing mobile phone company that is keen to enter the market) due to power
generation capacity constraints. This is one of the many applications for power from
corporate and major private investors that MEP is turning down daily due to limited
power supply. It is apparent that MEP and Mpeketoni town have come of age – they are
getting noticed and attracting investors. However, with lack of resources to expand and
grow, MEP is becoming a classic victim of its own success. These capacity constraints
are severely inhibiting the phenomenal potential for wealth and income generation for the
local community.
5.5 Impact of electricity on women
Women deserve special mention not only because they constitute the bigger
population at Mpeketoni but also because they bear a disproportionate burden of
household chores, particularly in Africa. Thus, other factors being equal, an intervention
that contributes to a reduction in women’s physical burden and frees time for more

37
productive tasks is welcome. For example, without electricity, it took half a day to grind
10 Kg of maize using hand and big sticks, enough to feed a typical family of 5 for 4 days
in this village where ground maize (muthokoi) is a significant part of the staple diet.
Besides the poor quality of hand-ground maize, this is a women-only job according to
culture and 6 hours spent on this chore represents an opportunity cost of Ksh150 (US$2)-
the alternative income a woman could earn if she sold her labor elsewhere. Moreover,
hand-grinding, unlike mechanical milling, does not yield the valuable animal feed. The
lack of electricity had other drawbacks too as recounted by one woman who has lived
here since the early 70s and is now a committee member of MEP:
“Before electricity, we looked bad and poorly groomed because there were no hair salons. The nearest was in Mombasa 450 km away. Delivery was the biggest risk for women since maternity services at the local clinic could only be offered using kerosene lamps and dry-cell flash lights.”31. With electricity, over 20 hair salons emerged each employing about 5 girls –
creating approximately 100 jobs for women. Tailoring and dress-making shops are other
sources of non-farm income for women. With electricity, both their quantity and quality
have dramatically improved, enabling them to sell not only locally but also in Lamu and
Mombasa where they fetch bigger and more lucrative tourist markets.
Cecelski (2000) has noted that cooking is women’s most important energy need in
terms of time and effort. However, electricity at Mpeketoni is too costly to be used for
cooking not only by households but also by hotels. Nonetheless, women still valued
electricity in their households for other purposes: “even if power is too costly to cook
with at home, we are able to watch TV, charge our mobile phones and stay connected!”
In addition, several self-help women groups have put up rental houses in town which are
connected to electricity where they generate more rents than would be possible without
electricity.
31 Quotations are paraphrased translations from unrecorded interviews conducted in Swahili or Kikuyu. A nurse I interviewed at the village corroborates this observation on the high risk and inconvenience of maternity services without electricity. It was further established that the local health center, like the secondary school, enjoys first priority to power unless there is total breakdown at MEP.

38
5.6 The interactive effect between access to electricity, markets and other infrastructure vis-à-vis microenterprise development at Mpeketoni
I have so far explored what difference access to electricity made by way of
stimulating agriculture and SMEs at Mpeketoni, holding other factors equal. The
assumption in the foregoing analysis is that electricity was “sufficient” in and of itself in
making the noted difference. According to the literature, however, electricity cannot take
all the credit; its access is a necessary but not sufficient condition for supporting SMEs.
To explore this claim, I turn to the second hypothesis: “an interactive effect exist between
access to electricity, markets and other infrastructure which is essential for
microenterprise development.” In testing this hypothesis at Mpeketoni, I will use three
metrics for which data is available: (i) markets for agricultural produce; (ii) roads; and
(iii) facilities for social amenities (schools, polytechnic, and communication services).
My study finds that a powerful synergy and interactive effect exist between access
to electricity, markets and roads to facilitate the desired growth of SMEs in rural areas of
Kenya. Another key component appears to be a strong local economy. That is, access to
agricultural markets means that local artisans can sell their goods to local farmers who
have money to buy. In practical terms, access to electrification is only one piece of the
complex puzzle of achieving rural development. This conclusion is consistent with other
findings reviewed in the literature (see Wamukonya and Davis, 2001; Barnes, 1988).
Starting with agriculture, cotton is considered the highest income earner for
Mpeketoni. But due to low prices, many farmers interviewed indicated they had stopped
and/or reduced planting cotton in favor of other crops such as cashew nuts, maize, bixa,
bananas, mangoes, oranges, water melon, etc (see Figure 8). The feasibility report by
Scottish Power (2005) indicated a dramatic 300% drop (i.e., from 3000 to 1000 tons/year)
in cotton production between 1998 and 2004. The same report adds that cashew nuts are
the second highest income earner, with Mpeketoni the lead producer in Coast Province at
approximately 2000 tons/year. The estimated potential for cashew nut production at
Mpeketoni is 7000 tons/year, with a market value of Ksh350 million (US$4.5million).
What’s more, about four to six cashew nut companies (some all the way from India) send
representatives to Mpeketoni for up to eight months to purchase nuts from farmers.
Maize, bananas and vegetables find ready market in the Lamu Island (65 km away) and

39
Mombasa City (450km away). A conservative figure of income from agriculture alone is
Ksh220 million (US$2.8 million) per year.
Another major advantage with Mpeketoni is the combination of favorable weather
and availability of big farm sizes (10-15 acres/farm) which enables farmers to grow a
wide variety of cash crops. For instance, interviews with 56 farmers conducted by the
ESDA team revealed 70% of them grew more than one crop (Table 4). Such
diversification not only boosts farmers’ income but more importantly acts as a vital hedge
against multiple risks and vulnerabilities that they face – ranging from vagaries of
weather to price fluctuations as previously noted with cotton.
Table 4: Variety of crops grown and income earned by farmers at Mpeketoni
Crop % of farmers growing the crop32
(n =56)
Average income/acre /year
(Ksh)
Average income/acre /year
(US$) Bixa 2% -
Cotton 45% 5,602 73 Maize 91% 6,469 84
Mangoes 7% 6,000 78 Cashew nuts 14% 11,285 147
Simsim 14% 4,285 56 Source: Data from Scottish Power (2005) Annexes.
The road infrastructure is one of the major “footprint” of the GTZ/GASP project
at Mpeketoni. To improve accessibility and mobility, GTZ/GASP cleared the bushland
(see Figure 7) by constructing three categories of roads between 1999 and 2004 (Apindi
and Onyango, 2004). These three categories include cutlines, field roads, and gravel
roads. Cutlines are 2 m wide paths cleared by bulldozer in the thick bush to facilitate the
demarcation of the settlement scheme and the movement of settlers into their plots. They
also serve as fire breaks, thus protecting the farms from fire hazards from the adjacent
pockets of natural forests. Field roads are 10 m wide roads that are bush cleared, shaped
and compacted. They have road reserves of 20 m for the development of other services
like water, telephone and electricity. Gravel roads are field roads that have been graveled
with 15cm thick compacted gravel. Table 5 is an overview of categories of roads 32 The sum total for this column >100 because 70% of farmers reported growing more than one crop.

40
constructed by GTZ/GASP in both Mpeketoni (as known as Lake Kenyatta 1) and
another settlement scheme (Witu 1), also in Lamu District.
Table 5: Roads constructed in settlement schemes by GTZ/GASP
Settlement scheme Cuttline (Km)
Field road (Km)
Gravel road (Km)
Total road network
(Km) Mpeketoni
(Lake Kenyatta 1) 9 200 66.4 275.4
Witu 1 146 132 11 289 Source: Apindi and Onyango, 2004
It is useful to point out that both Mpeketoni and Witu 1 roughly share some
important characteristics33. First, both are settlement schemes, with comparable road
networks supported by the same organization between 1999 and 200434. Second, both
schemes have access to electricity – although Witu 1 has an added advantage of being
connected to cheaper and more reliable electricity from the national grid. Another
advantage for Witu 1 over Mpeketoni is that the township is situated along the busy
Lamu –Mombasa highway and it is much closer to two big markets at Mombasa and
Malindi towns.
On the bases of the above advantages, one would therefore expect Witu 1 to have
a comparable, if not more robust, internal economy like Mpeketoni; characterized by a
multiplicity of SMEs that provide products and services to local residents. But that is not
the case. The key limiting factor, according to both Nyange and Onyango and other
informants, is the low level of agricultural productivity and diversity which have severely
stifled market dynamics. It turns out that despite better location on a busy highway and
access to cheaper and more reliable electricity, Witu1 cannot support similar levels of
agricultural and SMEs productivity and diversity like Mpeketoni does because it is much
33 I did not visit Witu 1, and my discussion here is based on interviews with Mr. Nyange (first District Agricultural Officer in charge of starting the settlement schemes) and Mr. Patrick Onyango who heads a Capacity Building Project to support local groups and entrepreneurs in both schemes. 34 However, there is notable difference in distribution of road categories. The report is silent on the criteria used to determine the distribution and what implications this might have for agricultural productivity. More research is needed to clarify this.

41
more arid35. The fact that a more accessible location and access to cheaper and more
reliable electricity cannot compensate the absence of vibrant agricultural-based markets
at Witu 1 is very instructive.
This finding makes a strong case that a powerful synergy and interactive effect
exist between access to electricity, markets and roads to facilitate the desired growth of
SMEs in rural areas of Kenya. The vibrancy of the local economy is another important
driving factor. That is, access to agricultural markets means that local artisans can sell
their goods to local farmers who have money to buy. Other factors equal, the absence of
(agricultural) markets at Witu 1 seem to render the presence of both better road
accessibility and cheaper electricity “less effective” in promoting the start-up and growth
of SMEs.
The Mpeketoni case study further demonstrates that facilities for social amenities
(e.g., schools, polytechnic, hospital), have a win-win interactive effect with access to
electricity in a variety of ways. First and foremost, Mpeketoni Secondary School provides
both the largest market for power as well as essential anchor loads. Second, without
electricity, the Polytechnic could only offer very limited technical trades in carpentry but
now they offer a wide variety of courses including engineering and metal works. This has
simultaneously increased both the demand for power and enrolment for vocational
training36. It is therefore fair to conclude that the Polytechnic has provided the seedbed
for imparting vocational skills into the local youth, and access to electricity has added
enormous value to the training process. The skills were reportedly essential for doing
well in the SMEs sector, in addition to helping create employment for the local
population.
Expenditure on information communication services (e.g., telephone) can be an
effective proxy for estimating the size and vibrancy of a local market. To estimate this for
Mpeketoni, sales of cell phone air time spanning 10 months were collected from three out
of many airtime shops in town. Results show that the size of local cell phone market
35 A further supportive piece of anecdotal evidence is that, while driving on the Mombasa-Lamu highway, one can easily notice that the number of retail shops and hotels at Witu 1 township are hardly 10 compared to over 50 in Mpeketoni. 36 In view of the current capacity constraints, increase in power demand may be viewed negatively. However, this is only a temporary setback, which is being effectively addressed by the on-going e7 funded expansion initiative.

42
(approximately Ksh1.5 million or US$20,000) per year) is an important source of revenue
for local SMEs. Granted traders flocking in and out of Mpeketoni reportedly purchase a
significant proportion of airtime, these transactions act as vital means of income transfer
from outside sources into the village. It also worth noting that the estimated air time
market value accounts for only less than 1% of the annual agricultural income (Ksh220
million or US$2.8 million) at Mpeketoni (Scottish Power, 2005). Currently, this market is
the “monopoly” of one cell phone company (Celtel Kenya Ltd), thanks to power
constraints at MEP which have locked out the competing company – Safaricom Ltd.
Probing further, the retailers indicated that the noted high cell phone traffic is correlated
with harvesting and marketing seasons which vary from month to month due to the wide
variety of crops grown and sold (see Table 4). Also of note is lack of other essential
commercial services – including banking - at Witu1 vis-à-vis Mpeketoni which has three
banks (see Section 5.4).
Road traffic is another insightful proxy of the robustness of a rural market. While
most rural markets in small towns in Kenya operate on designated days (often once a
week), Mpeketoni markets operate seven days of the week37! The town is the destination
of 2-3 sixty-seater passenger buses per day – one from Lamu Island and two from
Mombasa City, exclusive of other smaller-car vehicular traffic.
Taken together, the foregoing empirical evidence substantiates the hypothesis that
an “interactive effect” exists between access to electricity, roads and other infrastructure
services vis-à-vis SMEs growth and development. This study makes it clear that in order
for rural enterprise to take root and thrive, an assortment of infrastructures, services and
markets must be available, at least locally and further afield. This finding has important
policy implication for rural electrification, i.e., the policy should aim at providing a “suite
of well-integrated enabling factors,” not merely electricity, in order to spur the start-up
and growth of SMEs in particular and poverty reduction in general. But what does this
finding mean from a practical perspective? Does it suggest that electricity planners
should focus on delivering services first to areas where complimentary infrastructures
37 Based upon my personal life experience in rural Kenya and corroborated by Prof David Leonard of Political Science Department, UC Berkeley (personal comm).

43
already exist? How about equity issues implicit in such a policy? These are complex and
broader questions beyond the scope of this study.
However, as policy reforms take root and funding for REP increases, both the
Task Force on Rural Energy and Sessional Paper No. 4 (2004) on Energy have strongly
recommended that access to modern energy should go beyond households to include
more of agricultural and off-farm economic activities. As pointed out earlier, Walubengo
and Onyango (1992) were the early proponents of deliberately skewing rural
electrification in favor of industries, commercial and public services. I would add that the
envisaged integrated approach does not have to aim at simultaneous provision of
electricity and other complementary infrastructure. The package of infrastructure could
be provided in a phased and coordinated rather than in an arbitrary manner as has been
the practice with many rural electrification projects38.
Moreover, the challenges of rural electrification are not unique to Kenya. For
instance, to add economic value to an extensive rural electrification program underway in
South Africa, ESKOM (South African electricity utility company) has established an
SME promotion initiative as part and parcel of its rural electrification (Borchers and
Hofmeyr, 1997 cited in McAllister, 2002). In a review of the relationship between
electrification and productive enterprise in rural South Africa, McAllister (2002) reaches
a crucial conclusion that resonates very well with my findings at Mpeketoni: “when
provided together with basic social services such as health and education and physical
infrastructure such as communication and transport, electrification is more likely to have
a substantial positive effect on rural economic development.” In other words, access to
electrification - important as it is - addresses only one piece of the complex puzzle of the
socio-economic limitations facing rural Africa. There is great need for additional studies
that seek to identify the broader set of processes and factors – including access to credit,
38 Political interference is largely to blame for the arbitrary manner in which the rural electrification has been implemented in Kenya. Hence the recommendation for an autonomous rural electrification agency that would develop a criteria for electrification (MoE, 2003; Walubengo & Onyango 1992). In my view, publicizing both the criteria and a schedule of areas to benefit annually would raise awareness and provide critical public oversight and accountability as target communities, local elite and politicians have incentives and information to ensure their villages are not short-changed and/or “by-passed”. Public information disclosure has been effectively applied in other sectors to enhance accountability and oversight. For example, wide publicizing in the print and electronic media of funds allocated to each school under the free primary education and that allocated to each constituency under the CDF has enhanced accountability across the country.

44
community dynamics39, rural elites, financing, government policies, security, donor
support, etc – that come together to shape and determine the productive uses of rural
electrification.
As earlier pointed out, the Task Force on Rural Energy has recommended
adoption of distributed generation (DG) using a wide range of renewable energy
technologies in an effort to address the prohibitive cost of grid extension to rural areas.
Implementation of such a recommendation calls for the enactment of requisite and
supportive regulatory policy framework. The next section examines the policy lessons
that can be drawn from MEP to inform the regulation and licensing of DG in Kenya.
5.7 Regulatory policy implications of MEP’s experience
Distributed generation (DG) is yet to be tried on a large scale in rural
electrification projects, much less on a community-based approach in Kenya. For
instance MEP is the only diesel community-based mini-grid in Kenya while three others
are much smaller (about 5kW) and hydro-based (Balla, 2003). The latter are relatively
new (started in 2001/2) and still under development, hence everyone – communities and
policy makers alike – is literally on a very steep “learning curve” as far as DG is
concerned. It is evident there are many barriers—technical, financial, regulatory, and
institutional—that need to be addressed adequately. A clear and well-established
framework is required to design, implement, and mainstream such schemes. I wish to
restrict myself to licensing as one critical piece of the envisaged wider regulatory
framework.
I find the rich experience with DG in India and Nepal highly germane to Kenya in
four principal and innovative ways. First, the Indian Electricity Bill (2003) is highly pro-
DG and makes specific reference to ‘‘permitting stand alone systems including those
based on renewable sources of energy (and other non-conventional sources of energy) for
rural areas’’ (Clause 4, Electricity Bill 2003, cited in Chaurey et al, 2004). Second, the
Bill is explicit about the “central role” of local stakeholders (NGOs and village
institutions) in the management of local electricity distribution. Third and most
39 My informants repeatedly claimed that the presence of “enterprising” Kikuyus and Kambas in Mpeketoni compared to the “non-farming” coastal communities at Witu 1 could also partly explain the faster growth in the former than the latter.

45
important, it permits license-free generation and distribution in rural areas (emphasis
added). Similarly, Pandey (2004) reports that in Nepal, the Government delicensed
micro-hydro projects up to 100kW allowing rural people to generate their own electricity
and sell “over-the-fence” to their neighbors (emphasis added). This policy is partly
credited for rapid and successful deployment of micro-hydro systems that connect
between 110,000 to 170,000 rural people.
The fourth point is about the benefits of leveraging indigenous expertise and
experience in form of village electricity committees (VECs). For instance, Harper (2000,
cited in Chaurey et al, 2004) indicates that the VECs in the State of Orissa in India have
clearly shown that it is possible to improve the “operational and commercial viability” of
the DG scheme if community is made an important stakeholder. The VEC is a committee
of consumers from the village, supported by technical staff, acts as a “Consumer Care
Center” in the village and facilitates interaction, education, grievance redress, bill
distribution, metering, and cash collection. For all intents and purposes, the MEP
Executive Committee has been functioning like the Indian VECs, and so have the other
self-help groups managing the pico-hydro projects in Meru.
My key policy recommendation, therefore, is that small-scale power generation
and distribution projects below a pre-determined capacity (say, 1000 kW) should be
permitted to operate license-free. Citing bureaucratic red-tape with the current efforts for
scaling-up MEP, Jonathan Cohen of ESD has echoed the urgency for re-examining the
licensing procedure for mini-grids40. Karekezi, a leading energy policy analyst and a
member of the Task Force on Rural Energy strongly shares these views41. Karekezi
further points out that there exist hundreds of diesel generators in different parts of the
country used either as power back-ups (by schools, hospitals, NGOs, churches, etc) or for
saw milling and/or irrigation. They are often, under-utilized, particularly at night when
power is needed most by households and other enterprises. In the absence of the current
inhibitive (licensing) regulations (see section 3.4), Karekezi contends the owners of such
generators would find it economical to sell power “over the fence” to neighboring
40 Jonathan Cohen (email communication). Cohen is the team leader of the ESD team advising the Kenyan Government and e7 on how to scale-up MEP into a diesel/wind hybrid system. 41 Karekezi, Stephen (personal communication, July 2005)

46
households and enterprises as reported in Nepal, thus increasing access to rural
electrification.
In my view, despite the limited experience with DG in Kenya, the MEP project-
combined with the three micro-hydro schemes in Kirinyaga and Meru South Districts- are
beginning to “demystify” DG; and letting both the communities and policy makers “learn
by doing.” That is as it should be. This observation is collaborated by both UNEP (2002)
and Balla (2003) who have documented the vital lessons from the implementation
process of the micro-hydro schemes in Kirinyaga and Meru Districts. These lessons have
fundamentally shaped the new Sessional Paper No. 4 (2004) on Energy (see section 3.4).
In short, the Kenyan rural people, like in India, Nepal and elsewhere, are demonstrating
they have the potential and know-how to be energy service providers. Thus, in addition to
the commendable policy reforms articulated in the Sessional Paper No. 4, I would
strongly suggest taking a step further: permitting license-free operations for small-scale
mini-grids. Next section presents a summary of my key findings, policy recommendation
and ideas for further research.
CHAPTER 6: KEY FINDINGS AND RECOMMENDATIONS
6.6 Key findings
i) The findings at Mpeketoni reveal that access to electricity; in combination with
simultaneous access to markets and other infrastructure (roads, communication,
schools, etc), have contributed to robust growth of SMEs in clear and compelling
ways. For instance, productivity per worker and gross revenues per day in Mpeketoni
increased on order of over 200% for both carpentry and tailoring SMEs as the result
of access to electricity. Strong linkages to poverty reduction via job creation, income
generation and improvement in quality of education were also noted. The key lesson
is that rural electrification should be delivered in projects that are designed to provide
a “suite of well-integrated enabling factors,” not merely electricity alone, in order to
spur the start-up and growth of SMEs in particular and poverty reduction in general.
ii) Despite high tariffs [Ksh22.50 (US$0.30)/kWh or nearly 3 times the national grid
tariff], MEP has demonstrated that there exists substantial unmet rural demand for

47
electricity. With lack of resources to expand and grow, however, MEP is becoming a
classic victim of its own success. The power capacity constraints are severely
inhibiting the phenomenal potential for wealth and income generation for the local
community. Therefore, the ongoing joint efforts by Kenyan Government, the e7,
Scottish Power, Energy for Sustainable Development (UK) and Energy for
Sustainable Development are worthwhile and overdue.
6.2 Policy recommendation and ideas for further research i) The key policy recommendation is that small-scale power generation and distribution
projects below a pre-determined capacity (say, 1000 kW) should be permitted to
operate license-free in rural areas under a revised Electricity Power Act as is the case
in India and Nepal (see Section 5.8). Removal of licensing bureaucracy for such
small-scale mini-grids would make it possible for owners of diesel generators in rural
areas to sell power “over-the-fence” to households and enterprises, thus increasing
access to rural electrification. Further research is however needed to better understand
the pros and cons of private vis-à-vis community-owned and managed mini-grids.
ii) The circumstances under which private and/or community-owned and managed
electricity projects become successful require further study. How unique or
representative is the Mpeketoni case study? As energy policy analysts increasingly
advocate for more private and/or community-based distributed generation, we need
nuanced understanding of the multiple dynamics that would enhance and/or constrain
success of such projects. For instance, the “common property resource” theory has
been widely used to understand the governance and management of man-made or
natural commons such as irrigation canals, forests, fisheries, etc. How relevant is CPR
theory in understanding the governance of village-scale power projects in Kenya? In
addition, comparative analysis is highly recommended to illuminate under what
conditions such projects succeed or fail.
iii) There is great need for additional studies that seek to identify the broader set of
processes and factors – including community dynamics, rural elites, financing,

48
government policies, security, donor support, etc – that come together to shape and
determine the productive uses of rural electrification.

49
References
1. Allerdice, A. & Rogers, J.H., 2000, “Renewable energy for microenterprise.” National Renewable Energy Laboratory (NREL), Colorado, USA.
2. Apindi, E., & Onyango, P., 2004, “Physical infrastructures in the German Assisted
Settlement Programme (GASP),” Internal Paper #103, GTZ. 3. Balla, P., 2003, “Development of community electrification in Kenya: A case of
small-scale-hydro for rural energy.” Master’s Thesis, Lund University, Sweden. 4. Barnes, D.F,1988, “Electric power for rural growth: How electricity affects rural life
in developing countries.” Westview Press, Boulder. 5. Borchers, M., and Hofmeyr, I., 1997, “Rural electrification supply options to support
health, education and small, medium and microenterprise development.” University of Cape Town, ERC. In: McAllister, J.A., 2002, “Electrification and productive enterprise in rural South Africa.” Term paper submitted for ER280 class. ERG, UC Berkeley.
6. Cabraal, A., Barnes, D.F., & Agarwal, S., 2005, “Productive uses of energy for rural
development.” Ann Rev Environ Resources, 30, 117-144. 7. Cecelski, E., 2000, “Enabling equitable access to rural electrification: current thinking
and major activities in energy, poverty and gender” Briefing paper prepared for a brainstorming meeting on Asia Alternative Energy Policy Project Development Support: Emphasis on poverty alleviation and women, Asia Alternative Energy Unit, The World Bank, Washington, DC, 26-27 January 2000.
8. Central Bureau of Statistics (CBS), International Centre for Economic Growth
(ICEG) & K-REP Holdings Ltd, 1999, “National Micro and Small Enterprise Baseline Survey” Survey Results, Nairobi.
9. Chaurey, A., Ranganathan, M., and Mohanty, P., 2004, “Electricity access for
geographically disadvantaged rural communities—technology and policy insights.” Energy Policy, 32 (2004) 1693–1705.
10. Clancy, J., & Dutta, S., 2005, “Women and Productive Uses of Energy: Some light on
a shadowy area.” Paper presented at the UNDP Meeting on Productive Uses of
Renewable Energy, Bangkok, Thailand, 9-11 May 2005. 11. Daily Nation, 01/09/2006, “System entrenches class divisions.” 12. Daily Nation, December Friday 16th 2005. 13. Dube, I., 2001, “Energy services for the urban poor in Uganda. Short-term study
report for the AFREPREN Theme Group on ‘Energy services for the urban poor.” In:

50
Karekezi, S., & Majoro, L., 2002, “Improving modern energy services for African’s urban poor” Energy Policy, 30, 1015-1028.
14. Duncombe, R., and Heeks, R., 2001, “Information and communication Technologies
(ICTs) and small enterprise in Africa: Lessons from Botswana.” Online: www.man.ac.uk/idpm
15. EAA (Energy Alternatives Africa), 2002, “Policy briefing #5.” Nairobi. 16. ESD (Energy for Sustainable Development), 2003, “Fuel substitution: poverty
impacts on biomass fuel suppliers.” DFID/KAR R8019, UK. 17. Etcheverry, J., 2003, “Renewable energy for productive uses: strategies to enhance
environmental protection and quality of rural life.” Department of Geography and Institute for Environmental Studies, University of Toronto.
18. Fakira, 1994, In: Meadows, K., Riley, C., Rao, G., Harris, P., 2003, “Modern Energy:
Impacts on Micro-enterprises.” A report produced for UK Department for International Development. UK.
19. FAO (Food Agricultural Organization of UN), 2000, “Study on the Impact of solar
PV systems on rural development” in Cecelski, E., 2000, “Enabling equitable access to rural electrification: current thinking and major activities in energy, poverty and gender” Briefing paper prepared for a brainstorming meeting on Asia Alternative Energy Policy Project Development Support: Emphasis on poverty alleviation and women, Asia Alternative Energy Unit, The World Bank, Washington, DC, 26-27 January 2000.
20. Foley, G., 1990, Electricity for rural people. Panos, London. 21. GoK (Government of Kenya), 2004, “Sessional Paper No.4 of 2004 on Energy.”
National Energy Policy. Nairobi. 22. Harper, M., 2001, “Micro-privatisation, public service delivery through private
micro-enterprise.” Small Enterprise Development. 12 (2). 23. Heeks, M., and Duncombe, R., 2001, “Information, technology and small enterprise:
A handbook for enterprise support agencies in developing counties.” IDPM, University of Manchester, UK., Online: www.man.ac.uk/idpm/ictsme.htm.
24. IDS, 2001, “Energy, Poverty & Gender in Rural China”. Draft Final Report May
2001, Institute of Development Studies at the University of Sussex, UK. 25. Illy, H.F., Kipper, U., Murage, W.N.K, & Ombai, M., 1997, “From infrastructure
development to capacity-building and organized sustainability,” Project Progress
51
Review of German Assisted Settlement Programme (GASP) in Lamu & Tana River Districts, Republic of Kenya, (PN 95.2015.6-01.100), GTZ.
26. Jacobson, A., 2004, Connective Power: Solar electrification and social change in
Kenya, PhD Dissertation, Energy & Resources, University of California Berkeley. 27. Kabecha, W., 1999, “Technological capability of the micro-enterprises in Kenya’s
informal sector.” Technovation, No. 19, pp.117-126. 28. Kamfor Ltd, 2002, “Study on Kenya’s energy demand, supply and policy strategy for
households, small-scale industries and service establishments.”. Final report to the Ministry of Energy, Nairobi.
29. Kapadia, K, 2004, “Productive uses of renewable energy: a review of four Bank-GEF
Projects.” Report prepared for World Bank. 30. Karekezi, S., & Majoro, L., 2002, “Improving modern energy services for African’s
urban poor” Energy Policy, 30, 1015-1028. 31. Karekezi, S., and Kithyoma, W., 2002, “Renewable energy services for rural Africa:
is a PV-led renewable energy strategy the right approach for providing modern energy to rural poor of sub-Saharan Africa?” Energy Policy, 30 (11-12), 1071-1086.
32. Karekezi, S., Kimani, J., Mutiga, A., and Amenya, S., 2003, “Energy services for the
poor in Eastern Africa.” A study for Global Network on Energy for Sustainable Development (GNESD), Nairobi. AFREPREN/FWD.
33. Khan, H.J., 2001; “Battery-operated lamps produced by rural women.” In: Misana, S.
& Karlsson, G.V. (eds) 2001. “Generating opportunities: case studies on energy and women. United Nation Development Programme, Sustainable Energy, New York, USA.
34. Kittelson, D., 1998, “Productive uses of electricity: country experiences.” National
Rural Electric Cooperative Association (NRECA) International Ltd., Prepared for Village Power 98, World Bank Headquarters, Washington D.C., 6-8 October.
35. Lanjouw, P. & Shariff, A., 2002, “Rural Non-Farm Employment in India: Access,
Income and Poverty Impact.”Working Paper Series No. 81, This paper was prepared for the Programme of Research on Human, Development of the National Council of Applied Economic Research, sponsored by the United Nations Development Programme,National Council of Applied Economic Research, India.
36. Leonard, D.K., 1991, “African successs: four public managers of Kenyan rural
development.” Berkeley. p161.

52
37. Mapako, M., and Mbewe, A. (eds), 2004, “Renewables and energy for rural development in Sub-Saharan Africa.” African Energy Policy Research Network (AFREPREN), Nairobi.
38. Martinot, E, Chaurey, A., Lew, D., Moreira, J.R., & Wamukonya, N., 2002,
“Renewable Energy Markets in Developing Countries.” Ann. Rev. Environ. 2002, 27:309-48
39. McAllister, J.A., 2002, “Electrification and productive enterprise in rural South Africa.” Term paper submitted for ER280 class. ERG, UC Berkeley.
40. McDade, S.,2004, “Fueling development: the role of LPG in poverty reduction and
growth, Energy for sustainable development, 8, (3). 41. Meadows, K., Riley, C., Rao, G., Harris, P., 2003, “Modern Energy: Impacts on
Micro-enterprises.” A report produced for UK Department for International Development. UK.
42. Ministry of Energy, 2003, “Energy sector development strategy”. Rural Energy Task
Force, Final Report. Nairobi. 43. Nakhooda, S., 2003, “Sustainable energy for sustainable development.”
Environmental Studies Honors Thesis, Dartmoth College. 44. Nyoike, P., 2004, “Impact of power sector reform on private investment and the
poor.” In: Marundu, E., & Kayo, D., (eds), “The regulation of the power sector in Africa.” African Energy Policy Research Network (AFREPREN), Nairobi.
45. Ogunlande, R, D, 2005, “The role of energy in achieving & sustaining millennium
development goals (MDGs).” Paper presented at Africa Regional Workshop on Electricity & Development in Africa, UNEP Headquarters Complex, Nairobi, Kenya, 13th-14th July 2005.
46. Osunbitan, J.A., Olushina, J.O., Jeje, J.O., Taiwo, K.A., Faborode, M.O., & Ajibola,
O.O., 2000, “Information on microenterprises in cassava and palm oil processing in the Osun 7 Ondo states of Nigeria.” Technovation, No. 20, pp.577-585.
47. Pandey, B.R., 2004, “Strategies for Nepal’s hydropower development.” Master’s
project, Energy and Resources Group, University of California, Berkeley. 48. Practical Action, 2005, “Europe’s chance to help light Africa: Energising poverty
reduction in Africa.” Practical Action, The Schumacher Centre for Technology & Development, UK, www.practicalaction.org.
49. Rana-Deuba, A,, 2001, “Rural micro-hydro development programme.” In: Misana, S.
& Karlsson, G.V. (eds) 2001. “Generating opportunities: case studies on energy and

53
women. United Nation Development Programme, Sustainable Energy, New York, USA.
50. Rogerson, C.M., 1997, “Rural electrification and the SMME economy in South
Africa.” ERC, University of Cape Town. In: Meadows, K., Riley, C., Rao, G., Harris, P., 2003, Modern Energy: Impacts on Micro-enterprises, A report produced for UK Department for International Development. UK.
51. RWEDP, 1999, Wood Energy News, June, 14 (1). In: Meadows, K., Riley, C., Rao,
G., Harris, P., 2003, “Modern Energy: Impacts on Micro-enterprises.” A report produced for UK Department for International Development. UK.
52. Scottish Power, 2005, “Pre-feasibility study: Mpeketoni wind project, Kenya.” UK.
53. TERI, 2003, “Enhancing electricity access in rural areas through distributed generation based on renewable energy” Policy Discussion Forum (PDF) Base Paper, India.
54. UNDP/Small Grants Programme, 2002, Community-based alternative energy
systems. Booklet #2. Nairobi. 55. Walubengo, D. and Onyango, A., 1992, Energy systems in Kenya: Focus on rural
electrification. KENGO Regional Wood Energy Programme for Africa. Nairobi. 56. Wamukonya, N. and Davis, M., 2001, “Socio-economic impacts of rural
electrification in Namibia: comparisons between grid, solar and unelectrified households.” Energy for sustainable development.