kibali site visit - randgold resources site... · kibali site visit january 2015 ... 19 x 777g...
TRANSCRIPT

1
Kibali site visitJanuary 2015
Randgold Central and East Africa structure…
MetManagerAndrews
Awini
KibaliFinancialManagerNortonKabeya
Eng.Manager
DriesMetrovich
GM Kibali MineCharles Wells
CEO RRLMark Bristow
COO C & E / AWillem Jacobs
Social &Sustainability.
ManagerCyrille
Mutombo
MineDirector
BruceFerreira
SupplyChainTeddy
Mbiyavanga
Camp Mngr +Regional Gov. LiasonJean Pierre
Mbuluyo
SafetyManagerEghardVoigt
HRManager
LucieKikadi
ExplorationManager
JustusKwibisa
MRMManagerGeorgeKondela
Kinshasa OfficeManager
RoyBondo
Country ManagerCyrille Mutombo
FINANCENaude van Eck

2
Kibali supply routes…
Kibali
Dar es Salaam
Mombasa
1 800 km
1 950 km
Overview of Kibali history in Randgold….
2006On site due diligence
by Randgold
Sep 2009Acquired
Moto Goldmines (70% Kibali) in JV with AGA in a public
international auction
Dec 2009JV acquired a further 20% in
Kibali from SOKIMO
Feasibility updated reserves
doubled to over 10Moz
Sep 2013
2010Formal notice to
illegal miners and alternate work
programme started
Mar 2010MOU signed with Catholic Church
Jul 2010
Aru-Doko road upgrade completed
Nov 2010Established Kokiza village
for resettlement
Feb 2011
Revisedfeasibility
Aug 2011 May 2012First Gold &
completion of RAP
Commissioning and ramp up of met facility and
associated infrastructure
completed
Pre-construction
started
Oct 2011 2014JV approves feasibility and vote capital

3
Kibali…project update to Dec 2014
Construction of the metallurgical facility completed and design parameters achieved
Construction related contractors in the metallurgical plant demobilised
Nzoro II hydropower station completed - all 4 turbines commissioned and a consistent power feed into the grid in line with design parameters
Vertical and decline shaft systems remain within budget and on schedule
Quarter on quarter improvement in throughput, recovery and gold production.
UG stoping commenced in Q4
RAP inclusive of Catholic Church Complex completed
Construction of the Ambarau hydro station started
Establishment of an elected community forum as the main platform for engagement with local communities
Award in excess of $600 million of business to companies with 50% or more Congolese shareholding since the inception of the project
Business Plan for 2015…
Gold production target 600 000 ounces
UG mine development on schedule
Commission Ambarau hydrostation
Continued nationalisation of management team
Secure more exploration permits in DRC
Collect TVA
Work with Government and industry to establish competitive mining code
Obtain ISO 14001 EMS certification
Establish large scale agribusiness venture
Improve working relationship with Provincial Government

4
Mineral resources and exploration
Congo Craton…
10km
N
N. MARA4.97 Moz
ADUMBI1.67 Moz
MAKAPELA1.16 Moz
KIBALI22.2 Moz ZANI KODO
2.97 Moz
MONGBWALU2.93 Moz
BUZWAGI3.43 Moz
GOLDEN PRIDE1.36 Moz
BULYANHULU15.63 Moz
GEITA10.67 Moz
KCD deposit
TWANGIZA6.3Moz
N
100km
Uganda
Tanzania
Kenya
DRC
5
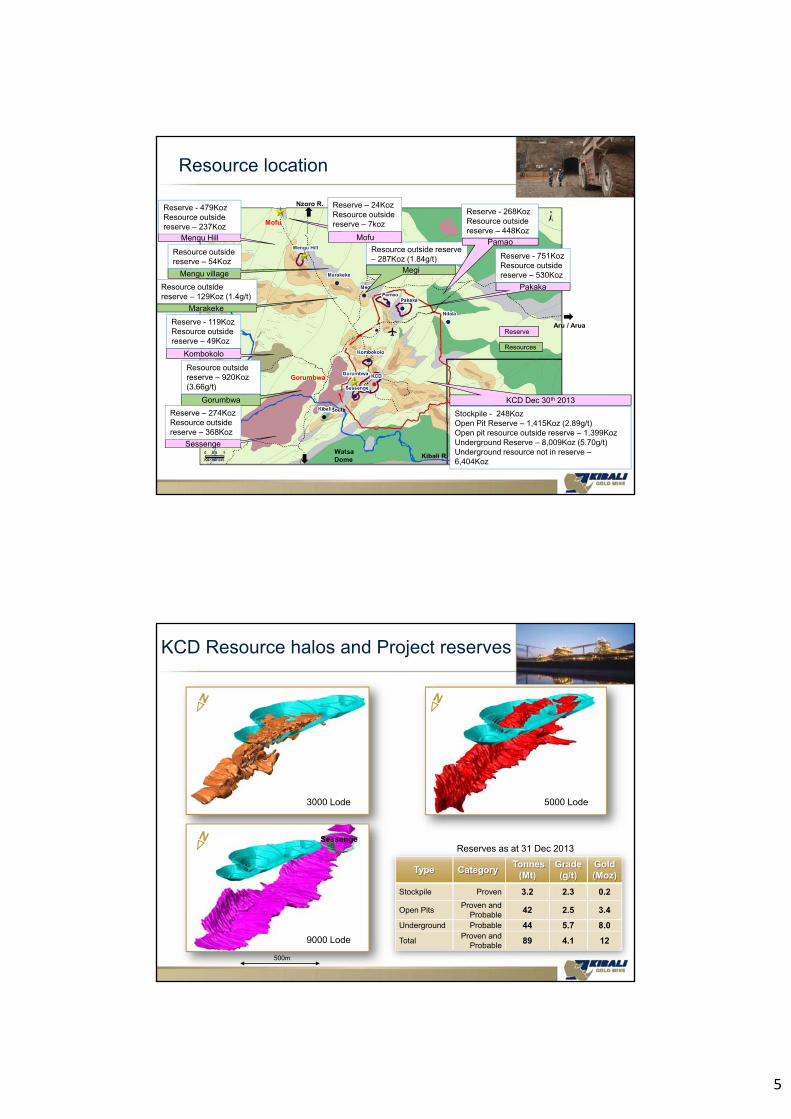
Resource location
Mengu Hill
Megi
Mengu Hill
Reserve - 479KozResource outside reserve – 237Koz
Resource outside reserve – 287Koz (1.84g/t)
Megi
Gorumbwa
Resource outside reserve – 920Koz (3.66g/t)
KCD Dec 30th 2013
Mengu village
Resource outside reserve – 54Koz
Pakaka
Stockpile - 248Koz Open Pit Reserve – 1,415Koz (2.89g/t)Open pit resource outside reserve – 1,399Koz Underground Reserve – 8,009Koz (5.70g/t)Underground resource not in reserve –6,404Koz
Kombokolo
Reserve - 119KozResource outside reserve – 49Koz
Sessenge
Reserve – 274KozResource outside reserve – 368Koz
Pamao
Reserve - 268KozResource outside reserve – 448Koz
Resource outside reserve – 129Koz (1.4g/t)
Marakeke
Reserve - 751KozResource outside reserve – 530Koz
Kibali R.
Nzoro R.
Aru / Arua
WatsaDome
Reserve
Resources
Mofu
Gorumbwa
Mofu
Reserve – 24KozResource outside reserve – 7koz
3000 Lode 5000 Lode
9000 Lode
500m
KCD Resource halos and Project reserves
Type CategoryTonnes
(Mt)Grade (g/t)
Gold (Moz)
Stockpile Proven 3.2 2.3 0.2
Open PitsProven and
Probable42 2.5 3.4
Underground Probable 44 5.7 8.0
TotalProven and
Probable89 4.1 12
Reserves as at 31 Dec 2013Sessenge

6
NORTH
1
23
8
5White House
5105 HG
3000 lodeLow grade halo
5103 - HG
5110 - HG
Dispatch
9000 UG
3000 UG
DoleriteChert
Ironstone 3003
3005
3004
KCD…upside potential
Domain Au g/t Ounces
3003 1.8 397,574
3004 1.75 80,242
3005 0.89 7,663
67
Mofu and Gorumbwa deposits…
GRC09712m @ 4.51g/t (from 0m)
GRC10214m @ 3.04g/t (from 22m)
GRC10420m @ 5.72g/t (from 22m)
GDD09414m @ 7.73g/t from 126m
1001100210031004
1005100610071008
Ore domains
$1500 Pit
Nov.14
NORTHGorumbwa
historical pit
Gorumbwa Historical shaft
Gorumbwa Historical UG
depletion

7
Kalimva
Pakaka
KCD
Zambula
KCD
N
WatsaDome
35km KZ structure, terrain boundary hosting multiple plunging orebodies
Potential is open down dip and down plunge
Gaps in coverage along the structure being targeted at surface
Review and analysis of controls and mineralisation footprint in progress
10km
Kibali…world class potential over35km of strike
Plunging mineralised lode
Kalimva
Mofu
Mengu Hill
Mengu village
Marakeke
Megi
Pamao
Pakaka
AerodromeRhino
Agbarabo
KCD
Kombokolo
Gorumbwa
Sessenge
Kibali South
5850mRL
Gaps in drilling
5750mRL
2000m
KZ structure gap analysis…
250mMineralization Foot Print
“S2” structure
8
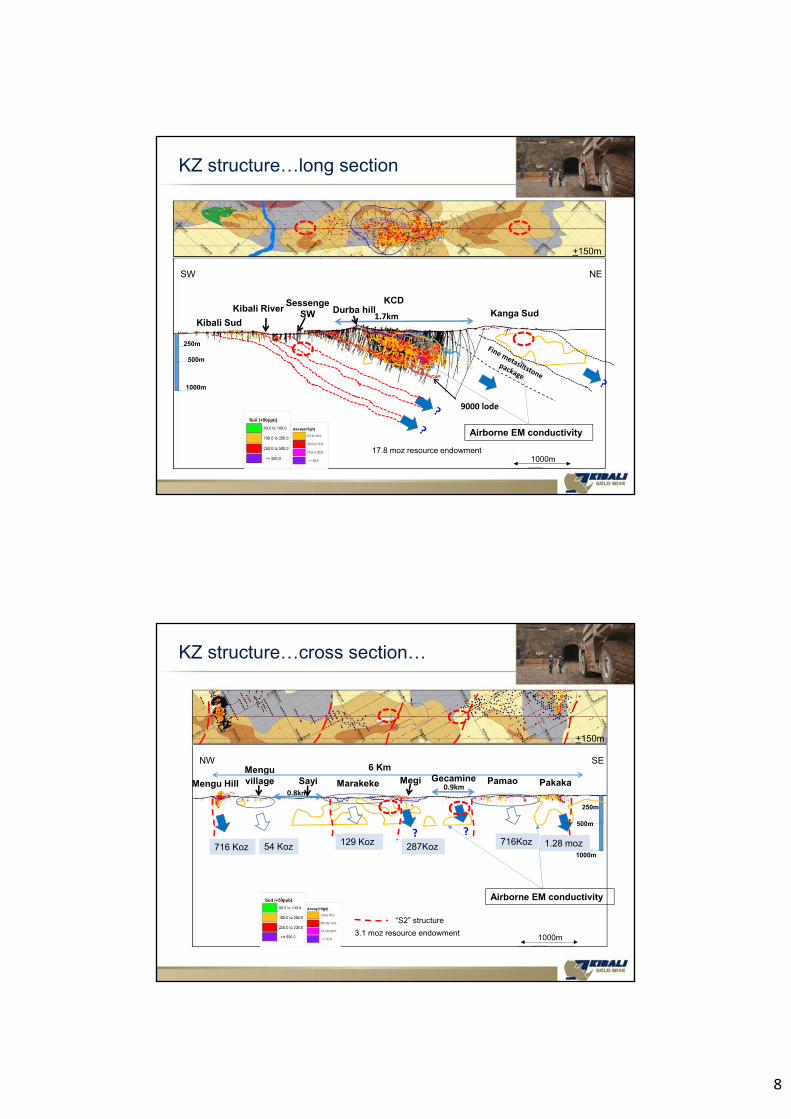
KZ structure…long section
Kanga SudKCD
1.7kmKibali Sud
Sessenge SW
Airborne EM conductivity
NESW
+150m
9000 lode
Kibali River Durba hill
500m
1000m
250m
1000m17.8 moz resource endowment
KZ structure…cross section…
500m
1000m
250m
Mengu Hill PakakaPamaoMegiMarakeke
Mengu village
0.9km0.8km
6 Km
716 Koz 1.28 moz716Koz287Koz129 Koz
Airborne EM conductivity
+150m
SENW
Sayi Gecamine
54 Koz
1000m3.1 moz resource endowment
“S2” structure
9
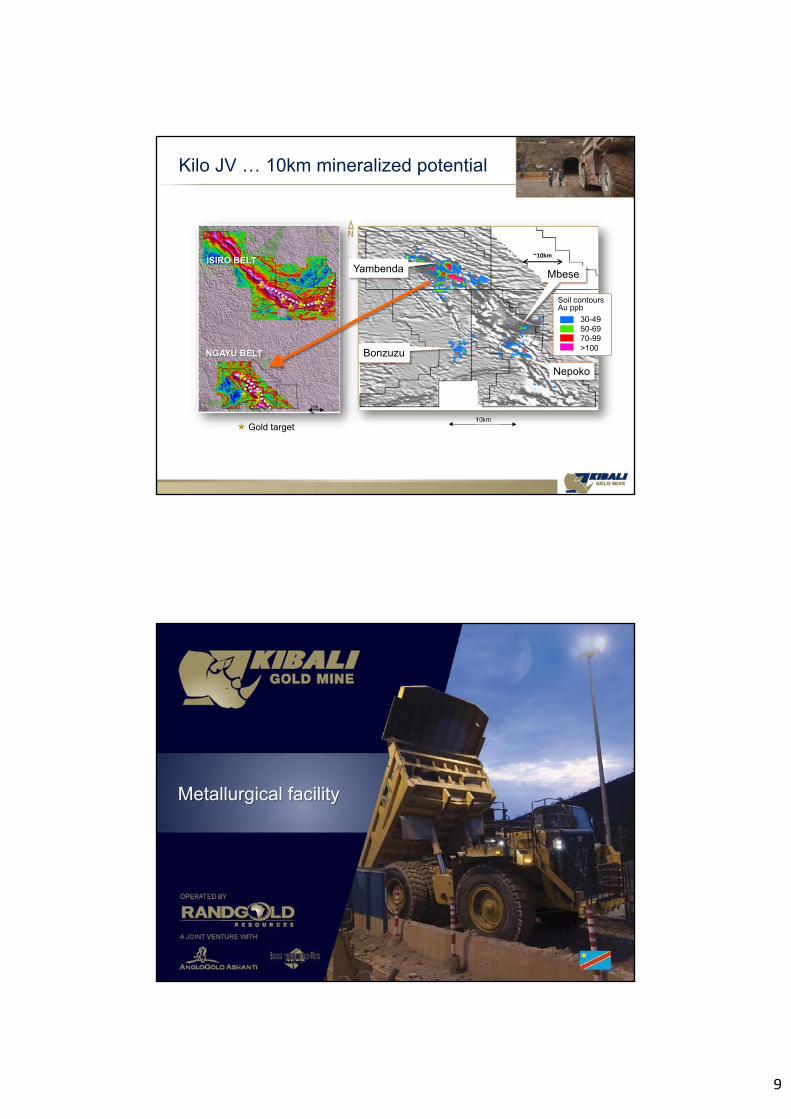
Kilo JV … 10km mineralized potential
10km
Gold target
ISIRO BELT
NGAYU BELT
10km
N
Yambenda
Bonzuzu
Mbese
Nepoko
30-4950-6970-99>100
Soil contoursAu ppb
3
5
7
~10km
Metallurgical facility

10
Metallurgical plant…
Twin Circuit metallurgical facility…
CIL F
lota
tion
CIL F
lota
tion
2
Flo
tatio
n1
Conc.
Oxide + Sulphide treatment Sulphide Only treatment
Conc.
UFG/Pump Cell UFG/Pump
Cell
Ball 2 Ball 1Ball 2Ball 1
11
Twin circuit processing strategy…
Material crushed through mineral sizer directly into ball mill 6.1m diam. x 9.5m
Gravity and flash float ahead of conventional CIL
CIL tails through detox to lined TSF
Circuit designed at 300ktpm or 3.6MTPA
Each Ball Mill capable of 300ktpm or 3.6MTPA (as per Tongon). CIL residence time capable of 358ktpm / 4.3MTPA
Conversion to sulphide processing through addition of a second bank of flotation cells to follow the gravity and flash float circuits (making it identical to the other sulphide circuit)
Oxide / transition Sulphide
Fresh Open Pit material crushed through primary jaw and secondary cone (with provision for tertiary cone if required) onto mill feed stockpile. Mill identical to oxide/trans at 6.1m diam. x 9.5m
Fresh underground material crushed through primary jaw crushers underground and conveyed to stockpile inside met plant ahead of secondary crushing
Gravity and flash float
Full flotation
Flotation tails (benign) direct to unlined TSF or backfill/paste plant
Circuit designed at 300ktpm or 3.6MTPA (single mill and flotation bank)
Mill capable of 300ktpm or 3.6MTPA . Oxide mill to be converted to sulphide mill increasing fresh material milling capability to 600ktpm or 7.2MTPA
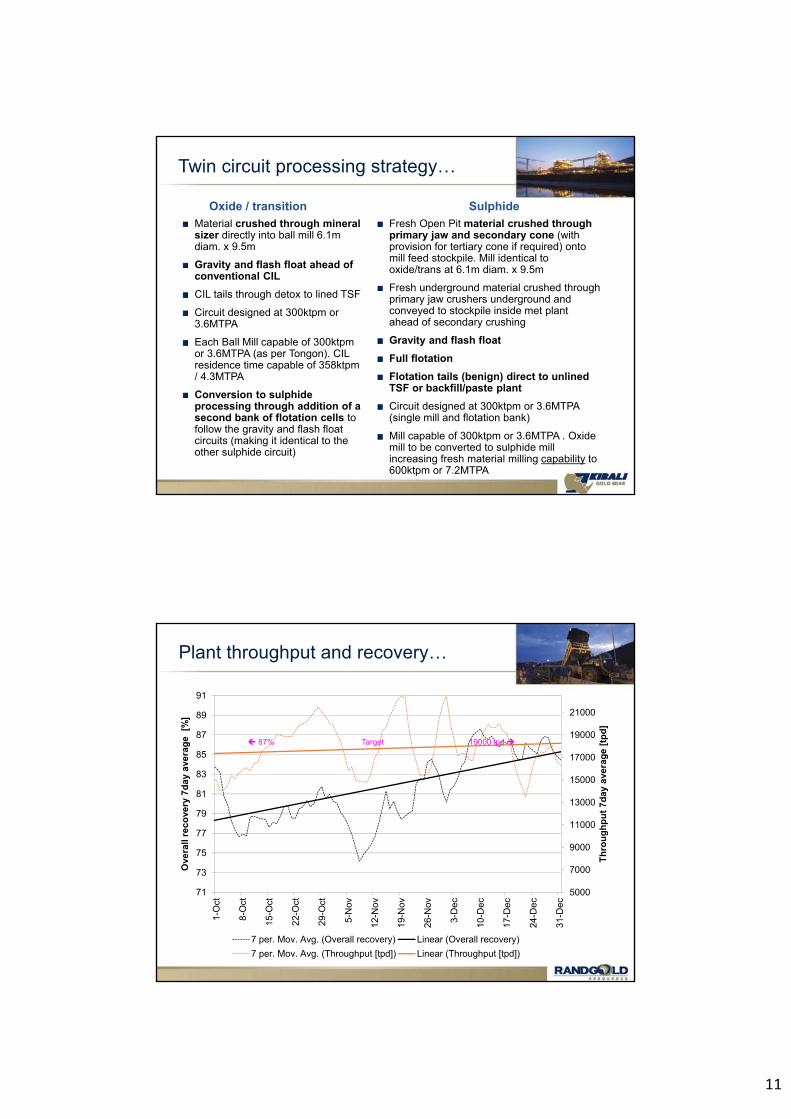
Plant throughput and recovery…
5000
7000
9000
11000
13000
15000
17000
19000
21000
71
73
75
77
79
81
83
85
87
89
91
1-O
ct
8-O
ct
15-O
ct
22-O
ct
29-O
ct
5-N
ov
12-N
ov
19-N
ov
26-N
ov
3-D
ec
10-D
ec
17-D
ec
24-D
ec
31-D
ec
Th
rou
gh
pu
t 7d
ay a
vera
ge
[tp
d]
Ove
rall
reco
very
7d
ay a
vera
ge
[%
]
7 per. Mov. Avg. (Overall recovery) Linear (Overall recovery)
7 per. Mov. Avg. (Throughput [tpd]) Linear (Throughput [tpd])
87% Target 19000 tpd

12
Mining
A fully integrated mine design…
9000 lode5000 lode
Shaft
Boxcut
Open pit
Mine design
Haulage level
Crusher and Pumping stations
1km

13
Opencast mining…
Multiple pits to be mined over 10 years
KCD pit mining started in July 2012
Production achieved with trained local operators
3 x Liebher 9350 diggers , 1 x Liebher 984 digger and 19 x 777G dedicated to production and auxiliary equipment as support
The mine plan, including ore production and plant feed, was achieved for the year
Overview
Underground Mine Complex…Shaft
A 760m shaft, 8m diameter concrete lined
Shaft capacity Wet tonnes(includes 5% moisture) = 3.6Mt/yr.
Shaft capacity Dry tonnes = 3.43Mt/yr.
Average tonnage hoisted from the shaft on current schedule = 3Mt/yr.
Dedicated hoisting shaft but it will be equipped with a service cage for maintenance purposes
Material Handling and Orepass
Nine orepasses feeding onto a haulage drive
Automated loader feeding from orepasses to crusher
2 sets of crushers underground with 1000 t capacity for coarse and fine bin each.
Paste Plant
Paste plant with 192 m3/hr capacity
Full flexibility in throughput and binder content
Construction started and planned for commissioning in April 2015

14
Underground mining…vertical shaft
Shaft current depth 720m
83 days ahead of schedule
Development ongoing on last level close to main infrastructure
Target to finish sinking in Q3 2015 and equip in Q1 2016
Off shaft development will continue in 2016 together with equipment of main infrastructure
Shaft fully commissioned and hoisted Q3 2017
Shaft development progress…
Railway Haulage
Settlers
Trommels
Clear Water Dams
INTERFACE #1
1st MAIN SINK
-724.5
-682.0
-525.0
4m Vent ShaftVertical Shaft
2nd MAIN SINK
3rd MAIN SINK
4th MAIN SINK
-760.0
Temporary Ore
Pass
Fine Ore Silos
Crusher Station
Coarse Ore Silos
INTERFACE #4
INTERFACE #3
INTERFACE #2
Shaft Bottom
Main Pump Station
-293.4m 16Feb14
-7.0m 25Jan13
-14.8m 08Apr13
-28.0m 30Apr13
-525.0
PRE – SINK
(-25.0m to -102.4m)
Actual Start 26-Apr-13
Actual Finish 30-Jul-13
SLOW SINK
(-102.4m to -182.0m)Actual Start 26-Apr-
13Actual Finish to 30-
Jul-13Actual Start 25-
Dec-13
-182.0m 24Dec13
-257.0m 02Feb14
-335.5m 05Mar14
-158.0m 12Dec13
-419.5m 01Apr14
-485.5m 05May14
-525.0m 26-May-14
Plan Q1 2015Actual PTD – Dec 2014

15
Decline Development
Decline development started in Dec 2012 with Byrnecut as contractor
Byrnecut consistently achieving the development targets
Rate of advance has been materially better than planned in the feasibility
An average of 300m/month/jumbo was reached in development, with the decline contractor has now ramped up to 900m/month
A total of 12.1km was developed project to date of which 10km in the capital side and 2 km in opex
For 2014 a total of 8km was developed of which 6km in capital and 2 km in opex
Production started from the first stope in Dec 14
Target from stoping is 30Kt/month from Q1 to Q3
Stoping tonnes ramp up to 70Ktonnes/month in Q4
Completion ofB1_Decline
C_Decline
665L
OCT 2014
NOV 2014
DEC 2014
Actual YTD ending Q3 2014
630L595L560L
B1_Incline
620L_MRA_N
Quarter Quarter Quarter 9 months 9 monthsended ended ended ended ended30 Sep 30 Jun 30 Sep 30 Sep 30 Sep
2014 2014 2013 2014 2013Ore tonnes mined 2 843 - -Development metres 1 802 1 222 2 580
Decline development..Q4 plan

16
665 XC2 STOPE FIRING SEQUENCEID LEVEL Firing Grade (gr/t) Tonnages KG (ANFO) Orebody
1 665 SLOT RAISE (ready done Up to 10 m) 7.2 800 1524 5110
2 665 SLOT RAISE ( Up to 20 m) 7.2 800 1524 5110
3 665 R1‐2W & R1‐2E Up to 20m 7.2 1350 1684 5110
4 665 R3‐6W Up To 20m 7.2 850 873 5110
5 665 R3‐7E Up to 20 m 7.2 1650 2041 5110
6 665 SLOT RAISE + REMAINDER OF SLOT RINGS 7.2 2698.4 3530 5110
7 665 PRODUCTION RINGS 1 &2 3.7 10537.60 4436 5110
8 665 PRODUCTION RINGS 3 2.3 5738.60 2164 Waste Min.
9 665 PRODUCTION RINGS : R4, R5, R6, R7, R8 & R9 5.6 31528 11815 5103
TOTAL 5.1 55952.6 29591
First Stope MS-1…
Kibali Underground mining…Shaft Sinking

17
Hydropower
Our power strategy…
Supply concept is a hybrid arrangement
Peak power Deliver peak power on the available river schemes average flows
Dry season low flow powerMaximize the number of stations supplying to maximize the power available in the low flow periods.
Diesel back-up generationFor power load fluctuations of shaft winder and Met PlantInitially provide dry season make-up power from high speed diesel unitsSubstitute (diesel generation) with more hydro stations as overall power demand grows

18
Station Plan Min output (low flow
MW)
TargetOutput
(peak MW)
Completion
Nzoro 2 Operational 5 22 QTR2 2014
Kibali 1(Ambarau)
Under Construction 2.5 10QTR2 2016(1st power Q3 2015)
Kibali 2(Azambi)
Designed and planned for 2018
2.5 10 QTR3 2018
Total Main 10 42
Our plan…the supply of power via hydro
Nzoro ll hydropower plant construction…
4 turbines commissioned and 3 operational -currently generating 16,8MW
Synchronisation of power produced from Nzoro 2 with diesel power plant via Power Management System
View from canal of intake structure and control room
Views from canal of forebay structure and control room
Entrance ramp and cable rack for main power output cables
Turbine installations on lower level
Views of Nzoro river dammed up and diversion into Intake

19
Project Update
Investment phases…
Phase 2 capital programme is estimated at US$700m before escalation provisions and contingencies which will run concurrently with Phase 1 but will extend over a longer period, is focused primarily on the underground development and includes a twin decline and vertical shaft system as well as three hydropower stations. This is expected to bring the underground into first production by the end of 2014, with vertical shaft handover scheduled in 2017.
Phase 1 capital programme is estimated at US$1130m and will cover the metallurgical facility, one hydropower station and back-up thermal power facility, construction of the tailings storage facility, relocation of villages, open pit mining and all shared infrastructure. This is expected to be completed by December 2014.

20
Kibali…actual and forecast production
0
1
2
3
4
5
0
100
200
300
400
500
600
700
2013 2014 2015 2016 2017 2018 2019
Actual production Total cash cost/oz Capex Grade
Grade g/tTotal cash cost/oz
Capex $m
Gradeg/t
ProductionOz 000
Cash cost$/oz
Capex$m
Health and Safety

21
Kibali, health safety and environment…
113,14
70,2761,05
50,29
0
20
40
60
80
100
120
2011 2012 2013 2014
RA
TE
Malaria Incident Rate
2011-20146,14
2,49
0,59 0,37
0
1
2
3
4
5
6
7
2011 2012 2013 2014
RA
TE
LTIFR
Health and SafetyRecently passed 2 million LTI free hours
5 Accredited St John Trainers
Malaria incident rate decreasing (reduction +55% since start of project in 2011)
EBOLA PPE management plan in place
Environment
No major environmental incidents
ISO14001 preparations for accreditation in 2015
Biodiversity action plans in progress.
Community

22
Kibali…Resettlement Action Plan
Roman Catholic Church now completed
Keys to all 4 216 house have been handed over by construction companies
All compensation claims related to the resettlement plan have been finalised
Community jobs such as plant waste management, stone pitching, airport maintenance and general housekeeping continue
Visible contributions:$158.3m
Non visible contributions:$812.7m Salaires: $1.3m
Taxes & Permits: $5.2Payment to suppliers:
$73.1m
Taxes and Permits: $139.6m
Salaries: $115,7mTaxes and Permits: $13.5m
Payment to suppliers: $464.3m
NATIONAL
PROVINCIAL
LOCAL
Financial Contribution…2010 to 2014
US$ 000

23
Our impact…employment
From artisanal mining to a world class mine
At peak construction project employed more than 12 000 people (2012)
Currently the mine employs 4 500 people
Our impact…communities
Relocation of people…THEN and NOW
24
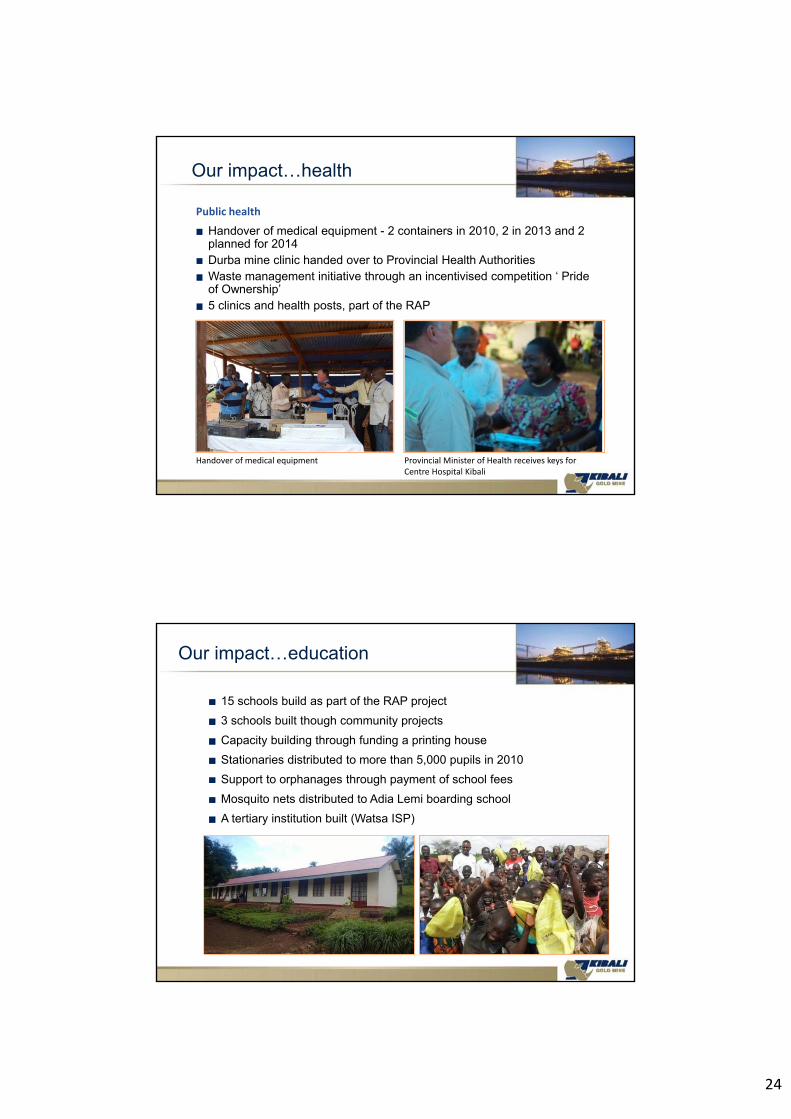
Our impact…health
Handover of medical equipment - 2 containers in 2010, 2 in 2013 and 2 planned for 2014Durba mine clinic handed over to Provincial Health AuthoritiesWaste management initiative through an incentivised competition ‘ Pride of Ownership’ 5 clinics and health posts, part of the RAP
Public health
Handover of medical equipment Provincial Minister of Health receives keys for Centre Hospital Kibali
Our impact…education
15 schools build as part of the RAP project
3 schools built though community projects
Capacity building through funding a printing house
Stationaries distributed to more than 5,000 pupils in 2010
Support to orphanages through payment of school fees
Mosquito nets distributed to Adia Lemi boarding school
A tertiary institution built (Watsa ISP)

25
Durba…2006
Durba…2014
26
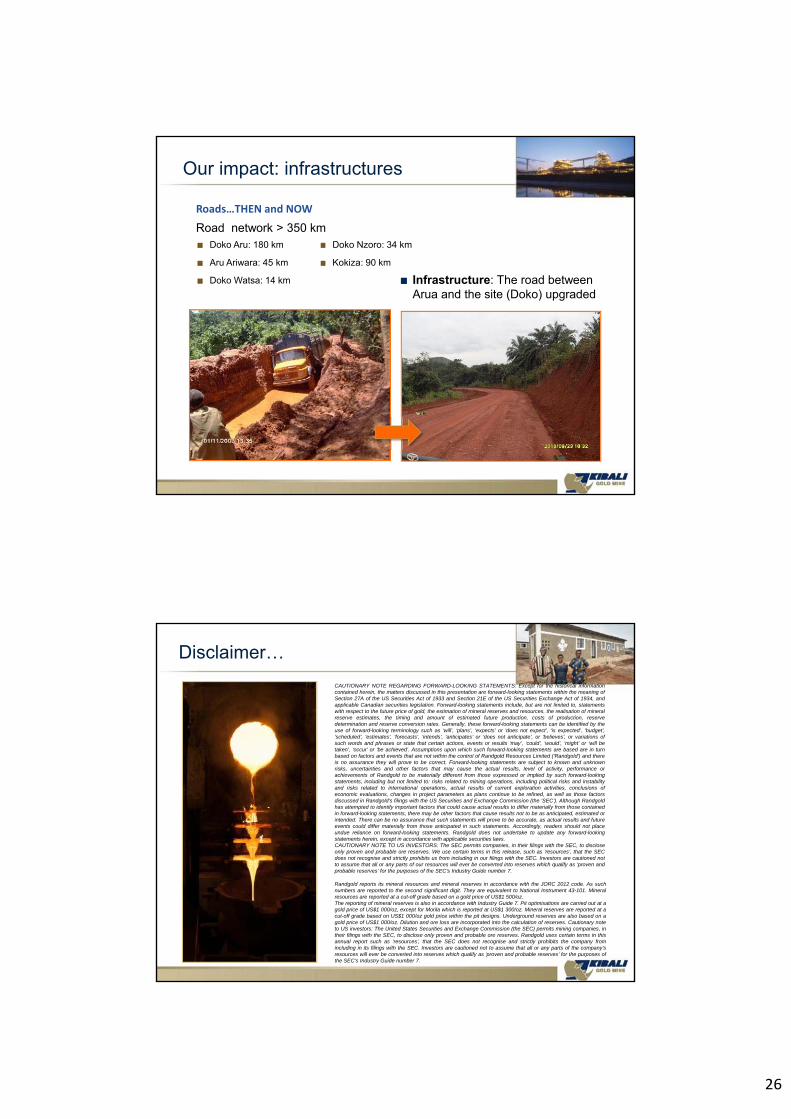
Our impact: infrastructures
Infrastructure: The road between Arua and the site (Doko) upgraded
Doko Aru: 180 km
Aru Ariwara: 45 km
Doko Watsa: 14 km
Doko Nzoro: 34 km
Kokiza: 90 km
Road network > 350 km
Roads…THEN and NOW
Disclaimer…
Randgold reports its mineral resources and mineral reserves in accordance with the JORC 2012 code. As suchnumbers are reported to the second significant digit. They are equivalent to National Instrument 43-101. Mineralresources are reported at a cut-off grade based on a gold price of US$1 500/oz.The reporting of mineral reserves is also in accordance with Industry Guide 7. Pit optimisations are carried out at agold price of US$1 000/oz, except for Morila which is reported at US$1 300/oz. Mineral reserves are reported at acut-off grade based on US$1 000/oz gold price within the pit designs. Underground reserves are also based on agold price of US$1 000/oz. Dilution and ore loss are incorporated into the calculation of reserves. Cautionary noteto US investors: The United States Securities and Exchange Commission (the SEC) permits mining companies, intheir filings with the SEC, to disclose only proven and probable ore reserves. Randgold uses certain terms in thisannual report such as ‘resources’, that the SEC does not recognise and strictly prohibits the company fromincluding in its filings with the SEC. Investors are cautioned not to assume that all or any parts of the company’sresources will ever be converted into reserves which qualify as ‘proven and probable reserves’ for the purposes ofthe SEC’s Industry Guide number 7.
CAUTIONARY NOTE REGARDING FORWARD-LOOKING STATEMENTS: Except for the historical informationcontained herein, the matters discussed in this presentation are forward-looking statements within the meaning ofSection 27A of the US Securities Act of 1933 and Section 21E of the US Securities Exchange Act of 1934, andapplicable Canadian securities legislation. Forward-looking statements include, but are not limited to, statementswith respect to the future price of gold, the estimation of mineral reserves and resources, the realisation of mineralreserve estimates, the timing and amount of estimated future production, costs of production, reservedetermination and reserve conversion rates. Generally, these forward-looking statements can be identified by theuse of forward-looking terminology such as ‘will’, ‘plans’, ‘expects’ or ‘does not expect’, ‘is expected’, ‘budget’,‘scheduled’, ‘estimates’, ‘forecasts’, ‘intends’, ‘anticipates’ or ‘does not anticipate’, or ‘believes’, or variations ofsuch words and phrases or state that certain actions, events or results ‘may’, ‘could’, ‘would’, ‘might’ or ‘will betaken’, ‘occur’ or ‘be achieved’. Assumptions upon which such forward-looking statements are based are in turnbased on factors and events that are not within the control of Randgold Resources Limited (‘Randgold’) and thereis no assurance they will prove to be correct. Forward-looking statements are subject to known and unknownrisks, uncertainties and other factors that may cause the actual results, level of activity, performance orachievements of Randgold to be materially different from those expressed or implied by such forward-lookingstatements, including but not limited to: risks related to mining operations, including political risks and instabilityand risks related to international operations, actual results of current exploration activities, conclusions ofeconomic evaluations, changes in project parameters as plans continue to be refined, as well as those factorsdiscussed in Randgold’s filings with the US Securities and Exchange Commission (the ‘SEC’). Although Randgoldhas attempted to identify important factors that could cause actual results to differ materially from those containedin forward-looking statements, there may be other factors that cause results not to be as anticipated, estimated orintended. There can be no assurance that such statements will prove to be accurate, as actual results and futureevents could differ materially from those anticipated in such statements. Accordingly, readers should not placeundue reliance on forward-looking statements. Randgold does not undertake to update any forward-lookingstatements herein, except in accordance with applicable securities laws.CAUTIONARY NOTE TO US INVESTORS: The SEC permits companies, in their filings with the SEC, to discloseonly proven and probable ore reserves. We use certain terms in this release, such as ‘resources’, that the SECdoes not recognise and strictly prohibits us from including in our filings with the SEC. Investors are cautioned notto assume that all or any parts of our resources will ever be converted into reserves which qualify as ‘proven andprobable reserves’ for the purposes of the SEC’s Industry Guide number 7.