key developing country features to be addressed in the ... · 3 developing country features ......
TRANSCRIPT
System for Environmental and Agricultural Modelling; Linking European Science and Society
Report no.: 5 December 2005 Ref.: D3.8.1 ISBN no.: 90-8585-033-9
Key developing country features to be addressed in the global modelling of SEAMLESS-IF
B. Barbier, M.H. Kuiper, F.W. van Tongeren
Partners involved: CIRAD, LEI
Logo’s main partners involved in this publication Sixth Framework Programme
SEAMLESS No. 010036 Deliverable number: D3.8.1 09 November 2005
Page 2 of 34
SEAMLESS integrated project aims at developing an integrated framework that allows ex-ante assessment of agricultural and environmental policies and technological innovations. The framework will have multi-scale capabilities ranging from field and farm to the EU25 and globe; it will be generic, modular and open and using state-of-the art software. The project is carried out by a consortium of 30 partners, led by Wageningen University (NL). Email: [email protected]
Internet: www.seamless-ip.org Authors of this report and contact details Name: Bruno Barbier Partner acronym: CIRAD Address: CIRAD, Av. Agropolis, Monpellier, 34398, France E-mail: [email protected]
Name: Marijke Kuiper Partner acronym: LEI Address: Public Issues Division, LEI, P.O. Box 29703, 2502 LS The Hague E-mail: [email protected]
Name: Frank van Tongeren Partner acronym: LEI Address: Public Issues Division, LEI, P.O. Box 29703, 2502 LS The Hague E-mail: [email protected]
Disclaimer 1:
“This publication has been funded under the SEAMLESS integrated project, EU 6th Framework Programme for Research, Technological Development and Demonstration, Priority 1.1.6.3. Global Change and Ecosystems (European Commission, DG Research, contract no. 010036-2). Its content does not represent the official position of the European Commission and is entirely under the responsibility of the authors.”
"The information in this document is provided as is and no guarantee or warranty is given that the information is fit for any particular purpose. The user thereof uses the information at its sole risk and liability."
Disclaimer 2:
Within the SEAMLESS project many reports are published. Some of these reports are intended for public use, others are confidential and intended for use within the SEAMLESS consortium only. As a consequence references in the public reports may refer to internal project deliverables that cannot be made public outside the consortium.
When citing this SEAMLESS report, please do so as:
Barbier, B., Kuiper, M.H., van Tongeren, F.W., 2005. Developing country features that should be addressed in the global modelling, SEAMLESS Report No.5, SEAMLESS integrated project, EU 6th Framework Programme, contract no. 010036-2, www.SEAMLESS-IP.org, 34 pp, ISBN no. 90-8585-033-9.
SEAMLESS No. 010036 Deliverable number: D3.8.1 09 November 2005
Page 3 of 34
Table of contents Table of contents.................................................................................................................................... 3
General part ........................................................................................................................................... 5
Objective within the project ................................................................................................................. 5
General Information ............................................................................................................................. 5
Executive summary ............................................................................................................................... 5
Scientific and societal relevance ........................................................................................................... 7
Specific part ........................................................................................................................................... 9
1 Introduction.................................................................................................................................. 9
2 Modelling third country impacts .............................................................................................. 11 2.1 Outline of approaches ........................................................................................................ 11 2.2 Linking CAPRI and GTAP.................................................................................................. 13
2.2.1 CAPRI ........................................................................................................................... 13 2.2.2 GTAP............................................................................................................................. 14 2.2.3 Exploiting the complementarities between CAPRI and GTAP ..................................... 14
2.3 Analyzing the competitiveness of European agriculture ................................................... 15
3 Developing country features ..................................................................................................... 17 3.1 Agriculture.......................................................................................................................... 17
3.1.1 Tropical agriculture ....................................................................................................... 17 3.1.2 Large agricultural sector ................................................................................................ 18
3.2 Market imperfections.......................................................................................................... 18 3.2.1 Imperfect input and output markets ............................................................................... 19 3.2.2 Imperfect labour markets ............................................................................................... 19 3.2.3 Imperfect credit markets ................................................................................................ 19 3.2.4 Strong government involvement.................................................................................... 19
3.3 Rural/urban divide ............................................................................................................. 20 3.3.1 Off-farm income of rural households ............................................................................ 20 3.3.2 Subsidization of urban consumers ................................................................................. 20
4 Modelling developing country impacts .................................................................................... 21 4.1 Developing country features in GTAP................................................................................ 21
4.1.1 Accounting for trade in tropical crops ........................................................................... 21 4.1.2 Weaker supply response due to market imperfections................................................... 21
SEAMLESS No. 010036 Deliverable number: D3.8.1 09 November 2005
Page 4 of 34
4.1.3 Imperfect labour markets ...............................................................................................22 4.2 National models for developing countries ..........................................................................22 4.3 Farm household model for developing countries................................................................23 4.4 Challenges posed by linking models ...................................................................................24
5 Conclusions .................................................................................................................................25
References.............................................................................................................................................27
Glossary ................................................................................................................................................29
Appendices............................................................................................................................................31

SEAMLESS No. 010036 Deliverable number: D3.8.1 09 November 2005
Page 5 of 34
General part
Objective within the project
The first deliverable of the task 3.8 ‘Develop model components for impact analysis onto non EU countries and LDCs (Developing countries)’ aims to identify developing country features that need to be addressed within the SEAMLESS framework to analyze possible links between EU agricultural policies and (sustainable) development in developing countries. It is part of the SEAMLESS Work Package 3 ‘Quantitative tools and models for integrated sustainability assessment at multiple scales’.
General Information
Task(s) and Activity code(s): D.3.8.1
Input from (Task and Activity codes): T3.3 (FFSIM) T3.6(aggregation)
Output to (Task and Activity codes): PD3.8.2, PD3.8.3, D3.8.5
Related milestones: M3.8.1
Executive summary
This particular deliverable addresses the specific LDCs features that should be addressed into global models such as GTAP and CAPRI as stressed in the DOW under Task 3.8. According to the DOW the two principal questions to be addressed by task 3.8 are: (1) What are the impacts of EU agricultural polices on the sustainability of development in third countries, and especially in Least Developed Countries (LDCs) (2) What are the options for EU agricultural policies to be made compatible with other policies and agreements at the international level (e.g. WTO, CBD).
There are two major reasons for assessing third country impacts of EU agricultural policies:
(i) EU agricultural policies may affect the international competitiveness of European agricultural producers, which through changes in international trade flows affects EU agricultural production;
(ii) EU agricultural policies, through international trade, affect livelihoods and natural resource use in developing countries, which may conflict with, or support EU’s development and environmental policies.
To analyze the international competitiveness of the European agricultural sector we will link two models: CAPRI (Common Agricultural Policy Regional Impact Analysis) and GTAP (Global trade Analysis Project). CAPRI and GTAP are two different types of models with different regional and sectoral coverage. The strong point of CAPRI is the detailed modelling of the European agricultural sector. The strong point of GTAP is its economy-wide coverage, accounting for all sectors and all countries. The objective of linking CAPRI and GTAP is therefore to arrive at a model structure which improves
SEAMLESS No. 010036 Deliverable number: D3.8.1 09 November 2005
Page 6 of 34
1. the extent to which CAPRI accounts for feedback with other sectors and countries,
2. the extent to which GTAP accounts for EU agricultural policy and production.
Such a linking would improve the performance of both models, contributing to the analysis of the impact of EU agricultural policies on the international competitiveness of European agriculture, international trade and production in the rest of the world.
The way in which the two models will be linked is the first major challenge faced in this task. Apart from a consistent mapping of sectors and regions between the two models, we need to arrive at a consistency between the assumptions of CAPRI and GTAP. However, a fully-fledged elaboration of the GTAP_CAPRI linkage is beyond the scope of this report.
The standard specification of GTAP is based on the economic structure in high-income countries. Changes will be made to the modelling of developing countries to account for the importance of tropical crops, weaker supply response resulting from market imperfections and imperfect labour markets. These changes to GTAP are the second modelling challenge faced in this task.
To analyze the impact of EU agricultural activities and policies on poverty and sustainability in developing countries national level general equilibrium models will be developed for developing countries. Because of the importance of agriculture in developing countries and the need to analyze both rural and urban incomes an agricultural sector model like CAPRI does not suffice. In terms of the overall SEAMLESS project the national models serve the same role for developing countries as CAPRI does for European agriculture: transmitting changes at the international and national level to rural households. Development of a national level CGE model that allows analysis of household incomes, production and consumption decisions is the third modelling challenge faced in this task.
The national level CGE models of developing countries will be used to analyze poverty and income distribution. The CGE model will be linked to FSSIM/type farm household models to analyze changes in agricultural production and sustainability indicators. Modifications will be needed to FSSIM models as used for Europe to address interactions between consumption, off-farm incomes and production decisions that result from market imperfections in developing countries. Adjusting the FSSIM framework for use in developing countries is the fourth modelling challenge faced in this task. This includes ‘tropicalizing’ the APES model so as to simulate the necessary production functions.
A successful modelling framework linking EU agricultural production to production in developing countries yields indicators to assess
• the competitiveness of EU agriculture (border prices versus domestic prices, trade flows, value-added agri-food and non/agricultural goods, regional changes in agricultural production)
• poverty (poverty headcount, employment and income distribution, caloric intake, rural/urban distribution of income and expenditures);
• environmental indicators (natural resource(soil)productivity, nutrient balances, toxicity index of herbicides and pesticides).
.
SEAMLESS No. 010036 Deliverable number: D3.8.1 09 November 2005
Page 7 of 34
Scientific and societal relevance
The subject of this paper is at the heart of ongoing scientific debates around the application of complex economic or econometric models to developing country situations. The developed SEAMLESS framework based on new key features will help both to improve the tools and their accuracy to assess the economic effects of the ongoing reforms of the EU and world trade policies upon LDCs.
Assessing the impact of EU’s agricultural policies on developing countries is furthermore at the heart of ongoing policy debates regarding ongoing WTO trade negotiations in the Doha Development round. Developing a flexible tool for analyzing the impact of EU policies not only contributes to the debates surrounding the trade negotiations. It may also be used to assess the impact of global agreements on a range of sustainability indictors in developing countries. Specifically, social sustainability (e.g. income distribution, poverty), ecological sustainability (e.g. nutrient balances, water quantity and quality) and economic sustainability (e.g. level of national income) will be addressed.
The new framework will bring a major improvement into the analysis of the impact of policies on the environment and natural resources at the farm level within developing countries. Developing countries’ agriculture faces tremendous sustainability challenges since many systems rely too little on external inputs. The sophisticated biophysical models linked to bioeconomic models at the farm level are able to draw realistic conclusions within the various scenarios that will be developed within the project.

SEAMLESS No. 010036 Deliverable number: D3.8.1 09 November 2005
Page 9 of 34
Specific part
1 Introduction
This particular deliverable addresses the specific LDCs features that should be addressed into global models such as GTAP and CAPRI as stressed in the DOW under Task 3.8. According to the DOW the two principal questions to be addressed by the task 3.8 are: (1) What are the impacts of EU agricultural polices on the sustainability of development in third countries, and especially in Least Developed Countries (LDCs) (2) What are the options for EU agricultural policies to be made compatible with other policies and agreements at the international level (e.g. WTO, CBD).
While the first question concerns indirect effects of domestic (EU) polices on other countries, the second question relates to policy coherence between agricultural policies, policies addressing development goals and trade policies.
Before defining the approach used in this workpackage, we first need to identify the reasons for analyzing the impact on third countries within SEAMLESS. There are two major reasons for assessing third country impacts of EU agricultural policies:
(i) EU agricultural policies may affect the international competitiveness of European agricultural producers, which through changes in international trade flows affects EU agricultural production;
(ii) EU agricultural policies, through international trade, affect livelihoods and natural resource use in developing countries, which may conflict with, or support EU’s development and environmental policies.
The first point addresses the impact of third countries on the EU farm sector, while the second point refers to the impact of EU policies on households in developing countries. Third countries affect the EU farm sector though international trade. Changes in trade policy, for example due to WTO agreements, may directly alter the access of third countries to the EU market where they compete with EU producers. Policies other than trade may also affect the international competitiveness of the EU farm sector. EU regulations concerning animal welfare, for example, could increase production costs in the EU. This may reduce the competitiveness of EU agriculture, resulting in larger imports and reduced EU production. With respect to the impact of third countries on the EU farm sector, the focus of attention will thus be on analyzing trade flows between the EU and the rest of the world.
A second reason for analysing international agricultural trade flows is the constraints resulting from international trade agreements on EU agricultural policies. Currently, a new round of trade negotiations is underway under auspices of the WTO. Whatever the final agreement will be and whenever the Doha Development Agenda will be concluded, it is very likely that this agreement will put further constraints on the EU’s ability to shield its agricultural markets from international competition. Modelling international trade flows provides information on the impact of reducing EU and third countries’ protection of domestic markets.
SEAMLESS No. 010036 Deliverable number: D3.8.1 09 November 2005
Page 10 of 34
The third reason for analyzing third country effects does not concern the EU farm sector. It focuses on the impact of EU agricultural policies on households in developing countries. EU agricultural policy affects livelihoods of households in developing countries. A clear example is the current discussion regarding the impact of export subsidies on developing countries. Apart from public discussions of the link between EU agricultural policy and developing countries, the EU also has its own interests in developing countries. These interests are expressed by its support of international declarations like the Millennium Development Goals and the Convention on Biological Diversity.
Task 3.8 addresses the international issues with a two-pronged strategy:
(1) Combined use of CAPRI (the chosen market level model within SEAMLESS, cfr. task T3.5) and GTAP model results, which partially report the same output variables but apply a different methodological approach, use different data and parameter sources and different level of regional disaggregation. These models have to be adjusted for key developing countries features and provide worldwide macro and sectoral effects of EU and global policy changes.
(2) While the joint CAPRI-GTAP modelling will provide useful insights at the macro-economic level and the global level, the picture has to be completed with country-specific analysis that is able to zoom in on country- and sector specific issues in selected LDCs. A macro-micro linkage will be used to assess the distributional impacts on poverty in some developing countries. The outcomes of the CAPRI-GTAP modelling provide the macro and sectoral effects and these will be linked with a micro-economic household model for some developing countries (see, Bourguignon et al. 2002). The micro models use a similar methodology as the bio-economic farm models (FSSIM, cfr. Task T3.3) and for the consistent aggregation and disaggregation between modelling at the farm and market level the methods developed in Task T3.6 will be used.
The focus of this report is on addressing developing country features within the SEAMLESS framework. Analyzing the links with agricultural competitors of the EU is closely related to analyzing the impact on developing countries. We therefore also devote some space to the way in which the competitiveness of EU agriculture will be addressed in WP 3.8.
We start by sketching the approach taken in WP 3.8 for modelling third country impacts of EU agricultural policies (Chapter 2). There we also describe the way in which the impact on non-developing countries will be modelled. Having outlined the general approach taken, we take a closer look at the way in which the links with developing countries will be modelled (Chapter 3). We identify features of developing countries that are important for analyzing sustainable development in developing countries but are lacking in the existing models. Based on this assessment we describe in more detail the modelling of the link between the EU and developing countries. We conclude by summarizing the steps to be taken in WP 3.8, the indicators that can be derived from the modelling work as well as the differences with the modelling work in the rest of the SEAMLESS project (Chapter 4).
SEAMLESS No. 010036 Deliverable number: D3.8.1 09 November 2005
Page 11 of 34
2 Modelling third country impacts
As outlined above there are two major reasons for modelling third country impacts within SEAMLESS: (i) competitiveness of EU farmers and (ii) livelihoods and resource use in developing countries. To assess the competitiveness of European farmers we need to account for EU’s major trading partners that are able to significantly affect EU agricultural production. To address the impact of EU’s agricultural policy on livelihoods in developing countries we need to include (representative) countries in the analysis. Based on these arguments three different types of countries can be distinguished:
1) High-income countries, focusing on the major trading partner of the EU;
2) Large developing countries where both trade flows with the EU and livelihoods and natural resource use play a role;
3) Small developing countries where only issues of livelihoods and natural resource use play a role.
For each of these countries different types of analyses will be needed.
2.1 Outline of approaches
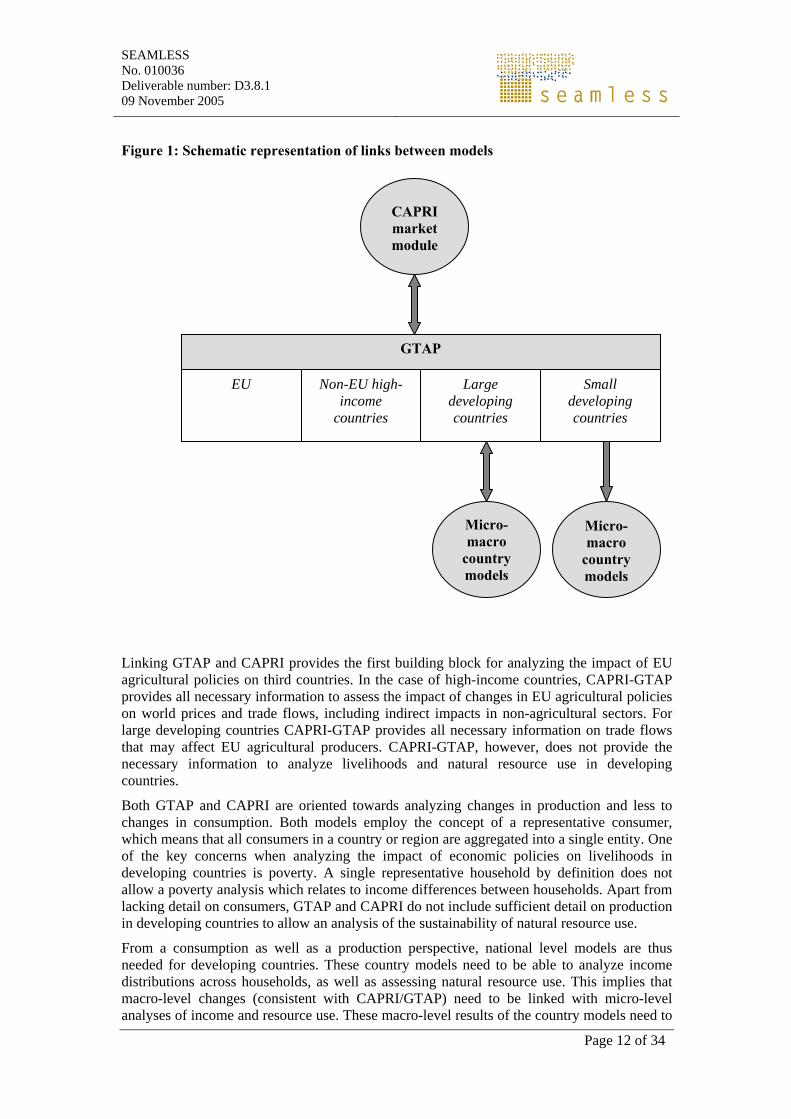
International trade plays a key role in transmitting the effects of EU’s agricultural policy on third countries. Within SEAMLESS the CAPRI (Common Agricultural Policy Regional Impact Analysis) model has been chosen to integrate different model components for an economic analysis at the EU market scale. For the analysis of international trade, GTAP (Global Trade Analysis Project) has been chosen. Analysis of the interactions between EU agricultural policy and international trade thus requires linking of CAPRI and GTAP (Figure 1).
CAPRI plays a central role in SEAMLESS to scale analyses at plot and household level to a regional level within Europe and determining agricultural prices by accounting for international trade in agricultural products. CAPRI is a partial equilibrium model focussing on the agricultural sector. Its key selling point is its capability to analyze the impact of (complex) agricultural EU policies for different regions.
GTAP is a general equilibrium model developed to analyze international trade. Its key selling point is the coverage of all trade for all countries. The model includes production, consumption and trade in agricultural production, manufacturing, services and factors (land, labor and capital).
CAPRI and GTAP are chosen within SEAMLESS because of their complementary strong points. By combining these two models we can model in detail the impact of EU agricultural policies on European regions (CAPRI) and on the rest of the world while accounting for feedbacks between agricultural, non-agricultural sectors and factor markets (GTAP). Linking GTAP and CAPRI requires a mapping of regions and sectors as well as a mechanism for ensuring consistency between the results of the two models. This is denoted by the two-sided arrow in Figure 1.
SEAMLESS No. 010036 Deliverable number: D3.8.1 09 November 2005
Page 12 of 34
Figure 1: Schematic representation of links between models
Linking GTAP and CAPRI provides the first building block for analyzing the impact of EU agricultural policies on third countries. In the case of high-income countries, CAPRI-GTAP provides all necessary information to assess the impact of changes in EU agricultural policies on world prices and trade flows, including indirect impacts in non-agricultural sectors. For large developing countries CAPRI-GTAP provides all necessary information on trade flows that may affect EU agricultural producers. CAPRI-GTAP, however, does not provide the necessary information to analyze livelihoods and natural resource use in developing countries.
Both GTAP and CAPRI are oriented towards analyzing changes in production and less to changes in consumption. Both models employ the concept of a representative consumer, which means that all consumers in a country or region are aggregated into a single entity. One of the key concerns when analyzing the impact of economic policies on livelihoods in developing countries is poverty. A single representative household by definition does not allow a poverty analysis which relates to income differences between households. Apart from lacking detail on consumers, GTAP and CAPRI do not include sufficient detail on production in developing countries to allow an analysis of the sustainability of natural resource use.
From a consumption as well as a production perspective, national level models are thus needed for developing countries. These country models need to be able to analyze income distributions across households, as well as assessing natural resource use. This implies that macro-level changes (consistent with CAPRI/GTAP) need to be linked with micro-level analyses of income and resource use. These macro-level results of the country models need to
CAPRI market module
GTAP
EU
Micro-macro
country models
Non-EU high-income
countries
Large developing countries
Small developing countries
Micro-macro
country models
SEAMLESS No. 010036 Deliverable number: D3.8.1 09 November 2005
Page 13 of 34
be consistent with CAPRI-GTAP (see figure 1) in order to allow a consistent analysis of EU agricultural policies. Changes in small developing countries will not affect EU agricultural producers, thus in principle there could be a one-way link between GTAP and models for small developing countries. In the case of large developing countries this does not hold and a two-way link is needed.
CAPRI is used within SEAMLESS to link changes at the farm level from the FSSIM models to macro-level changes within the EU. At first sight this suggests a similar approach for developing countries, developing a CAPRI model for developing countries and linking this to FSSIM models for developing countries. In case of the EU such an approach can be followed because of limited size of the agricultural sector compared to other economic sectors. This limited size implies that we can ignore the interactions between the agricultural sector and the rest of the economy. If for example the demand for agricultural labour increases, the relative small size of the agricultural labour force assures that there will be no change in the wages. In developing countries, however, we cannot ignore the interactions with other economic sectors. One of the distinguishing features of developing countries is the large size of the agricultural sector, in terms of employment and generation of income. This implies that changes in the agricultural sector will affect all other sectors of the economy and need to be accounted for.
The importance of the agricultural sector in developing countries implies that we need to develop national level general equilibrium models (country models in Figure 1) to link changes at (farm) household level to changes at the national and international level. These general equilibrium models thus play a comparable role as CAPRI plays for analyzing the changes in the EU. Apart from the size of the agricultural sector, other features of developing countries also give rise to developing a general equilibrium model, as will be discussed in more detail in chapter 3.
Summarizing, the modelling work in this workpackage consists of two major elements:
1) linking CAPRI and GTAP,
2) developing micro-macro country models for developing countries that are consistent with CAPRI-GTAP.
Both of these steps involve a number of challenges. In the remainder of this chapter we will identify the major challenges we face in linking CAPRI and GTAP and provide some more detail on the analysis of the competitiveness of EU agricultural production. In the next chapter we will take a closer look at the key features of developing countries and their implications for developing the micro-macro country models.
2.2 Linking CAPRI and GTAP
Above we already shortly identified some differences between CAPRI and GTAP. In this section we will take a closer look at both models and at the challenges faced when linking them.
2.2.1 CAPRI
CAPRI has been developed to analyze the impact of agricultural policies on different regions in the EU. Next to a supply module which determines agricultural production in 200 different regions of the EU it includes a market module which determines the prices of agricultural commodities, accounting for international trade.
SEAMLESS No. 010036 Deliverable number: D3.8.1 09 November 2005
Page 14 of 34
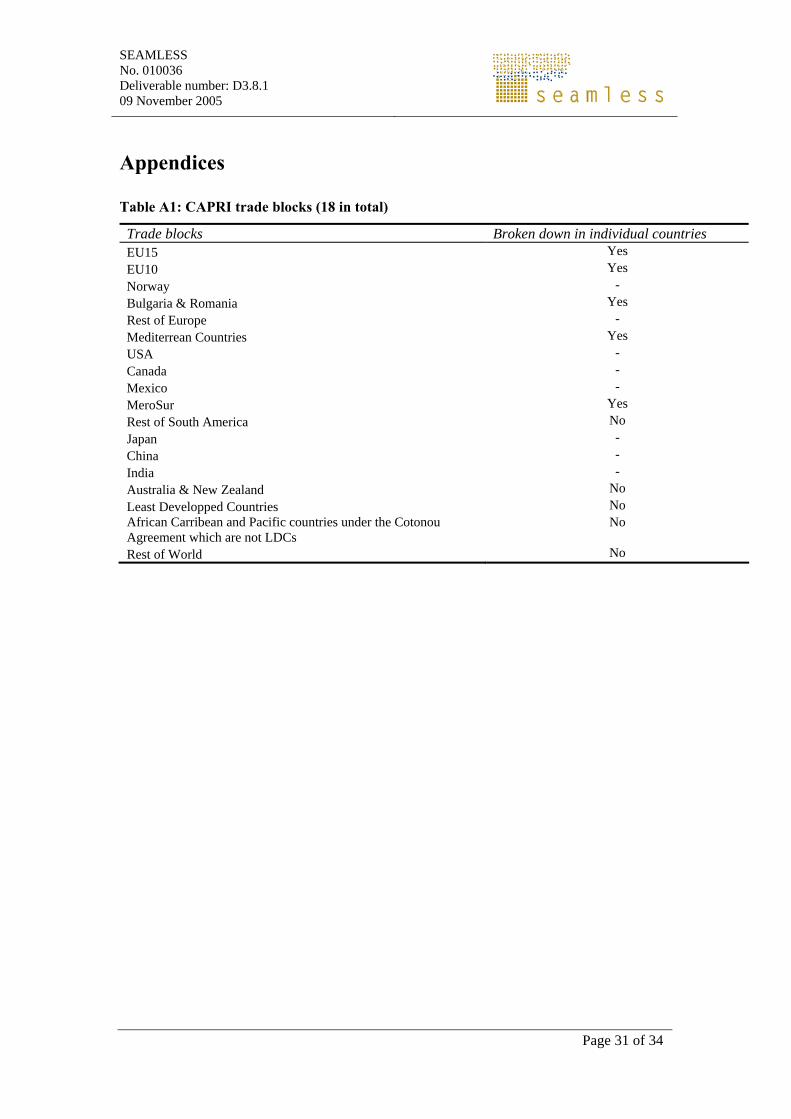
The market module of CAPRI consists of a global spatial multi-commodity model, distinguishing 18 trade blocks (see table A1 in the appendix). Of these trade blocks the EU15, EU10, Bulgaria & Romania, MercoSur and Mediterranean trade blocks are broken down to individual countries.
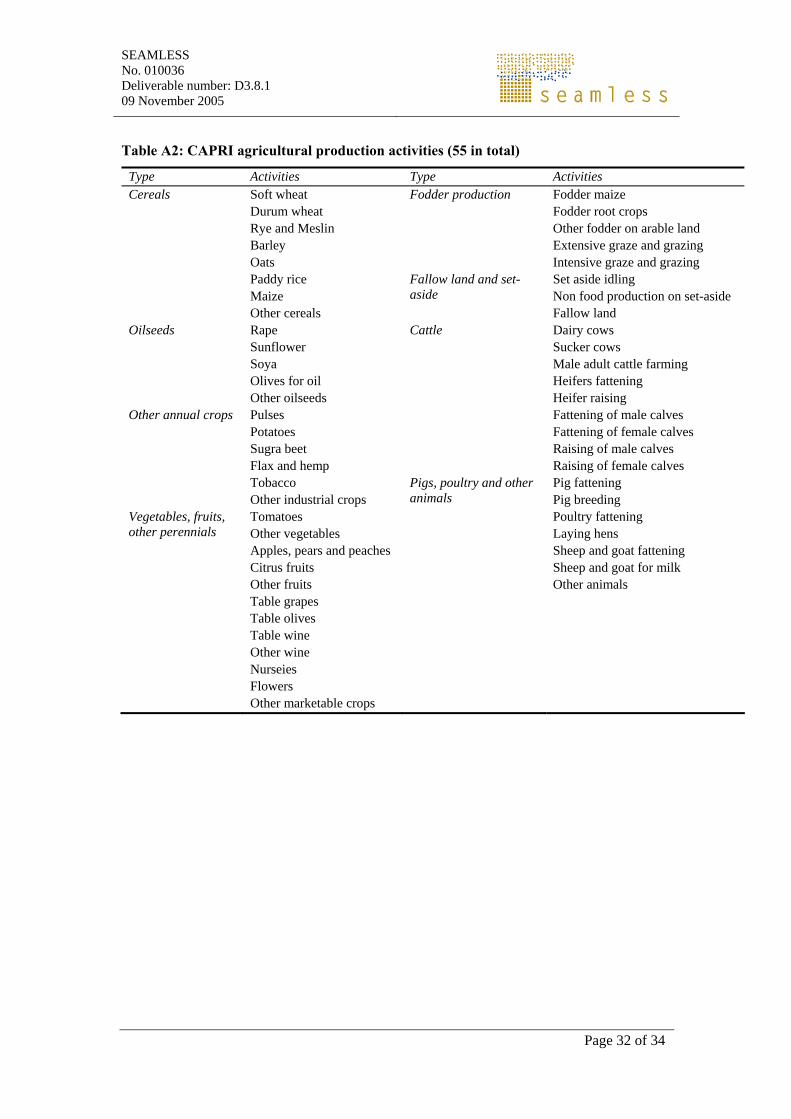
The market module includes detailed treatment of agricultural policies affecting international trade (tariff rate quotas, export subsidies and market interventions). The detailed modelling of the agricultural sector (distinguishing 55 agricultural activities, see table A2 in the appendix) furthermore allows a detailed treatment of EU policies like for example set-aside payments. These policies may indirectly affect international trade by changing European agricultural supply or production costs.
CAPRI is thus well placed and has been frequently used to analyze in detail changes in European agricultural production. A limitation of CAPRI is it being a partial equilibrium model that does not account for non-agricultural sectors nor for factor markets. This implies that feedbacks between different sectors, through production or consumption, cannot be captured with CAPRI. With rising incomes, for example, consumers tend to shift from food to manufactured products causing lower agricultural prices.
2.2.2 GTAP
GTAP has been developed to analyze international trade. The model covers all trade in agriculture, manufactured goods, services and capital. This global coverage is related to GTAP being a general equilibrium model. In contrast to partial equilibrium models, like CAPRI, general equilibrium models cover all production and consumption in an economy.
In the case of the most recent GTAP version 6 this implies that for 87 regions (see table A3 in the appendix) the production is modelled for 57 sectors (see table A4 in the appendix). Of these 57 sectors 12 are agricultural sectors like for example paddy rice or wheat production. In addition there are 8 food-processing industries. The remainder are resource extraction activities (like fishing or oil mining), manufacturing and services. GTAP thus has an economy-wide coverage which comes at the expense of detail in the agricultural sector. In addition to production in each of the 87 regions, GTAP includes household and government consumption in each region. Regional supply and demand then determine international trade flows1. These trade flows take into account tariffs and other barriers to trade.
2.2.3 Exploiting the complementarities between CAPRI and GTAP
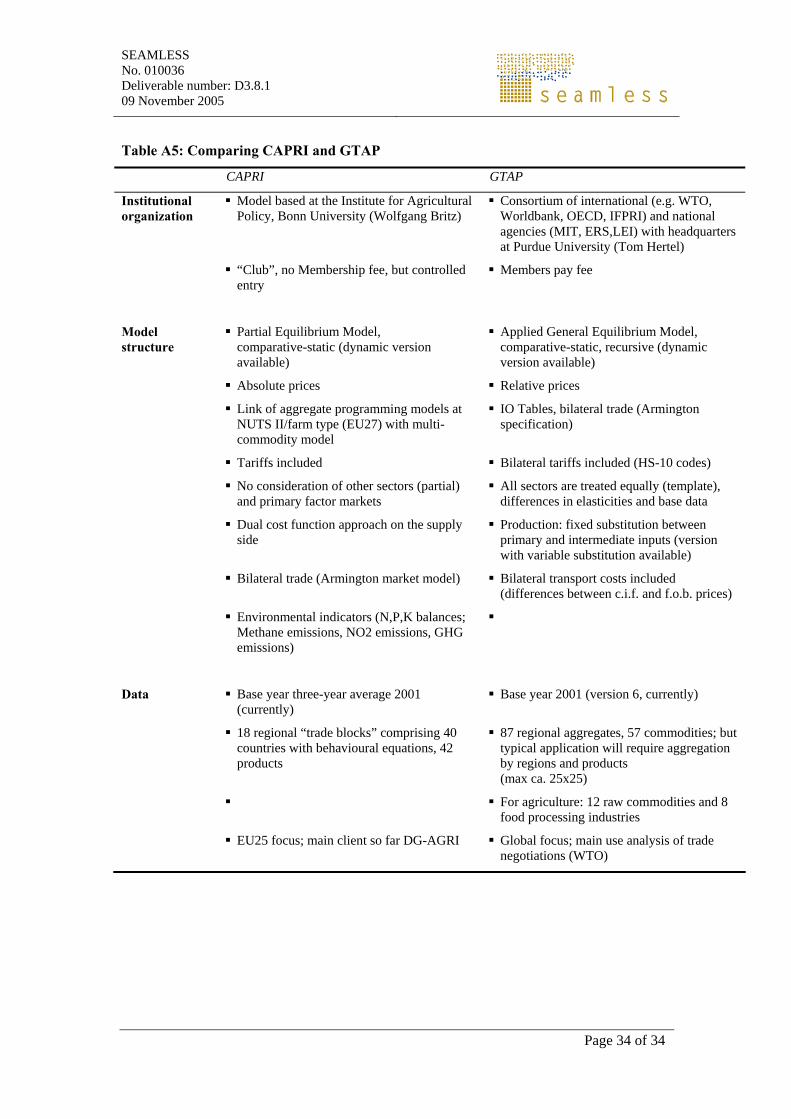
CAPRI and GTAP are two different types of models with different regional as well as sectoral coverage (table A5 in the appendix provides a technical comparison of the models). The strong point of CAPRI is the detailed modelling of the European agricultural sector. The strong point of GTAP is its economy-wide coverage, accounting for all sectors and all countries. The objective of linking CAPRI and GTAP is therefore to arrive at a model structure which improves
1. the extent to which CAPRI accounts for feedback with other sectors and countries,
1 Because of computation limitations actually implemented models cannot include all 87 regions and 57 sectors. Experience learns that 25 regions by 25 products is about the maximum size of a feasible model.
SEAMLESS No. 010036 Deliverable number: D3.8.1 09 November 2005
Page 15 of 34
2. the extent to which GTAP accounts for EU agricultural policy and production.
Such a linking would improve the performance of both models, contributing to the analysis of the impact of EU agricultural policies on the international competitiveness of European agriculture, international trade and production in the rest of the world.
The way in which the two models will be linked is the first major challenge faced in this workpackage, and needs to be elaborated further. Apart from a mapping of sectors and regions between the two models, we need to arrive at a consistency between the assumptions of CAPRI and GTAP.
2.3 Analyzing the competitiveness of European agriculture
Linking of CAPRI and GTAP provides the modelling tools needed to analyze the first of the third country effects identified in the introduction, the international competitiveness of European agriculture.
The term ‘competitiveness’ encompasses a broad array of economic indicators, including cost differentials between countries, but also things like investment climate, state of education and human capital, exchange rate volatility and much more. In the context of the SEAMLESS project, a more narrowly defined concept of competitiveness will be applied, that relates to cost-price differences of EU agriculture vis a vis its international competitors (international competitiveness) and to differences between regions within the EU (intra-EU competitiveness).
Both CAPRI and GTAP have many times been applied to this area in the past. Specifically, competitiveness of the EU agricultural sector has been analyzed in the context of WTO trade liberalisation and in the context of CAP reforms. For example, how does a multilateral lowering of tariffs impact on the prices on EU markets relative to prices of other suppliers. Hence how will imports in to the EU change, how will the domestic markets be influenced by additional and cheaper imports and how will these affect EU farmers? (see for example, van Meijl and van Tongeren, 2002 and van Tongeren, 2005).
GTAP allows the study of sectoral competitiveness in two dimensions: First, the competitiveness of the EU sector relative to a great number of international players on the world markets. Second, competitiveness of the agricultural sector in the EU relative to other economic activities. This is a very important component, because it will determine the long term economic viability of the sector in the Union.
CAPRI on the other hand, is able to zoom in along two other dimensions of competitiveness: First, the regional dimension within the Union: how is the competitiveness of the agricultural sector in a given NUTS-II region developing relative to other regions, in the face of certain policy changes? (intra-EU competitiveness of regions) Second, how are policies that address sustainability affecting international and intra-EU competitiveness of the agricultural sector. Specifically, policy measures directed at the environment (e.g. water and nitrate directives) and animal welfare will have an impact on the economic side, through changes in cost structure, and on the environmental and animal welfare side.
CAPRI in connection with FSSIM allows for explicit modelling of these policies and their effect, and some of the results can then subsequently be used in GTAP as exogenous cost shifters, which then in turn form the basis for analysis of international competitiveness of EU agriculture. Such an approach has fruitfully been exploited, but on a more limited level of ambition and with a different suit of models, in Kuhlman et al (2005).
SEAMLESS No. 010036 Deliverable number: D3.8.1 09 November 2005
Page 16 of 34
SEAMLESS No. 010036 Deliverable number: D3.8.1 09 November 2005
Page 17 of 34
3 Developing country features
Whereas the relations with non-EU high-income countries can be dealt with satisfactory by linking CAPRI and GTAP, accounting for the impact of EU policies on developing countries poses more of a challenge. Both CAPRI and GTAP have been developed with the economic structure of high-income countries in mind. The economic structures of developing countries differs in a number of ways which may affect the analysis. In this chapter we therefore discuss specific features of developing countries, identify those that are most likely to affect the analyses foreseen in SEAMLESS and that can be incorporated in the SEAMLESS modelling framework.
To start it is important to recall that developing countries are extremely diverse. Asian economies are quite different from African economies and both are again very different from Latin American economies. Within these large entities there are fundamental differences between small and large countries, between open and closed countries, between resource rich countries and others. In this paper we will not propose a typology of existing economies and we will keep our comments at a broader level of generalities. The aim of SEAMLESS is to develop a flexible and general modelling framework, not to develop very specific models for particular locations.
The list of possible specific features of LDCs that are not yet properly modelled and included in global economic models is still very long despite years of research and theoretical improvements by the various schools of economics: alternative choices of disaggregation of production and consumption; structural features such as the labour market, degree of development of the financial system, behavioural functions, liquidity constraints on aggregate consumption, credit and foreign exchange rationing, debt overhang and its effects on production and private investment uncertainty and irreversibility effects on investment decisions; effects of financial repression, currency substitution, and informal financial markets on money demand.
Our discussion of specific developing country features is pragmatic. We do not attempt to provide a complete overview of specific developing country features, but instead limit ourselves to discussing features that are most relevant for and can be tackled within the SEAMLESS modelling work. These issues can be grouped under three headings: agriculture, market imperfections, rural/urban divide.
3.1 Agriculture
A first key distinguishing feature of developing countries is the importance of agriculture. This importance is manifold. Agriculture provides the main source of income for a large part of the population, provides the main source of employment, a safety net and export earnings. The agricultural sector is represented in more and less detail in both CAPRI and GTAP. The focus here is thus not so much on modelling agricultural production, but on how the role of agriculture differs in developing countries and the implications for the modelling work within SEAMLESS.
3.1.1 Tropical agriculture
Most developing countries are located in the tropics. Developing countries are therefore often referred as the South, as being opposed to high income countries in the North. This location has implications for the type of agricultural crops produced and the sustainability issues that are of relevance.
SEAMLESS No. 010036 Deliverable number: D3.8.1 09 November 2005
Page 18 of 34
Both CAPRI and GTAP have been developed with Northern countries in mind. This is reflected by the mostly temperate crops that are distinguished in these models, while other crops that are of high importance in developing countries (like for example sorghum, millet, roots and tubers) are lumped under the heading of other crops. In order to capture changes in agriculture in developing countries we thus need to account for tropical crops.
Apart from the type of crops, natural resource conditions may also be more limiting in developing countries. Tropical climates tend to be less reliable, exacerbating the uncertainty that surrounds agricultural production. In Asia a widespread reliance on irrigation mitigates the impact of climate variability, while in Africa agriculture is mostly rainfed. Similar to issues of water, soil fertility also plays a major role in developing countries. This is partly due to less fertile soils and partly due to lack of opportunities to use fertilizers to compensate limited soil fertility. Again this is more of an issue in Africa, where limited use of fertilizer leads to soil nutrient depletion and expansion into marginal areas, threatening future production. In contrast some areas in Asia are experiencing the negative effects of excessive use of fertilizers and especially herbicides and pesticides.
3.1.2 Large agricultural sector
A key distinguishing feature of developing countries is the importance of agricultural relative to other sectors in the economy. This importance is reflected in different ways:
- Income. Agriculture provides the main source of income for the majority of the population, as well as a social safety net in case of crises. During the financial crisis in Indonesia, for example, people returned to agriculture after losing their jobs in the city. Agriculture in many cases provides a direct contribution to households’ income through home consumption of agricultural output.
- Employment. Coupled with the importance in terms of income, agriculture also provides the main employment. Seasonality of agricultural production implies that employment also becomes seasonal, resulting in issues of underemployment or hidden unemployment.
- Export earnings. Agricultural products often provide the main source of export earnings for developing countries. In most cases they export raw materials as opposed to higher valued processed goods, although this is rapidly changing in recent years.
3.2 Market imperfections
A second key characteristic of developing countries is the omnipresence of market imperfections. Market imperfections are defined by economists as markets that do not function as in a hypothetical world of perfect competition. Although no real world market ever functions is in models of perfect competition, markets in high income countries generally function relatively smooth. In contrast markets in developing countries tend to deviate much from the ideal of perfect markets or are even completely absent. In developing countries the limited functioning or absence of markets has strong implications for the decisions of (rural) households.

SEAMLESS No. 010036 Deliverable number: D3.8.1 09 November 2005
Page 19 of 34
3.2.1 Imperfect input and output markets
As noted above limited soil fertility is important in the African context, partly because of lack of access to fertilizer. This limited access is due to lack of purchasing power by poor households but in a large part also due to the unavailability of fertilizers. Lack of infrastructure (roads, electricity, communication services) hampers the function of markets in developing countries. Low quality or absence of roads increases the costs of transport which may make inputs too costly to purchase and outputs too costly to sell in markets.
As a result rural households in developing countries are often faced with limited opportunities to use external inputs, affecting for example the extent to which they can benefit from new technologies. High transport costs to markets also limit the opportunities to engage in cash crop production. As a result many rural households in developing countries are engaged in subsistence production for own consumption.
3.2.2 Imperfect labour markets
Where imperfect input and output markets limited the opportunities in agriculture, imperfect labour markets limited the opportunities for earning non-farm income. Labour markets in developing countries are characterized by limited amount of formal employment. This formal employment is generally in a bloated public sector. Most jobs are in the informal sector which is insecure and access is not only depending on skill but also to a large extent on social networks which may depend on tribe or caste. Despite the difficulties surrounding nonfarm employment it plays an important role. This even holds for areas commonly though of as subsistence oriented, like Sub-Sahara Africa. In a rare worldwide comparison of the importance of nonfarm income in developing countries Africa was found to rank first with 42 percent of total rural income, followed by Latin America (40 percent) and Asia (32 percent) (Reardon, Moulis et al. 1998).
3.2.3 Imperfect credit markets
Similar to labour markets financial markets or institutions are generally lacking in developing countries. Apart from macro level implications, like a strong dependence on tariffs to finance government expenditures, imperfect or absent financial institutions directly affect rural households’ decisions. Unavailability of credit implies that households need to finance their expenditures from their own means. The seasonality of agricultural production implies that income is earned after harvesting while inputs need to be bought at the start of the production season. In the absence of banks or similar institutions households need to finance inputs from last seasons’ production or through off-farm employment. Limited financing options result in limited use of external inputs and in interdependencies between different household activities (like for example agriculture and off-farm employment).
3.2.4 Strong government involvement
An important source of market imperfections in developing countries is a strong government involvement in production. This can take several forms:
- Selling inputs or purchasing output. For a multitude of reasons (to assure export earnings, cheap food for urban consumers, stable farmers incomes) governments in developing countries actively participate in output markets or even completely overtake the purchasing of output or the provision of inputs. In some cases the control of output proceeds to stipulating the crops that need to be produced. In the case of manufacturing industries may be completely government controlled.
SEAMLESS No. 010036 Deliverable number: D3.8.1 09 November 2005
Page 20 of 34
- Regulating land markets. With a strong dependence on agriculture regulating access to land appears to become an important policy instrument tool to regulate income earning opportunities. As a result there are many instances in which there are extensive regulations regarding the transfer of land, being it permanent through sales or temporary through rental agreements. The result are complex land markets which are far from the ideal of perfect markets.
3.3 Rural/urban divide
A third key characteristics of developing countries is the rural-urban divide. Compared to high income countries income differences between rural and urban areas are large. Well paid (formal) employment tends to concentrate in the urban areas while the poor tend to be located in the rural areas. Analyzing the income and agricultural practices of rural households will thus be an important part of the analysis. Given the reliance on agriculture we need to address the sustainability of agricultural practices which will affect future possibilities for obtaining agricultural income. Despite the importance of agriculture and a concentration of the poor in rural areas, we need to look beyond agriculture in the analysis for SEAMLESS for two main reasons: off-farm income of rural households and subsidization of urban consumers.
3.3.1 Off-farm income of rural households
As has been referred to above even in substance oriented regions off-farm activities provide an important part of rural household income. This implies that changes in non-agricultural sectors of the economy may affect employment and/or earnings of rural households. Apart from the analysis of poverty, imperfections in the credit markets imply that it may also directly affect agricultural incomes. An increase in off-farm income, for example, may allow a household to purchase external inputs.
3.3.2 Subsidization of urban consumers
EU (and US) agricultural policies are generally considered to reduce world market prices for major agricultural commodities. In case of net-importing developing countries this implies a subsidy for consumers, while agricultural producers may be harmed. In order to assess the impact of EU agricultural policies on poverty in developing countries one needs to take into account both agricultural producers and (urban) consumers.
SEAMLESS No. 010036 Deliverable number: D3.8.1 09 November 2005
Page 21 of 34
4 Modelling developing country impacts
The previous chapters have sketched the modelling approach that will be employed in WP 3.8 and specific developing country features that important for the modelling work in SEAMLESS. In this chapter we will outline the implications of these features for the modelling work at different levels of analyses. We furthermore outline differences and similarities with the modelling work for Europe within SEAMLESS.
4.1 Developing country features in GTAP
Figure 1 outlines the way in which European agriculture modelled through CAPRI will be linked to analyses of developing country. Countries influence each other through trade, and therefore GTAP forms the middle layer in Figure 1, connecting agricultural production in Europe to international trade, including those with developing countries.
Given this central role of GTAP in linking countries, changes in model structure to account for developing country features are also mainly foreseen for GTAP. Depending on the manner in which CAPRI and GTAP are linked (which is determined at a later stage) changes may also be required in CAPRI in order to maintain consistency with an adjusted GTAP. If required, these changes will consist of a subset of the changes foreseen for GTAP.
The changes foreseen for GTAP do not affect the modelling of international trade, which is modelled as a change in prices (accounting for tariffs and other barriers to trade) such that global demand is in balance with global supply. Changes need to be made to the modelling of developing economies. To account for their specific features we need to adjust the modelling of production and consumption in developing countries. These will then affect other countries by changes in demand for imported goods and changes in the supply of exported goods. Changes to GTAP are foreseen in three areas: tropical crops, supply response and labour markets.
4.1.1 Accounting for trade in tropical crops
GTAP has a clear focus on the main crops produced in temperate regions. Given the importance of other cereals (like sorghum and millet) and roots and tubers these may need to be accounted for. The need to separately distinguish tropical crops (now included under the heading of not further specified crops) depends on the amount of trade occurring in these crops. If there is only very limited international trade in these tropical crops they can be dealt with in the national models, only appearing in an aggregated way in GTAP.
4.1.2 Weaker supply response due to market imperfections
Because of market imperfections households in developing countries are less integrated in markets for inputs and outputs compared to high income countries. GTAP uses similar supply responses, i.e. reactions of production to changes in prices, for all countries. To account for the market imperfections in developing countries we thus need to reduce their supply response. This reduced supply response also accounts for imperfect labour, land and credit markets which hamper rural households in exploiting new income opportunities. It furthermore captures the home-consumption of rural households.
SEAMLESS No. 010036 Deliverable number: D3.8.1 09 November 2005
Page 22 of 34
4.1.3 Imperfect labour markets
The standard GTAP model assumes that labour markets function perfectly. In other words, there is assumed to be full employment achieved through wage adjustments such that the demand for labour matches its supply. To account for market imperfections in developing countries two major adjustments can be made:
- Unemployment. Instead of having full employment we can introduce a fixed wage, say the wage in the formal (government) sector, which will result in part of the population to be unemployed.
- Rura/urban divide. To account for the wage differences between rural and urban areas and the imperfect domestic labour markets we will distinguish rural and urban labour markets. Labourers cannot freely move between rural to the urban labour markets to reflect the rural/urban divide.
Including the informal non/agricultural sector is hampered by lack of data (recall that GTAP is a global model and data therefore need to be obtained for al countries in the world). We therefore do not foresee an inclusion of this sector in GTAP.
4.2 National models for developing countries
As discussed in chapter 2 when presenting the proposed modelling framework national models need to be developed for developing countries. These national models serve the same purpose as CAPRI does for Europe, translating national level changes in prices that account for international trade to the farm household level. In the case of developing countries we cannot use a version of CAPRI for developing countries since the importance of agriculture prohibits the use of a partial equilibrium model. We will therefore develop a national general equilibrium model for developing countries.
This national level general equilibrium model serves two purposes. First of all to translate the impact of changes in international trade to national prices, accounting for interactions between agricultural and non-agricultural sectors. These prices can then serve as input for FSSIM models to assess agricultural practices, including sustainability impacts (see below). The second purpose is to analyze poverty, accounting for both urban and rural households. This requires a model with different types of households, as opposed to the single representative consumer used in GTAP.
Developing such a model needs to build on a recent development in general equilibrium modelling to account for the diversity across households. Cognea and Robilliard (2000) for example include the behaviour of 4,508 households in Madagascar in a general equilibrium model, allowing a detailed analysis of changes in income distribution.
Apart from including various types of households or even whole survey samples, the national model needs to account for the impact of market imperfections on household behaviour. Imperfect markets can lead to interdependencies between production and consumption decisions of households. If households consume their own production, production decisions will not only be affected by profit maximization based on prices of inputs and outputs (the way which production decisions are modelled in CAPRI and GTAP). In addition to prices households will also consider their own consumption demands and as a result cultivate crops that may be unattractive from a profit maximization point of view. Such interdependencies are referred to as nonseparability by economists and can be accounted for in a general
SEAMLESS No. 010036 Deliverable number: D3.8.1 09 November 2005
Page 23 of 34
equilibrium model (for an example of a village level general equilibrium model with nonseparable households see Kuiper, 2005).
4.3 Farm household model for developing countries
A bio-economic household (farm) model of the FSSIM type (Tasks T3.3 and 3.4) will be used to analyze agricultural production in developing countries. As FSSIM uses production functions where quantities are explicit, it is able to produce quantitative environmental indicators. For the production side, the methodology will be similar to the one proposed by SEAMLESS for Europe as described in the task 3.3 and the PD3.3.2.1. This implies that for case study countries ecological regions need to identified to capture differences in production potential. Different household types need to be identified to capture differences in household endowments like land quality, labour endowment (amount and education), livestock, machinery and access to off-farm employment opportunities.
The FSSIM models for developing countries need to reflect circumstances that are relevant in developing countries:
- Nonseparability of production and consumption. Market imperfections may cause consumption decisions to affect production decisions. The household models for developing countries thus need to model consumption and production decisions and their interdependencies.
- Common and open access land. For many African countries land is not allocated individually and is not yet considered a strong limiting factor. This needs to be accounted for in the modelling.
- Transhumant animal production. In many African or central Asian countries, animal production is of the transhumant type. Farm typified in these groups have strong specific features that need to be incorporated in the model. The existing literature relative to this subject is relatively poor but the challenge is important especially in Africa where crop-livestock integration is playing an increasing role in solving the soil fertility degradation.
- Sustainability indicators. For each case study country an assessment needs to be made regarding the sustainability indictors. These indicators may differ from those used in the European analysis. In Africa soil nutrient depletion is a crucial issue, requiring an insight in nutrient balances. In Asia excessive fertilizer and pesticide use are an issue in some areas, requiring a measure of the soil structure and toxicity of pesticides used.
In addition to household economic models the SEAMLESS framework includes the use of a biophysical model (APES,Task 3.2) to estimate the plant production functions under different cropping patterns. This activity is planned for Mali where several CIRAD and IER plant growth modellers are working on adapting APES to tropical conditions. The derived production functions will help exploring the impact of different levels of intensification on yield and the environment (erosion, carbon emission, salinisation, nutrient leaching, pesticides toxicity…).
SEAMLESS No. 010036 Deliverable number: D3.8.1 09 November 2005
Page 24 of 34
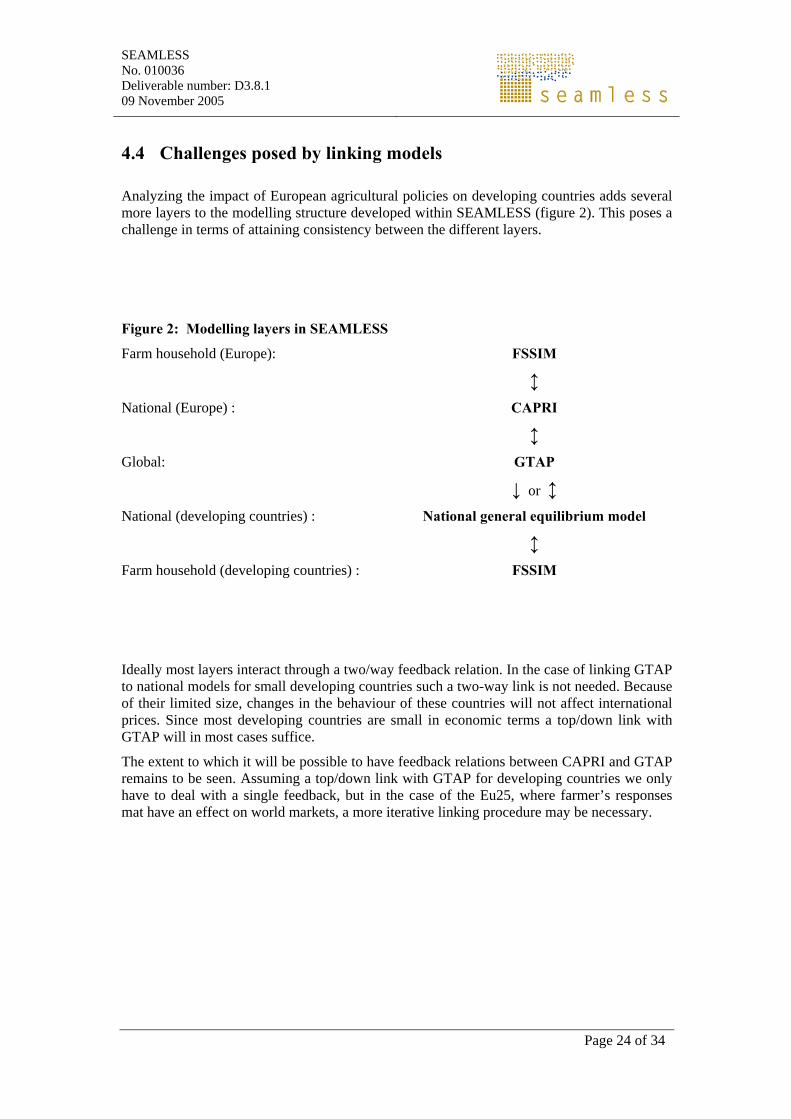
4.4 Challenges posed by linking models
Analyzing the impact of European agricultural policies on developing countries adds several more layers to the modelling structure developed within SEAMLESS (figure 2). This poses a challenge in terms of attaining consistency between the different layers.
Figure 2: Modelling layers in SEAMLESS
Farm household (Europe): FSSIM
↕ National (Europe) : CAPRI
↕
Global: GTAP
↓ or ↕
National (developing countries) : National general equilibrium model
↕
Farm household (developing countries) : FSSIM
Ideally most layers interact through a two/way feedback relation. In the case of linking GTAP to national models for small developing countries such a two-way link is not needed. Because of their limited size, changes in the behaviour of these countries will not affect international prices. Since most developing countries are small in economic terms a top/down link with GTAP will in most cases suffice.
The extent to which it will be possible to have feedback relations between CAPRI and GTAP remains to be seen. Assuming a top/down link with GTAP for developing countries we only have to deal with a single feedback, but in the case of the Eu25, where farmer’s responses mat have an effect on world markets, a more iterative linking procedure may be necessary.
SEAMLESS No. 010036 Deliverable number: D3.8.1 09 November 2005
Page 25 of 34
5 Conclusions
Task 3.8 of SEAMLESS aims at analyzing third county impacts of EU agricultural policies. This analysis is motivated by two different interests. First, the international competitiveness of European agriculture with changes in EU agricultural policy and with changes due to multilateral agreements following for example from the ongoing trade negations. Linking CAPRI (capable of detailed analyses of EU agriculture), with GTAP (capable of analyzing international trade agricultural and non-agricultural sectors) provides a bridge between EU effects and broad groups of third countries. There remain clear issues to be resolved with linking CAPRI and GTAP, which are different types of models with a different focus. Their clear complementarities make such a linking a fruitful endeavour. Assessment of EU competitiveness is relatively straightforward with a linked CAPRI-GTAP framework.
A second interest in third countries is not some in EU´s main agricultural competitors, but in livelihoods and natural resource use in developing countries. The importance of agriculture for livelihoods in developing countries makes the analyses as pursued in SEAMLESS highly relevant. The importance of agriculture also poses a methodological challenge. A partial analysis of only the agricultural sector, as is done for Europe by CAPRI, is not justified in the case of developing countries. The importance of agriculture in terms of income and employment implies that changes in agriculture will affect all other sectors of the economy. Furthermore, the use of a single representative household in CAPRI and GTAP does not allow an analysis of poverty, a key concern in developing countries. We therefore intend to design a model template that takes into account central developing country features. This will be a national CGE model, linked to biophysical modelling (FSSIM style) and household level analysis for poverty and income distribution analysis.
Development of a modelling framework that links CAPRI and GTAP and includes national level models for developing countries is expected to yield the following set of model outputs:
- Indicators on competitiveness of EU agriculture (CAPRI-GTAP)
o Border prices versus domestic prices
o Trade flows
o Value-added agri-food and non/agricultural goods
o Regional changes in agricultural production
- Indicators on poverty (from the national CGE models of developing countries)
o Poverty headcount
o Employment and income distribution
o Caloric intake
o Rural/urban distribution of income and expenditures
- Environmental indicators (from FSSIM models for developing countries)
o Natural resource(soil)productivity
o Nutrient balances
o Toxicity index of herbicides and pesticides
-

SEAMLESS No. 010036 Deliverable number: D3.8.1 09 November 2005
Page 27 of 34
References
Cogneau D and A. Robilliard (2000). Growth, Distribution and Poverty in Madagascar: Learning from a Microsimulation Model in a General Equilibrium Framework. TMD Discussion Paper 61. IFPRI, Washngton D.C.
Kuhlman, T, F. van Tongeren, J. Helming, A. Tabeau,, D. Verhoog, R. Groenevoeld, A. Gaaff, B. Koole, J. Dekkers (2005). Future land-use change in the Netherlands: an analysis through a chain of models, forthcoming in : Agrarwirtschaft.
Kuiper, M. (2005). Village Modeling: A Chinese Recipe for Blending General Equilibrium and Household Modeling. PhD Thesis, Wageningen University.
van Meijl, Hans and Frank van Tongeren (2002), The Agenda 2000 CAP reform, world prices and URAA GATT-WTO export constraints, European Review of Agricultural Economics, Vol. 29 (4) (2002) pp. 445-470.
Reardon, T., K. Moulis, et al. (1998). Rural non-farm income in developing countries. In: The state of food and agriculture, 1998. FAO. Rome.
van Tongeren, Frank (2005), Brazil and China: the real winners of the Doha round?, Entwicklung und Ländlicher Raum (Agriculture and development), Vol. 39, no. 5, pp 12-14.

SEAMLESS No. 010036 Deliverable number: D3.8.1 09 November 2005
Page 29 of 34
Glossary
General equilibrium model A model covering all economic activities (production and consumption) and their interactions in an economy. This economy can be defined at village, regional, national or global level. The defining characteristics remains that all flows of money and goods are covered by the model.
Partial equilibrium model A model covering part of an economy in detail. Most partial models focus on a specific sector, like for example agriculture. The underlying assumption is that the sector analyzed is so small relative to the rest of the economy that changes in this sector will not cause changes in other production sectors or in consumption.
CAPRI Common Agricultural Policy Regional Impact Analysis. Partial equilibrium model of European Agriculture, allowing analysis at regional level. For a detailed description of CAPRI see
www.agp.uni-bonn.de/agpo/rsrch/capri/capri_e.htm.
GTAP Global Trade Analysis Project. General equilibrium model of international trade covering the whole world. Allows analysis of trade flows, production (agriculture, manufacturing and services) and consumption at national or regional level. For a detailed description of GTAP see www.gtap.agecon.purdue.edu.

SEAMLESS No. 010036 Deliverable number: D3.8.1 09 November 2005
Page 31 of 34
Appendices
Table A1: CAPRI trade blocks (18 in total)
Trade blocks Broken down in individual countries EU15 Yes EU10 Yes Norway - Bulgaria & Romania Yes Rest of Europe - Mediterrean Countries Yes USA - Canada - Mexico - MeroSur Yes Rest of South America No Japan - China - India - Australia & New Zealand No Least Developped Countries No African Carribean and Pacific countries under the Cotonou Agreement which are not LDCs
No
Rest of World No
SEAMLESS No. 010036 Deliverable number: D3.8.1 09 November 2005
Page 32 of 34
Table A2: CAPRI agricultural production activities (55 in total)
Type Activities Type Activities Cereals Soft wheat Fodder production Fodder maize Durum wheat Fodder root crops Rye and Meslin Other fodder on arable land Barley Extensive graze and grazing Oats Intensive graze and grazing Paddy rice Set aside idling Maize
Fallow land and set-aside Non food production on set-aside
Other cereals Fallow land Oilseeds Rape Cattle Dairy cows Sunflower Sucker cows Soya Male adult cattle farming Olives for oil Heifers fattening Other oilseeds Heifer raising Other annual crops Pulses Fattening of male calves Potatoes Fattening of female calves Sugra beet Raising of male calves Flax and hemp Raising of female calves Tobacco Pig fattening Other industrial crops
Pigs, poultry and other animals Pig breeding
Tomatoes Poultry fattening Vegetables, fruits, other perennials Other vegetables Laying hens Apples, pears and peaches Sheep and goat fattening Citrus fruits Sheep and goat for milk Other fruits Other animals Table grapes Table olives Table wine Other wine Nurseies Flowers Other marketable crops

SEAMLESS No. 010036 Deliverable number: D3.8.1 09 November 2005
Page 33 of 34
Table A3: GTAP countries and regions (87 in total)
Individual countries Regions Albania Hungary Romania Central America Argentina India Russian Federation Rest of Andean Pact Australia Indonesia Singapore Rest of East Asia Austria Ireland Slovakia Rest of EFTA Bangladesh Italy Slovenia Rest of Europe Belgium Japan South Africa Rest of Former Soviet Union Botswana Korea Spain Rest of FTAA Brazil Latvia Sri Lanka Rest of Middle East Bulgaria Lithuania Sweden Rest of North Africa Canada Luxembourg Switzerland Rest of North America Chile Madagascar Taiwan Rest of Oceania China Malawi Tanzania Rest of SADC Colombia Malaysia Thailand Rest of South African Customs Union Croatia Malta Tunisia Rest of South America Cyprus Mexico Turkey Rest of South Asia Czech Republic Morocco Uganda Rest of Southeast Asia Denmark Mozambique United Kingdom Rest of Sub Saharan Africa Estonia Netherlands United States Rest of the Caribbean Finland New Zealand Uruguay France Peru Venezuela Germany Philippines Vietnam Greece Poland Zambia Hong Kong Portugal Zimbabwe
Table A4: GTAP sectors (57 in total)
Sectors Paddy rice Meat products nec Transport equipment nec Wheat Vegetable oils and fats Electronic equipment Cereal grains nec Dairy products Machinery and equipment nec Vegetables, fruit, nuts Processed rice Manufactures nec Oil seeds Sugar Electricity Sugar cane, sugar beet Food products nec Gas manufacture, distribution Plant-based fibers Beverages and tobacco products Water Crops nec Textiles Construction Bovine cattle, sheep and goats, horses
Wearing apparel Trade
Animal products nec Leather products Transport nec Raw milk Wood products Water transport Wool, silk-worm cocoons Paper products, publishing Air transport Forestry Petroleum, coal products Communication Fishing Chemical, rubber, plastic products Financial services nec Coal Mineral products nec Insurance Oil Ferrous metals Business services nec Gas Metals nec Recreational and other services Minerals nec Metal products Public Administration, Defense,
Education, Health Bovine meat products Motor vehicles and parts Dwellings
SEAMLESS No. 010036 Deliverable number: D3.8.1 09 November 2005
Page 34 of 34
Table A5: Comparing CAPRI and GTAP
CAPRI GTAP
Institutional organization
Model based at the Institute for Agricultural Policy, Bonn University (Wolfgang Britz)
Consortium of international (e.g. WTO, Worldbank, OECD, IFPRI) and national agencies (MIT, ERS,LEI) with headquarters at Purdue University (Tom Hertel)
“Club”, no Membership fee, but controlled entry
Members pay fee
Model structure
Partial Equilibrium Model, comparative-static (dynamic version available)
Applied General Equilibrium Model, comparative-static, recursive (dynamic version available)
Absolute prices Relative prices
Link of aggregate programming models at NUTS II/farm type (EU27) with multi-commodity model
IO Tables, bilateral trade (Armington specification)
Tariffs included Bilateral tariffs included (HS-10 codes)
No consideration of other sectors (partial) and primary factor markets
All sectors are treated equally (template), differences in elasticities and base data
Dual cost function approach on the supply side
Production: fixed substitution between primary and intermediate inputs (version with variable substitution available)
Bilateral trade (Armington market model) Bilateral transport costs included (differences between c.i.f. and f.o.b. prices)
Environmental indicators (N,P,K balances; Methane emissions, NO2 emissions, GHG emissions)
Data Base year three-year average 2001 (currently)
Base year 2001 (version 6, currently)
18 regional “trade blocks” comprising 40 countries with behavioural equations, 42 products
87 regional aggregates, 57 commodities; but typical application will require aggregation by regions and products (max ca. 25x25)
For agriculture: 12 raw commodities and 8 food processing industries
EU25 focus; main client so far DG-AGRI Global focus; main use analysis of trade negotiations (WTO)