kaust repository - core.ac.uk · precipitation characteristics from adense network of 656 ......
TRANSCRIPT

Evaluation of the TMPA-3B42 precipitation product using ahigh-density rain gauge network over complex terrain in
northeastern Iberia
KAUSTRepository
Item type Article
Authors El Kenawy, Ahmed M.; Lopez-Moreno, Juan I.; McCabe,Matthew; Vicente-Serrano, Sergio M.
Citation El Kenawy AM, Lopez-Moreno JI, McCabe MF, Vicente-Serrano SM (2015) Evaluation of the TMPA-3B42precipitation product using a high-density rain gaugenetwork over complex terrain in northeastern Iberia. Globaland Planetary Change 133: 188–200. Available:http://dx.doi.org/10.1016/j.gloplacha.2015.08.013.
Eprint version Post-print
DOI 10.1016/j.gloplacha.2015.08.013
Publisher Elsevier BV
Journal Global and Planetary Change
Rights This is the accepted version of an article that appeared infinal form in the journal Global and Planetary Changeavailable at:http://dx.doi.org/10.1016/j.gloplacha.2015.08.013
Downloaded 6-Dec-2017 19:56:17
Link to item http://hdl.handle.net/10754/594235

1
Evaluation of the TRMM 3B42 precipitation product using a high-density 1 rain gauge network over complex terrain in north-eastern Iberia 2
3 Ahmed M. El Kenawy1, 3, Juan I. Lopez-Moreno2, Matthew F. McCabe1 & Sergio 4
M. Vicente-Serrano2 5 6
1. Water Desalination and Reuse Center, Division of Biological and Environmental Sciences and Engineering, King Abdullah 7 University of Science and Technology, Thuwal, Saudi Arabia. 8
2. Instituto Pirenaico de Ecología- CSIC, Campus de Aula Dei, P.O. Box 13034, Zaragoza, 50059, Spain. 9
3. Department of Geography, Mansoura University, Mansoura, Egypt. 10
E-mail: ([email protected]) 11
12
Abstract 13
The performance of the Tropical Rainfall Measuring Mission (TRMM) version 3B42 V7 product 14
is validated over north-eastern Iberia, a region with considerable topographical gradients and 15
complexity. Precipitation characteristics from a dense network of 656 rain gauges, spanning the 16
period from 1998 to 2009, are used to evaluate the TRMM 3B42 estimates on a daily scale. A set 17
of accuracy estimators, including the relative bias, mean absolute error (MAE), root mean square 18
error (RMSE) and Spearman rho coefficient were used to evaluate the results. The assessment 19
indicates that the TRMM 3B42 product is capable of describing the seasonal characteristics of 20
the observed precipitation over most of the study domain. In particular, TRMM 3B42 21
precipitation agrees well with in situ measurements, with MAE less than 2.5 mm.day-1, RMSE of 22
6.4 mm.day-1 and rho correlation coefficients generally above 0.6. TRMM 3B42 provides 23
improved accuracies in winter and summer, whereas it performs much worse in spring and 24
autumn. Spatially, the retrieval errors show a consistent trend, with a general overestimation in 25
regions of low altitude and underestimation in regions of heterogeneous terrain. The TRMM 26
3B42 generally performs well over inland areas, while showing less skill in the coastal regions. 27
A set of skill metrics, including a false alarm ratio [FAR], frequency bias index [FBI], the 28
probability of detection [POD] and threat score [TS], are also used to evaluate TRMM 29
performance under different precipitation thresholds (1, 5, 10, 25 and 50 mm.day-1). The results 30
suggest that the TRMM 3B42 retrievals perform well in specifying moderate rain events (5-25 31
mm.day-1), but shows noticeably less skill in producing both light (<1 mm.day-1) and heavy 32

2
rainfall thresholds (more than 50 mm.day-1). Given the complexity of the terrain and the 33
associated high spatial variability of precipitation in north-eastern Iberia, the results reveal that 34
TRMM 3B42 data provide an informative addition to the spatial and temporal coverage of rain 35
gauges in the domain, offering insights into characteristics of average precipitation and their 36
spatial patterns. However, the satellite-based precipitation data should be used cautiously for 37
monitoring extreme precipitation events, particularly over complex terrain. An improvement in 38
precipitation algorithms is still needed to more accurately reproduce high precipitation events in 39
areas of heterogeneous topography over this region. 40
41
Key words: precipitation; rain gauges; TRMM 3B42; evaluation; Iberia. 42
43
1. Introduction 44
Accurate measurement of precipitation over both space and time is crucial to better characterize 45
and understand water and energy cycles (Lorenz and Kunstmann, 2012), to enhance 46
understanding of climate regimes and their associated dynamics (Scarsoglio et al., 2013) and to 47
improve hydro-meteorological forecasting (e.g., drought and flood) (Su et al. 2008). Though 48
providing the principal source to describe precipitation characteristics, the performance of 49
ground-based precipitation estimates is very sensitive to the spatial density of rain gauges, terrain 50
complexity, the quality of data and the completeness and length of meteorological records 51
(Groisman and Legates, 1994). Apart from providing basic meteorological forcing for diverse 52
hydrological applications, assessing the potential impacts of global warming on the regional 53
scale requires accurate data at fine spatial and temporal resolutions. However, this kind of 54
assessment is challenging in areas of heterogeneous terrain, not only due to the high spatial and 55
temporal variability of precipitation in these regions, but also as a consequence of the lack of a 56
spatially dense network of rain gauges that can reliably capture the impacts of topographical 57
gradients on local and regional climate (Lopez-Moreno et al., 2008; Evans and McCabe, 2013). 58
59
Over the last three decades, many attempts have been made to improve precipitation retrievals 60
from satellites through merging various data sources, such as radar, microwave and thermal 61
infrared remote sensing, allowing for a significant improvement in the accuracy, consistency and 62
coverage of the retrievals (Behrangi et al., 2011). Currently, many sources of conventional 63

3
remotely sensed precipitation estimates are available at high spatial (0.25° or finer) and temporal 64
(3 hourly or shorter) resolutions, including (among others): the Precipitation Estimation from 65
Remotely Sensed Information Using Artificial Neural Networks (PERSIANN) (Sorooshian et al. 66
2000), the Climate Prediction Center (CPC) Morphing algorithm (CMORPH) (Joyce et al. 2004), 67
the Tropical Rainfall Measuring Mission (TRMM) Multi-satellite Precipitation Analysis 68
(TMPA) (Huffman et al. 2007) and Multisensor Precipitation Estimation (MPE) (Seo et al., 69
1999). However, given that satellite-based estimates rely primarily on the interpretation of 70
emitted or scattered radiation received by the satellite instruments, these estimates are 71
accompanied by a host of uncertainties. Such uncertainties can originate from different sources, 72
including sampling frequency, attenuation correction, attenuation–reflectivity relationships, 73
partial beam filling and surface clutter rejection (Ebert et al., 2007). Levizzani et al. (2007) 74
provide a detailed review of the errors associated with satellite precipitation retrievals. 75
Recently, a number of studies have been undertaken to assess the uncertainty associated with 76
remotely sensed precipitation products across varying regions worldwide, including the 77
continental United States (Chen et al., 2013), Europe (Stampoulis and Anagnostou, 2012), the 78
Mediterranean basin (Feidas et al., 2009), Southern America (Vila et al., 2009), China (Yu et al., 79
2009), India (Prakash et al., 2014), West Africa (Jobard et al., 2011), the Indian Ocean (Prakash 80
and Gairola, 2014) and the Pacific Ocean (Sapiano and Arkin, 2009). These works have 81
compared satellite-based precipitation products either using other satellite-based sources (e.g., 82
Masunaga et al., 2002; Islam et al., 2012) or surface observations (e.g., Adeyewa and Nakamura, 83
2003; Prakash and Gairola, 2014). For example, Masunaga et al. (2002) compared precipitation 84
estimates from various TRMM Microwave Image (TMI) products over the tropics, suggesting 85
that the disagreement between these products was a consequence of their different physical basis. 86
More recently, Lockhoff et al. (2014) conducted a comparison between the daily precipitation 87
data from the Global Precipitation Climatology Project (GPCP) and the European Daily High-88
resolution Observational Gridded Dataset (E-OBS), suggesting a good agreement of 89
climatologies (e.g., mean, frequency and intensity) and empirical frequency distributions. 90
Similarly, Kidd et al. (2012) compared high-resolution precipitation products with radar and rain 91
gauge observations in northwestern Europe. Also, Adeyewa and Nakamura (2003) compared 92
rainfall estimations from the TRMM precipitation radar (PR), TRMM 3B43 and Global 93
Precipitation Climatology Project (GPCP) satellite products over Africa, concluding that the 94
TRMM 3B43 matches well with rainfall observations. Over the eastern Mediterranean, Feidas et 95

4
al. (2009) found good agreement between TRMM estimations and gauge measurement data on a 96
seasonal time scale, with the best results found during autumn, summer and spring. 97
TRMM products, which are available since early 1998, are one of the major sources of satellite 98
retrieved precipitation, providing spatially homogeneous observations with good spatial coverage 99
and few missing values (Huffman et al. 2007). The main advantage of the TRMM 3B42 100
retrievals is that they incorporate multiple-sensor and multi-satellite data, in addition to in-situ 101
based observations, allowing for more accurate and reliable precipitation estimates (Huffman and 102
Bolvin, 2012). With the merits of multi-sensors calibration, quasi-global coverage, high spatial 103
and temporal resolutions and low latency in availability, several studies have found TRMM to be 104
superior to other available satellite-based products (see for example, Adeyewa and Nakamura, 105
2003; Ebert et al., 2007; Huffman et al., 2007). To develop a consistent and robust global 106
product, validation of satellite-based precipitation products is required over diverse regions and 107
seasons to define and improve the quality of measurements and to accurately reveal 108
climatological features. Over the Iberian Peninsula, relatively little work has been done to assess 109
the accuracy of the TRMM products or to use these data for meteorological studies. In their 110
assessment of the accuracy of satellite precipitation products over the Unites States, Europe and 111
Australia, Ebert et al. (2007) found that the performance of a single product can significantly 112
differ from one region to another. Therefore, validating TRMM products on a regional basis over 113
the Iberian Peninsula is required to ensure confidence in product estimates. 114
115
In this work, we focus on assessing the performance of the recent version of the TRMM 116
precipitation product (3B42 V7) in north-eastern Iberia. From many perspectives, the north-117
eastern region of the Iberian Peninsula offers a unique setting to assess the capabilities of TRMM 118
at high spatial detail. First, the network of precipitation observatories in the region is one of the 119
densest regional precipitation networks in the Iberian Peninsula, providing a representative areal 120
means and allowing for a detailed and conventional assessment of precipitation products. 121
Second, the region is characterized by complex terrain that exerts strong precipitation gradients, 122
associated with different underlying microphysical and dynamical processes of climate. In 123
addition, numerous studies have identified a wide range of large-scale drivers and rainfall 124
phenomena associated with the high spatial-temporal variations of precipitation in the region, 125
including orographic rain, convective processes and thunderstorm activities (e.g., Ramis et al., 126
1997; Beguería et al., 2009; Lopez-Moreno et al., 2010). Finally, the north-eastern Iberian 127
5
Peninsula shows strong topographic gradients and large topographic diversity, containing 128
mountains of more than 3400 m, four different mountain chains, semiarid depressions as a 129
consequence of topographic barriers and the influence of two seas: the Atlantic Ocean and the 130
Mediterranean Sea (El Kenawy et al., 2013). In areas of complex topography like north-east 131
Iberia, strong scattering signals are likely to occur, whose effects can differ markedly depending 132
on exposure and altitude, especially over cold land surfaces and snow-covered areas. Previous 133
studies have already identified the poor performance of TRMM precipitation products over 134
regions with very complex topography, particularly in tropical and mid-latitude mountain 135
systems, such as the Andes (Zulkafli et al., 2014), the Himalaya (Shrestha et al., 2012) and the 136
Ethiopian plateau (Hirpa et al., 2010). 137
138
The major objective of this work is to assess the ability of the TRMM 3B42 (V7) precipitation 139
product to accurately replicate precipitation variability and extremes using a dense and high-140
quality rain gauge network in north-east Iberia. Considering the high spatial and temporal 141
variability of precipitation in the region, such a comparison is useful not only for providing a 142
better indication on the accuracy of the TRMM 3B42 across the whole domain, but also for 143
improving their retrievals at this regional scale, offering a basis for better assessment of 144
precipitation and related hydrological impacts across the region. 145
146
2. Data and methods 147
2.1. Study area 148
The study domain is located in northeast Iberia between latitudes 39°43´N and 43°29´N and 149
longitudes 05°01´W and 03°17´E. It covers an area of approximately 186.000 km2, which 150
accounts for roughly 32% of the total area of the Iberian Peninsula (Figure 1). The topography 151
varies from mountains with a maximum elevation of 3400 m above mean sea level (the 152
Pyrenees), to the alluvial plains in the lower reaches of the Ebro basin, which is the largest 153
hydrological division in the peninsula. The study domain encompasses a large variety of climate 154
zones, including semi-arid, Mediterranean, oceanic, continental and mountainous. These climate 155
zone variations derive mostly from weather system interactions associated with atmospheric 156
circulation, latitude, altitude, topography, vegetation cover and land-sea interactions (Capel, 157
2000). From a global perspective, the region encompasses a climatic gradient between mid-158
latitude and subtropical regimes. It is also situated in a transitional zone where the Mediterranean 159

6
configurations and the Atlantic influences interact with each other. The mean annual rainfall in 160
the region typically exceeds 650 mm (Cuadrat et al., 2004), with maximum precipitation 161
recorded during the period from October to May, which provides about 60%–80% of the annual 162
precipitation, with two main peaks in October and April. Seasonally, summer and winter 163
contribute to nearly 16.9% and 23.1% of the annually averaged accumulated precipitation, 164
respectively, compared with 27.9% in spring and 32.1% in autumn. The Pyrenees and the most 165
elevated sites in other mountainous regions are covered with snow during winter and early 166
spring. A detailed summary of the climate of the study domain can be found in Font-Tullot 167
(1983) and Capel (2000). 168
169
2.2. Data sets 170
2.2.1. TRMM Precipitation dataset 171
The TRMM was launched in 1997 as a collaborative project between the National Aeronautics 172
and Space Administration (NASA) and the Japanese Aerospace Exploration Agency (JAXA) to 173
monitor rainfall in the tropical area from 35°S to 35°N, with a revisit time of one day on average 174
(Huffman et al. 2007). Here, we consider the rain rate data from the TRMM 3B42 product (V7), 175
which was officially released in December 2012 to correct for defects present in the algorithms 176
of earlier versions (V4 to V6) (Chen et al., 2013). The TRMM Microwave Image (TMI) land 177
rainfall algorithm in the V7 products has several improvements over previous versions (Huffman 178
and Bolvin, 2012). First, the relationship between rain rates and TMI 85-GHz brightness 179
temperatures for convective and stratiform rain are generated using the combined TMI-PR data. 180
Second, estimation of the ratio of convective rainfall to total rainfall significantly lowers the 181
overestimation by TMI during the warm season. Third, TRMM V7 incorporates more 182
observation datasets at different detection ranges, including the latest version of GPCC Full 183
Analysis from 1998 to 2010, besides version 6 GPCC Monitoring Analysis. Finally, the TRMM 184
V7 algorithm combines precipitation estimates from land surface rain gauge analyses, in addition 185
to multiple satellite sensors and systems (e.g., TMI, Advanced Microwave Scanning Radiometer 186
for Earth Observing Systems (AMSR-E), Special Sensor Microwave Imager (SSMI), Special 187
Sensor Microwave Imager/Sounder (SSMIS), Advanced Microwave Sounding Unit (AMSU), 188
Microwave Humidity Sounder (MHS) and microwave-adjusted merged geo-infrared (IR)) 189
(Huffman and Bolvin, 2012). This combination makes the TRMM 3B42 V7 useful for 190

7
diagnosing precipitation relative to previous versions, which relied on a single sensor 191
precipitation estimate. 192
193
In this work, we used the daily version of the 3B42 precipitation product (in mm.day-1), which 194
was aggregated from the 3-hourly product (mm.hr-1) and sampled at a 0.25-degree spatial 195
resolution for a global belt extending from 50° S to 50° N. Our analyses were restricted to the 196
period of overlap with rain gauge data (1 January 1998 through 31 December 2009). Further 197
information on the TRMM mission and instruments can be found in Kummerow et al. (2000). 198
Particular details and aspects related to the 3B42 V7 product can also be found via 199
http://trmm.gsfc.nasa.gov/3b42.html. 200
201
2.2.2. Gauge data 202
To evaluate the performance of the TRMM 3B42 precipitation estimations, we exploit a very 203
dense network of rain gauges covering the period from January 1998 through December 2009. 204
The network incorporates a total of 656 observatories, with an average station-to-station distance 205
of 5 km, making it ideally suited to evaluate the TRMM data. The raw daily precipitation data 206
were provided by the Spanish Meteorological Agency (Agencia Estatal de Meteorologia, AEMT) 207
and subjected to rigorous quality assessments and homogeneity testing. A complete description 208
of the development of this data set can be found in Vicente-Serrano et al. (2010). Overall, the 209
final data set features a complete data record (no missing values), free of anomalous data and 210
inhomogeneities for the 12-year period. The spatial distribution of the rain gauge stations is 211
shown in Figure 1. 212
213
The network exceeds most of the requirements for robust assessment of precipitation estimates 214
from the TRMM product. The precipitation data set is very dense over large parts of the region, 215
making it useful for a detailed assessment of TRMM performance and minimizing any 216
uncertainty associated with inadequate sampling. The main climate zones in the region (e.g., 217
semi-arid, maritime, continental and mountainous) are also well-represented by the current 218
network. However, in some less accessible regions (e.g., the Pyrenees), TRMM data may be 219
useful as a “proxy” to in situ measurements, given the lower spatial density of observations. This 220
is a prime example of where TRMM precipitation estimates may be of benefit for filling in 221
spatial gaps in ground-based data, providing information on the interconnections between 222
climate and hydrology in these areas. 223

8
To provide a detailed spatial assessment of the performance of TRMM 3B42, we divided the 224
study domain into four main sub-regions (R1-R4). To achieve this classification, we first ranked 225
all observatories according to their annual total precipitation. Then, the observatories were 226
simply grouped according to their rank, so that R1 incorporated observatories whose average 227
annual precipitation lies in the first quartile of the entire network (i.e., between Q1 and Q25), R2 228
the second quartile (Q25-Q50) and so on for R3 (Q50-Q75) and R4 (Q75-Q100). This 229
regionalization will serve as the basis for assessing the spatial performance of TRMM 3B42 data. 230
Figure 2–a illustrates the spatial distribution of the four sub-regions, which are distinct and 231
meaningful from a climatic and geographical perspective. The four sub-regions also correspond 232
to well-defined climate regimes following Capel (2000). According to the classification, R1 233
represents observatories with the least annual precipitation in the whole domain (< 400 mm. 234
year-1), whereas the largest annual records are accounted for in R4 (750-2300 mm. year-1). R2 235
and R3 include observatories with a median precipitation of about 400–750 mm. year-1. 236
237
Figure 2-b clearly illustrates that the annual precipitation is strongly controlled by elevation, with 238
the four sub-regions displaying their dependency on topography. R1 and R2 are generally 239
situated in areas dominated by lower altitudes (average altitude=469 m for R1 and 689 m for 240
R2), with the vast majority of R1 contained within the Ebro basin. R3 is located at the foothills 241
of the high mountainous regions in the north of the study domain, while R4 is mostly situated in 242
areas of complex topography to the north (e.g., the Pyrenees), with elevations as high as 2000-243
3400 m. However, R4 also stretches to the west, including coastal areas along the Cantabric Sea. 244
245
2.3. Validation procedure 246
There are different sources of uncertainty in precipitation estimates from satellite-based products. 247
The common sources of errors can generally be associated with data processing, discrete 248
sampling, radiance measurements, retrieval algorithms and view of the sensors (Huffman et al., 249
1997). Therefore, rainfall estimates obtained from the satellites should be validated against rain 250
gauge observations in order to ensure their reliability. Here, we validated the daily data for each 251
rain gauge individually against the specific TRMM pixel that contains it. The validation using 252
point-to-grid comparison was performed to limit the possible impacts of complex topography on 253
the outputs of any interpolation algorithm. Moreover, the high spatiotemporal variability of 254
precipitation within the study domain can further complicate the results of any interpolation 255

9
method at the daily time scale. A similar procedure has been followed in related investigations 256
(e.g., Islam 2009; Heidinger et al. 2012). 257
258
In this study, the validation statistics were computed on a daily scale for the 12-year period 259
(1998-2009), and given, as: 260
1
1
( )% 100
N
i ii
N
ii
P OBIAS
O
=
=
−= ×∑
∑ … (1) 261
ii
N
iOPNMAE −= ∑
=
−
1
1 ( … (2) 262
21( )
i i
nO Pi
X XRMSE
n=
−= ∑ ... (3)
263
2
2
6( 1)
idrho
N N=
−∑ ... (4)
264
where N is the number of observations, O is the gauge-measured precipitation, P is the 265
TRMM-derived precipitation, 𝑂𝑂�, 𝑃𝑃� are the mean of O and P, respectively, di is the difference 266
between the ranks of corresponding values of precipitation, and N is the number of values in the 267
data set, and i is the counter for individual observed and TRMM values. 268
269
The BIAS is an indicator of the sign of the prediction (i.e., overestimating/underestimating) and 270
also the average difference between TRMM and observed values. In comparison, the MAE is a 271
measure of how far the TRMM value is from the measured value, as it is simply calculated as the 272
average of absolute difference errors. Generally, the TRMM product is considered perfect when 273
the values of BIAS and MAE are close to zero. RMSE is related to the BIAS and the standard 274
deviation of the differences between the records of the gauge and TRMM data, while the 275
Spearman rho correlation coefficient is a measure of the temporal correlation between the two 276
data sources. The validation statistics were calculated on a daily basis by comparing individual 277
rain gauge data with TRMM rainfall estimates at specific grid boxes. 278
279
While information on changes in the mean precipitation is important to understand the long-term 280
variability of precipitation, monitoring changes in heavy precipitation events are relevant to 281
10
examining possible hydrological, economic and societal impacts of change and variability. In 282
order to quantitatively examine the potential of TRMM 3B42 to reproduce the precipitation 283
response at different ranges (thresholds), a set of categorical metrics were also calculated at a 284
daily time step, including: the frequency bias index (FBI), false alarm ratio (FAR), probability of 285
detection (POD) and threat score (TS) (Wilks, 1995). These statistics have been widely used in 286
many works to measure the correspondence between the observed and estimated occurrence of 287
rainy events using remotely sensed products (e.g., Su et al. 2008; Shrestha et al. 2012). Here, we 288
defined six different categories (thresholds) that identify the capability of TRMM 3B42 to 289
reproduce very light (<1 mm.day-1), light (1-5 mm.day-1), slightly moderate (5-10 mm.day-1), 290
moderate (10-25 mm.day-1), heavy rain (25-50 mm.day-1) and extremely heavy rain (>50 291
mm.day-1). For each daily precipitation threshold, we created a 2 × 2 contingency table (see 292
Table I for an explanation of the structure of the 2 × 2 contingency table). Following the results 293
of the contingency table for each precipitation threshold, we simply calculated the categorical 294
metrics, as: 295
296
cabaFBI
++
= ... (5) 297
babFAR+
= ... (6) 298
caaPOD+
= ... (7) 299
cbaaTS++
= ... (8) 300
301
where a is the number of hits (i.e., observed rain events correctly detected), b is the 302
number of false alarms (i.e., detectable rainfall events, but not observed), and c refers to the 303
number of misses (i.e., observed rain events not detected by the TRMM). 304
305
The FBI indicates whether the TRMM tends to underestimate (FBI<1) or overestimate (FBI>1) 306
rain events, whereas the POD indicates the fraction of rain events that were correctly detected. 307
The FAR considers all forecasts of rain, giving indication on the fraction of rain events that were 308
incorrectly defined (i.e., TRMM overpasses registered concurrent rain, which did not occur in 309
reality). The TS reveals the overall skill of the TRMM as it summarizes the ratio between the 310

11
number of hits and the total number of hits, misses and false alarms. Overall, a perfect agreement 311
between observations and TRMM data occurs when FBI=1, FAR= 0, POD= 1 and TS= 1. 312
313
3. Results 314
3.1. Validation results 315
In this work, we used the %BIAS, MAE, RMSE and Spearman rho coefficient as the standard 316
statistical parameters to evaluate the performance of the TRMM 3B42 data across the study 317
domain. The validation statistics were calculated by comparing rain gauge data with rainfall 318
estimates at individual grid boxes on a daily scale. Figure 3 summarizes the results of the 319
statistical indices averaged for each season. The seasons were defined as: winter (December-320
January-February, DJF), spring (March-April-May, MAM), summer (June–July-August, JJA) 321
and autumn (September-October-November, SON). As depicted, the TRMM 3B42 tends to 322
overestimate the observed precipitation across the whole domain in most seasons. In particular, 323
the %BIAS ranged from 12.8% (winter) to 29.7% (spring), with an annual average on the order 324
of 18.7%. It should be noted that underestimation is a recurrent feature at the grid scale, with the 325
TRMM 3B42 showing a negative bias in 40% of the grid cells in winter, compared with 18.2% 326
in spring, 30% in autumn and 33.5% in summer. Figure 3 also shows the seasonal variations of 327
the %BIAS for the four sub-regions. It is interesting to notice that the errors show a consistent 328
trend, with a general overestimation in regions of low (R1) and moderate (R2 and R3) 329
precipitation and underestimation in regions of higher precipitation (R4). In particular, the 330
positive bias in R1 varied from 36.4% (winter) to 52.8% (spring), which is higher with respect to 331
other regions. In contrast to all regions, a negative bias was apparent in R4, with a relative bias 332
varying from -7.8% (summer) to -17.5% (winter) and almost near-to-zero values in spring. 333
334
Figure 3 also details that the MAE over the domain as a whole varied from 1.61 mm.day-1 335
(summer) to 2.78 mm.day-1 (spring), with an annual error of 2.46 mm.day-1. The best agreement 336
was found in summer and winter, where the percent of grids showing MAE less than 2 mm.day-1 337
were 77.4 and 48.6%, respectively. The least accurate results were shown in the most rainy 338
seasons, with 78% (spring) and 75.5 % (autumn) of the grid boxes exceeding a daily error of 2 339
mm. Similar to the %BIAS, the MAE errors showed a consistent trend, with the best results 340
found in the least rainy regions (R1 and R2) and the poorest skill occurring in the heaviest 341
rainfall region (R4). In R4, the MAE showed more variable performance, with values generally 342

12
above 4 mm.day-1 across most of seasons, suggesting a strong systematic error of precipitation 343
estimation at higher elevations. The RMSE showed a similar pattern to the %BIAS and MAE, 344
with the lowest errors (4.75 mm.day-1) found in summer and the maxima in spring (6.72 mm.day-345 1) and autumn (7.56 mm.day-1). 346
347
The Spearman rho correlation coefficients between TRMM 3B42 and rain gauge data for each 348
season are also shown in Figure 3 and Table II. The seasonal values of rho coefficient were 349
generally above 0.6 for all regions and most seasons, which is statistically significant at the 99% 350
confidence level. In accordance with MAE and RMSE, the highest values of rho were found in 351
the regions with lowest rainfall (R1and R2), compared with regions of higher rainfall (R3 and 352
R4). As summarized in Table II, the highest values of rho occurred in R1 during summer (0.73), 353
autumn (0.72) and winter (0.71). In contrast, the lowest correlation values were ascribed to R4, 354
with values of 0.46 and 0.47 during spring and winter, respectively. As many climatic 355
applications (e.g., precipitation and drought impact assessments) are more relevant to monthly 356
and seasonal scales of climate data rather than daily scales, we provided a detailed evaluation of 357
the temporal agreement between the TRMM 342 and in-situ data by calculating the rho 358
coefficient on a monthly scale. Figure 4 suggests significant month-to-month variations of rho 359
coefficients, with the highest values found in the period from June to September (0.68-0.72), and 360
the lowest values in April (0.57), January and May (0.59). The rho coefficients were found more 361
promising for R1 and R2 than for R3 and R4. 362
363
The spatial distribution of the %BIAS was also examined and compared for all seasons, with 364
results illustrated in Figure 5. For each season, the distribution of the %BIAS is quite 365
homogeneous, with a clear contrast between the mainland (overestimation) and the coasts 366
(underestimation). This contrast is particularly evident in winter and summer. A considerable 367
overestimation in the central areas of the Ebro valley was also observed, particularly in spring 368
and summer. Interestingly, all areas close to water bodies showed a negative bias for all seasons. 369
For example, the %BIAS along the Cantabric Sea varied from -10% to -50% during winter, 370
which is equivalent to -1.0 to -2.4 mm.day-1. The Mediterranean region also exhibited a negative 371
bias in winter, but weaker than that of the Cantabric Sea (roughly 0 to -20%; or 0 to -0.4 372
mm.day-1). Another interesting feature was found over the Pyrenees during springtime, where 373
precipitation values were markedly overestimated (50-70%; 1.2-1.6 mm.day-1), implying that the 374
TRMM 3B42 performs poorly in the Pyrenees during spring. 375

13
376
Figure 6 illustrates the spatial distribution of the RMSE (mm.day-1) for each season. Similar to 377
the %BIAS, the TRMM 3B42 presents larger errors near to the coasts, particularly the Cantabric 378
Sea, with values ranging between 8 and 15 mm.day-1. The lowest errors were observed in the 379
central areas of the Ebro basin, with a clear south-north gradient and values ranging between 0-6 380
mm.day-1. Lower RMSEs (0-2 mm.day-1) were observed in summer, where the highest RMSE 381
values (> 7 mm.day-1) were restricted to a small number of grids in the northern parts of the 382
study domain. 383
384
3.2. Spatial and temporal distribution of precipitation 385
In Figure 7, the mean seasonal precipitation from rain gauges is plotted against precipitation 386
estimates from the TRMM 3B42 for the period from January 1998 to December 2009. The 387
results reveal that seasonal precipitation sums provided by rain gauges were fairly well estimated 388
by the TRMM 3B42. The best agreement was found in winter and autumn (r=0.84), whereas the 389
poorest agreement occurred during spring (r=0.73). On average, the maximum departure between 390
the seasonal cumulative rain gauge and TRMM 3B42 estimates was found during spring 391
(19.4%), compared with 6.8% in winter, 7.1% in summer and 7.4% in autumn. The areal average 392
annual rainfall measured by the TRMM 3B42 is 685.2 mm, which differs from the rain gauge 393
data by 9.2%. As depicted, a general underestimation of annual sums was noted at sites with 394
annual precipitation above 1000 mm, while overestimation was more evident for those locations 395
with precipitation between 500 and 1000 mm.day-1. A similar pattern was observed in all 396
seasons, but particularly in winter. This finding demonstrates the ability of the TRMM 3B42 to 397
reproduce precipitation totals at observatories with lower precipitation than at those with 398
moderate and higher precipitation: at least in this study region. The pattern was also confirmed 399
for seasonally accumulated precipitation, as depicted in Figure 8. The number of rain gauges 400
with high-order accumulated precipitation is markedly lower than those of corresponding 401
TRMM 3B42 pixels. This finding is confirmed for winter and autumn that are opposite to spring 402
and summer. 403
404
Figure 9 illustrates the monthly regimes of accumulated precipitation estimated from the TRMM 405
3B42 and rain gauge data. It can be seen that TRMM 3B42 precipitation data closely follow the 406
observed annual cycle of area-averaged precipitation, with a clear bi-model response. In 407
particular, two peaks were observed in all regions, with the first occurring in late spring (April-408

14
May) and the second in early autumn (September-October). In contrast, the minima typically 409
corresponded to February and the summer months (June-August). At the regional scale, the best 410
agreement was found for R1 (r=0.97), while the worst performance occurred in R4 (r=0.85). 411
Previous investigations across the study domain showed that precipitation in the region is 412
concentrated in the period from October to May, with double peaks occurring in April and 413
October (e.g., Vicente-Serrano and Lopez-Moreno, 2006), which fits well with the patterns 414
derived from the TRMM 3B42 precipitation product. 415
416
3.3. Performance of TRMM 3B42 at different daily precipitation thresholds 417
To examine the performance of the TRMM 3B42 product in reproducing the frequency of 418
precipitation occurrence events at or above a particular precipitation threshold, a set of statistical 419
skill scores (FBI, FAR, POD and TS) was computed. Figure 10 depicts the results of FAR, FBI, 420
POD and TS scores for the domain and its sub-regions at different daily precipitation ranges. 421
Overall, FBI values inform that TRMM 3B42 captured slightly moderate (5-10 mm.day-1) and 422
moderate precipitation (10-25 mm.day-1) better than it did very light (<1 mm.day-1) and very 423
heavy precipitation (>50 mm.day-1). The product poorly reproduced the occurrence of days with 424
very light rain (<1 mm) in all regions and throughout the year, with a considerable 425
overestimation in winter and autumn. TRMM 3B42 also tends to overestimate the frequency of 426
light rain events in the range 1-5 mm.day-1 during winter and autumn, while it underestimated 427
these in spring and summer. The results also suggest that there was a systematic underestimation 428
of slightly moderate and moderate precipitation occurrence (5-25 mm.day-1) in all seasons and 429
regions. Interestingly, the occurrence of very heavy events (>50 mm.day-1) were markedly over-430
predicted during the warm seasons (summer and autumn), whereas they were under-predicted in 431
the cold seasons (winter and spring). Spatially, R4 showed less predictability of precipitation 432
occurrence at all thresholds, compared with other regions. For example, the FBI values 433
corresponding to the threshold higher than 50 mm.day-1 in R4 were 2.2 in summer and 2.1 in 434
autumn, which are far from the ideal value of 1. 435
436
Figure 10 also presents variations of FAR values as a function of the precipitation threshold. 437
FAR values showed a V-shaped trend, with the worst performance found for light and heavy rain 438
thresholds. In contrast, TRMM 3B42 performed well for the occurrence of moderate rainfall 439
events in the range 5-25 mm.day-1, with values close to 0.6. The sharp increase in FAR values 440
for thresholds below 1 mm.day-1 and above 50 mm.day-1 suggests that TRMM 3B42 was less 441

15
skillful in correctly capturing the frequency and magnitude of light and heavy rain events. This 442
response was evident for all seasons, with some significant regional differences, where TRMM 443
3B42 showed the best performance for R1 and the worst for R4. Similar to the FAR, the POD 444
and TS values indicate that the performance of the TRMM 3B42 consistently degrades for lower 445
and upper precipitation thresholds. The distribution of PODs shows that the fraction of 446
precipitation occurrences during very light rain days (<1 mm.day-1) was inadequately detected, 447
with values close to zero in most seasons. The four regions also had an equivalent performance, 448
with the lowest POD and TS scores for the precipitation thresholds up to 1 mm.day-1. On the 449
contrary, the values rapidly increased for the moderate thresholds, indicating a significant 450
improvement in TRMM 3B42 detection skills. Again, the values dropped sharply for heavy and 451
very heavy rain events, with values near to 0 (no skill). 452
453
Overall, the detectability of the TRMM 3B42 for precipitation occurrence and precipitation 454
amount was generally reasonable. The TRMM 3B42 can correctly identify the moderate rain 455
events (low FAR and high POD and FAR), but fails to capture the light and intense rain events 456
(high FAR and low POD and FAR). This finding is important from a hydrological perspective, 457
as high rainfall ranges (>25 mm.day-1) significantly contribute to the total precipitation and can 458
thus have severe natural and socioeconomic impacts on both the physical and human 459
environments (e.g., flooding, soil erosion, human mortalities and crop losses). 460
461
Figure 11 illustrates the fraction of days corresponding to each precipitation threshold, as derived 462
from the TRMM 3B42 compared to rain gauge data. As illustrated, the non-rainy days had the 463
largest occurrence year round in both TRMM 3B42 and ground measurements, with the fraction 464
of non-rainy days well captured by the TRMM 3B42 product. On average, the non-rainy days 465
accounted for as much as 76.2% of the total days in rain gauge data, compared with 76.4% in the 466
TRMM 3B42 estimates. However, the TRMM 3B42 tended to underestimate the fraction of dry 467
days in the least rainy region (R1), while it overestimated those in the rainiest region (R4). In R4, 468
non-rainy days occurred over 69.7% of days per year, as suggested by the TRMM 3B42, 469
compared with 64.1% of days in the observed data. The occurrence of precipitation ranges higher 470
than 5 mm.day-1 in the TRMM 3B42 was higher than those from rain gauges in all regions. 471
Again, the only exception corresponded to R4, which exhibited underestimation in the 5-10 and 472
10-25 mm.day-1 thresholds. As illustrated in Figure 11, both the rain gauge and TRMM 3B42 473
estimates suggest the precipitation threshold (1-5 mm.day-1) as the most frequent among all 474

16
precipitation ranges, contributing to 8.4% and 9.5% of the total days, respectively. As expected, 475
days with rain rate higher than 50 mm.day-1 showed the least frequency of occurrence, 476
contributing to only 0.19% (gauge) and 0.18% (TRMM 3B42) of the total days. 477
478
Figure 12 summarizes the relative contribution of each precipitation range to the annual 479
accumulated precipitation using TRMM 3B42 and observed data. Interestingly, in contrast to the 480
regional differences defined for the occurrence of rain events in Figure 11, TRMM 3B42 tended 481
to underestimate the contribution of light rain events, whereas it overestimated the contribution 482
of moderate and high rain thresholds. More specifically, for all precipitation ranges below 10 483
mm.day-1, TRMM 3B42 underestimated their relative contribution to the annual accumulated 484
precipitation, compared with ground measurements. One representative example is the days with 485
rain rate of 1-5 mm.day-1, whose frequency of occurrence was generally higher for TRMM 3B42 486
than for the rain gauge (Figure 11). In contrast, the relative contribution of these days to the total 487
precipitation amounts was markedly under-predicted by TRMM 3B42, with significant and 488
systematic differences between the four regions. This picture is reversed for the precipitation 489
ranges between 10 and 50 mm.day-1 (i.e., moderate and high events), with an overestimation of 490
their contribution to the annual total in all regions than in observations. This systematic 491
overestimation, particularly during the days of rain rate above 25 mm.day-1, may explain the 492
warm bias found in the study domain in most seasons. As illustrated in Figure 12, days with 493
precipitation range below 1 mm contributed to approximately 0.8-1.5% of the total observed 494
precipitation, which compared well with TRMM 3B42 (0.7-1.5%). Over higher rainfall regions 495
(R3 and R4), the contribution of light rain to total precipitation was meaningless (less than 496
0.5%). In the same context, around 37.8% (gauge) and 38.2% (TRMM 3B42) of the precipitation 497
amounts were allocated to days with rain intensity of 10-25 mm.day-1. Although the high rainfall 498
range (>50 mm.day-1) had a very small frequency, with average of occurrence less than 0.5% of 499
the total days for both TRMM 3B42 and rain gauge (Figure 11), their contributions to the total 500
rainfall were as high as 4-8% for both. 501
502
4. Discussion 503
This study provides a detailed evaluation of the performance of TRMM 3B42 (V7) precipitation 504
estimates through comparison with observations derived from a dense network of rain gauges 505
(656 stations) over NE Iberia. Based on 12 years (1998-2009) of data, the performance of the 506

17
TRMM 3B42 was assessed by directly comparing rain gauge and TRMM 3B42 data using a set 507
of accuracy statistics, including the BIAS, MAE, RMSE and Spearman rho correlation. 508
509
4.1. Seasonal variations 510
Examining the statistical results of the accuracy indicators and their seasonal differences 511
indicates that the skill of the TRMM 3B42 estimates is seasonally dependent, with better 512
performance observed in summer and winter than in spring and autumn. In the study domain, 513
winters are generally characterized by the passage of depressions associated with the polar front, 514
which generally exhibits low precipitation intensity, but with a wide horizontal spread (Beguería 515
et al., 2009). In summer, the contributions from convective systems are very important in the 516
total precipitation across the region, accounting for more intense, less frequent rain, with small 517
spatial coverage (Martín-Vide and Olcina, 2001). Unlike winter and summer, precipitation 518
patterns in spring and autumn are different as mixed types of precipitation are likely to occur, 519
especially at the beginning of each season, where local factors (e.g., convective activity) and 520
synoptic patterns can interact with each other and also with sea surface temperature in the 521
Mediterranean region (Ramis et al., 1997). For this reason, it might be expected that an area 522
occupied by either cold or warm cloud during spring and autumn will not be correctly detected 523
by the infrared-based precipitation algorithms in a way similar to those of winter and summer. In 524
their study over the Mediterranean region, Feidas et al. (2008) found that the infrared sensors 525
showed good skill in reproducing precipitation during the summer season (Pearson’s r=0.9). 526
Feidas et al. attributed this behavior to the convective type of precipitation in summer, which can 527
be well defined by the infrared based precipitation algorithms, especially with the absence of 528
snow and cold air masses in the Mediterranean region during the summertime. The same finding 529
has also been observed using thermal infrared NOAA-AVHRR data over the Iberian Peninsula 530
(Tarruella and Jorge, 2003). The good agreement between rain gauge and TRMM 3B42 during 531
summer can also be seen in the context that this version (V7) of the TRMM precipitation 532
estimates has markedly improved compared to previous versions in terms of the better estimation 533
of the ratio of convective rainfall to total rainfall (Huffman and Bolvin, 2012; Chen et al., 2013). 534
535
4.2. Spatial variations 536
The analysis indicated that the TRMM 3B42 tended to overestimate precipitation in the study 537
domain. The only exception was found in the most elevated region (R4), which exhibited an 538

18
overall underestimation across most seasons. The general over-prediction against rain gauge data 539
agrees well with the findings of many previous studies worldwide (e.g., Jobard et al. 2011; 540
Liechti et al. 2012; Yin et al. 2008). For example, Bolvin et al. (2009) reported an overestimation 541
of the mean precipitation in southern Finland, with a relative bias of 89% during winter. TRMM 542
3B42 also overestimated rainfall over the Zambezi River Basin (Liechti et al. 2012) and the 543
Tibetan Plateau (Yin et al. 2008). One possible reason for the overestimation of the magnitude of 544
seasonal and annual precipitation in our domain can be seen in the context that TRMM 545
precipitation is retrieved from microwave and infrared sensors, which observe cloud information 546
at upper levels rather than actual precipitation near the surface. Accordingly, a fraction of the 547
estimated precipitation might be expected to evaporate before reaching the ground, or not reach 548
the ground at all, resulting in precipitation overestimation (Rozante and Cavalcanti 2008). In 549
areas of complex topography, knowledge of the distance between the cloud top and the Earth’s 550
surface is essential for an accurate infrared retrieval of precipitation amount. This is mainly 551
because this distance can significantly affect the amount of evaporation below the cloud base 552
(Liu and Zipser, 2013). For this reason, it might be necessary to develop a regionally specific 553
version of Z-R relationships over the domain rather than using the global version of TRMM 554
3B42. 555
556
A more detailed inspection of the spatial performance of the TRMM 3B42 suggests that it 557
performs well in locations with lower precipitation (R1 and R2) than in regions with high 558
precipitation (R3 and R4), particularly during the cold season. Given that complex topography 559
exerts strong controls on regional precipitation in the study area, this finding suggests that the 560
capacity of using TRMM 3B42 to explain precipitation regimes decreases significantly with 561
altitude. Over the Southern Appalachian Mountain (USA), Duan et al. (2014) found that the 562
TRMM 3B42 product underestimated rainfall in orographic areas, whereas it largely 563
overestimated it in the valleys and over flat areas. Similarly, Zulkafli et al. (2014) found that the 564
TRMM 3B42 tended to underestimate precipitation in the Andes (northern Peru). In our domain, 565
this finding is interesting from a hydrological perspective, as the rivers originating in the 566
Pyrenees have their maximum flow during spring, contributing to nearly 72% of the discharge of 567
the Ebro, the largest river in the Iberian Peninsula (Lopez-Moreno et al., 2004; 2008). R1 and R2 568
are generally situated in areas with lower precipitation, but also over plain altitudes (less than 50 569
m). The majority of these regions are located within the Ebro depression or in some plateaus 570
associated with moderately elevated areas to the west and southwest (refers to Figure 1). 571

19
Accordingly, estimation of precipitation from these open surfaces using microwave sensors is 572
expected to be more accurate than in high and very complex regions. Over complex mountainous 573
regions (R4), the TRMM 3B42 generally failed to adequately reproduce precipitation 574
characteristics. In these areas, snowfall events can occur and snow cover can persist for a few 575
days (Lopez Moreno et al., 2008). The behavior of the TRMM 3B42 in this region could 576
therefore be attributed to the surface snow screening procedure embedded in the TRMM 3B42, 577
particularly during winter and early spring. In particular, snow-covered surfaces cause strong 578
scattering, which limits the ability of microwave algorithms to correctly define scatter signals 579
over land (Huffman and Bolvin, 2008; Hirpa et al., 2010). Ferraro et al. (1998) confirmed the 580
dependency of microwave brightness temperature signals for precipitation estimates on surface 581
type, indicating that different surface types can lead to complex interactions of Earth emitted 582
microwave radiation, which complicates the interpretation of the measured microwave signal. 583
Hirpa et al. (2010) indicated that the passive microwave sensors largely fail to discriminate 584
frozen and surface snow and could even incorrectly classify them as rain clouds. More recently, 585
Stampoulis and Anagnostou (2012) linked errors of microwave sensors and their ability to solve 586
surface snow/ice contamination in the cold season. 587
588
It should be noted that R3 also includes areas of complex terrain like R4, with an average altitude 589
of approximately 718 m, compared to 877 m for R4. Interestingly, the validation results suggest 590
better performance for R3 and even comparable findings to R1 and R2 in some cases (refer to 591
Figure 3). For example, the average rho coefficients for R3 during winter (0.61), spring (0.60), 592
summer (0.71) and autumn (0.66) were comparable to those of R2, with 0.66 (winter), 0.64 593
(spring), 0.73 (summer) and 0.69 (autumn). These differences can be explained by the fact that 594
the terrain ranges of R4 (e.g., the Pyrenees) are mostly located on the windward side of the 595
westerly and northerly advections, which contribute to more frequent and intense rainfall events 596
(Beguería et al., 2009). In contrast, R3 is located at the foothills of the more complex terrain in 597
R4, with portions of the ranges located in the leeward slopes. Nicholson et al. (2003) found 598
significant differences in the performance of TMPA-7RT between windward and leeward 599
regions over West Africa. Another possible reason is that the distribution of precipitation in the 600
regions of complex terrain (i.e., R3 and R4) is highly variable over space and time and therefore 601
the performance of the TRMM 3B42 at specific locations is very sensitive to the altitude, slope 602
and exposure of these sites (Mätzler and Standley, 2000). Taken together, these spatial 603

20
differences suggest that the impact of the topography on the skill of the TRMM 3B42 is not 604
significant everywhere in the study domain. 605
606
Our results also reveal relatively poor agreement between rain gauge and TRMM 3B42 in coastal 607
areas compared to inland regions, suggesting that the TRMM 3B42 does not capture the coastal 608
effect. These spatial variations may be linked to the contamination of the signal in coastal areas. 609
In particular, the coastal areas in our domain are located between either the Mediterranean or the 610
Cantabric Sea and the mountain ranges (e.g., Catalan chain along the Mediterranean and the 611
Cantabric system along the Cantabric Sea). The joint impact of the sea and mountains can likely 612
induce a failure of the sensor to discriminate between land and water pixels. This behavior is 613
more likely to be expected in the areas where the coastal mountains closely approach the sea, 614
leading to narrow coastlines (e.g., the Cantabric coastline). In the same context, the TRMM 615
3B42 grid boxes over land, which are available at a spatial resolution of 25 km, may partially 616
incorporate portions of the neighboring water body. These maritime portions are not represented 617
by rain gauges and the grid average precipitation can accordingly be different from that of the 618
gauge data. In their assessment of the performance of the TRMM-3B43 precipitation product 619
over Kyrgyzstan, Karaseva et al. (2012) noted that the TRMM-3B43 showed the lowest 620
correlation with rain gauge data in maritime areas (Pearson’s r=0.17-0.19), compared with inland 621
regions (Pearson’s r=0.36-0.88). 622
623
4.3. Performance of precipitation extremes 624
TRMM 3B42 was evaluated in terms of categorical performance by using different daily 625
precipitation thresholds. The FBI values for very light rain events (<1 mm.day-1) were far from 626
the perfect value, indicating that there was a higher degree of disagreement between rain gauges 627
and TRMM 3B42 in terms of their capability of reproducing the occurrence of precipitation 628
during light rain events. In contrast, the FBI suggested an underestimation of precipitation 629
occurrence during moderate (5-25 mm.day-1) rain events. Higher precipitation ranges (>25 630
mm.day-1) showed a contradictory trend as the FBI values suggested an underestimation of these 631
events during the cold season (winter and spring), whereas they were overestimated in the warm 632
season (summer and autumn). In accordance with FBI results, other skill metrics (e.g., FAR, 633
POD and TS) also agree that the TRMM 3B42 showed a near perfect skill for predicting 634
moderate rain events, while it had difficulties in accurately estimating both light and heavy 635
rainfall events. The poor performance of the TRMM 3B42 in correctly detecting light and high 636

21
rainfall events was also reported by Prakash et al. (2012) in the north Indian Ocean and by 637
Chokngamwong and Chiu (2008) in Thailand. For example, Prakash and Gairola (2014) found 638
that the major differences between TRMM estimates and buoy gauge over the tropical Indian 639
Ocean were found during days of very light precipitation rate (< 0.5 mm.day-1) and higher 640
precipitation rates (> 100 mm.day-1). Huffman et al. (2007) also reported that the TRMM multi-641
satellite precipitation estimates show low skill in correctly specifying light daily rainfall events. 642
Similarly, Habib et al. (2009) showed a considerable overestimation of lower precipitation rates 643
and underestimation of higher precipitation rates by TRMM in the southern US. 644
645
In the study domain, anticyclonic conditions are among the most frequent weather types during 646
winter, representing almost 37% of the winter total days (Vicente-Serrano and Lopez-Moreno, 647
2006). Therefore, it might be expected that the occurrence of intense rain events will be 648
underestimated during these anticyclonic days as a consequence of the dominance of stable cold 649
air masses. Considering that most of the heavy rainfall events will be characterized at small 650
spatial scales, the underestimation of heavy events by TRMM 3B42 can be explained by the 651
inadequate sampling of the microwave sensors over time, which can result in missing these very 652
local and short-duration rain events. The TRMM 3B42 spatial resolution (25 km) is probably 653
inadequate to reproduce local summer extreme precipitation events. The nature of precipitation 654
data might also be another possible explanation of the negative bias of extreme events as the 655
spatial average of heavy events derived from the TRMM 3B42 can be different from that of the 656
observed data. This is simply because rain gauge data were provided at a point scale, whereas 657
TRMM 3B42 data were compiled as grids with a spatial interval of 25 km. These differences 658
might be explained by inherent scale effects, which constrain direct comparison between the 659
point-based station estimates and the TRMM grid outputs. Over the study domain, real-world 660
boundary conditions (e.g., topography, leeside effects and land use/cover changes) may vary 661
over short distances, particularly in mountainous areas. Incorporating such small scale changes 662
and features into TRMM estimates (0.25º by 0.25º pixels) remains a challenge. In contrast to 663
wintertime, the overestimation of the occurrence of high rain events during summer can be seen 664
in the context that summer precipitation is mostly associated with convective activity that 665
exhibits a strong updraft and accordingly a large canopy of colder cloud top temperatures 666
(Goodman et al., 1988). Given that infrared techniques assume that colder cloud-top 667
temperatures are always associated with higher rain rates, heavy precipitation events during 668
summer are more likely to be over-predicted by these techniques. 669

22
5. Conclusions 670
An evaluation of the capabilities of the TRMM 3B42 estimates to reproduce the spatial and 671
temporal characteristics of observed precipitation in north-eastern Iberia, a region characterized 672
by heterogeneous terrain, was undertaken. A total of 12 years of data (1998-2009) from a high-673
density network of rain gauges was employed for the evaluation purpose. The assessment was 674
conducted on a daily basis and considered four sub-regions, which display different and distinct 675
precipitation regimes. The %BIAS, MAE, RMSE and Spearman rho correlation coefficient were 676
derived for the TRMM 3B42 with respect to in-situ rain gauge data. The results indicated that the 677
performance of the TRMM 3B42 is seasonally dependent, with the best results identified in 678
winter and summer rather than in spring and autumn. The comparison of daily data between 679
observations and TRMM 3B42 data yielded reasonable results, with an overall bias of 18.7%. 680
The MAE was found to be less than 2.5 mm.day-1, whereas the RMSE was 6.4 mm.day-1. 681
Spatially, the TRMM 3B42 showed better skill in regions with less precipitation and low altitude 682
(e.g., the Ebro valley), whereas the skill deteriorated along the coastal areas (e.g., the Cantabric 683
region) and in regions of complex terrain (e.g., the Pyrenees). 684
685
A set of skill metrics were also used to evaluate the ability of the TRMM 3B42 to reproduce the 686
occurrence of precipitation at different daily precipitation thresholds. All statistics for daily 687
precipitation agree that the TRMM 3B42 shows reasonable skill for moderate precipitation (5-25 688
mm.day-1), but they sharply decrease at very low (<1 mm.day-1) and upper (more than 50 689
mm.day-1) thresholds. Similarly, TRMM 3B42 underestimated rainfall rates during high 690
precipitation events, whereas it overestimated rainfall during light precipitation events. The 691
performance of the TRMM 3B42 was reversed for the occurrence frequency, with an 692
overestimation of high rain events and an underestimation of light rain events. 693
694
The use of a dense network of precipitation measurements contributes significantly to a detailed 695
regional assessment of the performance of the TRMM 3B42 product in the study domain. In 696
general, the results demonstrate that the TRMM precipitation product shows good agreement 697
with gauge data in inland regions and in areas of low altitude. Nonetheless, the results also 698
confirm the limitations of the TRMM 3B42 precipitation estimates in regions of complex 699
topography. In this regard, other space-based products (e.g., PERSIANN and CMORPH) could 700
be a venue for future research to assess their performance, particularly in response to topography 701

23
and distance to surrounding water bodies across the study domain. Overall, this work highlights 702
the need for improving the algorithms of the TRMM precipitation estimation over areas of 703
heterogeneous terrain in order to better represent medium and high precipitation events. Such 704
improvements are likely to enhance hydrological and meteorological applications in the region, 705
including hydrological modeling, drought assessment, flood forecasting and an examination of 706
the observed impacts of changes in hydroclimatology. 707
708
Acknowledgements 709
Research reported in this publication was supported by the King Abdullah University of Science 710
and Technology (KAUST), Saudi Arabia. This work has also been supported by the research 711
project LIFE12 ENV/ES/000536 (Demonstration and validation of innovative methodology for 712
regional climate change adaptation in the Mediterranean area-LIFE MEDACC) financed by the 713
LIFE program of the European Commission. We acknowledge the National Aeronautics and 714
Space Administration (NASA) for providing the TRMM dataset and the Spanish State 715
Meteorological Agency (AEMET) for providing precipitation observations. 716
717
References 718
Adeyewa, Z. D., and K. Nakamura (2003), Validation of TRMM radar rainfall data over major 719 climatic regions in Africa, Journal of Applied Meteorology, 42(2), 331-347, doi: 720 10.1175/1520-0450. 721
Behrangi, A., B. Khakbaz, T. C. Jaw, A. AghaKouchak, K. L. Hsu, and S. Sorooshian (2011), 722 Hydrologic evaluation of satellite precipitation products over a mid-size basin, Journal of 723 Hydrology, 397(3-4), 225-237, doi: 10.1016/j.jhydrol.2010.11.043. 724
Beguería, S., Sergio M. Vicente-Serrano, Juan I. López-Moreno and García-Ruiz, J.M. (2009). 725 Annual and seasonal mapping of peak intensity, magnitude and duration of extreme 726 precipitation events across a climatic gradient, northeast Spain. Int. J. Climatol. 29: 727 1759–1779. 728
Chen, S., Hong, Y., Gourley, J., Huffman, G., Tian, Y., Cao, Q., Yong, B., Kirstetter, P., Hu, 729 J., Hardy, J., Li, Z., Khan, S., and X Xue (2013). Evaluation of the successive V6 and V7 730 TRMM multisatellite precipitation analysis over the Continental United States, Water 731 Resources Research, 49(12), 8174-8186, doi: 10.1002/2012wr012795. 732
Chokngamwong, R., and L. S. Chiu (2008), Thailand daily rainfall and comparison with TRMM 733 products, Journal of Hydrometeorology, 9(2), 256-266, doi: 10.1175/2007jhm876.1. 734
Duan, Y., A. M. Wilson, and A. P. Barros (2014), Scoping a field experiment: error diagnostics 735 of TRMM precipitation radar estimates in complex terrain as a basis for IPHEx2014, 736 Hydrology and Earth System Sciences Discussions, 11(10), 11137-11182, 737 doi:10.5194/hessd-11-11137-2014. 738
Ebert, E. E., J. E. Janowiak, and C. Kidd (2007), Comparison of near-real-time precipitation 739 estimates from satellite observations and numerical models, Bulletin of the American 740 Meteorological Society, 88(1), 47-64, doi:10.1175/Bams-88-1-47. 741

24
El Kenawy, A, López-Moreno, J. I., Brunsell, N. A., and S. M. Vicente-Serrano (2013), 742 Anomalously severe cold nights and warm days in northeastern Spain: their spatial 743 variability, driving forces and future projections, Global and Planetary Change, 101, 12–744 32. doi:10.1016/j.gloplacha.2012.11.011. 745
Evans, J. P., and M. F. McCabe (2013) Effect of model resolution on a regional climate model 746 simulation over southeast Australia. Clim Res 56:131-145, doi:10.3354/cr01151. 747
Feidas, H., G. Kokolatos, A. Negri, M. Manyin, N. Chrysoulakis, and Y. Kamarianakis (2009), 748 Validation of an infrared-based satellite algorithm to estimate accumulated rainfall over 749 the Mediterranean basin, Theor Appl Climatol, 95(1-2), 91-109, doi:10.1007/s00704-750 007-0360-y. 751
Ferraro, R. R., E. A. Smith, W. Berg, and G. J. Huffman (1998), A screening methodology for 752 passive microwave precipitation retrieval algorithms, Journal of the Atmospheric 753 Sciences, 55(9), 1583-1600, doi:10.1175/1520-0469(1998)055<1583:Asmfpm>2.0.Co;2. 754
Font-Tullot, I. (1983), Climatología de España y Portugal, Sección de Publicaciones del Instituto 755 Nacional de Meteorología, Madrid. 756
Goodman, S. J., D. E. Buechler, and P. J. Meyer (1988), Convective Tendency Images Derived 757 from a Combination of Lightning and Satellite Data, Weather and Forecasting, 3(3), 173-758 188, doi:10.1175/1520-0434. 759
Groisman, P. Y., and D. R. Legates (1994), The Accuracy of United-States Precipitation Data, 760 Bulletin of the American Meteorological Society, 75(2), 215-227, doi:10.1175/1520-761 0477. 762
Habib, E., Henschke A., and R. Adler (2009). Evaluation of TMPA satellite-based research and 763 real-time rainfall estimates during six tropical-related heavy rainfall events over 764 Louisiana, USA, Atmos. Res. 94, 373–388. 765
Heidinger, H., C. Yarleque, A. Posadas, and R. Quiroz (2012), TRMM rainfall correction over 766 the Andean Plateau using wavelet multi-resolution analysis, International Journal of 767 Remote Sensing, 33(14), 4583-4602, doi:10.1080/01431161.2011.652315. 768
Hirpa, F. A., M. Gebremichael, and T. Hopson (2010), Evaluation of High-Resolution Satellite 769 Precipitation Products over Very Complex Terrain in Ethiopia, Journal of Applied 770 Meteorology and Climatology, 49(5), 1044-1051, doi:10.1175/2009jamc2298.1. 771
Huffman, G. J., R. F. Adler, P. Arkin, A. Chang, R. Ferraro, A. Gruber, J. Janowiak, A. McNab, 772 B. Rudolf, and U. Schneider (1997), The Global Precipitation Climatology Project 773 (GPCP) Combined Precipitation Dataset, Bulletin of the American Meteorological 774 Society, 78(1), 5-20, doi:10.1175/1520-0477. 775
Huffman, G. J., R. F. Adler, D. T. Bolvin, G. J. Gu, E. J. Nelkin, K. P. Bowman, Y. Hong, E. F. 776 Stocker, and D. B. Wolff (2007), The TRMM multisatellite precipitation analysis 777 (TMPA): Quasi-global, multiyear, combined-sensor precipitation estimates at fine scales, 778 Journal of Hydrometeorology, 8(1), 38-55, doi:10.1175/Jhm560.1. 779
Huffman, G. J., and Bolvin, D. T. (2008), TRMM and other data precipitation data set 780 documentation (TRMM 3B42 3B43 doc), laboratory for atmospheres, NASA Goddard 781 C825 space flight center and science systems and applications. 782
Huffman, G. J., Bolvin, D.T., (2012), TRMM and other data precipitation data set 783 documentation, (ftp://precip.gsfc.nasa.gov/pub/trmmdocs/3B42_3B43_doc.pdf). Last 784 access (accessed on 13 December 2014). 785
Islam, T., M. A. Rico-Ramirez, D. W. Han, P. K. Srivastava, and A. M. Ishak (2012), 786 Performance evaluation of the TRMM precipitation estimation using ground-based radars 787 from the GPM validation network, Journal of Atmospheric and Solar-Terrestrial Physics, 788 77, 194-208, doi:10.1016/j.jastp.2012.01.001. 789

25
Jobard, I., F. Chopin, J. C. Berges, and R. Roca (2011), An intercomparison of 10-day satellite 790 precipitation products during West African monsoon, International Journal of Remote 791 Sensing, 32(9), 2353-2376, doi:10.1080/01431161003698286. 792
Karaseva, M. O., S. Prakash, and R. M. Gairola (2012), Validation of high-resolution TRMM-793 3B43 precipitation product using rain gauge measurements over Kyrgyzstan, Theor Appl 794 Climatol, 108(1-2), 147-157, doi:10.1007/s00704-011-0509-6. 795
Kidd, C., P. Bauer, J. Turk, G. J. Huffman, R. Joyce, K. L. Hsu, and D. Braithwaite (2012), 796 Intercomparison of High-Resolution Precipitation Products over Northwest Europe, 797 Journal of Hydrometeorology, 13(1), 67-83, doi:10.1175/jhm-d-11-042.1. 798
Kummerow, C., W. Barnes, T. Kozu, J. Shiue, and J. Simpson (1998), The Tropical Rainfall 799 Measuring Mission (TRMM) sensor package, Journal of Atmospheric and Oceanic 800 Technology, 15(3), 809-817, doi:10.1175/1520-0426. 801
Liechti, C. T., J. P. Matos, J. L. Boillat, and A. J. Schleiss (2012), Comparison and evaluation of 802 satellite derived precipitation products for hydrological modeling of the Zambezi River 803 Basin, Hydrol Earth Syst Sc, 16(2), 489-500, doi:10.5194/hess-16-489-2012. 804
Levizzani, V., Bauer, P., Turk, F. Joseph (2007), Measuring Precipitation from Space: 805 EURAINSAT and the Future, 722 pp., Springer. 806
Liu, C., and E. J. Zipser (2013), Why does radar reflectivity tend to increase downward toward 807 the ocean surface, but decrease downward toward the land surface?, Journal of 808 Geophysical Research: Atmospheres, 118(1), 135-148, doi:10.1029/2012jd018134. 809
Lockhoff, M., O. Zolina, C. Simmer, and J. Schulz (2014), Evaluation of Satellite-Retrieved 810 Extreme Precipitation over Europe using Gauge Observations, Journal of Climate, 27(2), 811 607-623, doi:10.1175/jcli-d-13-00194.1. 812
López-Moreno, J.I. and J.M. García-Ruiz (2004), Influence of snow accumulation and snowmelt 813 on streamflow in the Central Spanish Pyrenees. International Journal of Hydrological 814 Sciences49 (5): 787-802. 815
López-Moreno, J. I., S. Goyette, and M. Beniston (2008), Climate change prediction over 816 complex areas: spatial variability of uncertainties and predictions over the Pyrenees from 817 a set of regional climate models, International Journal of Climatology, 28(11), 1535-818 1550, doi:10.1002/joc.1645. 819
López-Moreno, J.I., Vicente-Serrano, S.M., Beguería, S., El Kenawy, A.M., M. Angulo (2010). 820 Trends in daily precipitation on the north-eastern Iberian Peninsula, 1955-821 2006.InternationalJournal of Climatology 120: 248-257. 822
Lorenz, C., and H. Kunstmann (2012), The Hydrological Cycle in Three State-of-the-Art 823 Reanalyses: Intercomparison and Performance Analysis, Journal of Hydrometeorology, 824 13(5), 1397-1420, doi:10.1175/Jhm-D-11-088.1. 825
Masunaga, H., T. Iguchi, R. Oki, and M. Kachi (2002), Comparison of rainfall products derived 826 from TRMM microwave imager and precipitation radar, Journal of Applied Meteorology, 827 41(8), 849-862, doi:10.1175/1520-0450. 828
Mätzler, C., and A. Standley (2000), Technical note: Relief effects for passive microwave remote 829 sensing, International Journal of Remote Sensing, 21(12), 2403-2412, 830 doi:10.1080/01431160050030538. 831
Nicholson, S. E., B. Some, J. McCollum, E. Nelkin, D. Klotter, Y. Berte, B. M. Diallo, I. Gaye, 832 G. Kpabeba, O. Ndiaye, J. N. Noukpozounkou, M. M. Tanu, A. Thiam, A. A. Toure, and 833 A. K. Traore (2003), Validation of TRMM and other rainfall estimates with a high-834 density gauge dataset for West Africa. Part I: Validation of GPCC rainfall product and 835 pre-TRMM satellite and blended products, Journal of Applied Meteorology, 42(10), 836 1337-1354, doi:10.1175/1520-0450. 837

26
Prakash, S., and R. M. Gairola (2014), Validation of TRMM-3B42 precipitation product over the 838 tropical Indian Ocean using rain gauge data from the RAMA buoy array, Theor Appl 839 Climatol, 115(3-4), 451-460, doi:10.1007/s00704-013-0903-3. 840
Prakash, S., A. K. Mitra, I. M. Momin, D. S. Pai, E. N. Rajagopal, and S. Basu (2014), 841 Comparison of TMPA-3B42 versions 6 and 7 Precipitation Products with Gauge based 842 Data over India for the South-West Monsoon Period, Journal of Hydrometeorology, 843 141006071153004, doi:10.1175/jhm-d-14-0024.1. 844
Ramis C, Llasat MC, Genovés A, A. Jansá (1997). The october, 1987 floods in Catalonia: 845 synoptic and meso-scale mechanisms. Meteorological Applications 1: 337–350. 846
Rozante, J. R., and I. F. D. A. Cavalcanti (2008), Regional Eta model experiments: SALLJEX 847 and MCS development, J Geophys Res-Atmos, 113(D17), D17106, Doi 848 10.1029/2007jd009566. 849
Sapiano, M. R. P., and P. A. Arkin (2009), An Intercomparison and Validation of High-850 Resolution Satellite Precipitation Estimates with 3-Hourly Gauge Data, Journal of 851 Hydrometeorology, 10(1), 149-166, doi:10.1175/2008jhm1052.1. 852
Scarsoglio, S., F. Laio, and L. Ridolfi (2013), Climate Dynamics: A Network-Based Approach 853 for the Analysis of Global Precipitation. PLoS ONE 8(8): e71129. doi: 854 10.1371/journal.pone.0071129. 855
Seo, D.J, J. P. Briedenbach, and E. R. Johnson (1999), Real-time estimation of mean field bias in 856 radar rainfall data. J. Hydrol., 223, 131– 147. 857
Shrestha, D., P. Singh, and K. Nakamura (2012), Spatiotemporal variation of rainfall over the 858 central Himalayan region revealed by TRMM Precipitation Radar, J Geophys Res-859 Atmos, 117(D22), D22106, doi 10.1029/2012jd018140. 860
Stampoulis, D., and E. N. Anagnostou (2012), Evaluation of Global Satellite Rainfall Products 861 over Continental Europe, Journal of Hydrometeorology, 13(2), 588-603, 862 doi:10.1175/Jhm-D-11-086.1. 863
Su, F. G., Y. Hong, and D. P. Lettenmaier (2008), Evaluation of TRMM Multisatellite 864 Precipitation Analysis (TMPA) and its utility in hydrologic prediction in the La Plata 865 Basin, Journal of Hydrometeorology, 9(4), 622-640, doi:10.1175/2007jhm944.1. 866
Tarruella, R., J. Jorge (2003). Comparison of three infrared satellite techniques to estimate 867 accumulated rainfall over the Iberian Peninsula. International Journal of Climatology, 23 868 (14), pp. 1757-1769. 869
Vicente-Serrano, S. M., and J. I. Lopez-Moreno (2006), The influence of atmospheric circulation 870 at different spatial scales on winter drought variability through a semi-arid climatic 871 gradient in North-east Spain, International Journal of Climatology, 26(11), 1427-1453, 872 doi:10.1002/Joc.1387. 873
Vicente-Serrano, S. M., S. Begueria, J. I. Lopez-Moreno, M. A. Garcia-Vera, and P. Stepanek 874 (2010), A complete daily precipitation database for north-east Spain: reconstruction, 875 quality control, and homogeneity, International Journal of Climatology, 30(8), 1146-876 1163, doi:10.1002/Joc.1850. 877
Vila, D. A., L. G. G. de Goncalves, D. L. Toll, and J. R. Rozante (2009), Statistical Evaluation of 878 Combined Daily Gauge Observations and Rainfall Satellite Estimates over Continental 879 South America, Journal of Hydrometeorology, 10(2), 533-543, 880 doi:10.1175/2008jhm1048.1. 881
Wilks, D. S. (1995), Statistical methods in the atmospheric sciences. Academic Press, 704pp. 882 Yin, Z. Y., X. Q. Zhang, X. D. Liu, M. Colella, and X. L. Chen (2008), An assessment of the 883
biases of satellite rainfall estimates over the Tibetan Plateau and correction methods 884 based on topographic analysis, Journal of Hydrometeorology, 9(3), 301-326, 885 doi:10.1175/2007jhm903.1. 886

27
Yu, Z., H. Yu, P. Chen, C. Qian, and C. Yue (2009), Verification of Tropical Cyclone–Related 887 Satellite Precipitation Estimates in Mainland China, Journal of Applied Meteorology and 888 Climatology, 48(11), 2227-2241, doi:10.1175/2009jamc2143.1. 889
Zulkafli, Z., W. Buytaert, C. Onof, B. Manz, E. Tarnavsky, W. Lavado, and J.-L. Guyot (2014), 890 A Comparative Performance Analysis of TRMM 3B42 (TMPA) Versions 6 and 7 for 891 Hydrological Applications over Andean–Amazon River Basins, Journal of 892 Hydrometeorology, 15(2), 581-592, doi:10.1175/jhm-d-13-094.1. 893
894 895 896 897 898 899 900 901 902 903 904 905 906 907 908 909 910 911 912 913 914 915 916 917 918 919 920 921 922 923 924 925 926 927 928 929 930 931 932 933 934 935

28
Table I: The structure of the 2 × 2 contingency table summarizing the agreement between 936 rain gauge and TRMM data sets for each precipitation threshold. 937 938 Rain gauge
a b
TR
MM
c Yes “hits” Yes “misses”
d No “false alarms” No “correct negatives” 939 940 941
942
943
944
945
946
947
948
949
950
951
952
953
954
955
956
957
958
959
960
961
962
963
964
965

29
Table II. Spearman rho correlation coefficients calculated between rain gauge and TRMM 966 3B42 data. 967 DJF MAM JJA SON R1 0.71 0.66 0.73 0.72 R2 0.66 0.64 0.73 0.69 R3 0.61 0.60 0.71 0.66 R4 0.47 0.46 0.60 0.54 All domain 0.61 0.59 0.69 0.65
968
969 970 971 972 973 974 975 976 977 978 979 980 981 982 983 984 985 986 987

30
988
Figure 1: The spatial distribution of the 656 rain gauges and topography of the study 989 domain. The Ebro basin is outlined by the bold line. 990 991 992 993 994 995 996 997 998 999 1000 1001 1002
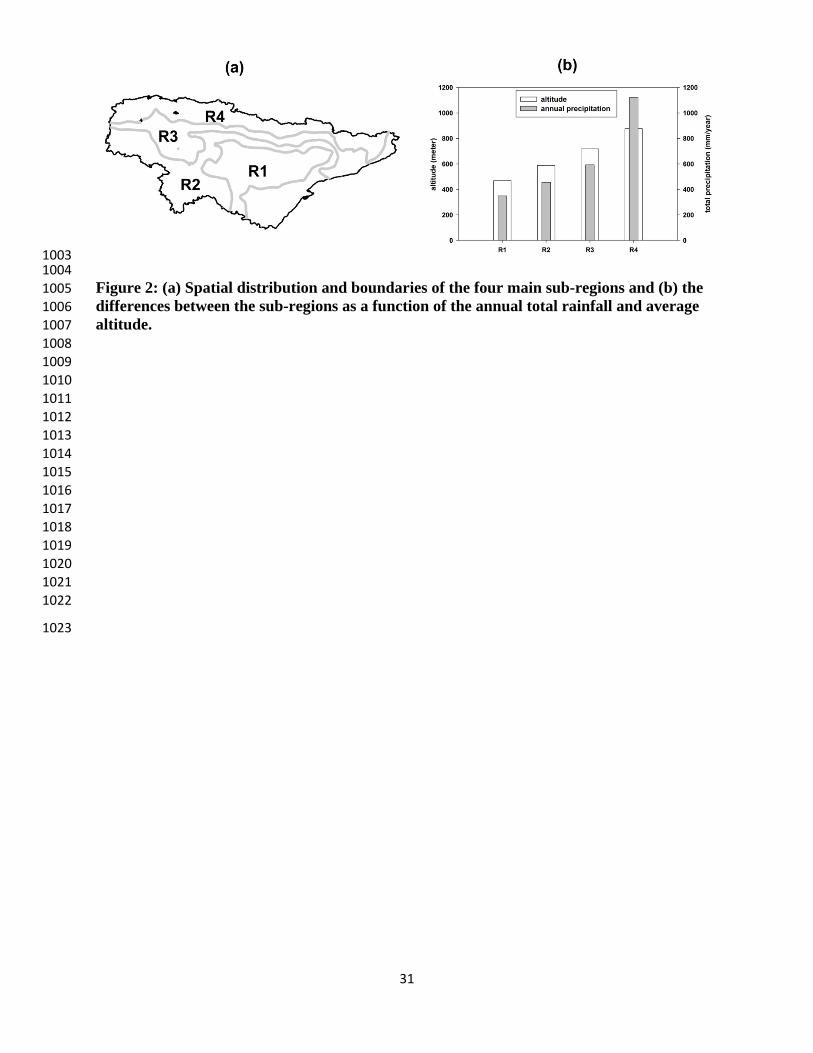
31
1003 1004 Figure 2: (a) Spatial distribution and boundaries of the four main sub-regions and (b) the 1005 differences between the sub-regions as a function of the annual total rainfall and average 1006 altitude. 1007 1008 1009 1010 1011 1012 1013 1014 1015 1016 1017 1018 1019 1020 1021 1022
1023

32
1024
Figure 3: Results of the different validation estimators for each sub-region and for the 1025 whole domain. In the box plots, the central black line indicates the median, whereas the 1026 central blue line refers to the mean. The horizontal lines of each plotted box plot illustrate 1027 the 10th, 25th, 75th and 90th percentiles, respectively. The dashed line in the upper panels 1028 indicates no differences between observed and TRMM data. 1029 1030 1031 1032 1033 1034 1035 1036 1037 1038 1039 1040 1041 1042 1043 1044 1045 1046

33
1047 1048 Figure 4: Monthly variations of Spearman rho coefficient averaged for each sub-region and 1049 for the whole domain. 1050 1051
1052
1053
1054
1055
1056
1057
1058
1059
1060
1061
1062

34
1063
Figure 5: Spatial distribution of the %BIAS averaged for the period 1998-2009. 1064 1065
1066
1067
1068
1069
1070
1071
1072
1073
1074
1075
1076
1077
1078

35
1079
Figure 6: Spatial distribution of the RMSE (mm.day-1) averaged for the period 1998-2009. 1080
1081
1082
1083
1084
1085
1086
1087
1088
1089
1090
1091
1092
1093
1094
1095
1096

36
1097
Figure 7: Scatter plots showing mean seasonal and annual accumulated precipitation (mm) 1098 of rain gauges versus TRMM 3B42 data. Pearson correlation coefficient is also provided 1099 for each season. 1100 1101
1102
1103
1104
1105
1106
1107
1108
1109
1110
1111
1112
1113
1114
1115

37
1116
Figure 8: Cumulative frequency plot for seasonal accumulated precipitation using rain 1117 gauge and TRMM 3B42 data. The vertical blue line indicates the threshold at which the 1118 count of rain gauges showed a reverse behavior compared to TRMM 3B42. 1119 1120
1121
1122
1123
1124
1125
1126
1127
1128
1129
1130
1131
1132

38
1133
Figure 9: Mean annual cycle of precipitation derived from the TRMM 3B42 versus rain 1134 gauge data. Pearson correlation coefficient is also provided for each region. 1135 1136 1137
1138
1139
1140
1141
1142
1143
1144
1145
1146
1147
1148
1149
1150
1151
1152
1153

39
1154
Figure 10: Seasonal and annual results of the different skill metrics for different daily 1155 rainfall thresholds. All of these indicators are averaged for each sub-region as well as the 1156 whole domain. The red line of the FBI panels indicates a perfect skill. 1157

40
1158 1159 Figure 11: Relative contributions (%) of the frequency of occurrence of days at different 1160 thresholds using gauge (green) and TRMM 3B42 (red) data. 1161 1162 1163 1164 1165 1166 1167 1168 1169 1170 1171 1172 1173 1174 1175 1176 1177 1178 1179

41
1180 1181 Figure 12: Relative contributions (%) of daily precipitation to the total precipitation at 1182 different thresholds using gauge (green) and TRMM 3B42 (red) data. 1183 1184 1185 1186 1187 1188 1189 1190 1191 1192 1193 1194 1195 1196 1197 1198 1199 1200 1201 1202 1203 1204 1205 1206 1207 1208 1209 1210