k-12 education mcleary meeting
TRANSCRIPT
K-12 EDUCATION MCCLEARY MEETING
Alan Burke
September 2016

» Goal:
› Inform the Governor’s 2017-19 budget and policy proposals
» Charge:
› Meet with district superintendents and CFOs in each ESD • Governor’s staff are soliciting feedback from educators, community
and business leaders, and advocacy groups
› Summarize comments regarding possible McCleary solutions
› Present findings to Governor’s staff by October 5, 2016
Agenda

» 2012 Compensation Technical Working Group (CTWG)
› Aligns with prototypical school model, HB 2261(2009) and HB 2776 (2010)
› Supported by most major educational groups
» 2011 Levy and Local Effort Assistance Technical Working Group
› Provides options for a new system of K-12 supplemental funding
» SB 6130 and HB 2239 (2015)
› Aligns with CTWG report
» SB 6103, 6104, 6109 (2015)
› Initial proposals on compensation and levy reform
» Proposals to the Education Funding Task Force (2016)
Background Reports and Proposals

Compensation Technical Working Group Executive Summary Page 4
RECOMMENDATIONS SUMMARY The Compensation TWG provides the following recommendations to ensure that Washington fulfills its paramount duty and its ethical imperative to provide all students within its borders the opportunity for an amply funded public education.
Statutory Charge Recommendation Explanation
RCW 28A.400.201(4)(c) “Include a comparison of salaries and other compensation to the appropriate labor market for at least the following subgroups of educators: Beginning teachers and types of educational staff associates.”
1) Increase the Starting Salary for Teachers and Educational Staff Associates to $48,687
The number one priority of the Compensation Technical Working Group is to increase the starting salary of educators to attract a wider pool of the highest quality candidates. By using a comparative labor market analysis based on Bureau of Labor Statistics data, the starting wage for a beginning teacher and educational staff associate (ESA) with a Bachelor’s degree should be increased from $33,401 to $48,687- an additional $15,286 of state funding per beginning educator. Current salary compliance laws will ensure that every beginning teacher and ESA makes at least this amount.
RCW 28A.400.201(3) “conduct or contract for a preliminary comparative labor market analysis of salaries and other compensation for school district employees to be conducted and shall include the results in any reports to the legislature.”
2) Provide Fair Market Based Salary Allocations for all K-12 Staff
The comparative labor market analysis unequivocally confirms that the state does not provide an adequate salary allocation level to attract and retain high-quality staff; therefore, local school district funds must make up the difference to pay competitive wages. The Compensation TWG asserts that K-12 employees require a state salary allocation level comparable to occupations with similar knowledge, skills, abilities and education and training requirements. The detailed recommendations are provided in Exhibit 2.
The Compensation TWG also recommends that the non-school related experience for ESAs be recognized on the state salary allocation model and not be limited to two years as it is in current statute.
Compensation Technical Working Group Executive Summary Page 5
Statutory Charge Recommendation Explanation
RCW 28A.400.201(3) “conduct or contract for a preliminary comparative labor market analysis of salaries and other compensation for school district employees to be conducted and shall include the results in any reports to the legislature.”
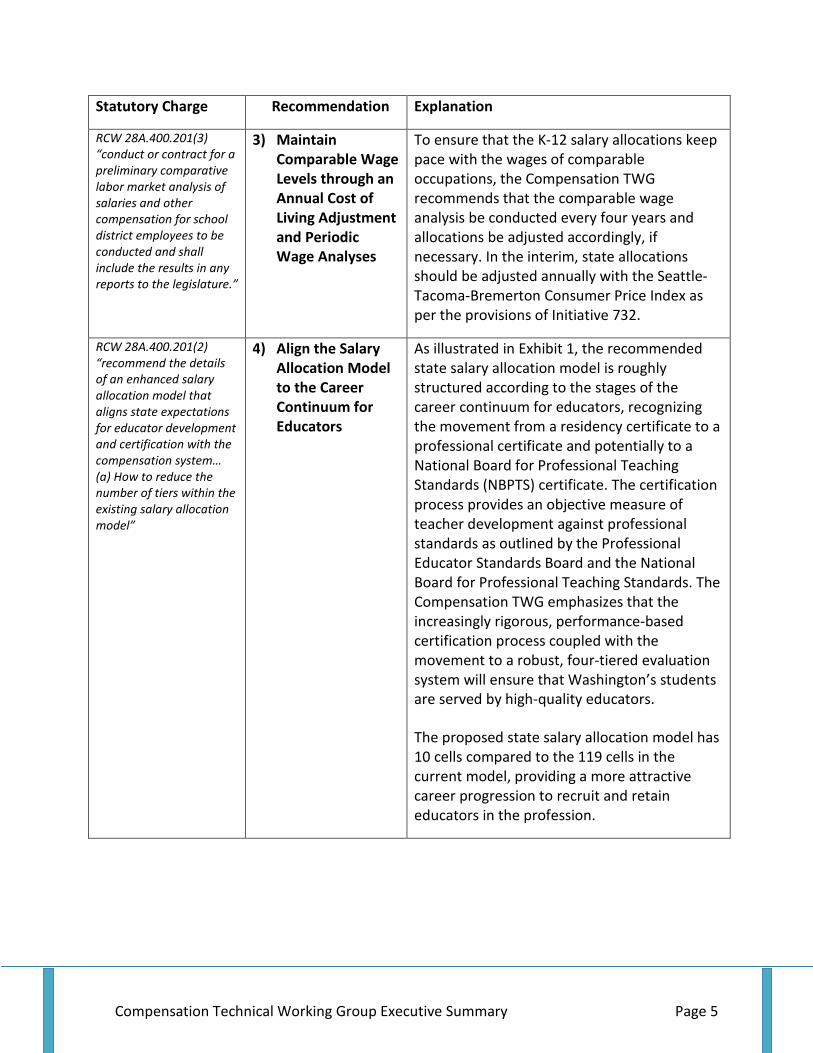
3) Maintain Comparable Wage Levels through an Annual Cost of Living Adjustment and Periodic Wage Analyses
To ensure that the K-12 salary allocations keep pace with the wages of comparable occupations, the Compensation TWG recommends that the comparable wage analysis be conducted every four years and allocations be adjusted accordingly, if necessary. In the interim, state allocations should be adjusted annually with the Seattle-Tacoma-Bremerton Consumer Price Index as per the provisions of Initiative 732.
RCW 28A.400.201(2) “recommend the details of an enhanced salary allocation model that aligns state expectations for educator development and certification with the compensation system… (a) How to reduce the number of tiers within the existing salary allocation model”
4) Align the Salary Allocation Model to the Career Continuum for Educators
As illustrated in Exhibit 1, the recommended state salary allocation model is roughly structured according to the stages of the career continuum for educators, recognizing the movement from a residency certificate to a professional certificate and potentially to a National Board for Professional Teaching Standards (NBPTS) certificate. The certification process provides an objective measure of teacher development against professional standards as outlined by the Professional Educator Standards Board and the National Board for Professional Teaching Standards. The Compensation TWG emphasizes that the increasingly rigorous, performance-based certification process coupled with the movement to a robust, four-tiered evaluation system will ensure that Washington’s students are served by high-quality educators.
The proposed state salary allocation model has 10 cells compared to the 119 cells in the current model, providing a more attractive career progression to recruit and retain educators in the profession.

Legislative Final 2015-17 Omnibus Operating BudgetDate: June 28, 2015Time: 08:06 hours
Table Of Total Base Salaries For Certificated Instructional Staff
For School Year 2016-17
*** Education Experience ***
Years MA+90
of OR
Service BA BA+15 BA+30 BA+45 BA+90 BA+135 MA MA+45 Ph.D.
0 35,700 36,664 37,663 38,665 41,877 43,946 42,801 46,014 48,085
1 36,181 37,158 38,170 39,215 42,461 44,519 43,277 46,523 48,580
2 36,638 37,625 38,648 39,774 43,011 45,090 43,756 46,993 49,073
3 37,110 38,107 39,140 40,302 43,533 45,662 44,210 47,439 49,569
4 37,573 38,613 39,653 40,855 44,104 46,250 44,686 47,936 50,082
5 38,051 39,096 40,146 41,415 44,652 46,841 45,170 48,409 50,597
6 38,542 39,565 40,650 41,982 45,204 47,404 45,666 48,888 51,087
7 39,405 40,443 41,543 42,947 46,218 48,478 46,595 49,863 52,125
8 40,669 41,763 42,889 44,410 47,724 50,068 48,056 51,371 53,714
9 43,131 44,313 45,888 49,280 51,703 49,533 52,926 55,350
10 45,752 47,442 50,879 53,383 51,088 54,526 57,029
11 49,041 52,553 55,107 52,687 56,200 58,753
12 50,590 54,272 56,903 54,350 57,918 60,550
13 56,033 58,742 56,070 59,679 62,388
14 57,803 60,651 57,842 61,565 64,297
15 59,307 62,229 59,345 63,165 65,969
16 or more 60,493 63,472 60,532 64,429 67,288
For credits earned after the BA degree but before the MA degree:
Any credits in excess of 45 may be counted after the MA degree.
LEAP Document 1 is referenced in the Legislative Final 2015-17 Omnibus Operating Budget.

Compensation Technical Working Group
0 - 9 years 4 - 9 years 9 + years
Years of Service
Initial Certification
Professional Certification
Professional Certification
Bachelor’s $48k / Advanced $53k
Bachelor’s $58k / Advanced $63k
Bachelor’s $70k / Advanced $76k
National Board Bonus
$5,000
National Board Bonus
$5,000
Compensation Technical Working Group Executive Summary Page 9
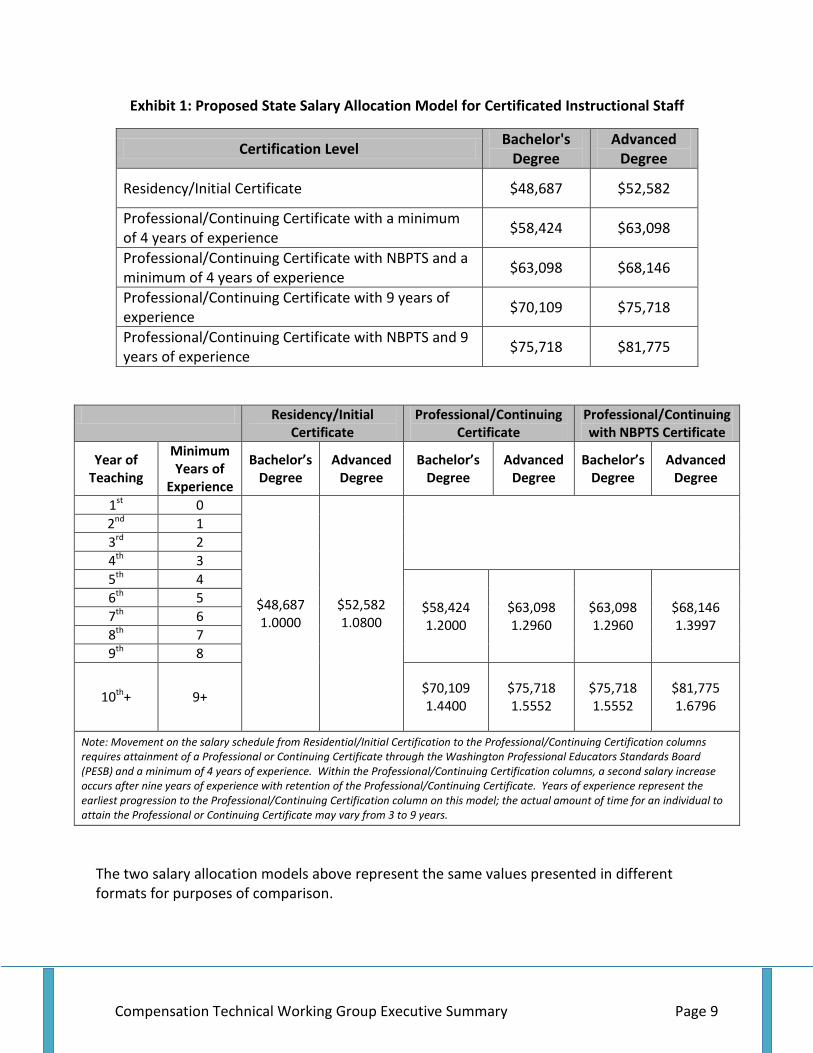
Exhibit 1: Proposed State Salary Allocation Model for Certificated Instructional Staff
Certification Level Bachelor's Degree
Advanced Degree
Residency/Initial Certificate $48,687 $52,582
Professional/Continuing Certificate with a minimum of 4 years of experience $58,424 $63,098
Professional/Continuing Certificate with NBPTS and a minimum of 4 years of experience $63,098 $68,146
Professional/Continuing Certificate with 9 years of experience $70,109 $75,718
Professional/Continuing Certificate with NBPTS and 9 years of experience $75,718 $81,775
Residency/Initial Certificate
Professional/Continuing Certificate
Professional/Continuing with NBPTS Certificate
Year of Teaching
Minimum Years of
Experience
Bachelor’s Degree
Advanced Degree
Bachelor’s Degree
Advanced Degree
Bachelor’s Degree
Advanced Degree
1st 0
$48,687 1.0000
$52,582 1.0800
2nd 1 3rd 2 4th 3 5th 4
$58,424 1.2000
$63,098 1.2960
$63,098 1.2960
$68,146 1.3997
6th 5 7th 6 8th 7 9th 8
10th+ 9+ $70,109 1.4400
$75,718 1.5552
$75,718 1.5552
$81,775 1.6796
Note: Movement on the salary schedule from Residential/Initial Certification to the Professional/Continuing Certification columns requires attainment of a Professional or Continuing Certificate through the Washington Professional Educators Standards Board (PESB) and a minimum of 4 years of experience. Within the Professional/Continuing Certification columns, a second salary increase occurs after nine years of experience with retention of the Professional/Continuing Certificate. Years of experience represent the earliest progression to the Professional/Continuing Certification column on this model; the actual amount of time for an individual to attain the Professional or Continuing Certificate may vary from 3 to 9 years.
The two salary allocation models above represent the same values presented in different formats for purposes of comparison.
Compensation Technical Working Group Executive Summary Page 6
Statutory Charge Recommendation Explanation
RCW 28A.400.201(2) “recommend the details of an enhanced salary allocation model that aligns state expectations for educator development and certification with the compensation system.”
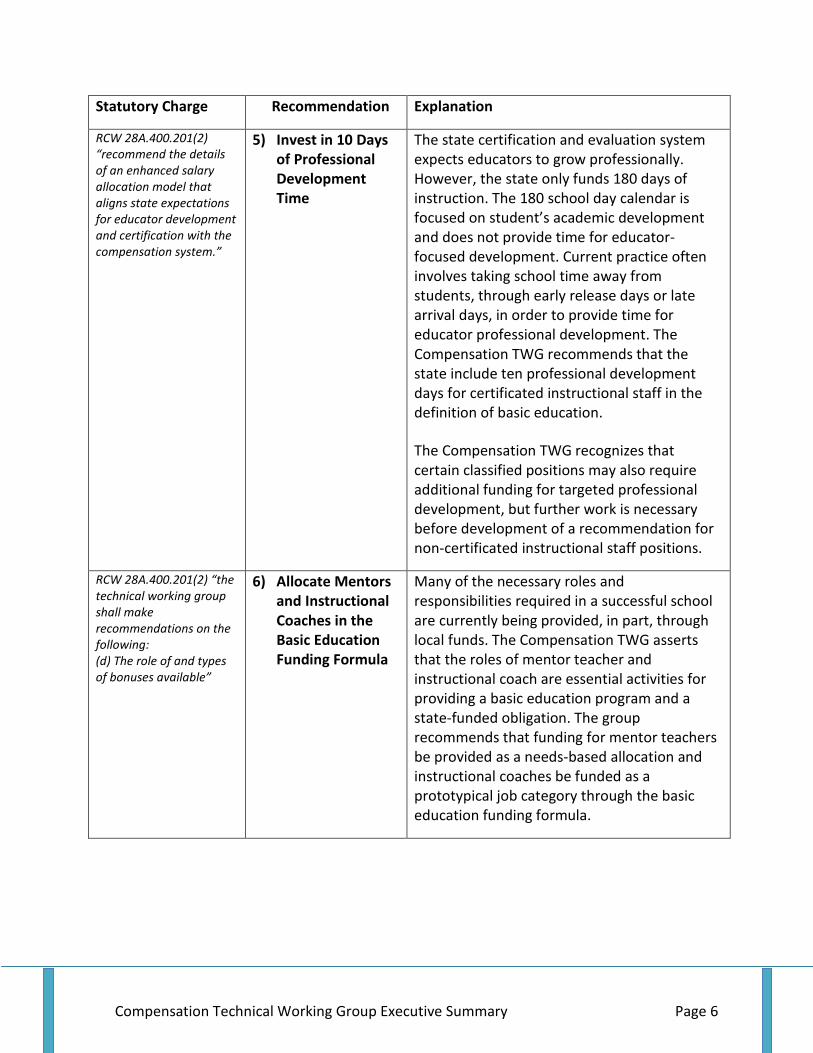
5) Invest in 10 Days of Professional Development Time
The state certification and evaluation system expects educators to grow professionally. However, the state only funds 180 days of instruction. The 180 school day calendar is focused on student’s academic development and does not provide time for educator-focused development. Current practice often involves taking school time away from students, through early release days or late arrival days, in order to provide time for educator professional development. The Compensation TWG recommends that the state include ten professional development days for certificated instructional staff in the definition of basic education.
The Compensation TWG recognizes that certain classified positions may also require additional funding for targeted professional development, but further work is necessary before development of a recommendation for non-certificated instructional staff positions.
RCW 28A.400.201(2) “the technical working group shall make recommendations on the following: (d) The role of and types of bonuses available”
6) Allocate Mentors and Instructional Coaches in the Basic Education Funding Formula
Many of the necessary roles and responsibilities required in a successful school are currently being provided, in part, through local funds. The Compensation TWG asserts that the roles of mentor teacher and instructional coach are essential activities for providing a basic education program and a state-funded obligation. The group recommends that funding for mentor teachers be provided as a needs-based allocation and instructional coaches be funded as a prototypical job category through the basic education funding formula.

Compensation Technical Working Group Executive Summary Page 7
Statutory Charge Recommendation Explanation
RCW 28A.400.201(1) “continuing to attract and retain the highest quality educators will require increased investments.”
7) Provide Appropriate Staffing Levels and Increased Program Support for Basic Education
Working conditions and workload play a significant role in the attraction and retention of staff. The Compensation TWG maintains that sufficiently funded staffing levels and increased program support for struggling students will improve learning opportunities for students and also lead to higher retention of educators. The group proposes that their compensation recommendations occur in tandem with the statutory requirements in SHB 2776 and the basic education funding recommendations proposed by the Quality Education Council (QEC).
RCW 28A.400.201(2) “(b) How to account for labor market adjustments; (c) How to account for different geographic regions of the state where districts may encounter difficulty recruiting and retaining teachers”
8) Amply Fund State Basic Education Salary Allocations and Limit Locally Funded Salary Enhancements to No More than 10% of the State Allocation
The state is responsible for fully funding the salaries of staff performing basic education activities. The Compensation TWG affirms that average comparable wages are sufficient to recruit and retain high-quality staff. However, the group acknowledges that local school districts may have unique circumstances that lead to difficulties recruiting and retaining staff. The group recommends that districts be allowed to provide locally funded salary enhancements for non-basic education functions. However, to address equity concerns, the locally funded expenditures for these salaries should be limited to 10% above the state allocation.

Compensation Technical Working Group Executive Summary Page 8
Statutory Charge Recommendation Explanation
RCW 28A.400.201(2)(f) “including a recognition that staff on the existing salary allocation model would have the option to grandfather in permanently to the existing schedule.”
9) Ensure School Districts Receive the Same or Higher State Salary Allocations per State-Funded Employee
The Compensation TWG recommends that the legislature fully fund the recommendations immediately. At full implementation of the proposed salary allocations, no later than 2018, school districts will receive a higher state salary allocation for every employee and there will be no need for any individual to grandfather into the existing state allocation model. Until the new allocation model is fully funded, school districts should receive the higher allocation from either the old or new state salary allocation model for every state-funded employee.
The Compensation TWG examined comparable wages for all prototypical job categories using multiple methodologies and Washington average wages for similar occupations. These analyses were conducted by outside experts from within and outside Washington State as detailed in Appendix 4. The recommended starting salary in the salary allocation model for certificated instructional staff and the recommended salary allocations for certificated administrative staff and classified staff is based on the comparable wage analysis performed by the Washington Employment Security Department (ESD). The ESD methodology utilizes Washington average wages from the Bureau of Labor Statistics as of May 2011 for similar occupations for each prototypical job category.
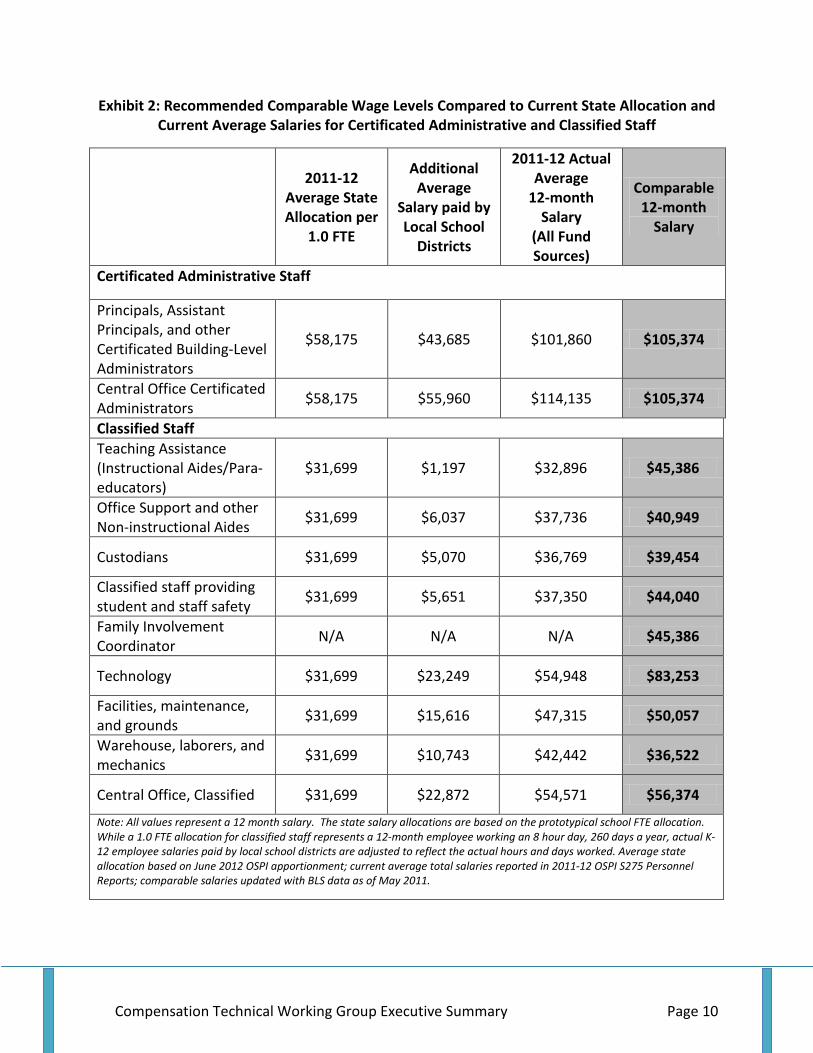
Compensation Technical Working Group Executive Summary Page 10
Exhibit 2: Recommended Comparable Wage Levels Compared to Current State Allocation and Current Average Salaries for Certificated Administrative and Classified Staff
2011-12 Average State Allocation per
1.0 FTE
Additional Average
Salary paid by Local School
Districts
2011-12 Actual Average
12-month Salary
(All Fund Sources)
Comparable 12-month
Salary
Certificated Administrative Staff
Principals, Assistant Principals, and other Certificated Building-Level Administrators
$58,175 $43,685 $101,860 $105,374
Central Office Certificated Administrators $58,175 $55,960 $114,135 $105,374
Classified Staff Teaching Assistance (Instructional Aides/Para-educators)
$31,699 $1,197 $32,896 $45,386
Office Support and other Non-instructional Aides $31,699 $6,037 $37,736 $40,949
Custodians $31,699 $5,070 $36,769 $39,454
Classified staff providing student and staff safety $31,699 $5,651 $37,350 $44,040
Family Involvement Coordinator N/A N/A N/A $45,386
Technology $31,699 $23,249 $54,948 $83,253
Facilities, maintenance, and grounds $31,699 $15,616 $47,315 $50,057
Warehouse, laborers, and mechanics $31,699 $10,743 $42,442 $36,522
Central Office, Classified $31,699 $22,872 $54,571 $56,374
Note: All values represent a 12 month salary. The state salary allocations are based on the prototypical school FTE allocation. While a 1.0 FTE allocation for classified staff represents a 12-month employee working an 8 hour day, 260 days a year, actual K-12 employee salaries paid by local school districts are adjusted to reflect the actual hours and days worked. Average state allocation based on June 2012 OSPI apportionment; current average total salaries reported in 2011-12 OSPI S275 Personnel Reports; comparable salaries updated with BLS data as of May 2011.

Senate Committee Services 1 6/9/2015
Summary of Proposed Substitute Senate Bill 6130 Effective Date
Part I: Basic Education
Specifies "a competitive salary" statewide is basic education and the state's obligation to provide.
Creates a new RCW Chapter for Basic Education statutes.
90 Days
Part II: Accounting and Accountability
Requires school districts to report how state, federal, local revenues are expended and separately account for basic education and non-basic education expenditures.
OSPI must include same on web portal.
90 Days
Directs school districts to include a 4-year budget outlook and enrollment projection in annual budget process.
July 1, 2016
Tasks the state auditor to review the expenditure of local levy funds in the regular financial audits of school districts.
Sept. 1, 2016
Part III: Compensation
Establishes a process for a localization factor for salaries.
Requires a comparable wage analysis every 4 years to maintain competitive salaries.
Immediately
Phases in revised Basic Education salaries for CIS, CAS, CLS through the 2021-22 school year using a revised SAM. Still an allocation model.
Conditions the determination of which inflationary index is used to adjust salaries on whether the comparable wage recommendations are adopted by Legislature.
Recognizes that currently some districts are paying more than comparable wage in the local area and allows districts, during the phase-in of new SAM, to have a "compensation maintenance contract".
Sept. 1, 2018 - Does not take effect unless adequate revenue to fully fund and local levies reduced prior to phase in of compensation changes
Senate Committee Services 2 6/9/2015
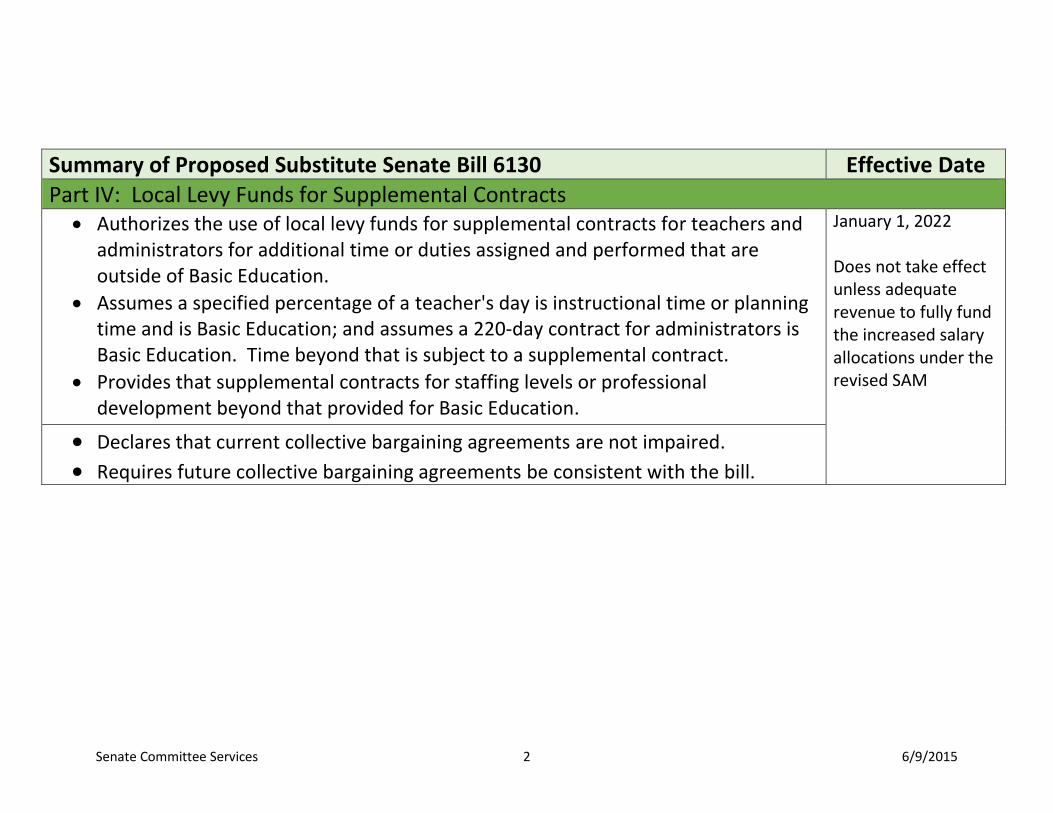
Summary of Proposed Substitute Senate Bill 6130 Effective Date Part IV: Local Levy Funds for Supplemental Contracts
Authorizes the use of local levy funds for supplemental contracts for teachers and administrators for additional time or duties assigned and performed that are outside of Basic Education.
Assumes a specified percentage of a teacher's day is instructional time or planning time and is Basic Education; and assumes a 220-day contract for administrators is Basic Education. Time beyond that is subject to a supplemental contract.
Provides that supplemental contracts for staffing levels or professional development beyond that provided for Basic Education.
January 1, 2022 Does not take effect unless adequate revenue to fully fund the increased salary allocations under the revised SAM
Declares that current collective bargaining agreements are not impaired. Requires future collective bargaining agreements be consistent with the bill.

Senate Committee Services 3 6/9/2015
Summary of Proposed Substitute Senate Bill 6130 Effective Date Part V: Local Levies/Local Effort Assistance
School district local levy base will exclude some basic education enhancements provided after August 31, 2015.
Jan. 1, 2017 Does not take effect unless adequate revenue to fully fund.
For calendar year 2018, the levy lid is adjusted to 26%. LEA is matched at 13%. Beginning in calendar year 2019, Local levy capacity will be reduced by the new
compensation dollars provided. School districts will not be reduced by more than $1/$1.50. School districts may receive additional levy capacity to fund supplemental salaries subject to the approval of OSPI.
LEA is held harmless and provided at the CY 2018 level.
Jan 1. 2018 Does not take effect unless adequate revenue to fully fund.
Local levies are limited to no more than $1/$1.50.
Hold harmless is provided for school districts that may need additional levy capacity to fund supplemental salaries subject to the approval of OSPI. Hold harmless phases out by Jan. 1, 2027.
School districts levying more than $1 must receive new voter approval. LEA will be based on equalizing school districts that levy $1.50 per $1,000 of
assessed value to a statewide average per pupil value.
Jan. 1, 2023 Does not take effect unless adequate revenue to fully fund.
Senate Committee Services 4 6/9/2015
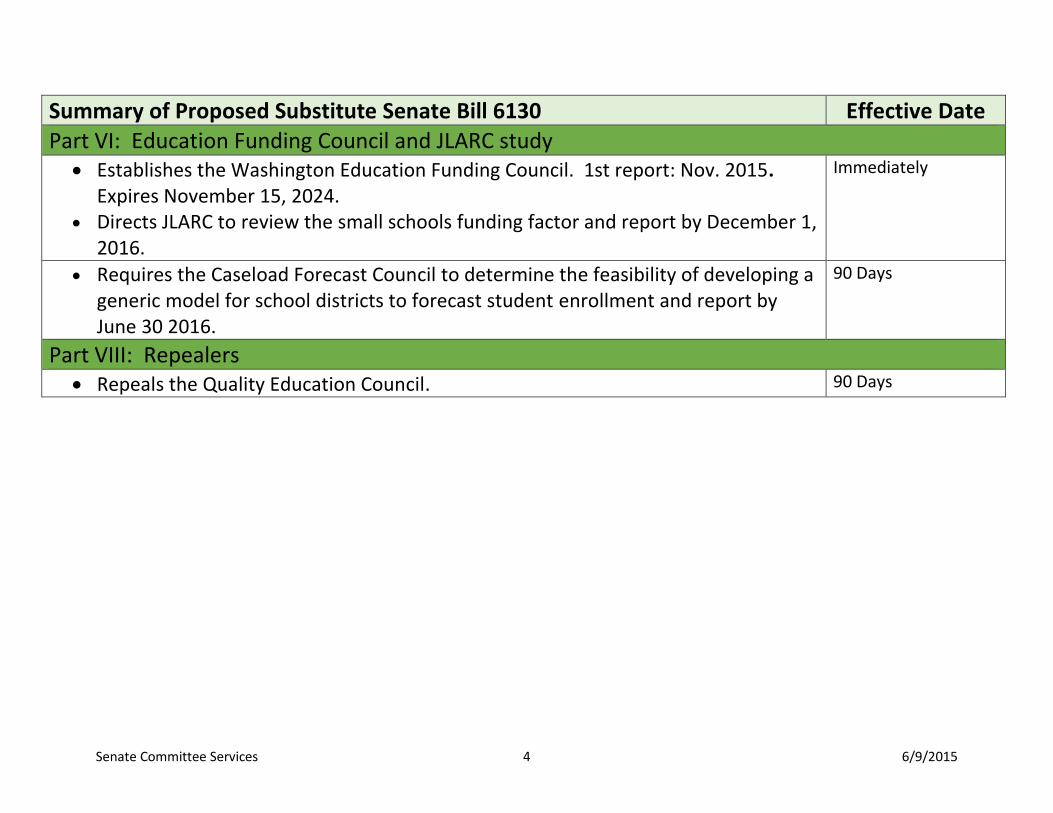
Summary of Proposed Substitute Senate Bill 6130 Effective Date Part VI: Education Funding Council and JLARC study
Establishes the Washington Education Funding Council. 1st report: Nov. 2015. Expires November 15, 2024.
Directs JLARC to review the small schools funding factor and report by December 1, 2016.
Immediately
Requires the Caseload Forecast Council to determine the feasibility of developing a generic model for school districts to forecast student enrollment and report by June 30 2016.
90 Days
Part VIII: Repealers
Repeals the Quality Education Council. 90 Days

Prepared by Jessica Harrell, OPR April 22, 2015 Page 1
SUMMARY OF SELECTED SENATE & HOUSE PROPOSALS RELATED TO K-12 COMPENSATION AND LEVIES B
ill SB 6103
(Sens. Hargrove & Ranker) SB 6104
(Sen. Rolfes, et. al) SB 6109
(Sen. Dammeier, et. al) Rep. Hunter Proposal
Co
mp
ensa
tio
n
Intent section - Legislature intends to implement a plan to phase-in a compensation system for Certificated Instructional Staff (CIS), Classified Staff (CLS), and Certificated Administrative Staff (ADM), to be completed by 2021-22.
Specific changes to compensation are not specified.
Compensation phased in beginning 17-18 SY.
For 2017-19 biennium allocations, CAS increased to $99,765 and CLS are increased to $43,153.
CAS/CLS increased from 2017-19 values to $105,158/$45,486 in equal annual increments with targeted values achieved in 22-23 SY.
CAS/CLS values to be adjusted for I-732.
Specifies CIS salary grid for 17-18 SY through 22-23 SY.
Beginning SY 23-24, uses a modified version of Compensation Technical Work Group (CTWG) salary grid. Extra pay for Master's permitted, but only if relevant to assignment, as locally identified.
During implementation, COLAs only provided to teachers not moving up on the implementation grid. After SY 23-24, COLAs applied to grid.
SY 23-24 CIS: min =$48,000, max = $77,000
District may pay up to 10% above grid with local dollars for non-basic education purposes only.
Compensation phased in beginning in 17-18 SY and completed in 18-19 SY.
CIS salary grid revised to a modified version of the CTWG grid.
Salary levels determined through an Employment Security Department analysis.
Extra pay for Master's permitted, but only if relevant to assignment, as locally determined.
CIS Salaries required to be the salary specified on the grid, beginning September 1, 2017.
Authority to enter into TRI contracts is stricken and replaced with specified limitations of use of local dollars for salary enhancements outside the program of basic education.
Limits district average CAS and CLS pay to state allocation multiplied by the localization factor.
Creates a School Employees Benefit Board.
Eliminates I-732 COLA and states legislative intent to provide a COLA using IPD.
Technical Working Group established to make recommendations to the legislature for a regionalized, market based salary allocation model for all three staff types. Recommendation due by December 2016, and must include: o Market rate in lowest cost district and a
regionalization factor for each district; o Salary grid simplification or elimination; and o Limiting use of school district levies to
enhancements to the program of basic education.
Beginning school year 2018-19, new state K-12 salary allocation model based on the estimated market rate to hire and retain teachers in each school district.
New state funding fully implemented in a single year.
Estimate of market rate salary must be based on data that is repeatable, allowing for review and revision at least every 10 years.
Reg
ion
al
Sala
ry
Allo
cati
on
Does not address regionalization.
Does not address regionalization. Provides that a localization factor must be applied to be the base salary amounts.
Localization factor is to be calculated annually by Employment Sec. Dept. based on comparable occupations by Metropolitan Statistical Area (MSA).
New model to be recommended by Technical Working Group with a regionalization factor for each school district.
Regionalization recommendation must be based on data that is repeatable, allowing for review and revision at least every 10 years.

Prepared by Jessica Harrell, OPR April 22, 2015 Page 2
SUMMARY OF SELECTED SENATE & HOUSE PROPOSALS RELATED TO K-12 COMPENSATION AND LEVIES B
ill SB 6103
(Sens. Hargrove & Ranker) SB 6104
(Sen. Rolfes, et. al) SB 6109
(Sen. Dammeier, et. al) Rep. Hunter Proposal
Sch
oo
l Dis
tric
t M
&O
Lev
y
Beginning CY 2018, M&O levies are reduced by the amount of state funding provided for K-12 salary enhancements in the prior school year.
Levies may not be reduced below a rate of $1.00/$1,000 AAV.
Levy reduction expires after the CY 2022 levy.
Beginning CY 2023, M&O levies are limited to a rate of $1.00/$1,000 AAV.
Levy dollars only permitted for non-basic education enhancements.
For districts grandfathered at a higher lid, new salary allocations are to be considered levy reduction funds, reducing those district's levy.
Levy "cliff" is unchanged.
OFM w/assistance & support of OSPI is directed to convene a levy reduction technical working group to develop a phase-in plan for reducing local levy authority and eliminating grandfather levy authority.
One rep each from OST, DOR, LEAP, SD & ESD finance mgrs., WEA, WSSDA, PSE, etc.
Beginning CY 2018, M&O levies are reduced by the amount of state funding provided for K-12 salary enhancements in the prior school year.
Levies may not be reduced below a rate of $1.25/$1,000 AAV.
Beginning CY 2020, M&O levies are limited to a rate of $1.25/$1,000 AAV.
Levy dollars only permitted for non-basic education enhancements.
CY 2018, M&O levies are reduced by an amount equal to the state appropriated allocation for the new state funding allocated to the district for compensation for SY 2018-19.
CY 2019, the existing M&O system is eliminated and replaced with a lid of $2,500 per pupil, with a limit no less than $100,000.
School districts must request voter approval for collection of the new per pupil levy prior to collection in CY 2019.
Loca
l Eff
ort
Ass
ista
nce
CY 2018 - CY 2022 - LEA is frozen at the level paid to districts for CY 2017.
Beginning CY 2023 - LEA is calculated based on a median per pupil levy rate. Formula: LEA = (median state per pupil levy - district per pupil levy) x district enrollment.
Does not specify changes to the Local Effort Assistance Program.
CY 2018 - CY 2019 - LEA is frozen at the level paid to districts for CY 2017.
Beginning CY 2020 - LEA is calculated based on a median per pupil levy rate. Formula: LEA = (median state per pupil levy - district per pupil levy) x district enrollment.
CY 2018 LEA formula is unchanged from current law. A hold harmless is proved for the SY 2017-18 reduction in LEA related to the transition year.
Beginning in CY 2019, the current LEA system is replaced with a new Lea system that equalizes to one-half of the statewide median M&O levy rate per pupil.
Prepared by Jessica Harrell, OPR April 22, 2015 Page 3
SUMMARY OF SELECTED SENATE & HOUSE PROPOSALS RELATED TO K-12 COMPENSATION AND LEVIES B
ill SB 6103
(Sens. Hargrove & Ranker) SB 6104
(Sen. Rolfes, et. al) SB 6109
(Sen. Dammeier, et. al) Rep. Hunter Proposal
Oth
er
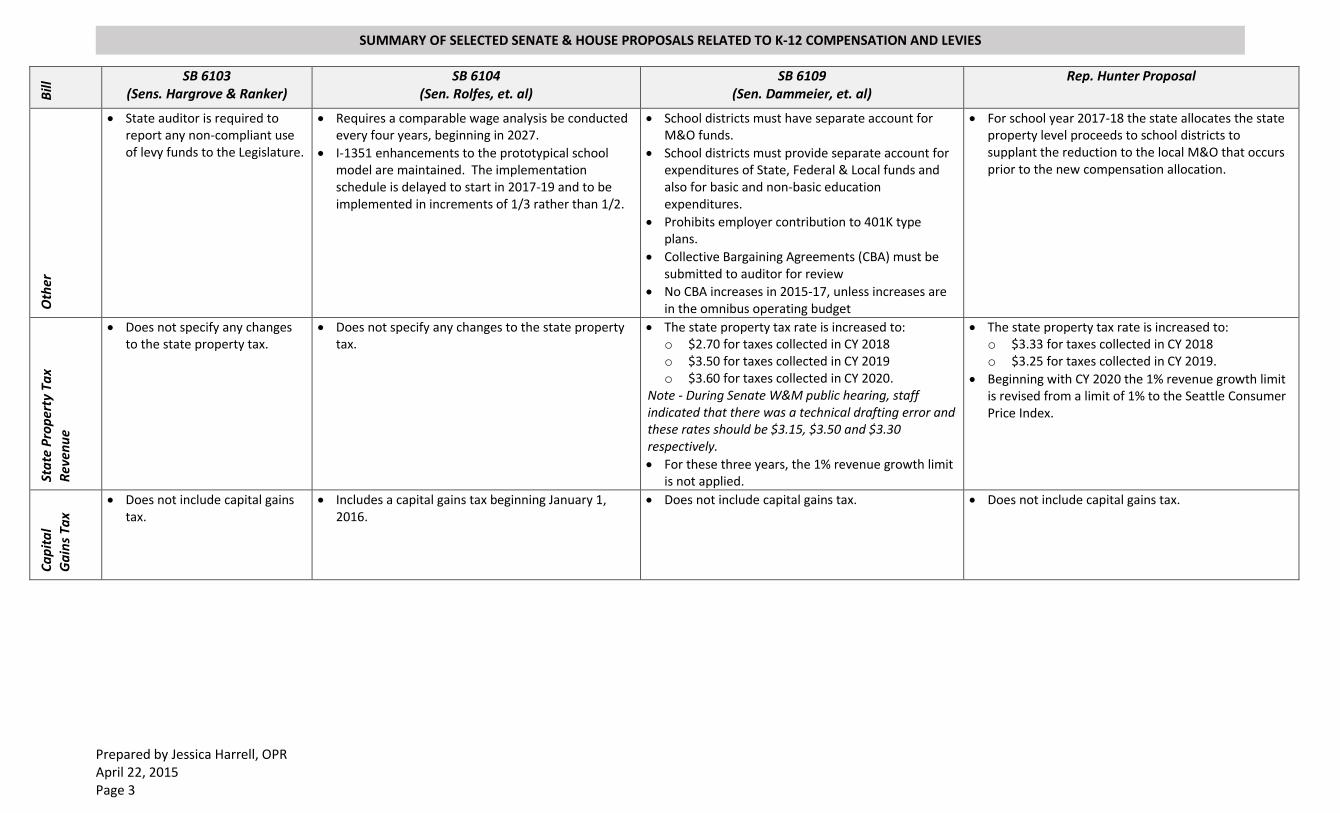
State auditor is required to report any non-compliant use of levy funds to the Legislature.
Requires a comparable wage analysis be conducted every four years, beginning in 2027.
I-1351 enhancements to the prototypical school model are maintained. The implementation schedule is delayed to start in 2017-19 and to be implemented in increments of 1/3 rather than 1/2.
School districts must have separate account for M&O funds.
School districts must provide separate account for expenditures of State, Federal & Local funds and also for basic and non-basic education expenditures.
Prohibits employer contribution to 401K type plans.
Collective Bargaining Agreements (CBA) must be submitted to auditor for review
No CBA increases in 2015-17, unless increases are in the omnibus operating budget
For school year 2017-18 the state allocates the state property level proceeds to school districts to supplant the reduction to the local M&O that occurs prior to the new compensation allocation.
Sta
te P
rop
erty
Ta
x R
even
ue
Does not specify any changes to the state property tax.
Does not specify any changes to the state property tax.
The state property tax rate is increased to: o $2.70 for taxes collected in CY 2018 o $3.50 for taxes collected in CY 2019 o $3.60 for taxes collected in CY 2020.
Note - During Senate W&M public hearing, staff indicated that there was a technical drafting error and these rates should be $3.15, $3.50 and $3.30 respectively.
For these three years, the 1% revenue growth limit is not applied.
The state property tax rate is increased to: o $3.33 for taxes collected in CY 2018 o $3.25 for taxes collected in CY 2019.
Beginning with CY 2020 the 1% revenue growth limit is revised from a limit of 1% to the Seattle Consumer Price Index.
Ca
pit
al
Ga
ins
Tax
Does not include capital gains tax.
Includes a capital gains tax beginning January 1, 2016.
Does not include capital gains tax. Does not include capital gains tax.

AAAApril 21, 2015pril 21, 2015pril 21, 2015pril 21, 2015
Office of Program Research Page 2 |
Potential Items and Options for Consideration by Members when Developing a K-12 Funding Plan:
School District Maintenance and Operation Levies & State Funded Local Effort Assistance School District Maintenance & Operation Levies Local Effort Assistance Other Potential Considerations
Levy Calculations, Limitations & Base Are there changes to the LEA program? a) Should districts report their use of local
M&O levy dollars?
b) What limitations, if any should be placed on
use of levy dollars?
c) Should the state define enrichment?
d) Other
Levy Limitations
a) No change to current statute (28% unless
grandfathered, dropping 4 percentage points in
2018)
b) Set a statewide lid, eliminating all grandfathered
lids
c) Reduce all lids evenly to cap levies at a specified
dollar amount in each district
d) Eliminate all grandfathered lids and reduce lids
to limit statewide total levies to a specified
dollar amount
e) Reduce lids to maintain current levy authority
(or other dollar amount) at a district level,
resulting in different lids throughout the state
f) Eliminate lids entirely, allowing districts to levy
without limitation
g) Per Pupil Specified Rates (Lid is $X/Pupil)
h) Limit based on a levy rate ($X/$1,000 assessed
value)
i) Revise levy base to include or exclude specific
funding sources or state policy dollar amounts
j) Other
a) Maintain current formula (assumes levies
continue to be equalized to 1/2 of the lid)
b) Change equalization rate from an average to a
median
c) Change formula to equalize levies on a per pupil
basis
d) Eliminate LEA
e) Other
State Resources to Fund Increased State
Appropriations for the Program of Basic Education
a) New Revenue
o State Property Tax levy
o Capital Gains tax
o B&O Tax Changes
o Other
b) Reductions to state expenditures in other
program areas
c) Redirect capital budget resources
d) Other

» What is considered in the basic education bucket? › Example: Compensation and health benefits
» What is outside of the basic education bucket? › Example: Athletic coaches and equipment
» What about contextual factors? › Examples: district size, region, program history, competition from
neighboring districts
» Should the definition be narrow or broad? » Is it possible and necessary to define a basic education list?
Definition of Basic Education

OPR/SCS 16
Basic Education Program (RCW 28A.150.200 and 28A.150.220)
• Minimum instructional program of basic education (The opportunity to develop knowledge and skills)
• Instruction in the Essential Academic Learning Requirements • Instruction providing the opportunity to complete 24 credits for high school graduation • Minimum instructional hours: kindergarten: 1000; grades 1- 6: 1000 & grades 9-12: 1080 (district-wide average)
• Minimum school year: 180 days
• Learning Assistance (supplemental instruction & services for underachieving students)
• Special Education (supplemental instruction & services for students with a disability who require special education)
• Transitional Bilingual (supplemental instruction &services for eligible & exited students whose primary language is other than English)
• Highly Capable (programs for highly capable students)
• Student Transportation to and from school
• State institutional educational programs (residential schools, juveniles in detention facilities, juveniles incarcerated in adult correctional facilities)
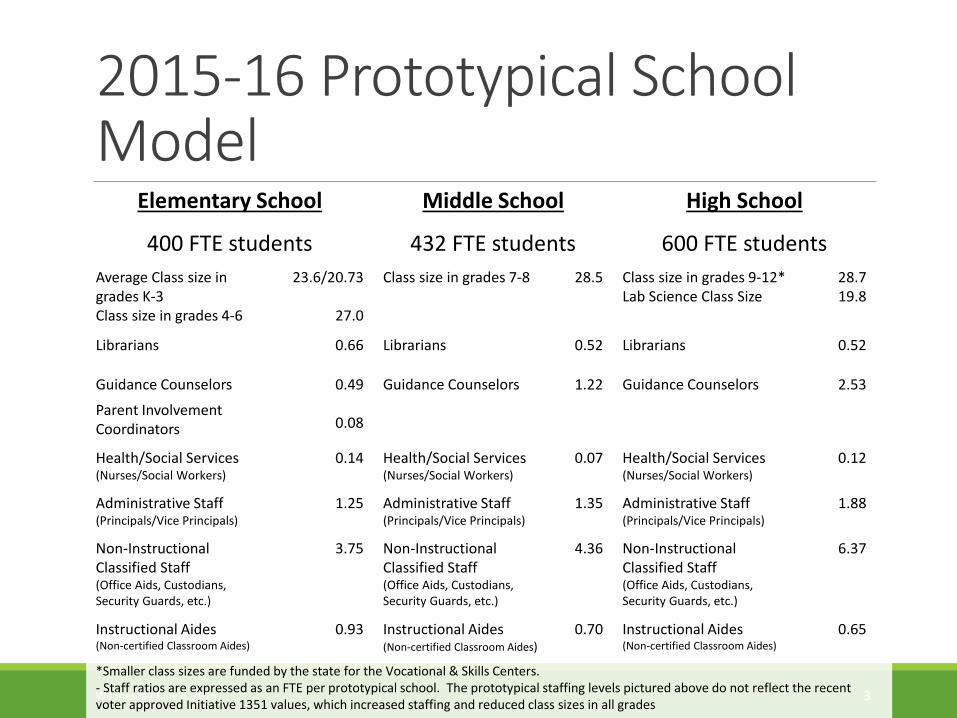
2015-16 Prototypical School Model
Elementary School Middle School High School
400 FTE students 432 FTE students 600 FTE studentsAverage Class size in grades K-3Class size in grades 4-6
23.6/20.73
27.0
Class size in grades 7-8 28.5 Class size in grades 9-12*Lab Science Class Size
28.719.8
Librarians 0.66 Librarians 0.52 Librarians 0.52
Guidance Counselors
Parent Involvement Coordinators
0.49
0.08
Guidance Counselors 1.22 Guidance Counselors 2.53
Health/Social Services(Nurses/Social Workers)
0.14 Health/Social Services(Nurses/Social Workers)
0.07 Health/Social Services(Nurses/Social Workers)
0.12
Administrative Staff(Principals/Vice Principals)
1.25 Administrative Staff(Principals/Vice Principals)
1.35 Administrative Staff(Principals/Vice Principals)
1.88
Non-InstructionalClassified Staff(Office Aids, Custodians, Security Guards, etc.)
3.75 Non-InstructionalClassified Staff(Office Aids, Custodians, Security Guards, etc.)
4.36 Non-InstructionalClassified Staff(Office Aids, Custodians, Security Guards, etc.)
6.37
Instructional Aides(Non-certified Classroom Aides)
0.93 Instructional Aides(Non-certified Classroom Aides)
0.70 Instructional Aides(Non-certified Classroom Aides)
0.65
*Smaller class sizes are funded by the state for the Vocational & Skills Centers. - Staff ratios are expressed as an FTE per prototypical school. The prototypical staffing levels pictured above do not reflect the recent voter approved Initiative 1351 values, which increased staffing and reduced class sizes in all gradesWednesday June 8, 2016 3

2015-16 Prototypical School Model
Wednesday June 8, 2016 4
Additional Time(Additional hours of supplemental
instruction per week)
Materials, Supplies & Operating Costs
Additional Support(Gen. Apportionment Enhancement)
Technology $127.18 Special Education 93.09%
Learning Assistance(LAP) 2.40 hrs Utilities &
Insurance $345.55Central Office & Other
SupportTransitional Bilingual (TBIP) 4.78 hrs Curriculum &
Textbooks $136.54 Central Office(% of school staff units)
5.3%
TBIP Exited Students (NEW) 3.00 hrs Other Supplies &
Library Materials $289.88 District Wide Support(Per 1,000 Students)
Highly Capable 2.16 hrs Professional Development $21.12 Technology Support
Staff 0.63
MSOC 9-12 $166.22 FacilitiesMaintenance $171.19 Facilities, Maintenance
& Grounds 0.34
Security & Central Office $118.60 Warehouse, Laborers, &
Mechanics 1.80
School Year Totals: $1,210.05

» Please complete your survey by September 19 » Email responses to Alan Burke at [email protected] » Questions about the survey? Ask Alan.
Next Steps