june 28, 2011 submitted by robert w. wassmer, … · june 28, 2011 submitted by robert w. wassmer,...
TRANSCRIPT
1
2010-2011 Annual Assessment Report
Department of Public Policy and Administration
California State University, Sacramento
June 28, 2011
Submitted by Robert W. Wassmer, Chairperson
Approved by
All Full-Time PPA Faculty
As requested annually by Academic Affairs at California State University, Sacramento
(Sacramento State), this report offers a description of the Public Policy and Administration
(PPA) Department’s assessment activities during the academic year 2010-2011. Our annual
assessments since 2006-2007 have used a cycle that facilitates continuous review of the PPA
Program and the maintenance of steady progress toward achieving our identified learning
outcomes. In this report, we provide a brief background on the PPA approach to assessment,
updated assessment measures we have gathered for the past academic year, a summary of
conclusions drawn from them by faculty at our annual retreat, and a strategy for using our
assessment findings in the upcoming year. As a matter of transparency, we post this report on
the PPA Website for public viewing. Regarding the options offered by Academic Affairs for

2
submission of assessment reports, we will follow Option 1 and answer the specific questions
required of this option.
Background
The Department of Public Policy and Administration uses a multi-pronged approach to the
assessment of our Master’s Program toward achieving its learning goals. We base all of our
assessment efforts on a matrix of program-level learning objectives (see Table 1 in the
Appendix). From that matrix, we have developed a series of outcomes that then map to specific
objectives in all the core PPA courses we teach (see Table 2 in the Appendix). Each course is
responsible for covering one or more objectives, some in a primary role, others in a secondary
role (as noted by a “P” or “S” in the matrix in Table 1).
Table 3 in the Appendix offers the assignment description that we use to assess the
value added gained by a PPA student in the form of identifying a contemporary administrative or
policy issue and the offering alternative solutions and justifications for what they view as the
“best” solution. The 12 criteria rubric that we use to evaluate the memo that students write in the
first and last class they take as a PPA student is also contained in Table 3. Table 4 in the
Appendix offers the summary scores, as assigned by PPA professors reading the memo, for the
criteria described in Table 3.
Our annual assessment efforts in the past has included two summative measures: (1) an
evaluation of individual course level outcomes to monitor course effectiveness and (2) an
evaluation of policy memos completed by entering and finishing students to provide insight into
value added by completing the entire program. Beginning this academic year, we added an
experimental third measure that consists of an exit survey of students who have just completed
their thesis. They complete a web-based survey at “Survey Monkey” that is designed to assess

3
their final opinion of how they feel they have mastered specific learning objectives (that are
listed in Table 2 in the Appendix) as they leave with all PPA courses and a Master’s thesis
complete. The results of this survey are interesting because they occur after some distance from
when survey responders completed the courses meant to fulfill the learning objectives asked
about. Though experimental at this point, and likely to be altered in the questions it contains, we
find it interesting in part because it allows to determine (all be it for relatively small sample of 16
graduating students) how students’ opinions of their mastery of course learning objectives
change as they get farther distance from the courses. Table 5 in the Appendix contains the
average score on each question (with 5 being the highest) for the 16 graduating PPA students that
took this exit survey in either fall 2010 or spring 2011. Realize that graduating students had
earlier self assessed their mastery of these learning objectives after each class.
On May 25, 2011, we held a daylong department retreat to review this data, draw lessons
from it, and suggest specific curricular adjustments as deemed necessary from the data and our
collaborative discussion of it. Given this background on the PPA assessment process, and the
new data gathered for 2010-2011, the remainder of this report answers the questions posed by
Academic Affairs under Option 1 of how to complete a department assessment report.
What learning objectives did your Department assess in the AY ending June 30, 2011?
As shown in Table 1, PPA learning objectives fall under five broad categories (critical thinking,
integrative thinking, effective communication, understanding professional role, and practical
application). There are multiple other specific categories encompassed by these five. In our
three tools of assessment, these are operationalized through specific course learning objectives
(listed under each course in Table 2), outcomes looked for in briefing memos (given in the

4
assessment rubric in Table 3), and a repeat of course learning objectives asked of students in an
exit survey (see Table 5).
How did you assess these learning outcomes?
We assessed our attainment of these learning objectives in two general ways: (1) through the
collection of students’ opinions on their mastery of these areas after each class and at the
conclusion of the program, and (2) faculty assessments of blinded student memos (both in name
and whether entering or finishing student) written before students begin PPA coursework, and
after they complete it.
Describe the measures you used and the information gathered
We used two survey measures of student opinion on their achievement of learning objectives.
We administered one survey at the end of each class offered this past academic year (see Table
2). For the first, we also asked all graduating students this past academic year to complete an
experimental exit survey that repeated the same questions asked of them at the close of each
class that they had earlier completed (see Table 5). Recorded in the respective tables are the
average value of responses (that could vary between five and one, where five equals
“excellently” and one equals “not accomplished”).
As described in Table 3, we also ask students to write a policy memo at the start of our
Master’s Program (in PPA 200 before instruction begins) and at the end (in PPA 500 before
advise on thesis completion begins). The goal of this process is to assess their ability in doing
this both pre and post the PPA curriculum. PPA faculty then review these memos based upon
the rubric in Table 3, with no student names or status of entering/finishing attached (with a
minimum of two faculty looking at each). Table 4 contains the average scores resulting from

5
this assessment for this academic year (finishing fall 2010 or spring 2011) and for the three
previous academic years.
What did you learn about the program’s success in helping its students achieve these learning outcomes?
In what areas are students doing well and achieving expectations?
Regarding the results in Table 2 for student assessment of PPA core course learning objects at
the time of class completion, we were pleased that the overall average for each course (in red)
was very near 4.0 (“very well” in achieving an objective) or above for all courses. In particular,
for PPA 205, Section 1 (4.55), PPA 220A (4.26); PPA 207 (4.32), PPA 210 (4.4), and PPA 240B
(4.42), the scores in parenthesis indicate that overall, based upon student self assessment, we are
more than just “achieving” our learning expectations and approaching a student average of
“excellently” (5).
Regarding the results in Table 5 for student assessment of PPA core-course learning
objectives at time of graduation, we were pleased that 34 out of the possible 60 student responses
(57%) averaged above 4.0 (“very well” in achieving an objective). Given that these questions
apply to specific course learning objectives, and asked far after most of the courses have been
completed, we believe an average score above 4.0 on any of these specific learning objectives
indicates that students feel we are doing a very good job at achieving them.
Regarding the results in Table 4 that summarize the average scores given by faculty on
student memos written before and after going through the PPA curriculum, we are most pleased
that we have maintained average values of 0.86 and 0.73 in value added (on a four point scale).
This is calculated based upon the overall average score given to fall 2010 (spring 2010) student
memos who had finished the PPA core courses of 2.26 (2.13), as compared to those starting in
6
fall 2010 whose average score was 1.40. At the bottom of Table 4, we also report an impressive
value added of 0.92 for the average value added calculated here for the same student.
So there is clear evidence here that students feel that on average we are achieving our
prescribed learning goals, and that through our own blind reading of pre/post policy memos
students are producing “value added” in terms of improvement in specific learning goals.
Though as discussed next, there may still be room for further improvement.
What areas need improvement within your program?
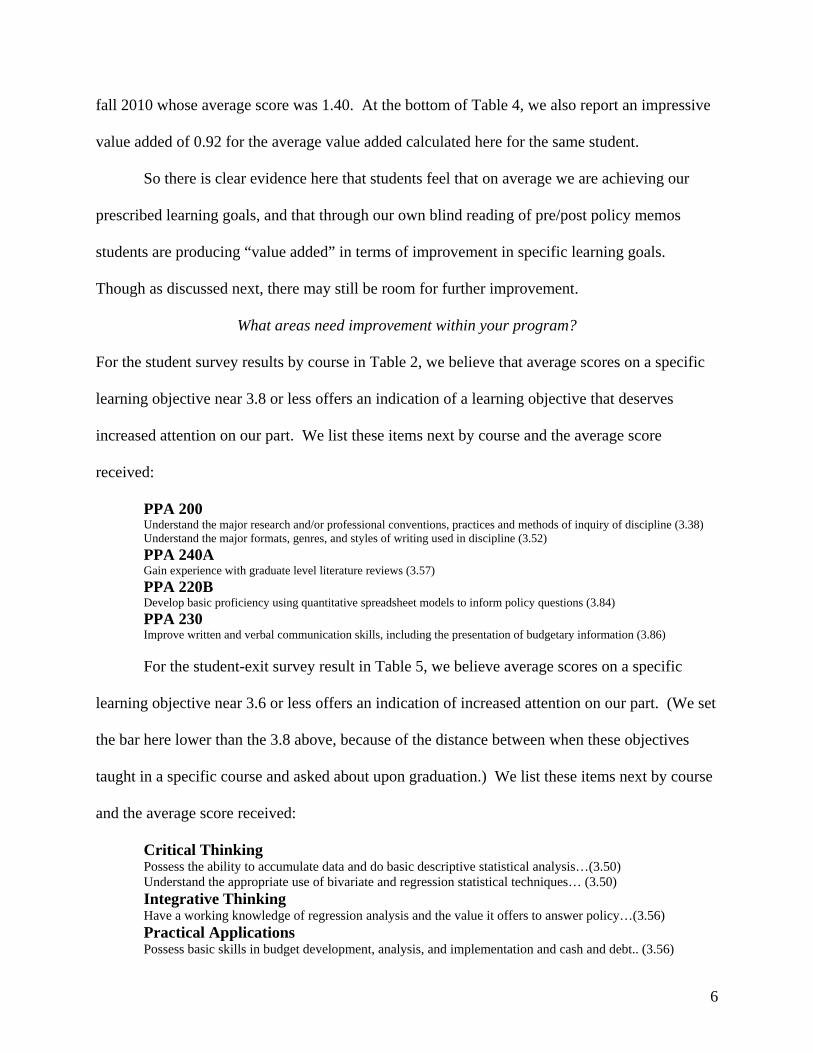
For the student survey results by course in Table 2, we believe that average scores on a specific
learning objective near 3.8 or less offers an indication of a learning objective that deserves
increased attention on our part. We list these items next by course and the average score
received:
PPA 200 Understand the major research and/or professional conventions, practices and methods of inquiry of discipline (3.38)
Understand the major formats, genres, and styles of writing used in discipline (3.52)
PPA 240A Gain experience with graduate level literature reviews (3.57)
PPA 220B Develop basic proficiency using quantitative spreadsheet models to inform policy questions (3.84)
PPA 230 Improve written and verbal communication skills, including the presentation of budgetary information (3.86)
For the student-exit survey result in Table 5, we believe average scores on a specific
learning objective near 3.6 or less offers an indication of increased attention on our part. (We set
the bar here lower than the 3.8 above, because of the distance between when these objectives
taught in a specific course and asked about upon graduation.) We list these items next by course
and the average score received:
Critical Thinking Possess the ability to accumulate data and do basic descriptive statistical analysis…(3.50)
Understand the appropriate use of bivariate and regression statistical techniques… (3.50) Integrative Thinking Have a working knowledge of regression analysis and the value it offers to answer policy…(3.56) Practical Applications Possess basic skills in budget development, analysis, and implementation and cash and debt.. (3.56)

7
Familiar with active listening and HR intervention strategies…(3.00) For the pre- and post-memo assignment results in Table 4, we concentrate on the
“person-to-person” comparison of students. Person-to-person refers to a comparison of the score
given to a particular student’s memo when they first began the PPA Master’s Program in
comparison to the score given to the same person when they wrote a similar memo at the
completion of her PPA core courses. Of possible concern for us are the two lowest valued added
scores of 0.51 for item 6 (Is memo well written?) under effective communication, and 0.70 for
item 5 (Are appropriate economic, political, policy, budget, and/or administrative concepts and
analyses considered?) under integrative thinking.
Because of faculty reflection on these results, are there any program changes anticipated?
After considering the results of possible concern noted above in the achievement of our learning
goals, PPA Faculty generated the following list of specific changes to pursue next year.
The specific concerns raised by students in PPA 200 were likely due to the transition of this course into one that now qualifies for “Graduate Writing Intensive” credit. The course objectives that received the lower scores were added as part of this transition. The instructor has agreed to pay greater attention to helping the students understand the major research and/or professional conventions, practices and methods of inquiry of PPA discipline, and the major formats, genres, and styles of writing used in PPA.
The literature review concerns raised in PPA 240A were likely due to the way of teaching on how to write a literature review in this class not being fully integrated with the way it is also taught in PPA 207. Although this is due in part to a faculty transition instructors of both courses have agreed upon working harder at this integration in the upcoming academic year.
The instructor of 220B felt the concern over spreadsheets is likely the result of some students’ weakness in the basics of Excel at the start of the class. He has agreed to spend more time on reviewing these basics next year.
The instructor of PPA 230 acknowledged the concern over using verbal and written skills in presenting budgetary information in PPA 230. She has agreed to rethink some of her assignments to try and specifically address these concerns.

8
Regarding the low scores registered in the student exit survey, we note that they arose in relation to highly specific skills (statistical analyses, budget analyses, and HR intervention strategies) taught in specific courses, but are less likely to be retained by students not using these skills after they leave the class. The faculty are considering whether a broader measure of knowledge and skills is more appropriate for an exit survey.
The relatively low value added of 0.51 calculated for whether a memo is “well written” is
very likely due to the average value of 1.84 assigned to students in this category at the first memo. This is by far the highest average starting point, and thus perhaps it is not surprising that it grows the least. We specifically screen our admitted students for their strong writing ability, and this statistic likely reflects this result.
We are a bit concerned that students score relatively low on the use of appropriate
economic, policy, politics, budget, and/or administrative concepts in the value added calculated for their memos. However, a key point is that there is still a valued added of 0.70. We flagged this because it was the second lowest value added. Instructors in PPA 200, PPA 210, PPA 220A, and PPA 240 have noted this potential weakness where these conceptual distinctions are taught. They have agreed to try harder to draw such distinctions in their next year’s teaching of these concepts.
How will you know if these changes achieved the desired results?
To see if we have achieved the desired outcomes, we will administer the two assessment
instruments next academic year that we have used for multiple years and check whether there
was any change in the specific issues raised above. We are very likely to change the exit survey
of graduating PPA students to better assess broader learning objectives than just the class
specific ones previously asked.
Did your department engage in any other assessment activities such as the development of rubrics, course alignment? We did begin a discussion of this at our May Retreat that will continue throughout the summer
and into the next academic year as we go through a scheduled Program Review Process in which
we have decided to concentrate on a more thorough review of our academic programs and
assessment.
What assessment activities are planned for the upcoming academic year?

9
See above.

10
APPENDIX
Table 1: PPA Learning Objective Matrix by Core Objectives and Courses
General Specific 200- 205- 207- 210- 220A- 220B- 230- 240A- 240B-
Critical Thinking
problem definition P S P P P S S S
research design and causal inference S P P S S S S
delineation of options P S P S S
implementation considerations S S P S S S
ethical implications of choices S S S P S S S S
Integrative Thinking
(interdisciplinary skill sets economic concepts and analysis S S P P S
brought to bear on public political environment and analysis S S P S S S S S
policy analysis) techniques of policy analysis P S P S
budgeting concepts and budget analysis S S S P
organizational analysis/change/development S S P P
statistical analysis S P S S
Effective Communication for Policy Audiences
report writing P P P S S S S
memo writing S P S S S S
presentation of technical information P S S S S S
oral presentations P S S S S
effective presentations P S S S S

11
Understanding Professional Role 200- 205- 207- 210- 220A- 220B- 230- 240A- 240B-
role of public sector in democratic/market system P S P S
role of nonprofit sector P S S S
California policy context P S S P S S
intergovernmental relations S S P P S
role of policy analyst S P P S P S S
role of public manager S S P P
public sector workplace and role ethics S P S S
Practical Applications
influencing the policy process S P S S S S S
practical problem solving S S P P P
data collection -- how and where to get data P P S S S S S
use of statistical and other data S S P S
benefit/cost analysis P P
group collaboration skills P S S S S S
understanding budgets P S
performance measurement P S P
strategic planning S S P
conflict resolution P S
Key:
P = primary coverage
S = secondary coverage
Blank = not covered

12
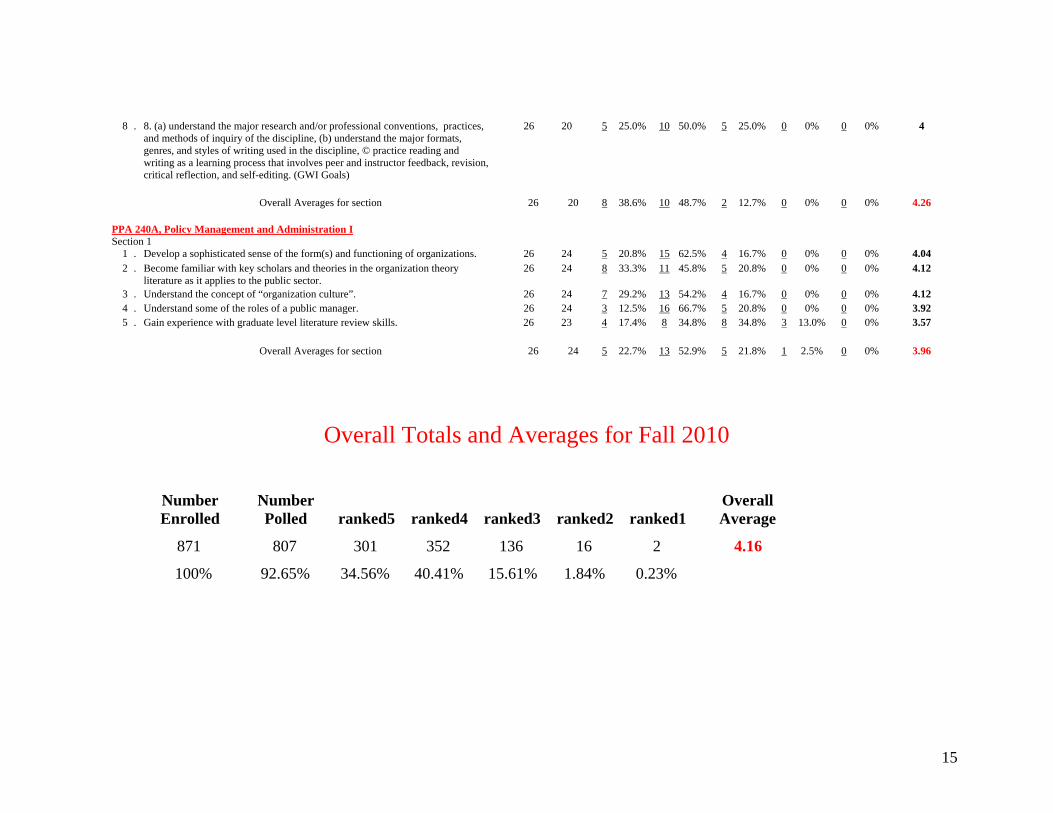
Table 2: PPA Student Assessment of Core Learning Objectives by Course
Results of Course Assessments by Course for Fall 2010
Department of Public Policy and 5 = excellently, 4 = very well, 3 = satisfactorily, 2 = poorly, 1 = not accomplished Administration Ranked Course Learning Objective Enroll Polled 5 4 3 2 1 average PPA 200, Intro to PPA Section 1 1 . Critical thinking and analysis: 24 24 7 29.2% 11 45.8% 6 25.0% 0 0% 0 0% 4.04 Delineate options for solving those problems. 2 . Critical thinking and analysis: 24 24 9 37.5% 10 41.7% 5 20.8% 0 0% 0 0% 4.17 Maintaining a logical relationship between problem and solutions throughout your analysis. 3 . Effective communication for policy audiences: 24 24 7 29.2% 12 50.0% 4 16.7% 1 4.2% 0 0% 4.04 Construct a policy document that is clearly written, and includes data and technical information as appropriate. 4 . Effective communication for policy audiences: 24 24 12 50.0% 7 29.2% 4 16.7% 1 4.2% 0 0% 4.25 Practice giving oral presentations. 5 . Effective communication for policy audiences: 24 24 11 45.8% 11 45.8% 2 8.3% 0 0% 0 0% 4.38 Understand the effective use of oral presentation aids including PowerPoint and handouts. 6 . Understand the different roles of the public, private, and nonprofit sectors. 24 24 14 58.3% 6 25.0% 3 12.5% 1 4.2% 0 0% 4.39 7 . Develop skills in working effectively in groups. 24 24 13 54.2% 9 37.5% 1 4.2% 1 4.2% 0 0% 4.42 8 . Insure you have a baseline understanding of the context for policy analysis in 24 24 12 50.0% 6 25.0% 6 25.0% 0 0% 0 0% 4.25 California. In particular the role of initiatives, fiscal austerity, and changing demographics. 9 . Understand the major research and/or professional conventions, practices, 24 24 2 8.3% 11 45.8% 6 25.0% 4 16.7% 1 4.2% 3.38 and methods of inquiry of the discipline 10 . Understand the major formats, genres, and styles of writing used in the 24 23 2 8.7% 11 47.8% 7 30.4% 3 13.0% 0 0% 3.52 discipline 11 . Practice reading and writing within the discipline 24 23 11 47.8% 9 39.1% 3 13.0% 0 0% 0 0% 4.35 12 . Practice reading and writing as a learning process that involves peer and 24 22 5 22.7% 10 45.5% 7 31.8% 0 0% 0 0% 3.91 instructor feedback, revision, critical reflection, and self-editing Overall Averages for section 24 24 9 37.0% 9 39.8% 4 19.0% 1 0% 0 0% 4.09

13
PPA 205, Research Section 1 1 . Appreciate the importance of the “front end” of research (i.e., research design). 7 7 5 71.4% 2 28.6% 0 0% 0 0% 0 0% 4.71 2 . Appreciate specific design principles that are common to a number of different 7 7 4 57.1% 3 42.9% 0 0% 0 0% 0 0% 4.57 types of research, such as the critical role of theories, hypotheses, and comparisons. 3 . Appreciate the importance of thinking systematically about establishing 7 7 4 57.1% 3 42.9% 0 0% 0 0% 0 0% 4.57 causality.
4 . Understand how to proceed from a concept to a means of measuring the 7 7 4 57.1% 3 42.9% 0 0% 0 0% 0 0% 4.57 concept. 5 . Understand the attributes, advantages, and limitations of various types of data 7 7 4 57.1% 3 42.9% 0 0% 0 0% 0 0% 4.57 collection methods, including: a) experiments; b) surveys; c) field research; d) accessing electronic data archives; and e) conducting historical analysis.
6 . Appreciate how to use simple data analysis techniques to draw tentative 7 7 3 42.9% 4 57.1% 0 0% 0 0% 0 0% 4.43 conclusions. 7 . Understand how to write an effective research proposal. 7 7 3 42.9% 3 42.9% 1 14.3% 0 0% 0 0% 4.29 8 . Appreciate some of the ethical considerations applicable to applied social 7 7 5 71.4% 2 28.6% 0 0% 0 0% 0 0% 4.71 science research. Overall Averages for section 7 7 4 57.1% 3 41.1% 0 0% 0 0% 0 0% 4.55 Section 2 1 . Appreciate the importance of thinking through the entire design of a study 15 15 5 33.3% 9 60.0% 1 6.7% 0 0% 0 0% 4.27 before diving in. 2 . Appreciate specific design principles that are common to a number of different 15 15 8 53.3% 4 26.7% 3 20.0% 0 0% 0 0% 4.33 types of research, such as the critical role of theories and hypotheses.
3 . Understand the main approaches for detecting cause-and-effect relationships 15 15 4 26.7% 7 46.7% 4 26.7% 0 0% 0 0% 4 in scientific research, including those based on experimental and non- experimental designs. 4 . Learn how to proceed from a concept to a variable designed to measure the 15 15 5 33.3% 8 53.3% 1 6.7% 1 6.7% 0 0% 4.13 concept in a valid and reliable fashion. 5 . Understand the advantages and limitations of various types of data collection 15 15 9 60.0% 3 20.0% 3 20.0% 0 0% 0 0% 4.4 methods, including: a) surveys; b) interviews; c) participant observations; d) content analysis, and; e) secondary data. 6 . Understand the differences between descriptive and inferential data analysis, 15 15 7 46.7% 3 20.0% 4 26.7% 1 6.7% 0 0% 4.07 and their implications for research design and data collection. 7 . Learn how to write an effective research proposal. 15 15 7 46.7% 7 46.7% 1 6.7% 0 0% 0 0% 4.4 8 . Appreciate some of the ethical considerations applicable to applied social 15 15 9 60.0% 5 33.3% 1 6.7% 0 0% 0 0% 4.53 science research. 9 . Understand the strengths and limitations of various non-experimental designs 15 15 5 33.3% 7 46.7% 3 20.0% 0 0% 0 0% 4.13 including single case studies, small-n case comparisons, and large-n studies.
10 . Learn the major criticisms of social science, and how to defend or critique a 15 15 2 13.3% 9 60.0% 4 26.7% 0 0% 0 0% 3.87 study

14
from both positivist and post-positivist perspectives. 11 . Become aware of the politics of research, and understand how to position a 15 15 4 26.7% 4 26.7% 7 46.7% 0 0% 0 0% 3.8 study to influence policy decisions. Overall Averages for section 15 15 6 39.4% 6 40.0% 3 19.4% 0 0% 0 0% 4.18 PPA 220A, Applied Economic Analysis I Section 1 1 . Problem definition: Understand the appropriateness of beginning a policy 26 20 9 45.0% 9 45.0% 2 10.0% 0 0% 0 0% 4.35 analysis by first defining the policy prolem in a statement that does not include solution option(s) to the "true" policy problem. (Critical Thinking) 2 . Delineation and evaluation of options: Understand the desirability of offering 26 19 9 47.4% 8 42.1% 2 10.5% 0 0% 0 0% 4.37 multiple solution options to a policy problem and evaluating these options in terms of criteria that include at least measures of efficiency and equity. (Critical Thinking) 3 . Techniques of policy analysis: Understand that wisdom to be drawn upon in 26 20 13 65.0% 7 35.0% 0 0% 0 0% 0 0% 4.65 making policy decisions comes from the market, experts, and politics; that this wisdom is usually conflicted from two of the sources, and mitigated by the third source (as illustrated by Munger's triangle). (Integrative Thinking)
4 . Economic concepts and analysis: Understand that important role that economic 26 20 7 35.0% 12 60.0% 1 5.0% 0 0% 0 0% 4.3 concepts (supply, demand, markets, perfect competition, monopoly, consumer and producer surplus, externalities, public goods, etc.) and thinking (rational prioritization, marginal analysis, quilibrium, probability, time discounting, benefit/cost, "bang for the buck, etc.) play in policy analysis. (Integrative Thinking)
5 . Role of public sector in democratic/market system: Understand that even 26 19 5 26.3% 10 52.6% 4 21.1% 0 0% 0 0% 4.05 competitive market systems can "fail" under certain circumstances (related to market structure, externalities, public goods, and information asymmetry), that a market system offers no guarantee that an outcome is viewed as "equitable" by society, and that the choice of different political institutions in a democracy yield different political/policy outcomes. Thus, there may be a role for public sector involvement in all these areas. (Understanding Professional Role)
6 . Role of policy analyst: Understand that the role of the policy analyst is to offer 26 20 7 35.0% 11 55.0% 2 10.0% 0 0% 0 0% 4.25 advice to policymakers on the desirability of alternative solutions to a policy problem. Both ethics and value neutrality are desired in policy analysis. If personal values enter a policy analysis, they should be noted. (Understanding Professional Role) 7 . Practical problem solving: Be able to conduct a basic policy analysis that 26 20 6 30.0% 10 50.0% 4 20.0% 0 0% 0 0% 4.1 involves the appropriate identification of the problem, the environment and sources of wisdom regarding the problem, solution alternatives, appropriate criteria to evaluate each alternative, and a recommendation on a course of action. (Practical Applications)
15
8 . 8. (a) understand the major research and/or professional conventions, practices, 26 20 5 25.0% 10 50.0% 5 25.0% 0 0% 0 0% 4 and methods of inquiry of the discipline, (b) understand the major formats, genres, and styles of writing used in the discipline, © practice reading and writing as a learning process that involves peer and instructor feedback, revision, critical reflection, and self-editing. (GWI Goals)
Overall Averages for section 26 20 8 38.6% 10 48.7% 2 12.7% 0 0% 0 0% 4.26 PPA 240A, Policy Management and Administration I Section 1 1 . Develop a sophisticated sense of the form(s) and functioning of organizations. 26 24 5 20.8% 15 62.5% 4 16.7% 0 0% 0 0% 4.04 2 . Become familiar with key scholars and theories in the organization theory 26 24 8 33.3% 11 45.8% 5 20.8% 0 0% 0 0% 4.12 literature as it applies to the public sector. 3 . Understand the concept of “organization culture”. 26 24 7 29.2% 13 54.2% 4 16.7% 0 0% 0 0% 4.12 4 . Understand some of the roles of a public manager. 26 24 3 12.5% 16 66.7% 5 20.8% 0 0% 0 0% 3.92 5 . Gain experience with graduate level literature review skills. 26 23 4 17.4% 8 34.8% 8 34.8% 3 13.0% 0 0% 3.57 Overall Averages for section 26 24 5 22.7% 13 52.9% 5 21.8% 1 2.5% 0 0% 3.96
Overall Totals and Averages for Fall 2010
Number Number Overall Enrolled Polled ranked5 ranked4 ranked3 ranked2 ranked1 Average
871 807 301 352 136 16 2 4.16
100% 92.65% 34.56% 40.41% 15.61% 1.84% 0.23%

16
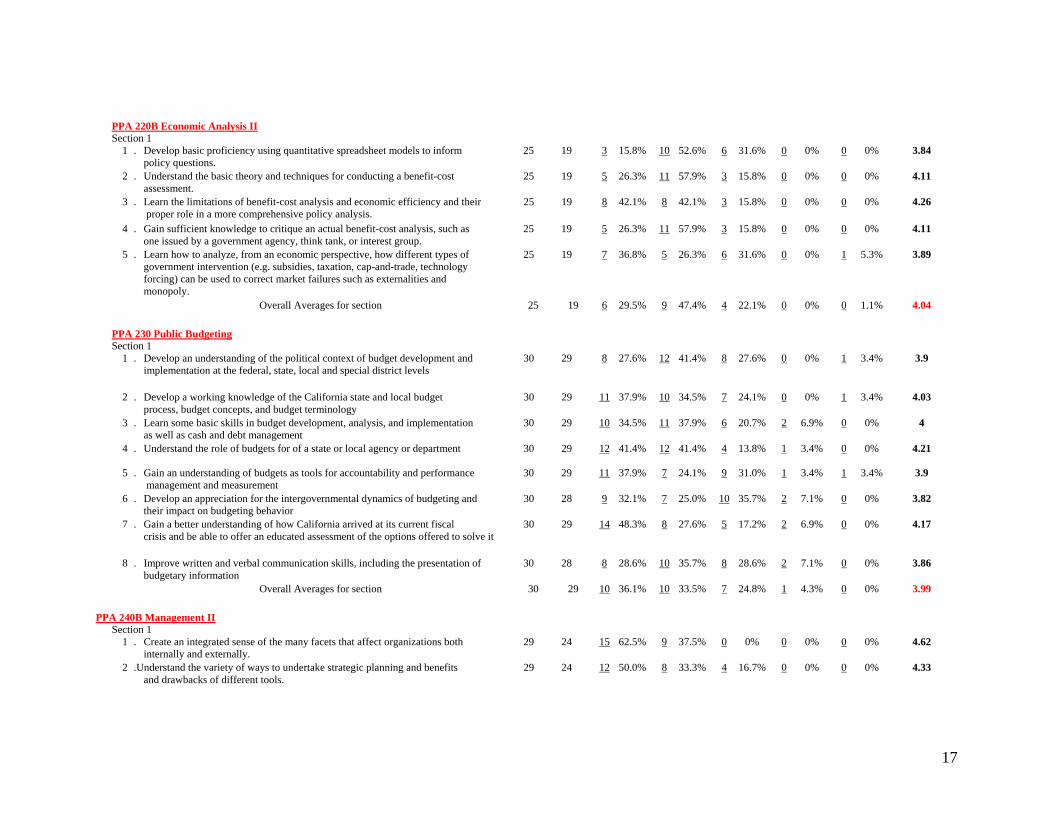
Results of Course Assessments by Course for Spring 2011 Department of Public Policy and 5 = excellently, 4 = very well, 3 = satisfactorily, 2 = poorly, 1 = not accomplished Administration Ranked Course Learning Objective Enroll Polled 5 4 3 2 1 average PPA 207 Quantitative Analysis Section 1 1 . Have a working knowledge of where to begin to gather data for policy analysis. 29 24 13 54.2% 9 37.5% 2 8.3% 0 0% 0 0% 4.46
2 . Possess the ability to accumulate data and do basic descriptive analysis of it 29 24 15 62.5% 6 25.0% 3 12.5% 0 0% 0 0% 4.5 using the Excel spreadsheet program and a more advanced statistical program (STATA). 3 . Understand the importance of causal modeling before undertaking a 29 24 10 41.7% 7 29.2% 7 29.2% 0 0% 0 0% 4.12 statistical analysis. 4 . Understand the appropriate use of multivariate statistical techniques to 29 24 10 41.7% 9 37.5% 5 20.8% 0 0% 0 0% 4.21 identify causal relationships between variables. 5 . Have a working knowledge of regression analysis and the value it offers to 29 24 13 54.2% 8 33.3% 3 12.5% 0 0% 0 0% 4.42 answer policy questions. 6 . Be able to put together a research paper that describes a policy problem and 29 20 8 40.0% 8 40.0% 4 20.0% 0 0% 0 0% 4.2 undertakes a regression based research study to help offer a solution.
Overall Averages for section 29 23 12 49.3% 8 33.6% 4 17.1% 0 0% 0 0% 4.32 PPA 210 Political Env. of Policy Making Section 1 1 . Appreciate the role of the policy community in developing policy options 24 23 14 60.9% 7 30.4% 2 8.7% 0 0% 0 0% 4.52 2 . Be better able to write effective short memos and papers 24 23 9 39.1% 8 34.8% 6 26.1% 0 0% 0 0% 4.13 3 . Engage in more effective policy negotiations than would have been possible at 24 23 10 43.5% 10 43.5% 3 13.0% 0 0% 0 0% 4.3 the beginning of the course 4 . Understand a useful way of thinking about how and why policies are adopted: 24 23 14 60.9% 8 34.8% 1 4.3% 0 0% 0 0% 4.57 the “multiple streams” (Kingdon) model 5 . Understand how policy problems are identified and policies may be attached to 24 23 14 60.9% 8 34.8% 1 4.3% 0 0% 0 0% 4.57 them 6 . Understand how problems are framed more or less effectively 24 23 14 60.9% 8 34.8% 1 4.3% 0 0% 0 0% 4.57 7 . Understand key ethical frameworks for assessing public policy choices 24 23 11 47.8% 8 34.8% 4 17.4% 0 0% 0 0% 4.3 8 . Understand the critical role of “policy entrepreneurs” in policy development 24 22 11 50.0% 8 36.4% 3 13.6% 0 0% 0 0% 4.36
9 . Understand the ethical subtleties of professional role obligations 24 23 10 43.5% 6 26.1% 6 26.1% 0 0% 1 4.3% 4.04 10 . Understand California’s unique political features and how they impact the 24 21 15 71.4% 5 23.8% 1 4.8% 0 0% 0 0% 4.67 policy process Overall Averages for section 24 23 12 53.7% 8 33.5% 3 12.3% 0 0% 0 0% 4.4
17
PPA 220B Economic Analysis II Section 1 1 . Develop basic proficiency using quantitative spreadsheet models to inform 25 19 3 15.8% 10 52.6% 6 31.6% 0 0% 0 0% 3.84 policy questions. 2 . Understand the basic theory and techniques for conducting a benefit-cost 25 19 5 26.3% 11 57.9% 3 15.8% 0 0% 0 0% 4.11 assessment. 3 . Learn the limitations of benefit-cost analysis and economic efficiency and their 25 19 8 42.1% 8 42.1% 3 15.8% 0 0% 0 0% 4.26 proper role in a more comprehensive policy analysis.
4 . Gain sufficient knowledge to critique an actual benefit-cost analysis, such as 25 19 5 26.3% 11 57.9% 3 15.8% 0 0% 0 0% 4.11 one issued by a government agency, think tank, or interest group. 5 . Learn how to analyze, from an economic perspective, how different types of 25 19 7 36.8% 5 26.3% 6 31.6% 0 0% 1 5.3% 3.89 government intervention (e.g. subsidies, taxation, cap-and-trade, technology forcing) can be used to correct market failures such as externalities and monopoly. Overall Averages for section 25 19 6 29.5% 9 47.4% 4 22.1% 0 0% 0 1.1% 4.04 PPA 230 Public Budgeting Section 1 1 . Develop an understanding of the political context of budget development and 30 29 8 27.6% 12 41.4% 8 27.6% 0 0% 1 3.4% 3.9 implementation at the federal, state, local and special district levels
2 . Develop a working knowledge of the California state and local budget 30 29 11 37.9% 10 34.5% 7 24.1% 0 0% 1 3.4% 4.03 process, budget concepts, and budget terminology 3 . Learn some basic skills in budget development, analysis, and implementation 30 29 10 34.5% 11 37.9% 6 20.7% 2 6.9% 0 0% 4 as well as cash and debt management 4 . Understand the role of budgets for of a state or local agency or department 30 29 12 41.4% 12 41.4% 4 13.8% 1 3.4% 0 0% 4.21
5 . Gain an understanding of budgets as tools for accountability and performance 30 29 11 37.9% 7 24.1% 9 31.0% 1 3.4% 1 3.4% 3.9 management and measurement 6 . Develop an appreciation for the intergovernmental dynamics of budgeting and 30 28 9 32.1% 7 25.0% 10 35.7% 2 7.1% 0 0% 3.82 their impact on budgeting behavior 7 . Gain a better understanding of how California arrived at its current fiscal 30 29 14 48.3% 8 27.6% 5 17.2% 2 6.9% 0 0% 4.17 crisis and be able to offer an educated assessment of the options offered to solve it
8 . Improve written and verbal communication skills, including the presentation of 30 28 8 28.6% 10 35.7% 8 28.6% 2 7.1% 0 0% 3.86 budgetary information Overall Averages for section 30 29 10 36.1% 10 33.5% 7 24.8% 1 4.3% 0 0% 3.99 PPA 240B Management II Section 1 1 . Create an integrated sense of the many facets that affect organizations both 29 24 15 62.5% 9 37.5% 0 0% 0 0% 0 0% 4.62 internally and externally. 2 .Understand the variety of ways to undertake strategic planning and benefits 29 24 12 50.0% 8 33.3% 4 16.7% 0 0% 0 0% 4.33 and drawbacks of different tools.

18
3 . Understand the way performance measurements are used and misused. 29 24 10 41.7% 9 37.5% 5 20.8% 0 0% 0 0% 4.21
4 . Understand the circumstances under which organizations change and how 29 24 13 54.2% 7 29.2% 3 12.5% 1 4.2% 0 0% 4.33 change can be managed and directed. 5 . Gain comfort in the skill of assessing “what is going on” in real organizations 29 24 16 66.7% 6 25.0% 2 8.3% 0 0% 0 0% 4.58 at a macro-level – especially your comfort and competence using written documentation (web sites, budgets, strategic plans, annual reports etc.) to learn about organizations. Overall Averages for section 29 24 13 55.0% 8 32.5% 3 11.7% 0 0% 0 0% 4.42
Overall Totals and Averages for Spring 2011
Number Number Overall Enrolled Polled ranked5 ranked4 ranked3 ranked2 ranked1 Average
924 812 368 284 144 11 5 4.23
100% 87.88% 39.83% 30.74% 15.58% 1.19% 0.54%

19
Table 3: PPA Policy Memo Description and Evaluation Rubric Assignment Description: Identify a current public (governmental) problem/issue that you have some interest in and provide a decision maker with a briefing memo about the issue and possible options to deal with it. As appropriate, consider the economic, political, organizational and policy dimensions of the issue. Help the reader understand the complexities of the issue as well as how the issue may be understood differently by different groups of interested people. Be careful to distinguish between fact and opinion in your analysis. How you would recommend appropriate option(s) to deal with chosen problem/issue. Note: When assigning points for each category where the term “appropriate” used in assessment measure, if a student has appropriately left out this category in their memo, they should receive three points.
Rubric for evaluating PPA briefing memos
Missing (Zero Point)
Included but unsatisfactory (One Point)
Satisfactory (Two Points)
Very well done (Three Points)
Critical Thinking (1) Is the problem/issue well defined? (2) Are possible options described?
(3) Appropriate research design/causal inference to examine options?
(4) Are
Problem/issue identified but real problems in clarity. Some options described, but not enough and/or could be stated much more clearly. Some mention of design/inference to explore options, but much improvement needed. A brief mention
Problem/issue identified clearly but could be improved upon. Reasonable amount of options stated, but could be improved upon. Design/inference mentioned and a specific plan of carrying out described, but could be improved upon. Implementation issues adequately
A full appropriate problem/issue statement included. Amount and clarity of options highly appropriate. Design/inference covered and plan to carry out is highly appropriate. Issues of

20
implementation issues considered regarding options?
of implementation issues, but problems in thinking about and/or much more needed.
covered, but room for improvement in how described.
implementation of options fully covered in an appropriate manner.
Integrative thinking 5) Are appropriate economic, political, policy, budget, and/or administrative concepts and analyses considered?
A mention of some of these concepts, but not adequate and/or mistakenly applied.
All appropriate concepts described, but mistakes/ confusion in application.
All concepts considered; little room for improvement.
Effective communication (6) Is memo well written? 7) Is previous findings and technical info appropriately presented?
Written at a minimally acceptable level. Grammatical, organization, and/or style concerns remain. Minimal previous findings and tech info, but much more needed.
Written at a basic level appropriate for someone earning a Master’s degree. Still room for some minor improvements. Previous findings and tech info offered at an acceptable level, but still room for improvement.
Superb writing. No concerns and a pleasure to read. Appropriate amount of previous findings and tech info included. The issue is framed well by this inclusion.
Professional role (8) Is the role of public and/or non-profit sector appropriately recognized? (9) Does it integrate the political context?
Role of public/non-profit sector mentioned, but in far too little detail. The politics surrounding the chosen
Public/non-profit sector role described adequately, but could improve upon and/or something left out. A serious attempt is made to integrate the
Excellent coverage of these sectors in memo in a manner that fully clarifies their role. Political context is appropriately and fully

21
(10) Are intergovernmental dimensions appropriately considered?
problem/issue are only mentioned, but covered in far too little detail. Intergovernmental dimensions are only mentioned in passing.
political context of the problem/issue but still lacking in some way. A serious attempt is made to discuss the intergovernmental issues, but it is still lacking in some way.
described. Intergovernmental issues are appropriately covered and there is little to criticize.
Practical applications (11) Does it describe the practical considerations to influencing the policy process? (12) Is data appropriately used?
Brief mention of practical considerations, but by far not enough. Very limited mention of data, but does little to help clarify the issue/problem.
Practical considerations are described, but still lacking in form of not fully enough or mistakes made. Data is used throughout memo, but could use could be improved upon by more appropriate choices to include or application of data.
Practical considerations fully described in appropriate manner and very little are left out. Data is integrated into the memo in a manner that helps illuminate the issue/problem and very little could be improved upon.

22
Table 4: Summary of Faculty Assessment of Student Pre and Post Policy Memos
Critical Thinking Integrative Thinking Effective Communication Professional Role Practical Applications
(1) (2) (3) (4) (5) (6) (7) (8) (9) (10) (11) (12) Average Difference
Entering 2010-2011 1.52 1.27 0.92 1.20 1.32 1.64 1.62 1.59 1.44 1.55 1.29 1.39 1.40 scale of 0-3
Finishing Fall 2010 2.50 2.40 1.90 2.20 2.10 2.20 2.20 2.10 2.40 2.50 2.10 2.20 2.26 0.86 scale of 0-3
Finishing Spring 2011 2.42 2.14 1.71 1.85 2.05 2.37 2.22 2.22 2.14 2.12 2.12 2.20 2.13 0.73 scale of 0-3
Entering 2009-2010 1.58 1.33 0.96 1.11 1.42 1.84 1.35 1.16 1.21 0.88 1.30 1.30 1.28 scale of 0-3
Finishing Fall 2009 2.45 1.85 1.70 2.20 2.20 2.40 2.15 2.05 2.00 1.90 1.75 2.00 2.05 0.77 scale of 0-3
Finishing Spring 2010 2.36 1.95 1.82 2.14 2.18 2.64 2.14 2.14 2.32 2.00 2.23 2.18 2.17 0.83 scale of 0-3
Entering 2008-2009 1.69 1.16 0.81 0.91 1.24 1.80 1.51 1.34 1.04 0.92 0.76 1.22 1.24 scale of 0-3
Finishing Fall 2008 2.18 1.94 1.82 2.00 2.06 2.29 2.18 2.12 2.06 2.06 1.82 1.76 2.02 0.78 scale of 0-3
Finishing Spring 2009 2.59 2.30 1.81 1.78 1.78 2.11 2.04 1.96 1.85 1.70 1.63 1.93 1.96 0.75 scale of 0-3
Entering 2007-2008 0.52 0.41 0.48 0.52 0.70 0.89 0.56 0.44 0.41 0.74 0.44 0.59 0.56 scale of 0-2
Finishing 2007-2008 1.07 0.65 1.00 1.04 1.23 1.18 1.12 0.95 1.25 1.25 0.98 0.79 1.04 0.80 scale of 0-2
Summary of Person to Person Comparison of Students Entering and Exiting
Critical Thinking Integrative Thinking Effective Communication Professional Role Practical Applications
(1) (2) (3) (4) (5) (6) (7) (8) (9) (10) (11) (12) Average Difference
Averages 2010-2011 2.44 2.18 1.74 1.90 2.06 2.35 2.22 2.20 2.18 2.18 2.12 2.20 2.15
Entering scores 1.67 1.30 0.95 1.05 1.36 1.84 1.42 1.28 1.00 1.02 0.96 1.17 1.23 0.92
difference 0.77 0.88 0.79 0.85 0.70 0.51 0.80 0.93 1.17 1.16 1.16 1.04
23
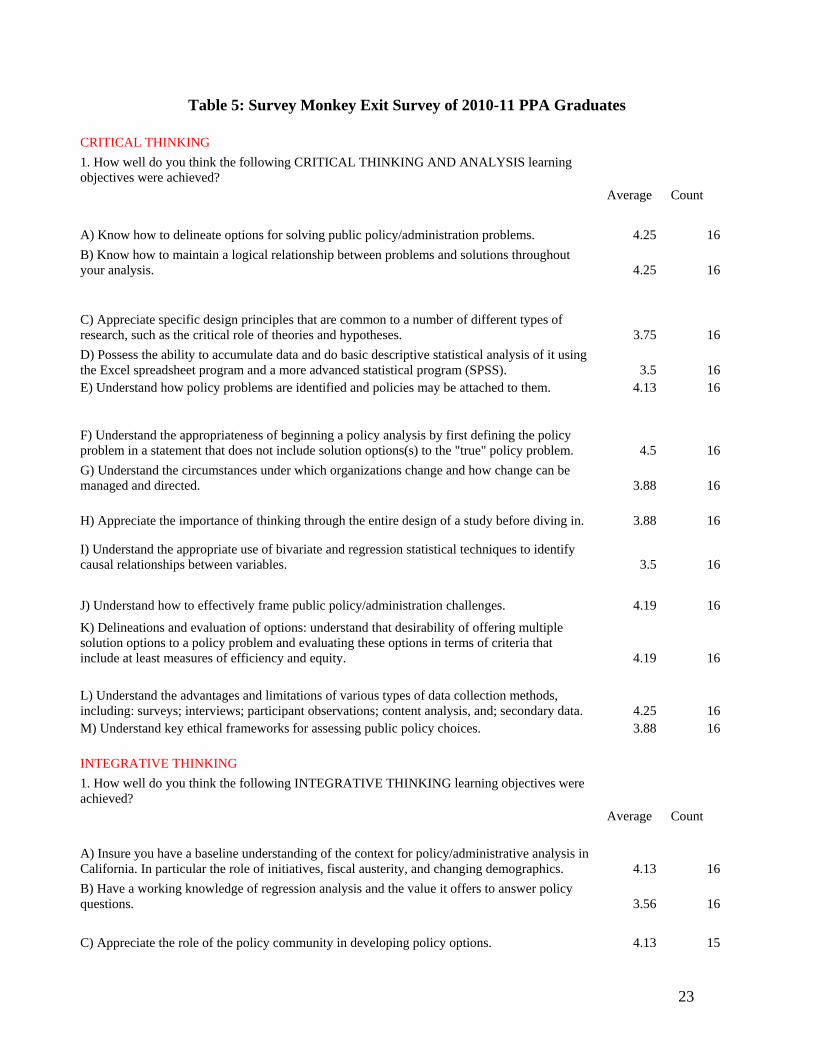
Table 5: Survey Monkey Exit Survey of 2010-11 PPA Graduates
CRITICAL THINKING
1. How well do you think the following CRITICAL THINKING AND ANALYSIS learning objectives were achieved?
Average Count
A) Know how to delineate options for solving public policy/administration problems. 4.25 16
B) Know how to maintain a logical relationship between problems and solutions throughout your analysis. 4.25 16
C) Appreciate specific design principles that are common to a number of different types of research, such as the critical role of theories and hypotheses. 3.75 16
D) Possess the ability to accumulate data and do basic descriptive statistical analysis of it using the Excel spreadsheet program and a more advanced statistical program (SPSS). 3.5 16 E) Understand how policy problems are identified and policies may be attached to them. 4.13 16
F) Understand the appropriateness of beginning a policy analysis by first defining the policy problem in a statement that does not include solution options(s) to the "true" policy problem. 4.5 16
G) Understand the circumstances under which organizations change and how change can be managed and directed. 3.88 16
H) Appreciate the importance of thinking through the entire design of a study before diving in. 3.88 16
I) Understand the appropriate use of bivariate and regression statistical techniques to identify causal relationships between variables. 3.5 16
J) Understand how to effectively frame public policy/administration challenges. 4.19 16
K) Delineations and evaluation of options: understand that desirability of offering multiple solution options to a policy problem and evaluating these options in terms of criteria that include at least measures of efficiency and equity. 4.19 16
L) Understand the advantages and limitations of various types of data collection methods, including: surveys; interviews; participant observations; content analysis, and; secondary data. 4.25 16 M) Understand key ethical frameworks for assessing public policy choices. 3.88 16
INTEGRATIVE THINKING
1. How well do you think the following INTEGRATIVE THINKING learning objectives were achieved?
Average Count
A) Insure you have a baseline understanding of the context for policy/administrative analysis in California. In particular the role of initiatives, fiscal austerity, and changing demographics. 4.13 16
B) Have a working knowledge of regression analysis and the value it offers to answer policy questions. 3.56 16
C) Appreciate the role of the policy community in developing policy options. 4.13 15
24
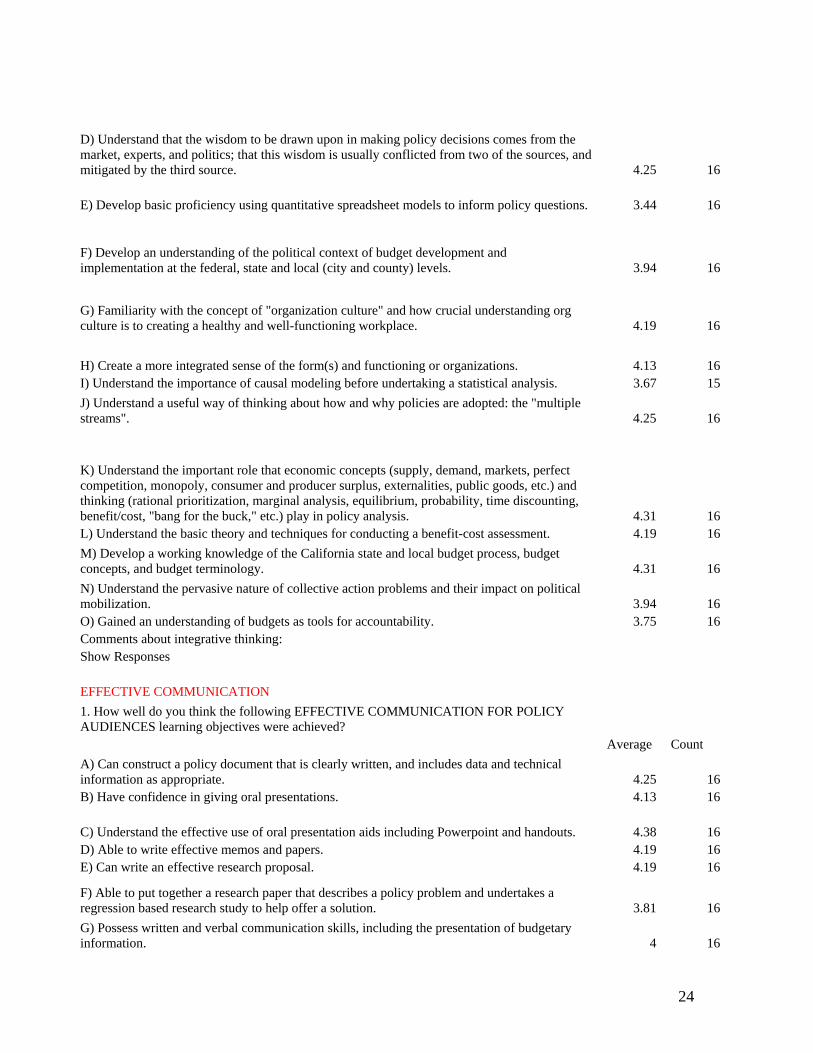
D) Understand that the wisdom to be drawn upon in making policy decisions comes from the market, experts, and politics; that this wisdom is usually conflicted from two of the sources, and mitigated by the third source. 4.25 16
E) Develop basic proficiency using quantitative spreadsheet models to inform policy questions. 3.44 16
F) Develop an understanding of the political context of budget development and implementation at the federal, state and local (city and county) levels. 3.94 16
G) Familiarity with the concept of "organization culture" and how crucial understanding org culture is to creating a healthy and well-functioning workplace. 4.19 16
H) Create a more integrated sense of the form(s) and functioning or organizations. 4.13 16 I) Understand the importance of causal modeling before undertaking a statistical analysis. 3.67 15
J) Understand a useful way of thinking about how and why policies are adopted: the "multiple streams". 4.25 16
K) Understand the important role that economic concepts (supply, demand, markets, perfect competition, monopoly, consumer and producer surplus, externalities, public goods, etc.) and thinking (rational prioritization, marginal analysis, equilibrium, probability, time discounting, benefit/cost, "bang for the buck," etc.) play in policy analysis. 4.31 16 L) Understand the basic theory and techniques for conducting a benefit-cost assessment. 4.19 16
M) Develop a working knowledge of the California state and local budget process, budget concepts, and budget terminology. 4.31 16
N) Understand the pervasive nature of collective action problems and their impact on political mobilization. 3.94 16 O) Gained an understanding of budgets as tools for accountability. 3.75 16 Comments about integrative thinking: Show Responses
EFFECTIVE COMMUNICATION
1. How well do you think the following EFFECTIVE COMMUNICATION FOR POLICY AUDIENCES learning objectives were achieved?
Average Count
A) Can construct a policy document that is clearly written, and includes data and technical information as appropriate. 4.25 16 B) Have confidence in giving oral presentations. 4.13 16
C) Understand the effective use of oral presentation aids including Powerpoint and handouts. 4.38 16 D) Able to write effective memos and papers. 4.19 16 E) Can write an effective research proposal. 4.19 16
F) Able to put together a research paper that describes a policy problem and undertakes a regression based research study to help offer a solution. 3.81 16
G) Possess written and verbal communication skills, including the presentation of budgetary information. 4 16

25
H) Familiarity with graduate level literature review skills, including: data mining for articles, report and experts on the given policy topic; and the construction of traditional literature review tables on definitions, researcher venues, research methodologies, and research findings. 4.13 16 Comments about effective communication: Show Responses
UNDERSTANDING OF PROFESSIONAL ROLE
1. How well do you think the following UNDERSTANDING PROFESSIONAL ROLE learning objectives were achieved?
Average Count
A) Understand the different roles of the public, private and nonprofit sectors. 4.31 16
B) Understand the critical role of "policy entrepreneurs" in policy development. 4.13 16
C) Understand that even competitive market systems can "fail" under certain circumstances (related to market structure, externalities, public goods, and information asymmetry), that a market system offers no guarantee that an outcome is viewed as "equitable" by society, and that the choice of different political institutions in a democracy yield different political/policy outcomes. 4.31 16
D) Understand the role of budgets for a state or local agency or department. 3.88 16
E) Familiarity with key scholars and theories in the organization theory literature as it applies to the public sector. Subjects to be examined include: the origin of the concept of bureaucracy; the origin of the field of public sector administration; the life cycle of public agencies; differences between vertical and horizontal communication; early leadership and management theories; and contemporary theories of org behavior and human relations in public agencies. 3.88 16
F) Understand the ethics of role obligations facing political entrepreneurs and other policy actors. 3.81 16
G) Understand that the role of the policy analyst is to offer advice to policymakers on the desirability of alternative solutions to a policy problem. Both ethics and value neutrality are desired in policy analysis. 4.25 16 PRACTICAL APPLICATIONS
1. How well do you think the following PRACTICAL APPLICATIONS learning objectives were achieved?
Average Count A) Developed skills in working effectively in groups. 4.25 16
B) Appreciate ethical considerations applicable to applied social science research. 4 16
C) Know how to proceed from a concept to a variable designed to measure the concepts in a valid and reliable fashion. 3.88 16

26
D) Understand the differences between descriptive and inferential data analysis, and implications for research design and data collection. 3.81 16
E) Have a working knowledge of where to begin to gather data for policy analysis. 4.31 16 F) Can engage in effective policy negotiations. 3.81 16
G) Can conduct a basic policy analysis that involves the appropriate identification of the problem, the environment and sources of wisdom regarding the problem, solution alternatives, appropriate criteria to evaluate each alternative, and a recommendation on a course of action. 4.13 16
H) Have learned the limitations of benefit-cost analysis, economic efficiency, and their proper role in a more comprehensive policy analysis. 4 16
I) Possess basic skills in budget development, analysis and implementation and cash and debt management. 3.56 16
J) Familiar with active listening and HR intervention strategies, with particular emphasis on affirmative action, sexual harassment, disciplining and responding to employees exhibiting alcohol/drug impairment problems, and hiring and firing. 3 16
K) Understand the variety of ways to undertake strategic planning and benefits and drawbacks of different tools. 3.63 16
L) Possess sufficient knowledge to critique an actual benefit-cost analysis, such as one issued by a government agency, think tank, or interest group. 3.88 16
M) Possess an appreciation for the intergovernmental dynamics (particularly the relationships between the State of California, counties, and cities) of budgeting and their impact on budgeting behavior. 4.19 16
N) Understand the way performance measurements are used and misused. 3.94 16
O) Know how to analyze, from an economic perspective, how different types of government intervention (e.g. subsidies, taxation, cap-and-trade, technology forcing) can be used to correct market failures rooted in externalities. 4.25 16
P) Possess an understanding of how California arrived at its current fiscal crisis and be able to offer an educated assessment of the options offered to solve it. 4.38 16
Q) Can assess organizations at a macro-level -- especially your comfort and competence using written documentation (websites, debts, strategic plans, annual reports, etc.) to learn about organizations. 4.5 16
How would you rate the graduate program in Public Policy and Administration overall? Average Count
3.8 16