july 2017 council deck
TRANSCRIPT

PROPANE EDUCATION & RESEARCH COUNCILDENVER, COLORADO
July 11-12, 2017

CHAIRMAN’S REPORT
Drew Combs

INDUSTRY OUTREACH COMMITTEE REPORT
Bob Barry

STATE REBATE SPENDING BY STRATEGIC MATRIX
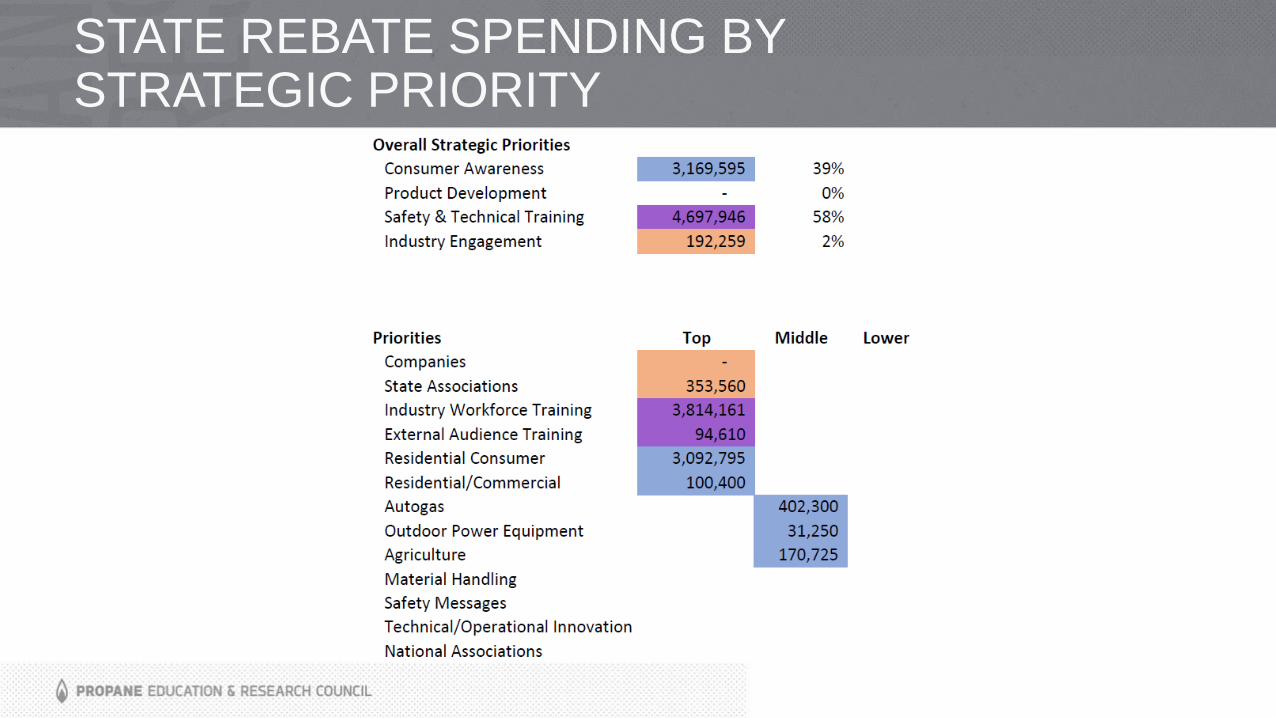
STATE REBATE SPENDING BY STRATEGIC PRIORITY

AUDIT COMMITTEE REPORT
Gene Bissell
ADVISORY COMMITTEE REPORT
Bruce MontroyChairman, Safety & Training Working Group

NPGA REPORT
Chris Earhart

GPA MIDSTREAM REPORT
Mark Sutton

CHAIRMAN’S COMMENTS


TREASURER’S REPORT
Randy Doyle

REPORT AGENDA
• April Financial Summary and Variance Analysis
• 2017 Forecast and Variance Analysis• At current assessment rate
• At proposed .5 cent assessment rate (October 1, 2017)
• 2017 Cash Flow Projected Balances • At current and proposed assessment rate
• Investment Performance

2017 BUDGET VS ACTUALS AS OF APRIL 30, 2017
Category 2017 Budget 2017 Actuals Variance
Revenue $16,076,169 $14,489,604 ($1,586,565)
Carry-Forward $2,630,737 $1,297,939 ($1,332,798)
Spending ($26,508,516) ($26,133,680) ($374,836)
NET BUDGET ($10,429,347) ($11,644,076) ($1,961,421)
Deobligations $500,000 $1,646,075 $1,146,075
SURPLUS ($7,243,610) ($8,688,307) ($1,444,698)
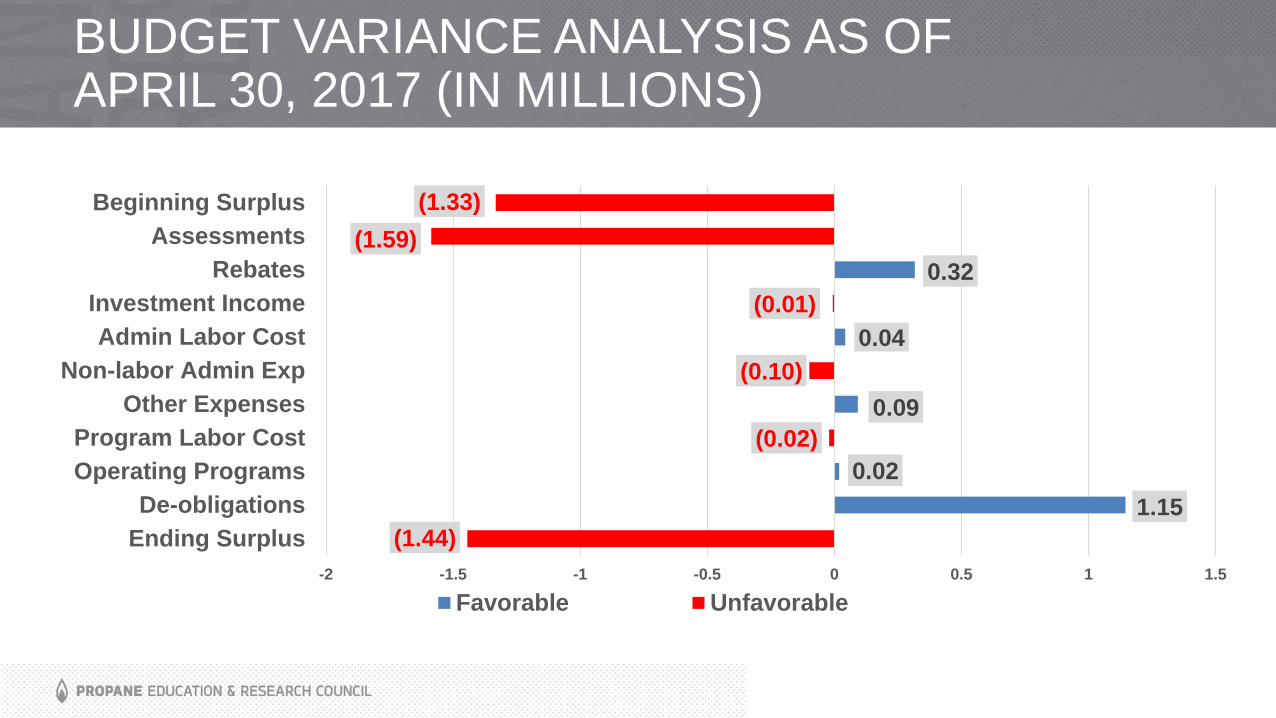
BUDGET VARIANCE ANALYSIS AS OF APRIL 30, 2017 (IN MILLIONS)
1.15
0.02
0.09
0.04
0.32
(1.44)
(0.02)
(0.10)
(0.01)
(1.59)
(1.33)
-2 -1.5 -1 -0.5 0 0.5 1 1.5
Ending Surplus
De-obligations
Operating Programs
Program Labor Cost
Other Expenses
Non-labor Admin Exp
Admin Labor Cost
Investment Income
Rebates
Assessments
Beginning Surplus
Favorable Unfavorable

2017 FORECAST VARIANCE ANALYSIS WITH RATE INCREASE @ 10/01/17 (IN MILLIONS)
Category BudgetForecast @
.0045
Variance @
.0045
Forecast @
.005
Variance @
.005
Beginning Surplus $2.6 $1.3 ($1.3) $1.3 ($1.3)
Assessments $38.9 $37.4 ($1.5) $38.7 ($0.2)
Investment Income $0.2 $0.2 - $0.2 -
Rebates ($7.8) ($7.5) $0.3 ($7.7) $0.1
Administrative
& Other($3.2) ($3.7) ($0.5) ($3.7) ($0.5)
Program Funding ($31.0) $(30.2) $0.8 ($30.2) $0.8
Deobligations $0.5 $2.0 $1.5 $2.0 $1.5
Ending Surplus $0.2 ($0.5) ($0.7) $0.6 $0.4

2017 FORECAST VARIANCE ANALYSISWITHOUT RATE INCREASE (IN MILLIONS)
1.5
0.8
0.3
(0.7)
(0.5)
(0.0)
(1.5)
(1.3)
-2 -1.5 -1 -0.5 0 0.5 1 1.5 2
Ending Surplus
De-obligations
Program Funding
Admin & Other
Investment Income
Rebates
Assessments
Beginning Surplus
Favorable Unfavorable
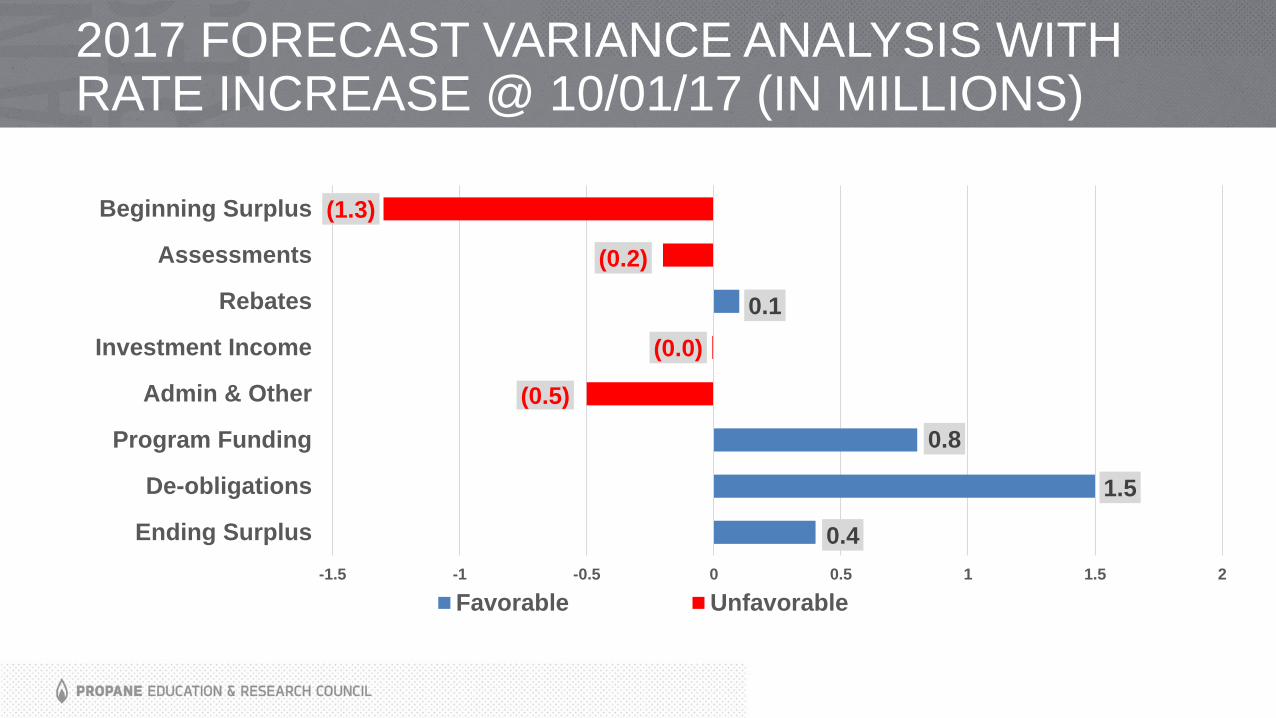
2017 FORECAST VARIANCE ANALYSIS WITH RATE INCREASE @ 10/01/17 (IN MILLIONS)
0.4
1.5
0.8
0.1
(0.5)
(0.0)
(0.2)
(1.3)
-1.5 -1 -0.5 0 0.5 1 1.5 2
Ending Surplus
De-obligations
Program Funding
Admin & Other
Investment Income
Rebates
Assessments
Beginning Surplus
Favorable Unfavorable

$17.7
$11.3$12.0
$5
$7
$9
$11
$13
$15
$17
$19
May June July August September October November December
@ .45 cents @ .5 cents
2017 PROJECTED CASH FLOW BALANCES@ .45 CENTS & .5 CENTS PER GALLON (IN MILLIONS)

PERC INVESTMENT ALLOCATION AS OF APRIL 30, 2017 (IN MILLIONS)
Cash & Money Market (Deposits),
$8.3, 45%
Cert.of Deposits (CD), $9.26, 50%
Municipal Bond (MB), $0.80 , 5%
TOTAL: $18.36 M

PERC TWELVE MONTH CUMULATIVE INVESTMENT RETURNS AT APRIL 30, 2016 & 2017
0.00%
1.00%
2.00%
3.00%
2016 2017
0.81%0.62%
1.13%
2.20%
Return %
Investment
Actual Returns CPI


CONSENT CALENDAR

CHIEF EXECUTIVE OFFICER’S REPORT
Tucker Perkins

ENGINE FUEL ($5,940,500)
DOCKET BUDGETED2017 FUNDING
REQUESTEDTOTAL REMAINING
High Efficiency, High
Performance, Ultra-Low
NOx Medium Duty
Propane Engine
$6,083,162 $1,500,000 $1,243,704
* Additional $2,108,694 included in the 2018 Budget

DOCKET 20905 – CHANGE ORDER ($3,608,694)
High Efficiency, High Performance, Medium Duty Propane Engine, $3,608,694
• Development and demonstration
• Engine suitable for class 5-7 trucks, including bobtails
• PERC and engine partner very pleased with results
• Total contribution: PERC $6,083,162, partner $6,083,162 + infrastructure
• Budget cash flow:
- 2016 $1,000,000 (funded) - 2019 $1,172,774
- 2017 $1,500,000 - 2020 $301,694
- 2018 $2,108,694

2016 2017 2018 2019 2020
Q1 Q2 Q3 Q4 Q1 Q2 Q3 Q4 Q1 Q2 Q3 Q4 Q1 Q2 Q3 Q4 Q1 Q2 Q3 Q4
Analysis and Controls Integration
Design
Engine Testing
Vehicle Demonstration
Component MRD
Prototype
Procurement
Vehicle Test
Vehicle Integration
Mule MCE TestingVVA, charge flow, CDA, 1D test data
MS1 MS3 MS2
MS4
MS5MS6
MS7
MS8

ENGINE FUEL ($5,940,500)
DOCKET BUDGETED2017 FUNDING
REQUESTEDTOTAL REMAINING
High Efficiency, High
Performance, Ultra-Low
NOx Medium Duty
Propane Engine
$6,083,162 $1,500,000 $1,243,704
* Additional $2,108,694 included in the 2018 Budget
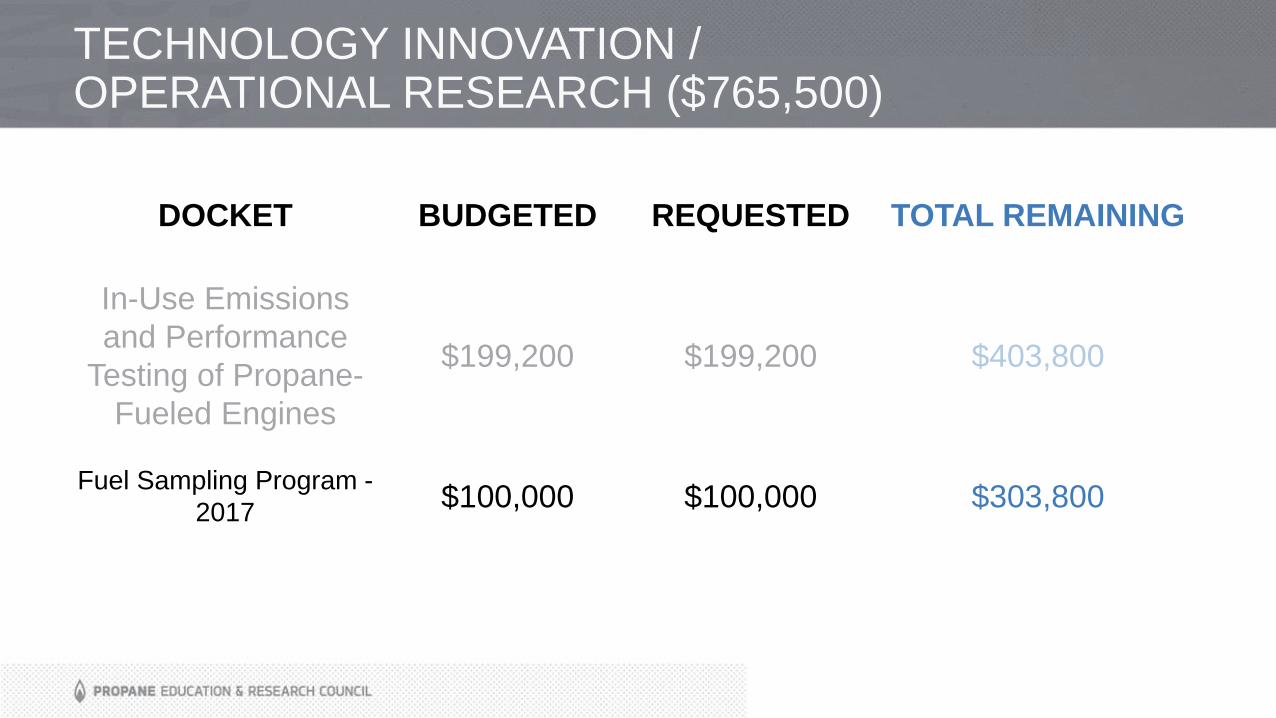
TECHNOLOGY INNOVATION / OPERATIONAL RESEARCH ($765,500)
DOCKET BUDGETED REQUESTED TOTAL REMAINING
In-Use Emissions
and Performance
Testing of Propane-
Fueled Engines
$199,200 $199,200 $403,800
Fuel Sampling Program -
2017$100,000 $100,000 $303,800
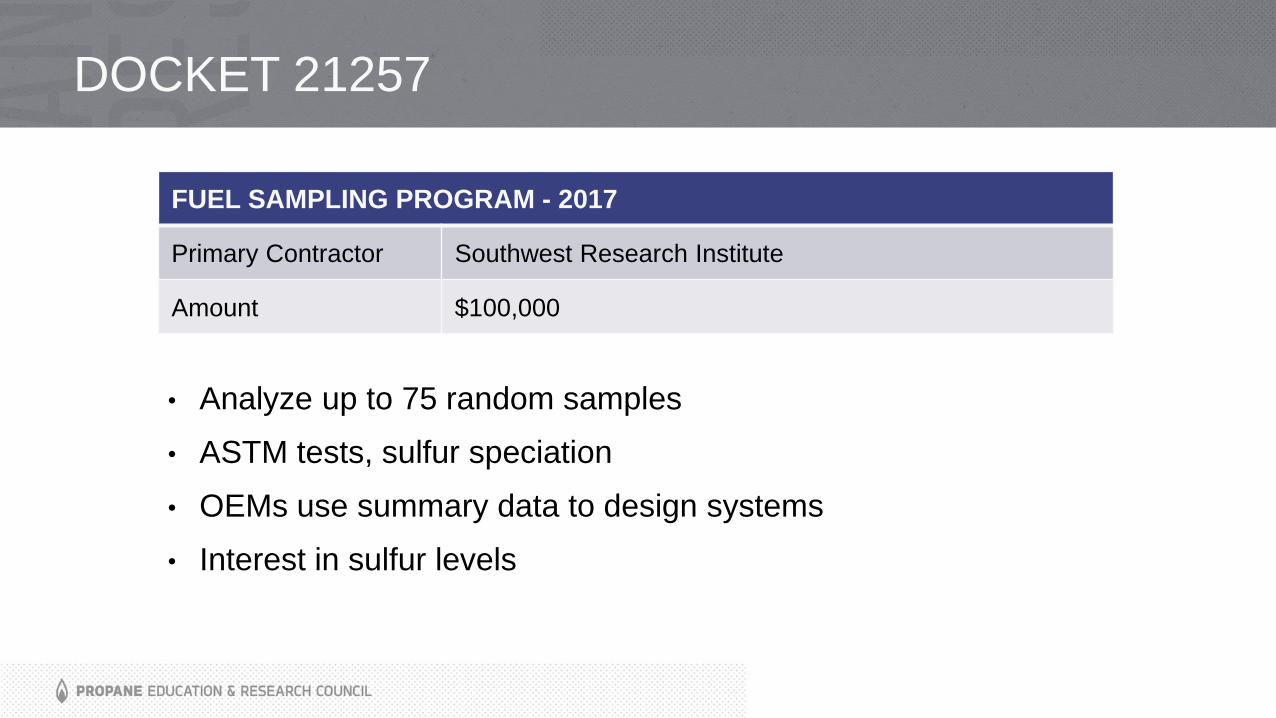
DOCKET 21257
• Analyze up to 75 random samples
• ASTM tests, sulfur speciation
• OEMs use summary data to design systems
• Interest in sulfur levels
FUEL SAMPLING PROGRAM - 2017
Primary Contractor Southwest Research Institute
Amount $100,000
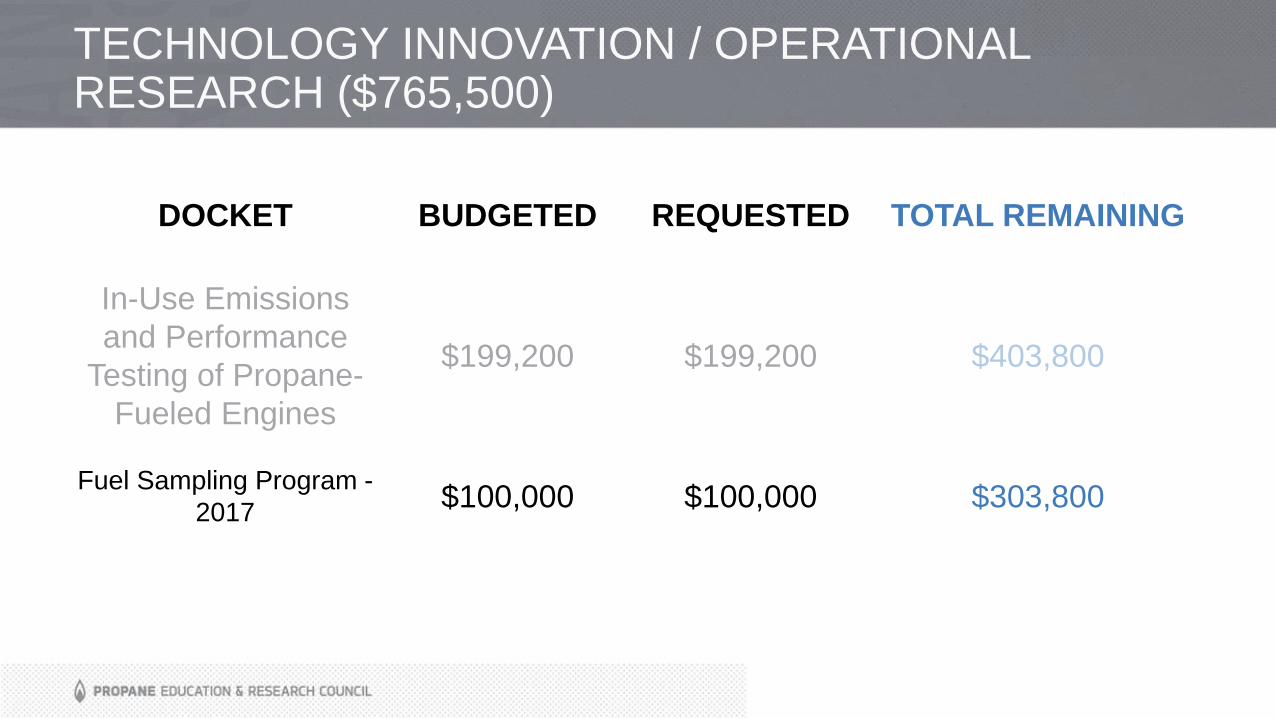
TECHNOLOGY INNOVATION / OPERATIONAL RESEARCH ($765,500)
DOCKET BUDGETED REQUESTED TOTAL REMAINING
In-Use Emissions
and Performance
Testing of Propane-
Fueled Engines
$199,200 $199,200 $403,800
Fuel Sampling Program -
2017$100,000 $100,000 $303,800


CHIEF INFORMATION OFFICER’S REPORT
Kay Howell

– ND Marketer
“I now see the value of my assessment dollars.”

INDUSTRY ENGAGEMENT TACTICS
• Newsletters, Social media, email campaigns
• Videos, webinars, podcasts
• Presentations/exhibits at state/regional meetings
• Catalog and website
• State-level promotion
• Face-to-face meetings with states & companies
• MTST Classroom & Digital
• Advisory Committee

INDUSTRY OUTREACH –TRADESHOWS/CONVENTIONS
• Southeast Expo
• 3,982 attendees • Conducted 5 educational sessions• PERC Update attendance: 600• Distributed 2,200+ items and 34 unique products • Added 392 new contacts to our database• Expanded use of Social Media to engage with marketers:
• Total number of Expo-related posts: 14• Total impressions: 60,635 compared to 32,000 in 2016 and 8,600 in 2015• Total engagements: 1,840 compared to 1,154 in 2016 and 228 in 2015
• Western
• 2,000 total attendees • 500+ collateral pieces distributed• PERC Update: 30 attendees
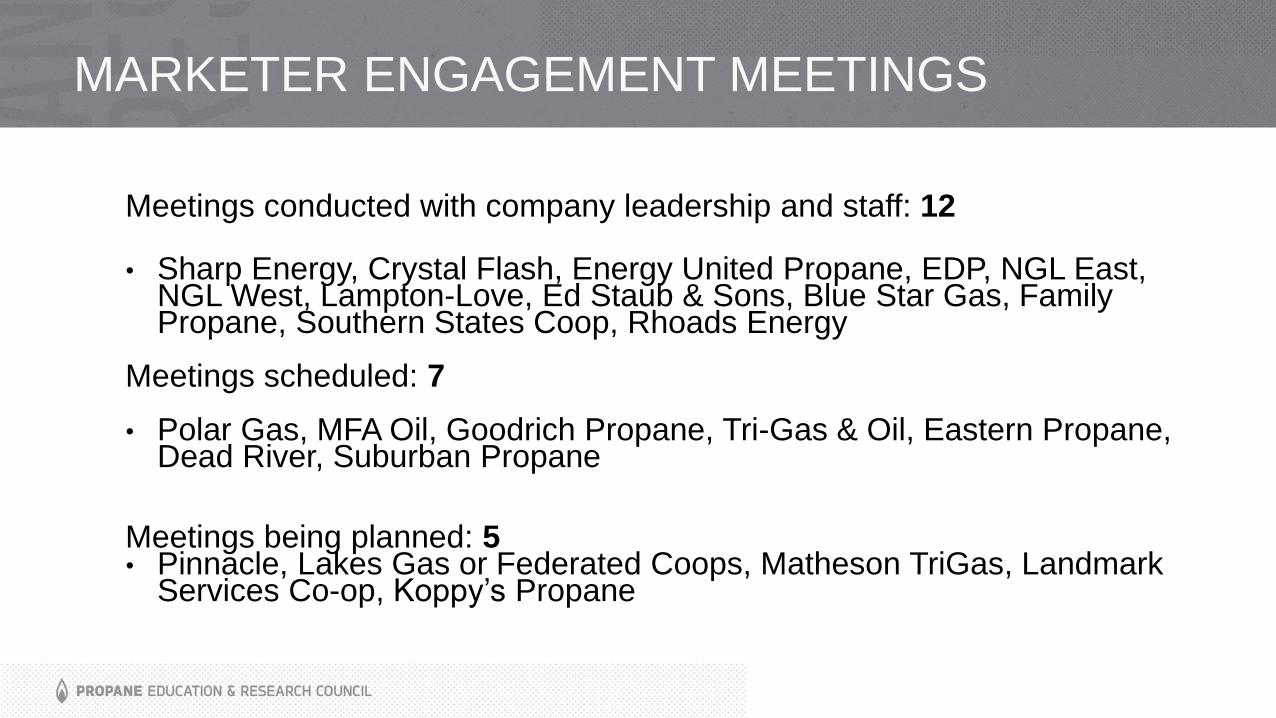
MARKETER ENGAGEMENT MEETINGS
Meetings conducted with company leadership and staff: 12
• Sharp Energy, Crystal Flash, Energy United Propane, EDP, NGL East, NGL West, Lampton-Love, Ed Staub & Sons, Blue Star Gas, Family Propane, Southern States Coop, Rhoads Energy
Meetings scheduled: 7
• Polar Gas, MFA Oil, Goodrich Propane, Tri-Gas & Oil, Eastern Propane, Dead River, Suburban Propane
Meetings being planned: 5• Pinnacle, Lakes Gas or Federated Coops, Matheson TriGas, Landmark
Services Co-op, Koppy’s Propane
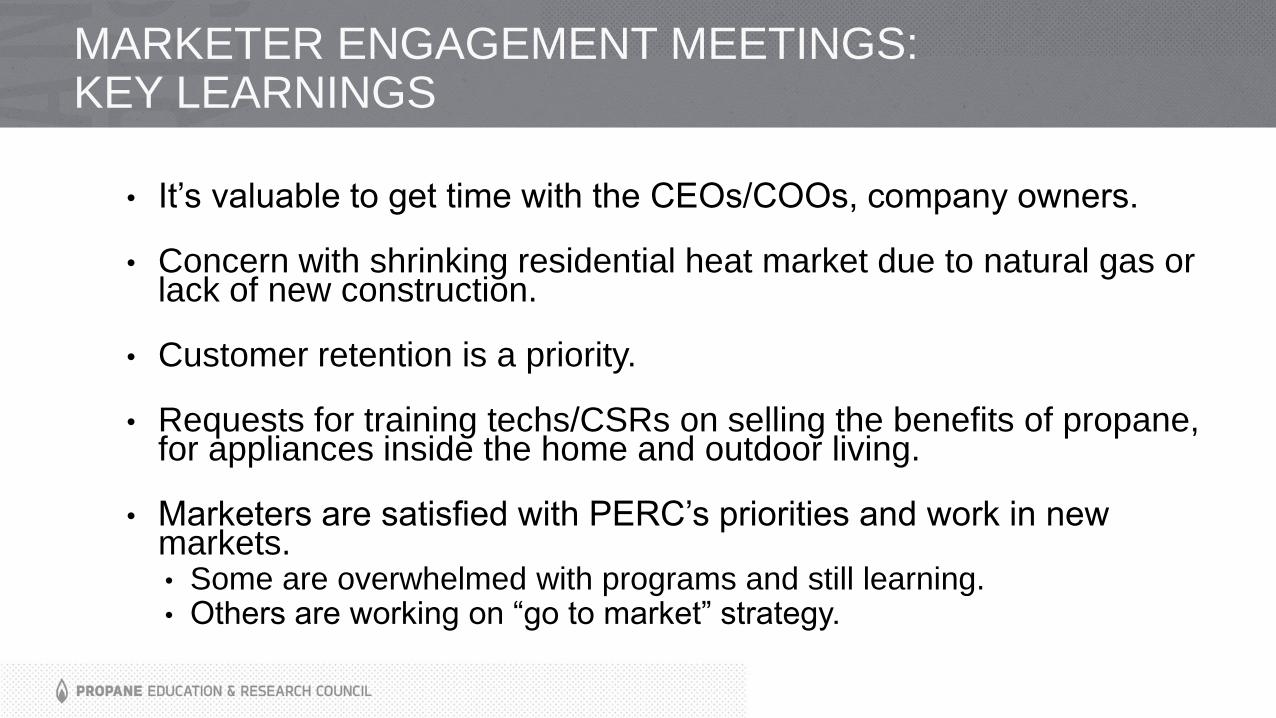
MARKETER ENGAGEMENT MEETINGS: KEY LEARNINGS
• It’s valuable to get time with the CEOs/COOs, company owners.
• Concern with shrinking residential heat market due to natural gas or lack of new construction.
• Customer retention is a priority.
• Requests for training techs/CSRs on selling the benefits of propane, for appliances inside the home and outdoor living.
• Marketers are satisfied with PERC’s priorities and work in new markets. • Some are overwhelmed with programs and still learning. • Others are working on “go to market” strategy.

MARKETER ENGAGEMENT MEETINGS
Recommendations:
• Develop quarterly or bi-annual personal message from PERC CEO to industry CEOs/Owners; utilize email or print. Highlight PERC achievements, invite feedback.
• Work with MOT Res/Comm project team to develop training and collateral; repackage existing materials for upselling appliances.
• Promote continuing education. Conduct Marketing Symposium to educate marketers on market opportunities and marketing techniques; plan regional MTST sessions.

STATE LEADERSHIP ENGAGEMENT
• Personal meetings with new state executives have been well received
• PGANE, Pacific completed
• CO/AZ/NM, NJ, WI scheduled
• Rocky Mountain, VA, AR planned
• 2017 Leadership Summit
• Date and venue confirmed (Nov. 16 and 17 in DC)
• Planning committee:
• 5 state execs + PERC & 2 NPGA staff
• Agenda being developed - specific request made to hear vision of new CEO and update of IOC

INDUSTRY OUTREACH –STATE MEETINGS SUPPORT
• Attended 26 industry meetings (through June)
• Key takeaways:
• Proudly Propane campaign updates and how marketers/PGA can leverage its benefits are popular topics
• Interest in specific local market insights and opportunities
• School bus market growth
• Volkswagen settlement opportunity
• New PERC resources for safety and training
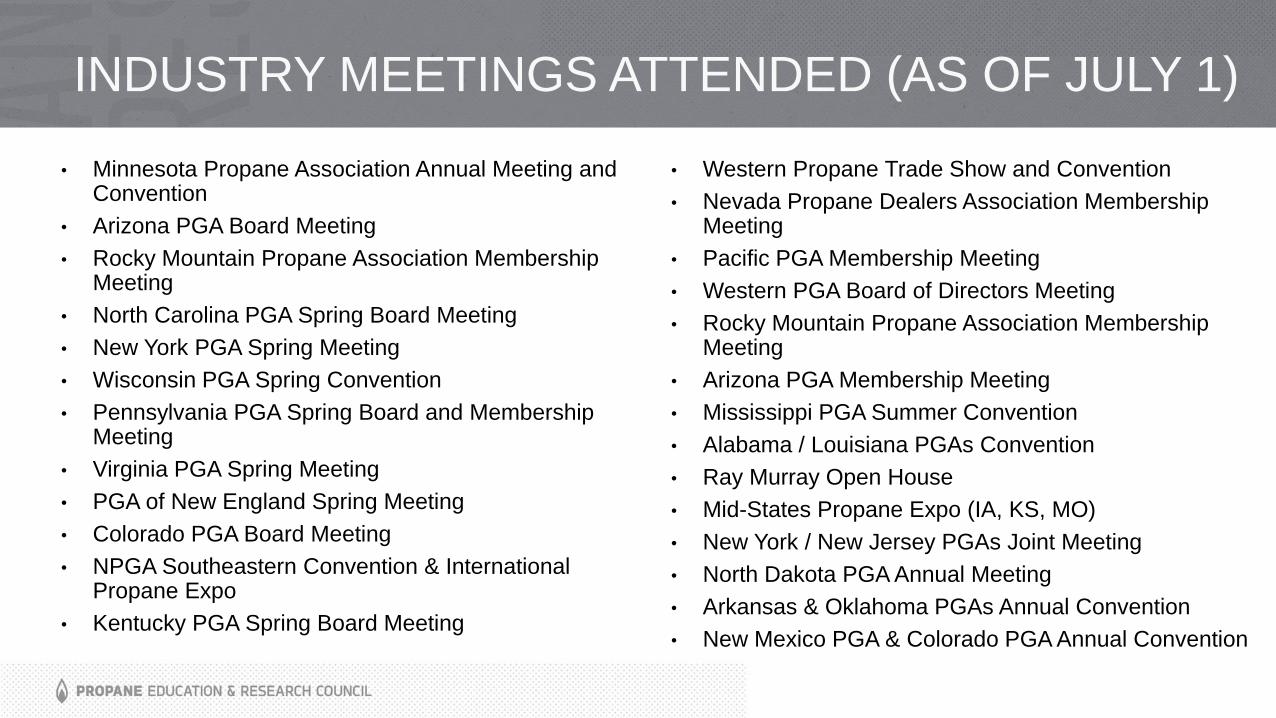
INDUSTRY MEETINGS ATTENDED (AS OF JULY 1)
• Minnesota Propane Association Annual Meeting and Convention
• Arizona PGA Board Meeting
• Rocky Mountain Propane Association Membership Meeting
• North Carolina PGA Spring Board Meeting
• New York PGA Spring Meeting
• Wisconsin PGA Spring Convention
• Pennsylvania PGA Spring Board and Membership Meeting
• Virginia PGA Spring Meeting
• PGA of New England Spring Meeting
• Colorado PGA Board Meeting
• NPGA Southeastern Convention & International Propane Expo
• Kentucky PGA Spring Board Meeting
• Western Propane Trade Show and Convention
• Nevada Propane Dealers Association Membership Meeting
• Pacific PGA Membership Meeting
• Western PGA Board of Directors Meeting
• Rocky Mountain Propane Association Membership Meeting
• Arizona PGA Membership Meeting
• Mississippi PGA Summer Convention
• Alabama / Louisiana PGAs Convention
• Ray Murray Open House
• Mid-States Propane Expo (IA, KS, MO)
• New York / New Jersey PGAs Joint Meeting
• North Dakota PGA Annual Meeting
• Arkansas & Oklahoma PGAs Annual Convention
• New Mexico PGA & Colorado PGA Annual Convention

MARKETER TECHNOLOGY & SALES TRAINING
• Held 16 of 28 scheduled classroom sessions thru June 30 (budgeted for 60):
- CSR: 9 - Commercial: 1
- Residential: 1 - Residential Plus: 3
- Mowers: 1 - Autogas: 1
• Marketer Momentum Newsletter: 3,200 subscribers
- Open rate for last two issues: 38.49% and 44.46%
• Webinars
• Launched Digital MTST in April
- 174 registrants
- Adding new educational elements monthly – scheduled out over next 12 months
- Soliciting feedback from early registrants via personal calls
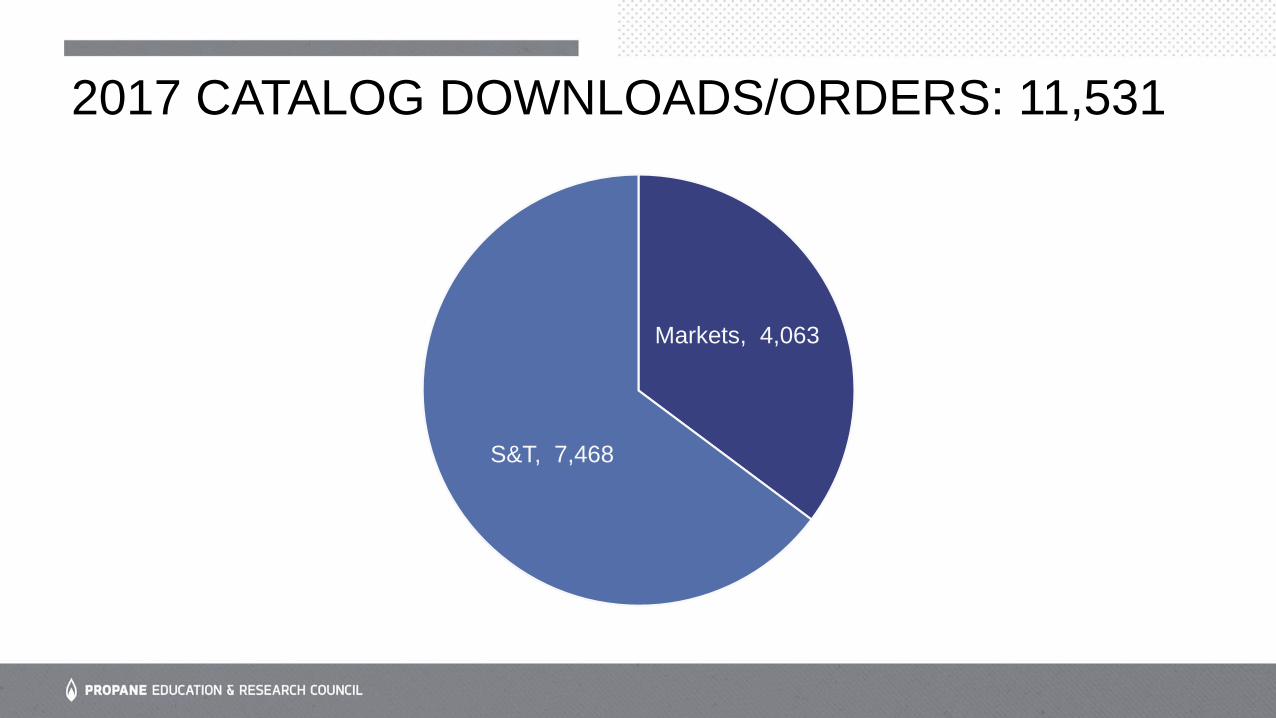
2017 CATALOG DOWNLOADS/ORDERS: 11,531
Markets, 4,063
S&T, 7,468

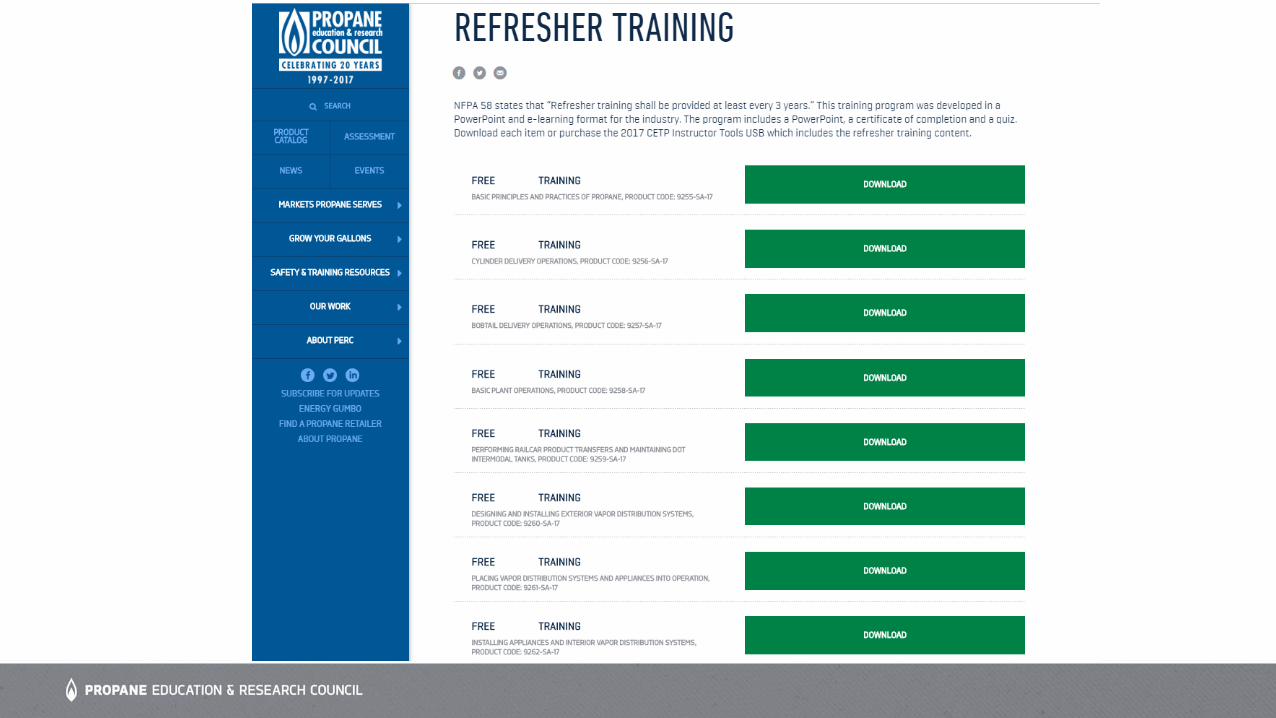
NEWLY ADDED SAFETY & TRAINING RESOURCES/PROGRAMS
• Blended Learning
• Refresher Training Program • PowerPoint & On-line E-Learning formats
• Propane Autogas Technician Training
• Safety Talk Presentations
• Consumer Safety Videos

SAFETY MEETING PRESENTATIONS
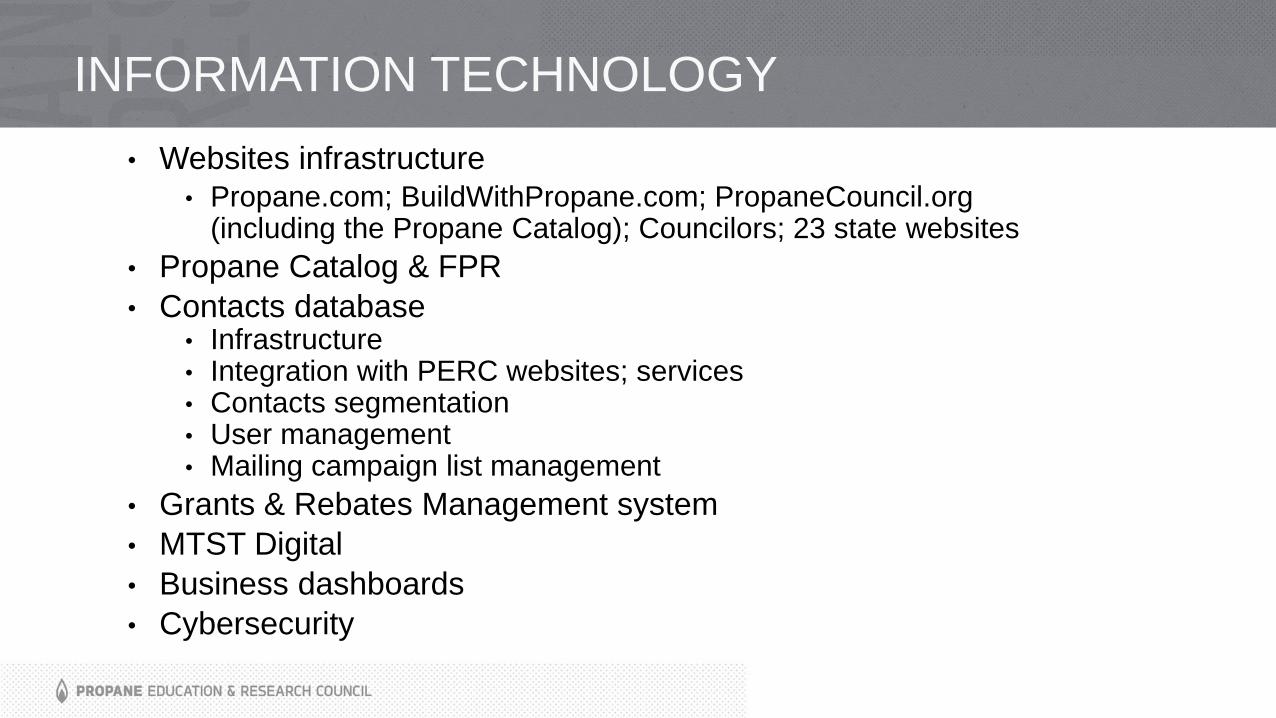
INFORMATION TECHNOLOGY
• Websites infrastructure
• Propane.com; BuildWithPropane.com; PropaneCouncil.org (including the Propane Catalog); Councilors; 23 state websites
• Propane Catalog & FPR
• Contacts database• Infrastructure• Integration with PERC websites; services• Contacts segmentation• User management• Mailing campaign list management
• Grants & Rebates Management system
• MTST Digital
• Business dashboards
• Cybersecurity


PROPANE SUPPLY CHAIN & INFRASTRUCTURE: MARKET ANALYSIS – PART 1
Rusty Braziel, RBN Energy

© Copyright 2017 RBN Energy
Propane Supply Chain and Infrastructure: Market Analysis – Phase I
July 11, 2017
RBN Propane TeamDavid BrazielRusty Braziel
Noel CopelandRon GistJohn Hall
Scott PotterKelly Van Hull

52© Copyright 2017 RBN Energy
Propane Supply Chain and Infrastructure: Project Design
» Current Market Developments and Projected Supply/Demand Dynamics▪ Supply/Demand Forecast▪ Assessment of Market Behavior▪ Evaluation of Findings
Phase I
» Implications of Phase I Findings on the Propane Supply Chain▪ Delineate Supply Chain Risks Faced by
Propane Retailers▪ Develop Model to Simulate How
Triggering Events Can Result In Market Disruptions
▪ Recommend Risk Mitigation Measures
Phase II
53© Copyright 2017 RBN Energy
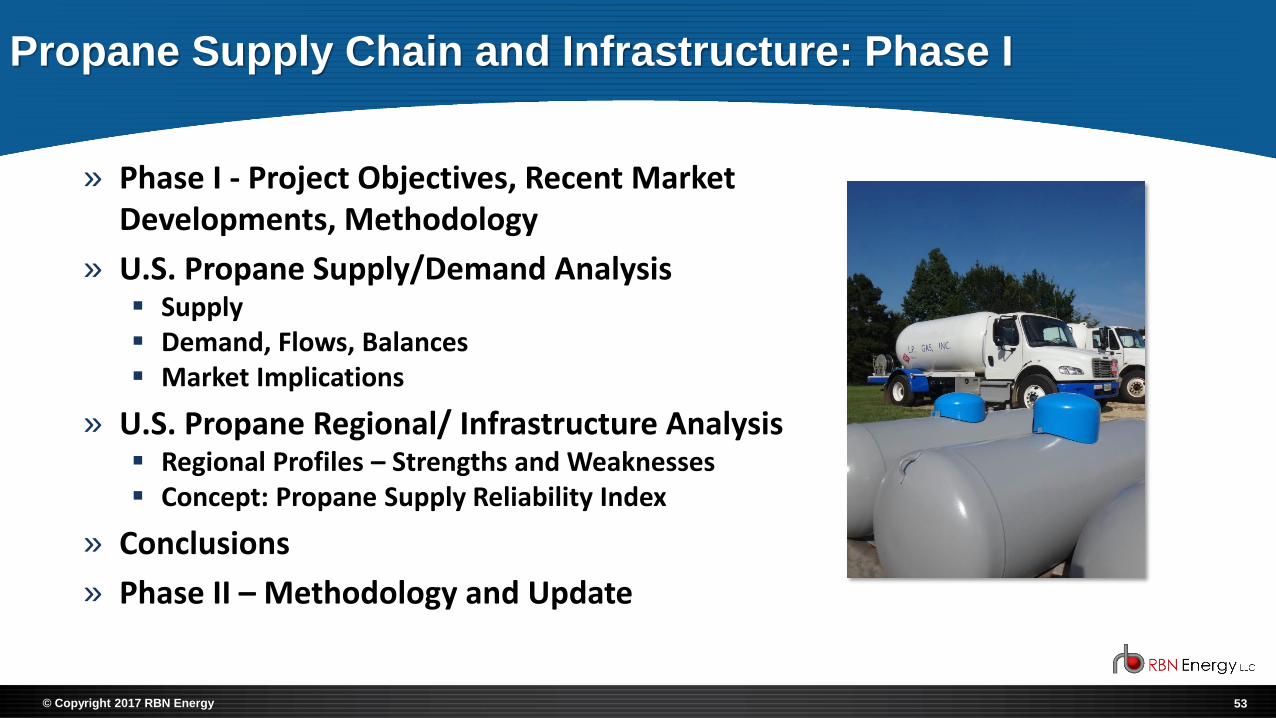
Propane Supply Chain and Infrastructure: Phase I
» Phase I - Project Objectives, Recent Market Developments, Methodology
» U.S. Propane Supply/Demand Analysis▪ Supply▪ Demand, Flows, Balances▪ Market Implications
» U.S. Propane Regional/ Infrastructure Analysis▪ Regional Profiles – Strengths and Weaknesses▪ Concept: Propane Supply Reliability Index
» Conclusions
» Phase II – Methodology and Update
54© Copyright 2017 RBN Energy
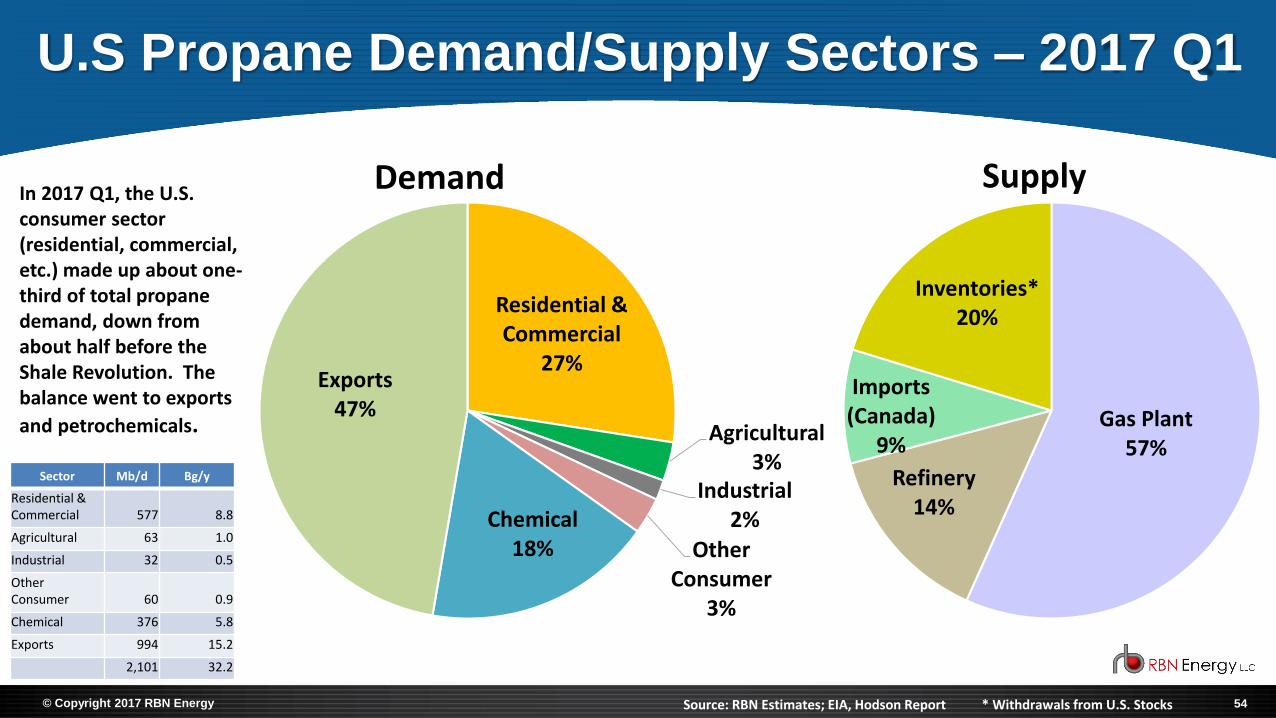
U.S Propane Demand/Supply Sectors – 2017 Q1
Residential & Commercial
27%
Agricultural3%
Industrial2%
Other Consumer
3%
Chemical18%
Exports47%
Source: RBN Estimates; EIA, Hodson Report
Sector Mb/d Bg/y
Residential & Commercial 577 8.8
Agricultural 63 1.0
Industrial 32 0.5
Other Consumer 60 0.9
Chemical 376 5.8
Exports 994 15.2
2,101 32.2
Gas Plant57%
Refinery14%
Imports (Canada)
9%
Inventories*20%
Demand Supply
* Withdrawals from U.S. Stocks
In 2017 Q1, the U.S. consumer sector (residential, commercial, etc.) made up about one-third of total propane demand, down from about half before the Shale Revolution. The balance went to exports
and petrochemicals.
55© Copyright 2017 RBN Energy
-
2
4
6
8
10
12
14
16
18
20
0.0
0.2
0.4
0.6
0.8
1.0
1.2
1.4
Bg/
y
Mb
/d
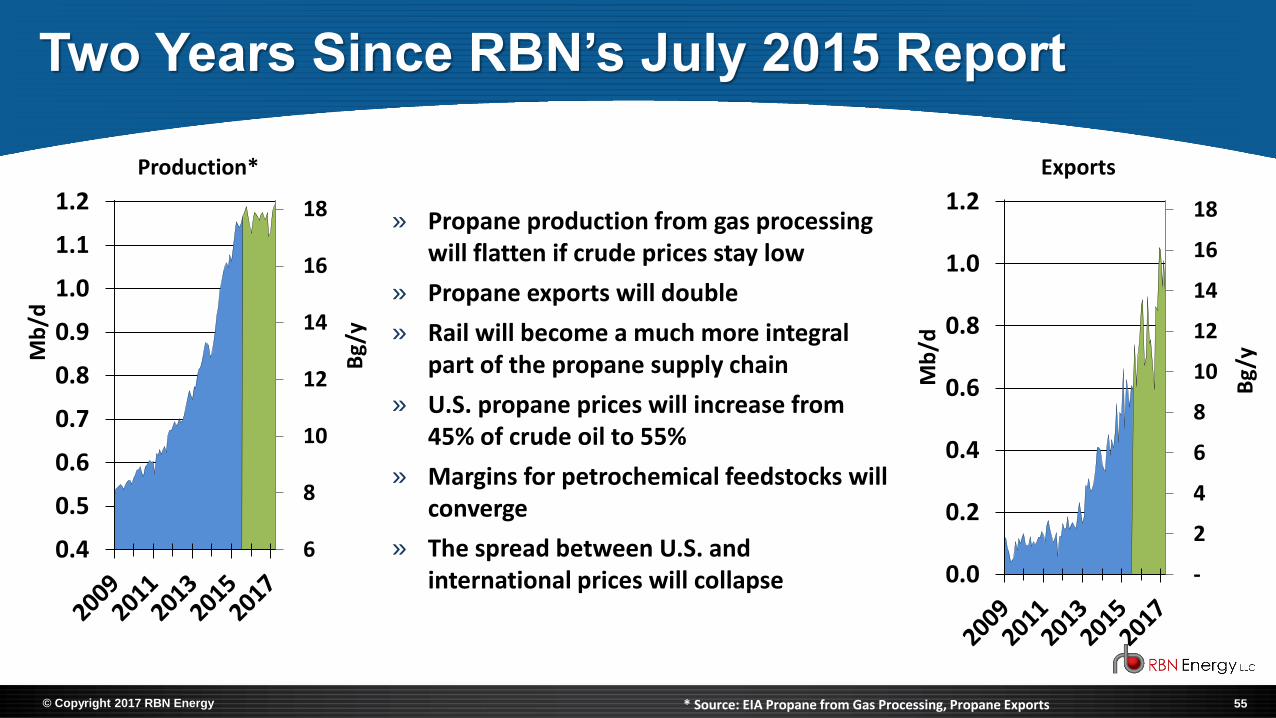
» Propane production from gas processing will flatten if crude prices stay low
» Propane exports will double
» Rail will become a much more integral part of the propane supply chain
» U.S. propane prices will increase from 45% of crude oil to 55%
» Margins for petrochemical feedstocks will converge
» The spread between U.S. and international prices will collapse
6
8
10
12
14
16
18
20
0.4
0.5
0.6
0.7
0.8
0.9
1.0
1.1
1.2
1.3
1.4
Bg/
y
Mb
/dTwo Years Since RBN’s July 2015 Report
Production* Exports
* Source: EIA Propane from Gas Processing, Propane Exports

56© Copyright 2017 RBN Energy
Risks In Today’s Propane Market
More Exports
More Rail
Two Warm
Winters

57© Copyright 2017 RBN Energy
» Propane is now a true global commodity. International developments exert a much greater influence over U.S. propane balances and prices. U.S. prices and differentials to international markets increasingly impact the level of exports.
» During periods of severe weather, it is likely that the consumer/retail market will acquire incremental supplies from barrels otherwise destined for exports and petrochemical supplies.
▪ If European and Asian markets experience severe weather at the same time as the U.S., these supplies will be very expensive, possibly unavailable.
» Supplies sourced from cancelled cargos will face significant supply chain challenges to meet demand peaks in market regions located long distances from export hubs.
▪ Consequently, peak demand during periods of severe weather must be met with supplies much closer to demand, deliverable via reliable, resilient supply chain infrastructure.
» Unfortunately several midstream companies have indicated that they plan to reduce inventories held for consumer markets due to losses experienced over the past two warm winters, making it more important than ever for individual propane companies to insure
their access to secure sources of local supply.
Risks In Today’s Propane Market

58© Copyright 2017 RBN Energy
MB Propane Price and Relationship to Crude Oil
25
35
45
55
65
75
85
95
c/ga
l
Propane Price
Source: OPIS/CME NYMEX
35%
40%
45%
50%
55%
60%
65%
70%
75%Propane % of Crude Oil (WTI)
35%
40%
45%
50%
55%
60%
65%
70%
75%Propane % of Crude Oil (WTI)

59© Copyright 2017 RBN Energy
U.S. Propane Exports (2016-17)
-
2
4
6
8
10
12
14
16
-
200
400
600
800
1,000
Bg
/y
Mb
/d
Gulf Coast
Enterprise ETP/Sunoco Freeport/P66 Ingleside
Riverside Targa Trafigura
-
0.20
0.40
0.60
0.80
1.00
-
10
20
30
40
50
60
70
Bg
/y
Mb
/d
East Coast (Marcus Hook)

60© Copyright 2017 RBN Energy
U.S. Propane Inventories (Stocks)
0
20
40
60
80
100
120
MM
bl
Weeks
Y-1 Previous 5 Year Range 2016 2017
61© Copyright 2017 RBN Energy
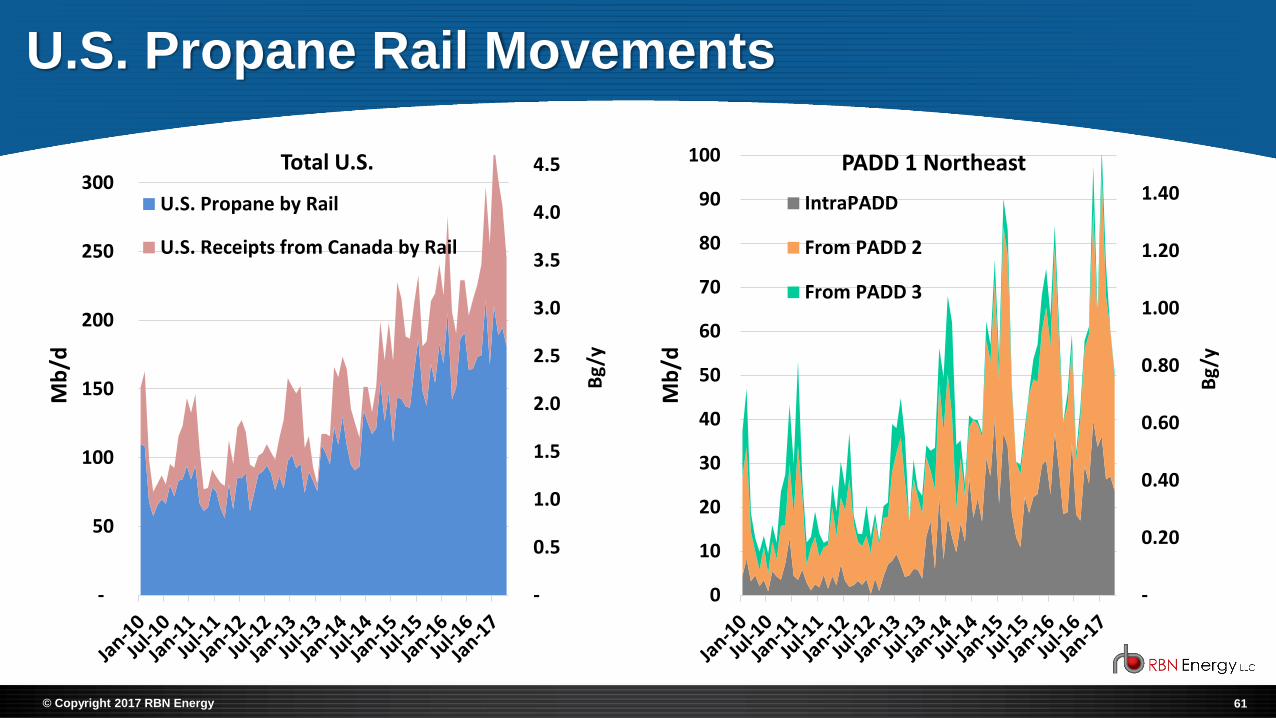
U.S. Propane Rail Movements
-
0.5
1.0
1.5
2.0
2.5
3.0
3.5
4.0
4.5
-
50
100
150
200
250
300
Bg
/y
Mb
/d
Total U.S.
U.S. Propane by Rail
U.S. Receipts from Canada by Rail
-
0.20
0.40
0.60
0.80
1.00
1.20
1.40
0
10
20
30
40
50
60
70
80
90
100
Bg
/y
Mb
/d
PADD 1 Northeast
IntraPADD
From PADD 2
From PADD 3
62© Copyright 2017 RBN Energy
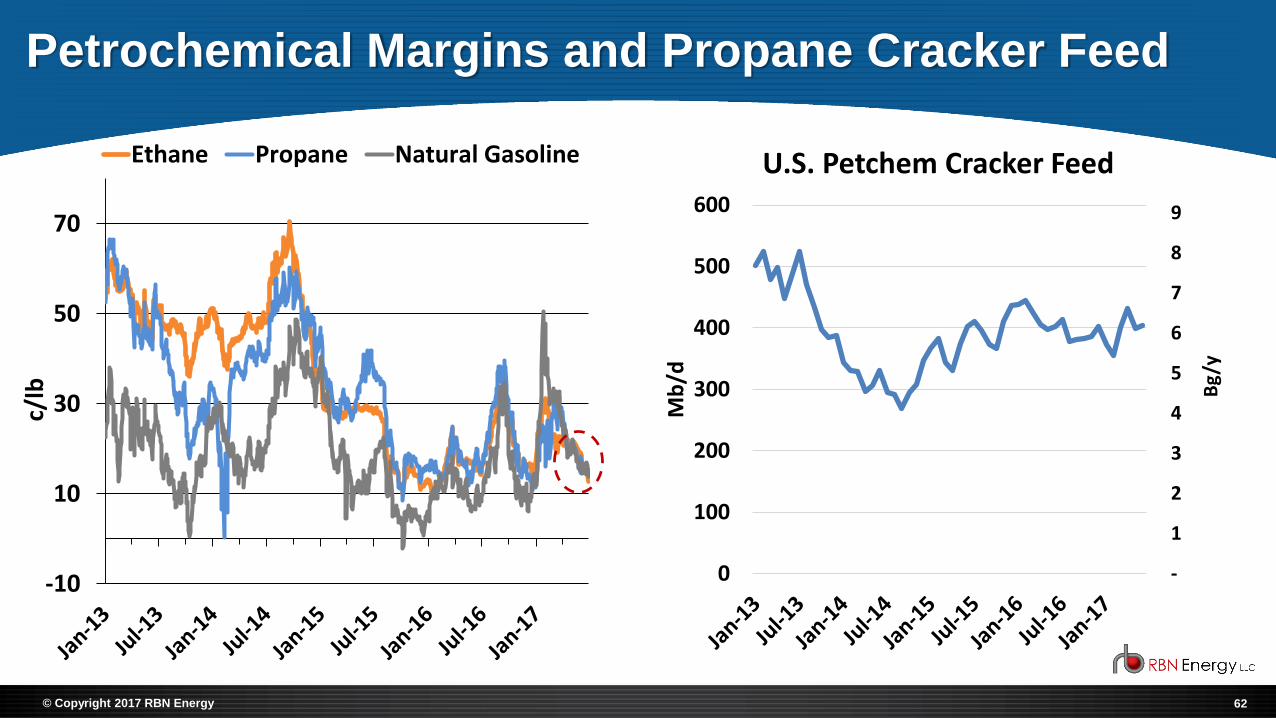
Petrochemical Margins and Propane Cracker Feed
-10
10
30
50
70
c/lb
Ethane Propane Natural Gasoline
-
1
2
3
4
5
6
7
8
9
0
100
200
300
400
500
600
Bg
/y
Mb
/d
U.S. Petchem Cracker Feed

63© Copyright 2017 RBN Energy
Northwest
Southwest
WMW
SouthSoutheast
EMW
NE-
New England
PERC Regions and EIA PADDs
NE-
Mid Atlantic
PADD 1PADD 2
PADD 4
PADD 5
PADD 3
PADD 1
PADD 2
PADD 4
PADD 5
Northwest
Southwest
WMW
South
Southeast
EMW
NE-
New England
NE-
Mid Atlantic
PADD 3

64© Copyright 2017 RBN Energy
4 Models: Production Scenarios and Demand Cases
Demand Cases
Co
ntr
acti
on
Gro
wth
Sup
ply
Sce
nar
ios
Normal Weather Severe Weather*
High crude prices, normal
weather
High crude prices, “Severe
Weather” winter weather
Low crude prices, normal
weather
Low crude prices, “Severe
Weather” winter
weather
* a.k.a., Polar Vortex

65© Copyright 2017 RBN Energy
4 Models: Production Scenarios and Demand Cases
$40
$45
$50
$55
$60
$65
$70
$75
$80
$/B
bl
Crude Oil: WTI Cushing
Growth Contraction
$2.70
$3.00
$3.30
$3.60
$3.90
$/M
Mb
tu
Natural Gas: Henry Hub
Growth Contraction
15
16
17
18
19
20
1,000
1,050
1,100
1,150
1,200
1,250
1,300
1,350
Bg/
y
Mb
/d
Severe Weather Case: Average Nov-Feb Demand*
* Red Columns indicate winters with severe weather conditions
66© Copyright 2017 RBN Energy
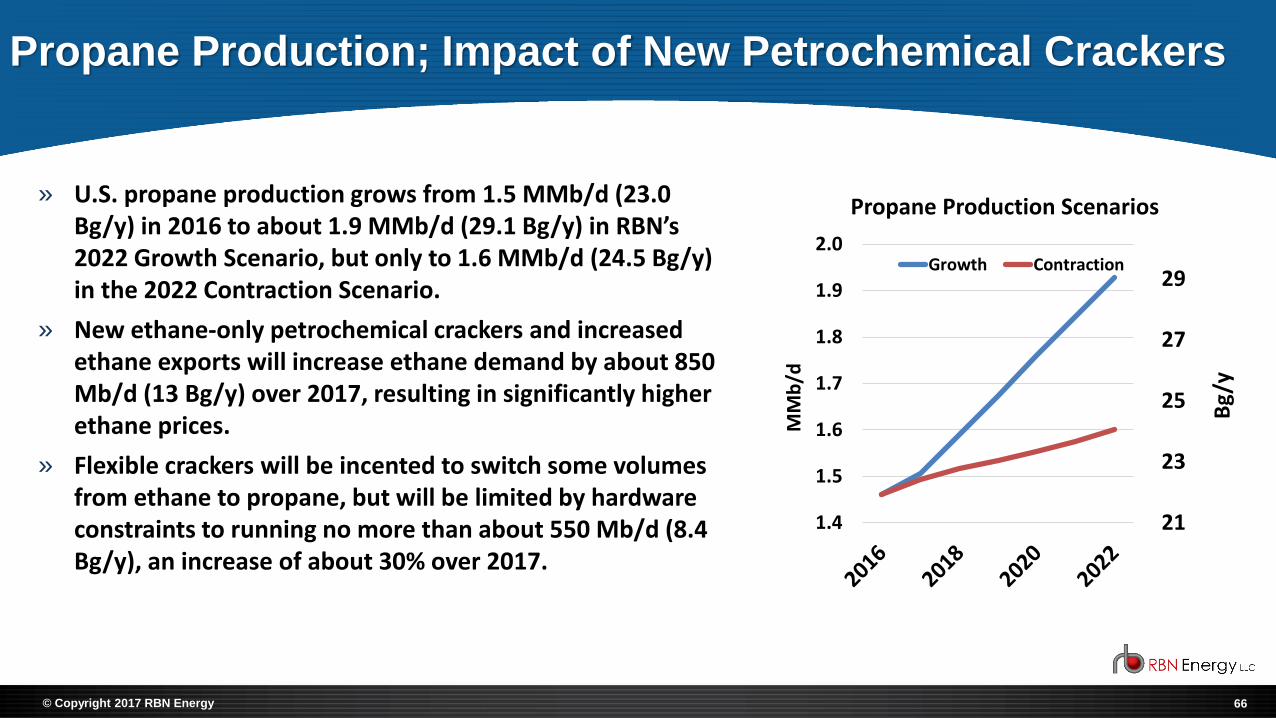
Propane Production; Impact of New Petrochemical Crackers
» U.S. propane production grows from 1.5 MMb/d (23.0 Bg/y) in 2016 to about 1.9 MMb/d (29.1 Bg/y) in RBN’s 2022 Growth Scenario, but only to 1.6 MMb/d (24.5 Bg/y) in the 2022 Contraction Scenario.
» New ethane-only petrochemical crackers and increased ethane exports will increase ethane demand by about 850 Mb/d (13 Bg/y) over 2017, resulting in significantly higher ethane prices.
» Flexible crackers will be incented to switch some volumes from ethane to propane, but will be limited by hardware constraints to running no more than about 550 Mb/d (8.4 Bg/y), an increase of about 30% over 2017.
21
23
25
27
29
1.4
1.5
1.6
1.7
1.8
1.9
2.0
Bg/
y
MM
b/d
Propane Production Scenarios
Growth Contraction

67© Copyright 2017 RBN Energy
Total Incremental Ethane Demand
-
2
4
6
8
10
12
14
16
0
100
200
300
400
500
600
700
800
900
1,000
1,100
Bg/
y
Mb
/d
Exports
Petchem
» Tighter ethane markets and higher ethane prices will result in narrow spreads between alternative steam cracker petrochemical feedstocks.
» Higher prices for any one feedstock will encourage crackers to reduce runs of that feedstock and switch to others.
» Consequently, higher propane prices resulting from severe weather will encourage steam crackers to reduce propane usage, making more barrels available to consumer markets.

68© Copyright 2017 RBN Energy
Propane Exports – Growth and Contraction Scenarios
» At the U.S. level, consumer demand in the two Scenarios is relatively similar, therefore any additional volume over petrochemical demand between the two Scenarios is expected to move to export markets.
» In the Contraction scenario with modest production growth, exports decline as new cracker and PDH demand pulls supply from the export market.
» In the Growth Scenario, exports increase to average 1.1 MMb/d (16.9 Bg/y) by 2022.
» The location of propane exports shifts significantly, with Marcus Hook LPG exports increasing to 232 Mb/d (3.5 Bg/y) in 2022 from 70 Mb/d (1.1 Bg/y) in 2017 (Growth Scenario, mostly propane).
9
11
13
15
17
0.6
0.7
0.8
0.9
1.0
1.1
1.2
Bg/
y
MM
b/d
Propane Export Scenarios
Growth Contraction
69© Copyright 2017 RBN Energy
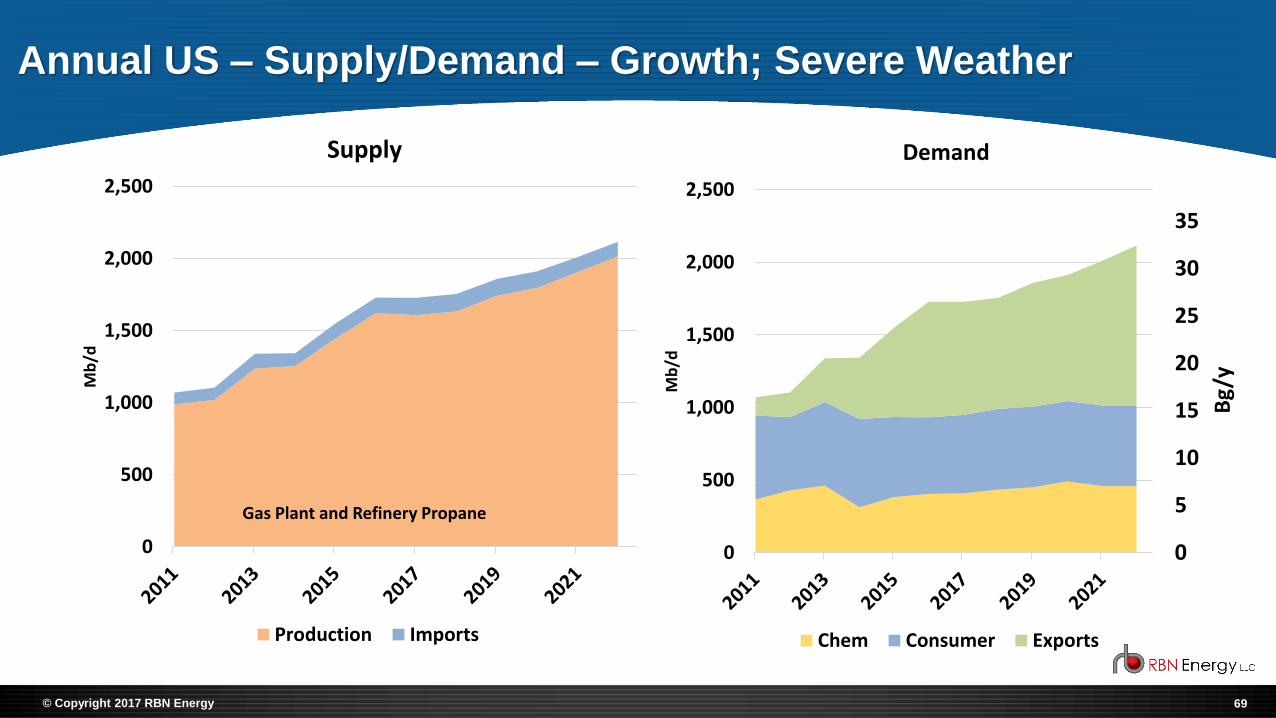
Annual US – Supply/Demand – Growth; Severe Weather
0
500
1,000
1,500
2,000
2,500
Mb
/d
Supply
Production Imports
0
5
10
15
20
25
30
35
0
500
1,000
1,500
2,000
2,500
Bg/
y
Mb
/d
Demand
Chem Consumer Exports
Gas Plant and Refinery Propane

70© Copyright 2017 RBN Energy
Annual US – Supply/Demand – Contraction; Severe Weather
0
500
1,000
1,500
2,000
2,500
Mb
/d
Supply
Production Imports
Gas Plant and Refinery Propane
0
5
10
15
20
25
30
35
0
500
1,000
1,500
2,000
2,500
Bg
/yMb
/d
Demand
Chem Consumer Exports
71© Copyright 2017 RBN Energy
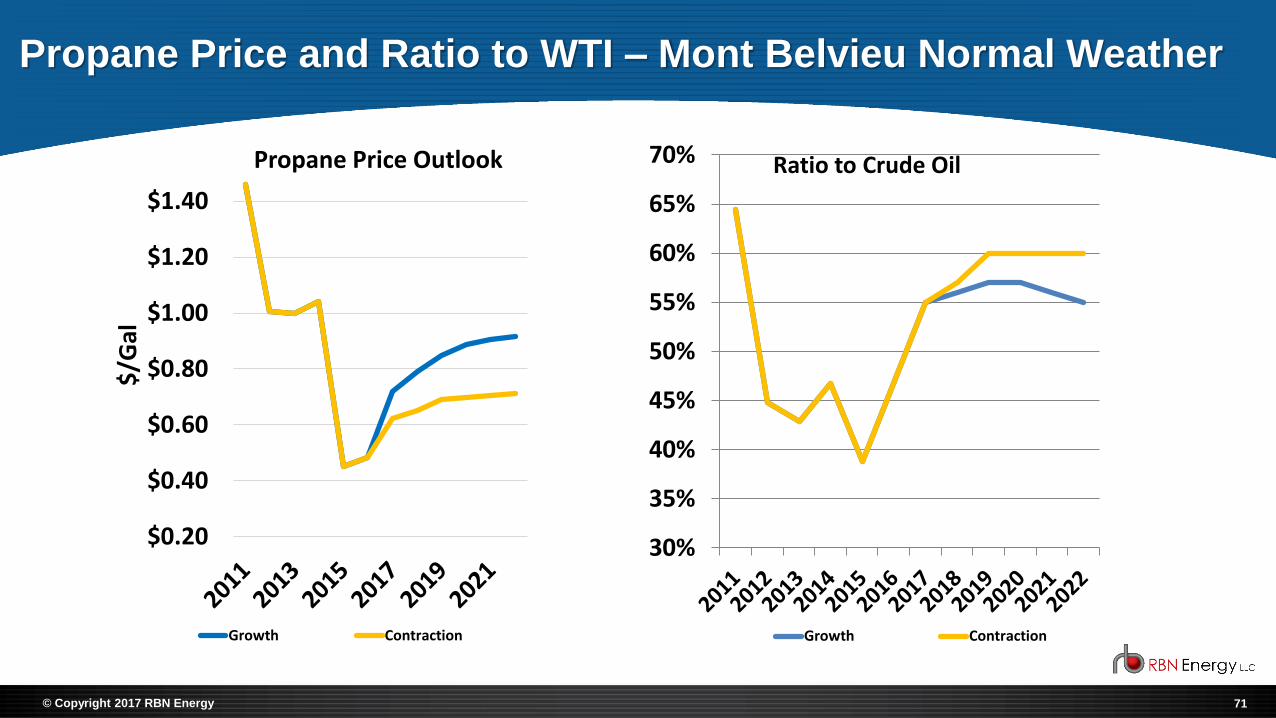
Propane Price and Ratio to WTI – Mont Belvieu Normal Weather
30%
35%
40%
45%
50%
55%
60%
65%
70% Ratio to Crude Oil
Growth Contraction
$0.20
$0.40
$0.60
$0.80
$1.00
$1.20
$1.40
$/G
alPropane Price Outlook
Growth Contraction

72© Copyright 2017 RBN Energy
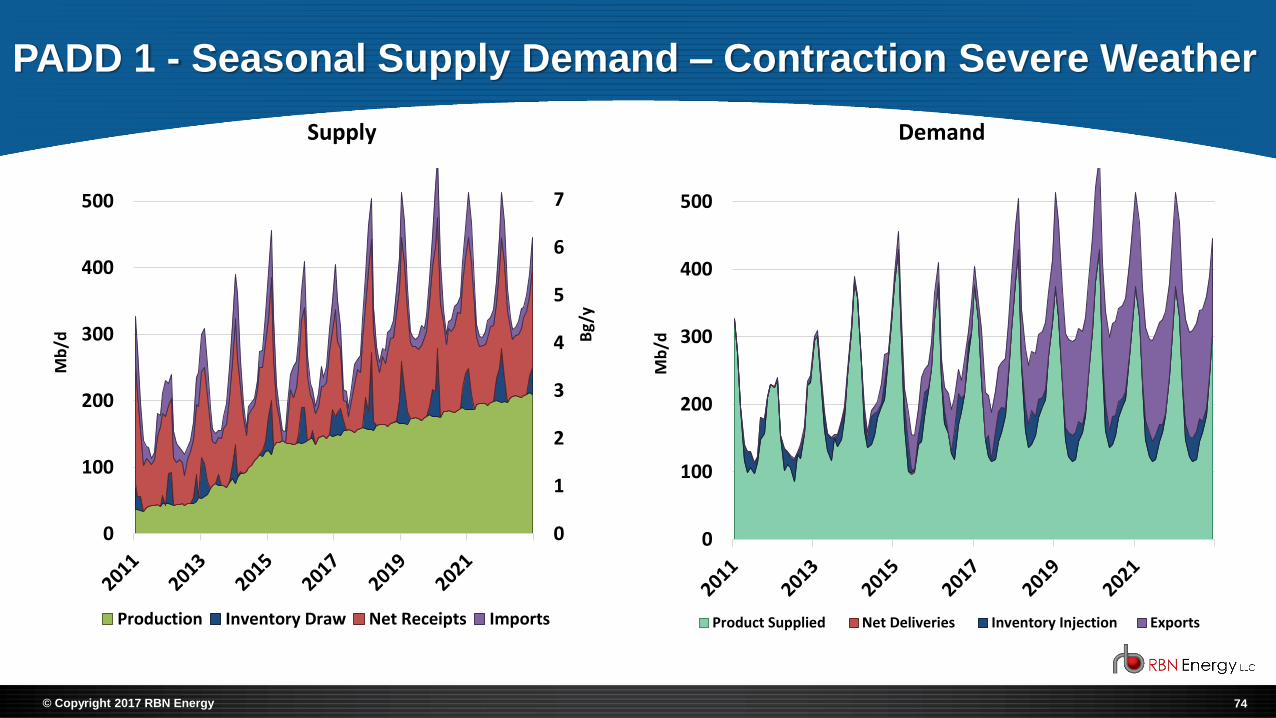
Seasonal Supply Demand – PADD Level Presentation Format
1. Product Supplied (Consumer + Petchem Demand)2. Inventory Injections (Builds)3. Net Deliveries (to other PADDs)4. Exports
Demand
1. U.S. Production2. Inventory Withdrawals (Draws)3. Net Receipts (from other PADDs)4. Imports
Supply
73© Copyright 2017 RBN Energy
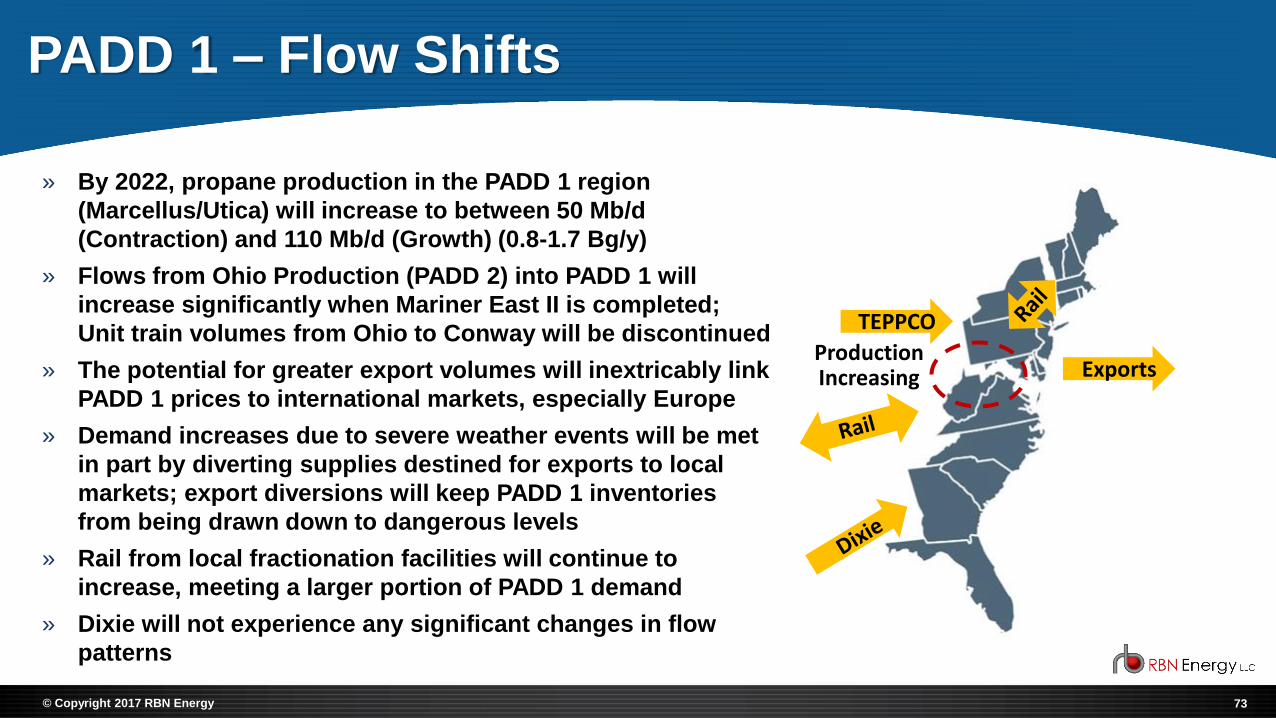
PADD 1 – Flow Shifts
» By 2022, propane production in the PADD 1 region
(Marcellus/Utica) will increase to between 50 Mb/d
(Contraction) and 110 Mb/d (Growth) (0.8-1.7 Bg/y)
» Flows from Ohio Production (PADD 2) into PADD 1 will
increase significantly when Mariner East II is completed;
Unit train volumes from Ohio to Conway will be discontinued
» The potential for greater export volumes will inextricably link
PADD 1 prices to international markets, especially Europe
» Demand increases due to severe weather events will be met
in part by diverting supplies destined for exports to local
markets; export diversions will keep PADD 1 inventories
from being drawn down to dangerous levels
» Rail from local fractionation facilities will continue to
increase, meeting a larger portion of PADD 1 demand
» Dixie will not experience any significant changes in flow
patterns
TEPPCO
Production Increasing Exports
74© Copyright 2017 RBN Energy
PADD 1 - Seasonal Supply Demand – Contraction Severe Weather
0
1
2
3
4
5
6
7
0
100
200
300
400
500
Bg
/y
Mb
/d
Supply
Production Inventory Draw Net Receipts Imports
0
100
200
300
400
500
Mb
/d
Demand
Product Supplied Net Deliveries Inventory Injection Exports

75© Copyright 2017 RBN Energy
PADD 1 – Weather Sensitivities – Contraction
0
1
2
3
4
5
050
100150200250300350
Bg/
y
Mb
/d
Receipts
Pipeline from PADD3 (Propane - Dixie)
Rail from PADD3 (Propane )
Pipeline from PADD 2 (Propane-TEPPCO and ME 2)
Rail from PADD 2 (Propane)
Imports (Propane)
0
1
2
3
4
5
6
7
8
9
MM
bb
l
Inventories
Last 5 year Range PV 19-20
76© Copyright 2017 RBN Energy
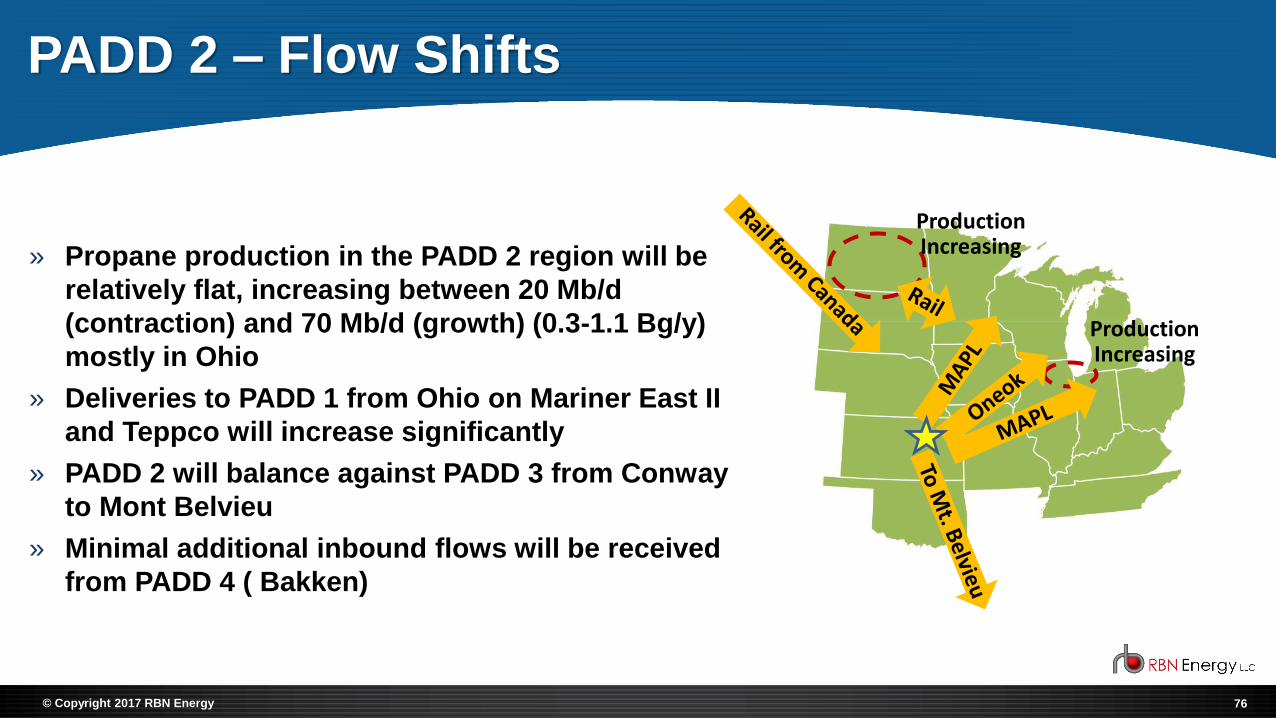
PADD 2 – Flow Shifts
» Propane production in the PADD 2 region will be
relatively flat, increasing between 20 Mb/d
(contraction) and 70 Mb/d (growth) (0.3-1.1 Bg/y)
mostly in Ohio
» Deliveries to PADD 1 from Ohio on Mariner East II
and Teppco will increase significantly
» PADD 2 will balance against PADD 3 from Conway
to Mont Belvieu
» Minimal additional inbound flows will be received
from PADD 4 ( Bakken)
Production Increasing
Production Increasing
77© Copyright 2017 RBN Energy
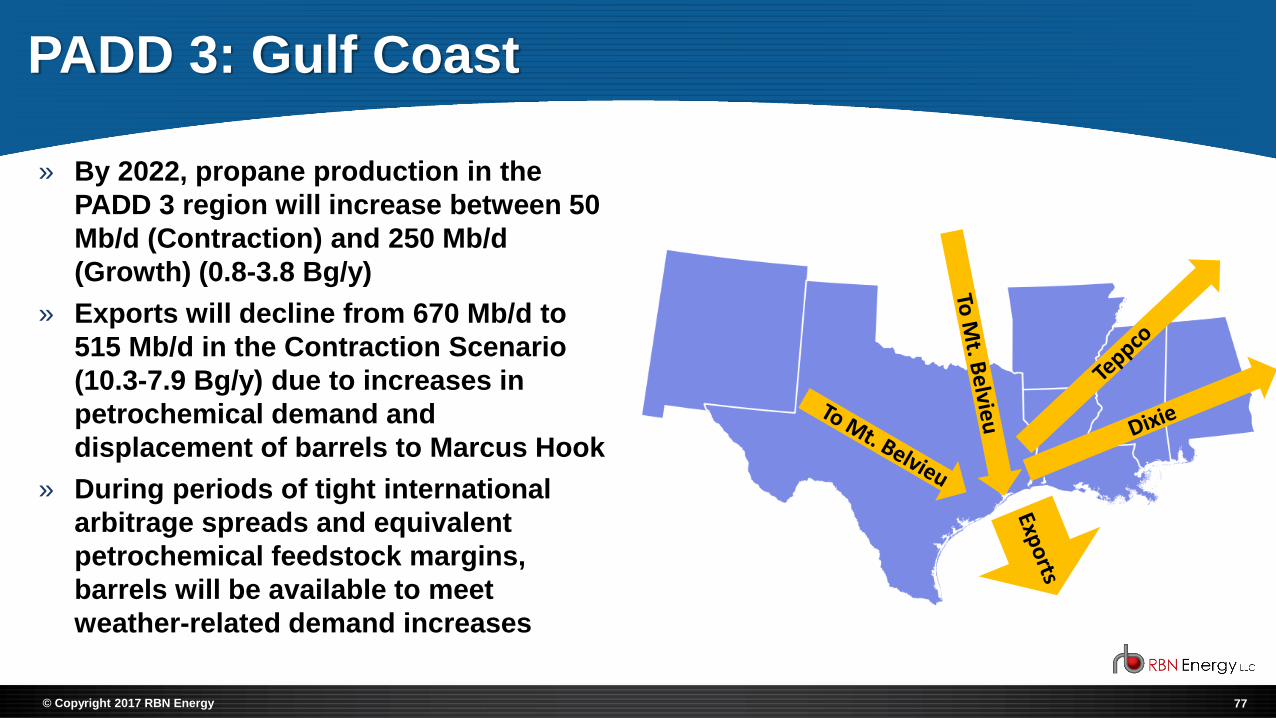
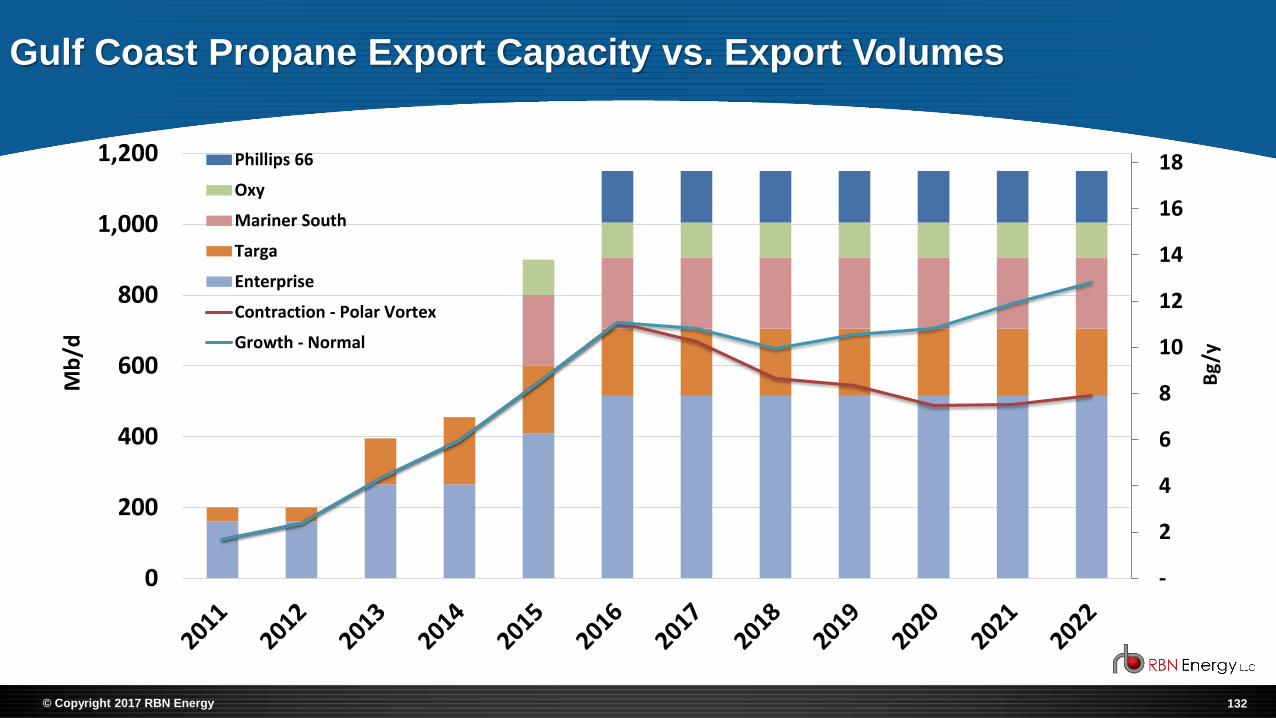
PADD 3: Gulf Coast
» By 2022, propane production in the
PADD 3 region will increase between 50
Mb/d (Contraction) and 250 Mb/d
(Growth) (0.8-3.8 Bg/y)
» Exports will decline from 670 Mb/d to
515 Mb/d in the Contraction Scenario
(10.3-7.9 Bg/y) due to increases in
petrochemical demand and
displacement of barrels to Marcus Hook
» During periods of tight international
arbitrage spreads and equivalent
petrochemical feedstock margins,
barrels will be available to meet
weather-related demand increases

78© Copyright 2017 RBN Energy
PADDs 4 and 5
» By 2022, propane production in the PADD 4 region will
increase to between 130 Mb/d (contraction) and 145 Mb/d
(growth) (2-2.2 Bg/y)
» 64 Mb/d (contraction) to 72 Mb/d (growth) of Bakken
propane (in y-grade) in 2020 will move from PADD 2 to
PADD 4, then move back to Conway, KS (PADD 2) on
Overland Pass (1-1.1 Bg/y)
» PADD 5 production is essentially unchanged at 45 Mb/d
(0.7 Bg/y)
» PADD 5 will compete for Canadian barrels against exports
to Asia from Ferndale and new British Columbia terminals
79© Copyright 2017 RBN Energy
Phase I Conclusions: Current Market Environment
» In the 3.5 years since the Polar Vortex of 2013-14, propane production has flattened, propane exports have doubled, rail has become a much more integral part of the propane supply chain, the spread between U.S. and international prices has collapsed, and margins for petrochemical feedstocks have converged.
» With more propane supply moving to exports than to U.S. consumer markets, international developments now exert a much greater influence over U.S. propane balances and prices. Likewise, U.S. prices and differentials to international markets impact the level of U.S. exports.
» During periods of severe weather, it is likely that the market will acquire incremental supplies from barrels otherwise destined for exports and petrochemical supplies. Propane prices will increase to a level that will result in export cargo cancellations and petchem feedstock switching. Consequently, it is less likely that U.S. inventories at major hubs will be drawn down to dangerous levels during severe weather events.
» However, this market behavior is primarily contingent on cargo cancellations. In the event that severe weather events overseas result in high demand levels for international supplies, significant U.S. price increases may be required to trigger cargo cancellations.
» Supplies sourced from cancelled cargos must be moved from export supply points (fractionators and storage feeding export demand), which during periods of severe weather will be subject to supply chain delays and disruptions.

80© Copyright 2017 RBN Energy
Phase I Conclusions: Market Outlook
» U.S. propane production is expected to increase from 1.5 MMb/d (23.0 Bg/y) in 2016 to about 1.9 MMb/d (29.1 Bg/y) in RBN’s 2022 Growth Scenario, but only to 1.6 MMb/d (24.5 Bg/y) in the 2022 Contraction Scenario. Appalachia (Marcellus/Utica) and Texas (Permian) will be the highest growth regions.
» In the Growth Scenario, supplies are abundant and exports continue to increase. There is enough supply to meet rising Marcus Hook exports, based on Mariner East II capacity (…but not ME2X or Mariner East II expansion, which would require incremental rail/pipeline receipts).
» Propane prices in the Growth Scenario increase in sympathy with crude oil price increases ($70/bbl in 2022), but as a percentage of crude maintain at 55%.
» In the Contraction scenario, modest production growth and increasing demand tightens the supply/demand balance. New ethane-only crackers and increasing ethane exports bid up the price of ethane, which encourages some petrochemical crackers to run more propane. Propane exports decline slightly due to declining surpluses, and some volumes shift from the Gulf Coast to the Northeast due to minimum commitments from Marcus Hook.
» Propane prices in the Contraction Scenario are constrained by lower prices of crude oil, but due to tighter supplies increase in relation to crude, up to 60% in the normal weather case.

81© Copyright 2017 RBN Energy
Phase I Conclusions: Market Outlook (Continued)
» Propane transportation by rail continues to increase, becoming still more important component of the propane supply chain.
» With increasing Appalachian production near Northeast and Midwest demand regions, better rail connectivity, and export volumes that can be bid away from global markets, the U.S. propane industry is in a better position to handle a “Polar Vortex” event than it was in the Winter of 2013-14.
» However, prices have the potential to be quite volatile in any weather-related event, since it is only higher prices that will bid supplies away from international and petrochemical markets.
» Extreme price volatility and supply chain disruptions are more likely in the Contraction Scenario than the Growth Scenario due to a lower absolute level of supply availability.
© Copyright 2017 RBN Energy
U.S. Propane Regional/ Infrastructure Analysis
83© Copyright 2017 RBN Energy
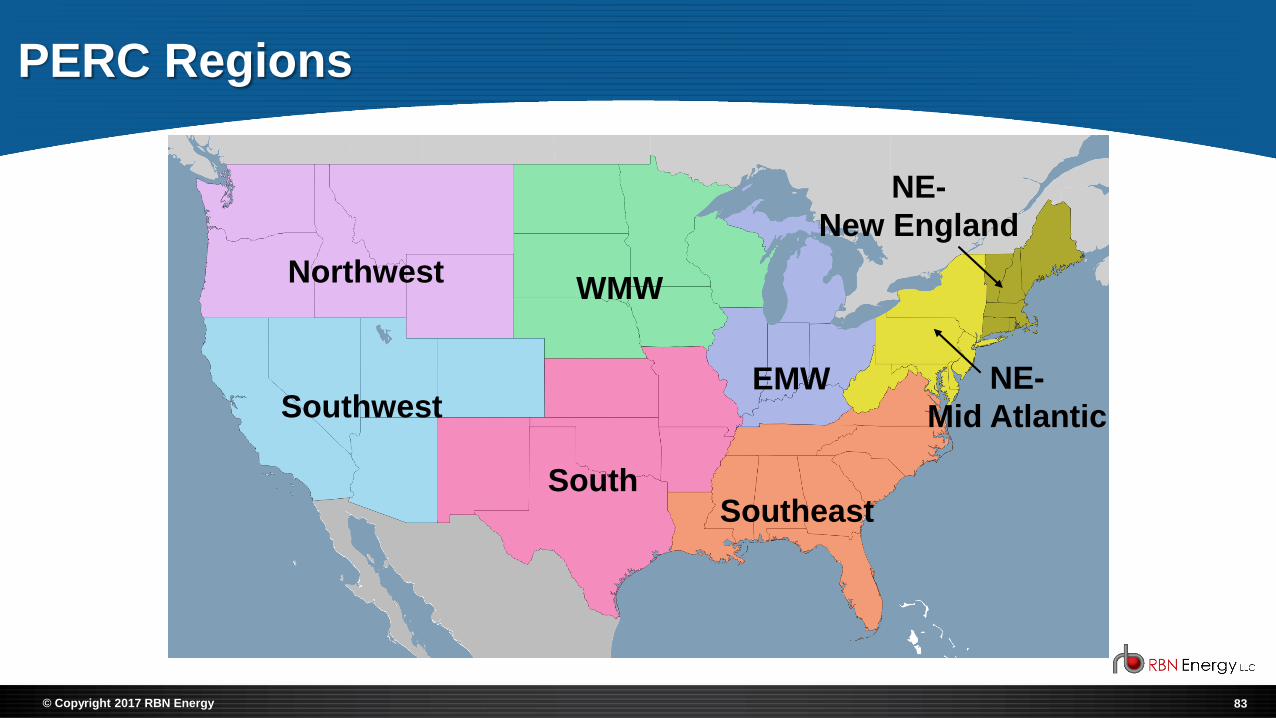
PERC Regions
Northwest
Southwest
WMW
SouthSoutheast
EMW
NE-
New England
NE-
Mid Atlantic

84© Copyright 2017 RBN Energy
U.S Propane Demand
Agricultural5%
Chemical55%
Commercial9%
Industrial2%
Other5%
Residential24%
Sectors
Source: API 2015; Includes Propylene
New England4% MidAtlantic
7%
Southeast23%
Southwest5%
EMW8%WMW
8%Northwest2%
South43%
Regions

85© Copyright 2017 RBN Energy
Supply Chain Reliability
» A retailer’s supply chain is one of its most
important investments
» The level of investment must be commensurate
with the supply chain risks faced by that retailer
» Different regional markets have widely
divergent supply chain risk factors, depending
on seasonal weather patterns, infrastructure,
and proximity to sources of supply
» Propane supply chain reliability can be
assessed (i.e., measured)▪ Regional Factor
▪ Retailer (individual company) Factor
▪ Composite Factor (combine regional and retailer)

86© Copyright 2017 RBN Energy
Propane Supply Reliability Index – Regional Factor
1 2 3 4 5 6 7 8 9 10 11 12 13 14 15 16 17 18 20 10 21 22 23 24 25 26 27 28 29 30

87© Copyright 2017 RBN Energy
Propane Supply Reliability Index - Concept
» PSRI score is a measure of propane supply risk associated with an individual propane retailer within that retailer’s geographic area
» The composite PSRI (regional factor + retailer factor) provides an indication of the supply risk associated with a specific firm’s supply profile in a given region
Regional Factor
RetailerFactor
PSRI Score

88© Copyright 2017 RBN Energy
Propane Supply Reliability Index – Regional Components
» Proximity of a market region to that region’s sources of supply. Metric is indicative of the most significant supply sources for the region.
Adjacency
Diversity
Seasonality
» The number of different supply sources for that region. Incorporates both diversity in individual supply points and number of transportation/storage alternatives available.
» Relationship of high/peak season demand to low season demand. Metric is based on average level and range of heating degree days in a region.

89© Copyright 2017 RBN Energy
Propane Supply Reliability Index - Concept
» Adjacency (10 = close to
supply, 1 = far from supply)
» Diversity (10 = several
sources of supply, 1 = few sources of supply)
» Seasonality (10 = small
seasonal swing, 1 = big seasonal swing)
Ad
jace
ncy
Diversity
Best
Worst
Regional Factor» Adjacency (access to and
reliability of local storage and supply sources)
» Diversity (supply
alternatives, including both physical and contractual terms)
» Seasonality (relationship
of peak season demand to low season demand; demand spike factor)
Retailer Factor
90© Copyright 2017 RBN Energy
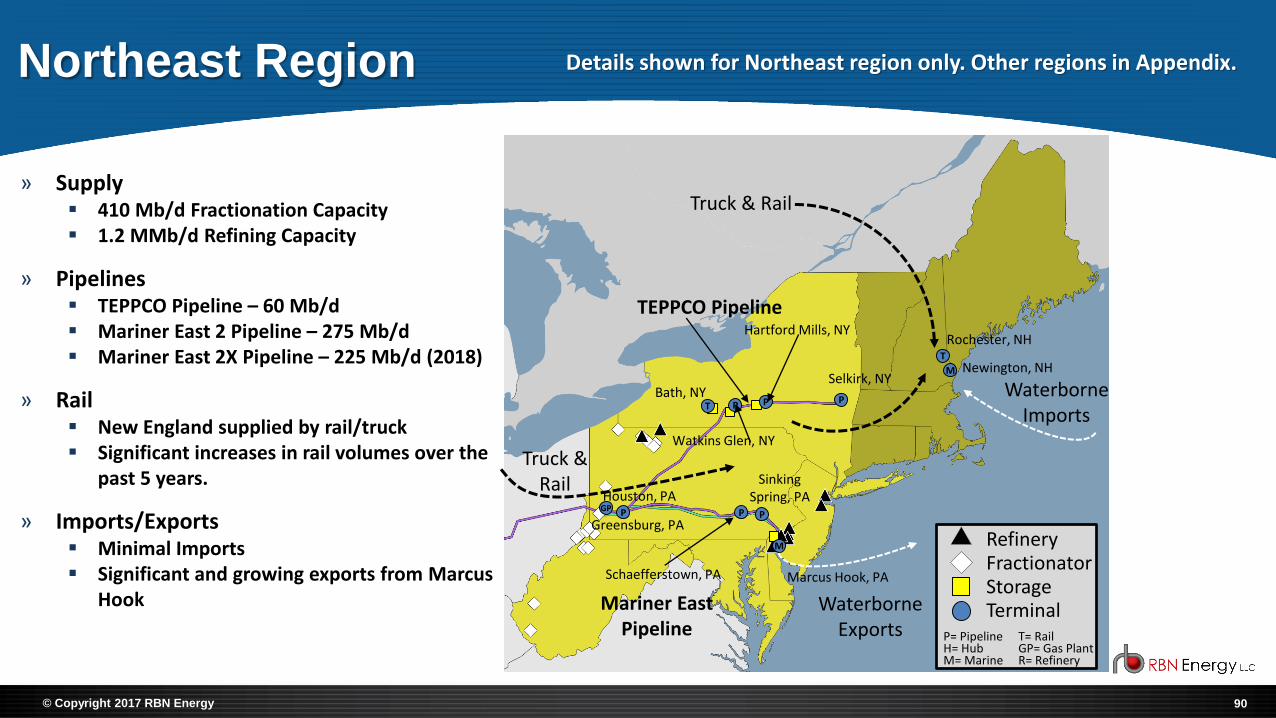
» Supply▪ 410 Mb/d Fractionation Capacity▪ 1.2 MMb/d Refining Capacity
» Pipelines▪ TEPPCO Pipeline – 60 Mb/d▪ Mariner East 2 Pipeline – 275 Mb/d▪ Mariner East 2X Pipeline – 225 Mb/d (2018)
» Rail▪ New England supplied by rail/truck▪ Significant increases in rail volumes over the
past 5 years.
» Imports/Exports▪ Minimal Imports▪ Significant and growing exports from Marcus
Hook
Northeast Region
TEPPCO Pipeline
Truck & Rail
WaterborneImports
Truck & Rail
Mariner East Pipeline
T
M
M
PT P
PPPGP
RefineryFractionatorStorageTerminal
P= PipelineH= Hub
T= RailGP= Gas Plant
M= Marine R= Refinery
Selkirk, NYBath, NY
P
Hartford Mills, NYRochester, NH
Newington, NH
Marcus Hook, PA
Sinking Spring, PA
Schaefferstown, PA
Houston, PA
Greensburg, PA
Watkins Glen, NY
WaterborneExports
Details shown for Northeast region only. Other regions in Appendix.

91© Copyright 2017 RBN Energy
Refinery
Northeast- New England Region
Fractionator
Truck & Rail
WaterborneImports
Truck & Rail
0 -
17
1 1
27
1
745 Million Gallons (49 Mb/d)
Agricultural (5) Chemical
Commercial (264) Industrial (17)
Internal Combustion (18) Residential (421)
Sales to Retailers (19)
0
200
400
600
800
1000
1200
1400
1600
# o
f H
DD
s
New England Average
WaterborneImports
Source: Map-RBN, Demand-API (includes RGP), HDDs-Bloomberg (million gallons in parenthesis, Mb/d in graphic)
M
Rochester, NH
Newington, NHT
P
Selkirk, NY
92© Copyright 2017 RBN Energy
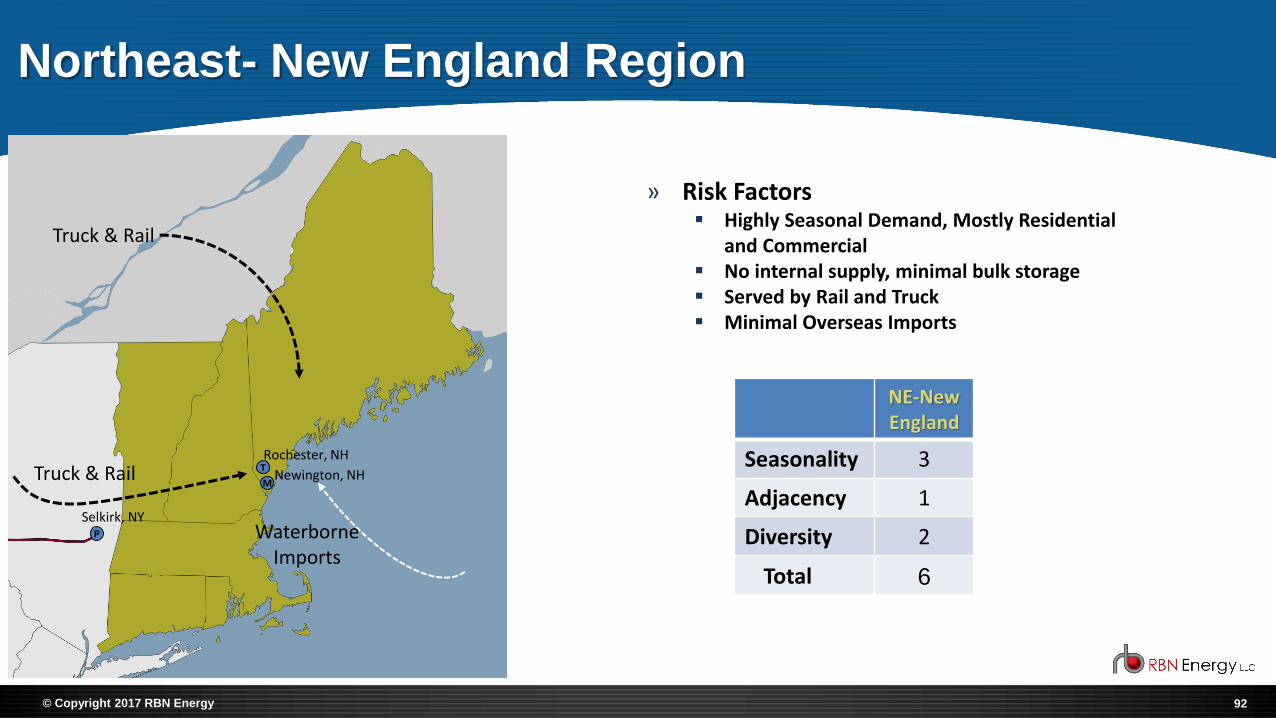
Northeast- New England Region
Truck & Rail
Truck & Rail
WaterborneImports
» Risk Factors▪ Highly Seasonal Demand, Mostly Residential
and Commercial▪ No internal supply, minimal bulk storage▪ Served by Rail and Truck▪ Minimal Overseas Imports
NE-New England
Seasonality 3
Adjacency 1
Diversity 2
Total 6
M
T
P
Selkirk, NY
Rochester, NH
Newington, NH

93© Copyright 2017 RBN Energy
Northeast Mid-Atlantic Region
TEPPCO Pipeline
Truck & Rail
WaterborneImports
Truck & Rail
Mariner East Pipeline
RefineryFractionatorStorageTerminal
P= PipelineH= Hub
T= RailGP= Gas Plant
M= Marine R= Refinery
3
13
15
3 4
39
3
1.2 Billion Gallons (80 Mb/d)
Agricultural (51) Chemical (206)
Commercial (277) Industrial (41)
Internal Combustion (57) Residential (600)
Sales to Retailers (45)
0
200
400
600
800
1000
1200
1400
1600
# o
f H
DD
s
Sum of Mid-Atlantic Average
Source: Map-RBN, Demand-API (includes RGP), HDDs-Bloomberg (million gallons in parenthesis, Mb/d in graphic)
M
PPPGP
Bath, NY
Hartford Mills, NY
Marcus Hook, PASchaefferstown, PA
Greensburg, PA
Watkins Glen, NY
Sinking Spring, PAHouston, PA
PPT
94© Copyright 2017 RBN Energy
TEPPCO Pipeline
Truck & Rail
WaterborneImports
Truck & Rail
RefineryFractionatorStorageTerminal
P= PipelineH= Hub
T= RailGP= Gas Plant
M= Marine R= Refinery
Mariner East Pipeline
M
P
PPGP
P
Hartford Mills, NY
Marcus Hook, PASchaefferstown, PA
Greensburg, PA
Watkins Glen, NY
Sinking Spring, PAHouston, PA
T
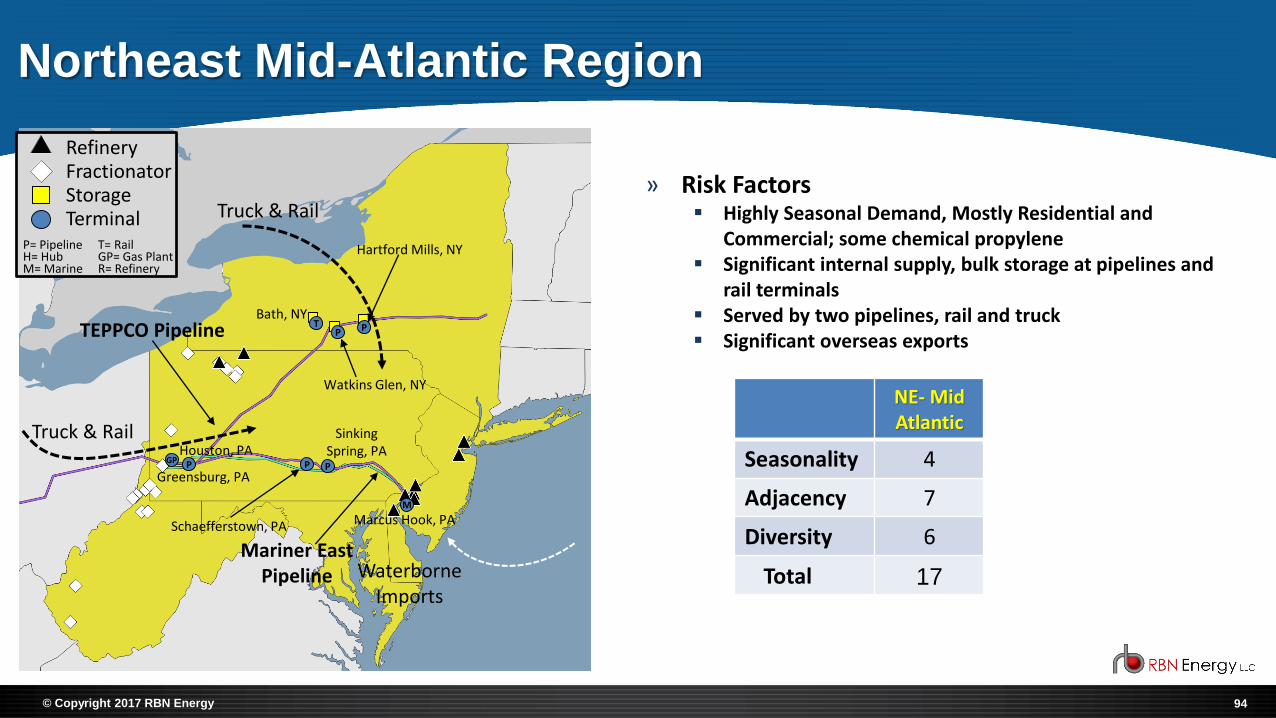
Northeast Mid-Atlantic Region
» Risk Factors▪ Highly Seasonal Demand, Mostly Residential and
Commercial; some chemical propylene▪ Significant internal supply, bulk storage at pipelines and
rail terminals▪ Served by two pipelines, rail and truck▪ Significant overseas exports
NE- Mid Atlantic
Seasonality 4
Adjacency 7
Diversity 6
Total 17
Bath, NY
P
95© Copyright 2017 RBN Energy
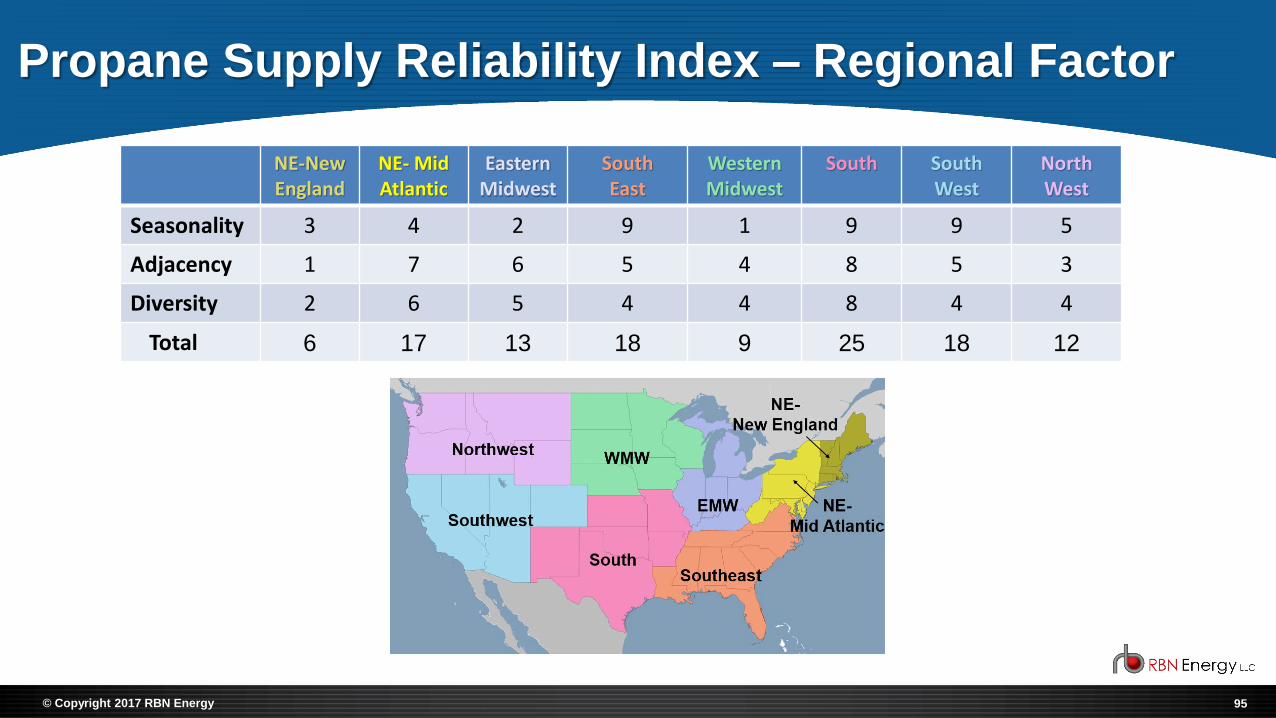
Propane Supply Reliability Index – Regional Factor
NE-New England
NE- Mid Atlantic
Eastern Midwest
SouthEast
Western Midwest
South South West
North West
Seasonality 3 4 2 9 1 9 9 5
Adjacency 1 7 6 5 4 8 5 3
Diversity 2 6 5 4 4 8 4 4
Total 6 17 13 18 9 25 18 12

96© Copyright 2017 RBN Energy
Phase I Conclusions: Regional/ Infrastructure Analysis
» Northeast-New England [6] and Western Midwest [9] must deal with huge seasonal swings in demand, which complicates supply chain planning. New England has no pipeline supply and little storage, thus is particularly vulnerable to disruption. Supply in Western Midwest has some pipeline access which improves reliability, but supply planning is complicated by the possibility of large agricultural demand spikes prior to onset of the heating demand season.
» Eastern Midwest [13] and Northeast-Mid Atlantic [17] also have significant seasonal demand swings but the regions have access to more adjacent supply sources in the form of fractionators, refineries and storage. In recent years, Northeast-Mid Atlantic has enjoyed significant increases in supplies, with much of the volume moving to market destinations via rail, which is typically more susceptible to disruption than pipeline.
» The Northwest [12] suffers from limited access to local supplies, with only a few refineries providing volumes within the area and all other barrels moved into the region via rail (both domestic and Canadian imports). While severe seasonal spikes are infrequent, when they happen the region is susceptible to supply chain disruption, such as the events of 2016-17.
97© Copyright 2017 RBN Energy
Phase I Conclusions: Regional/ Infrastructure Analysis
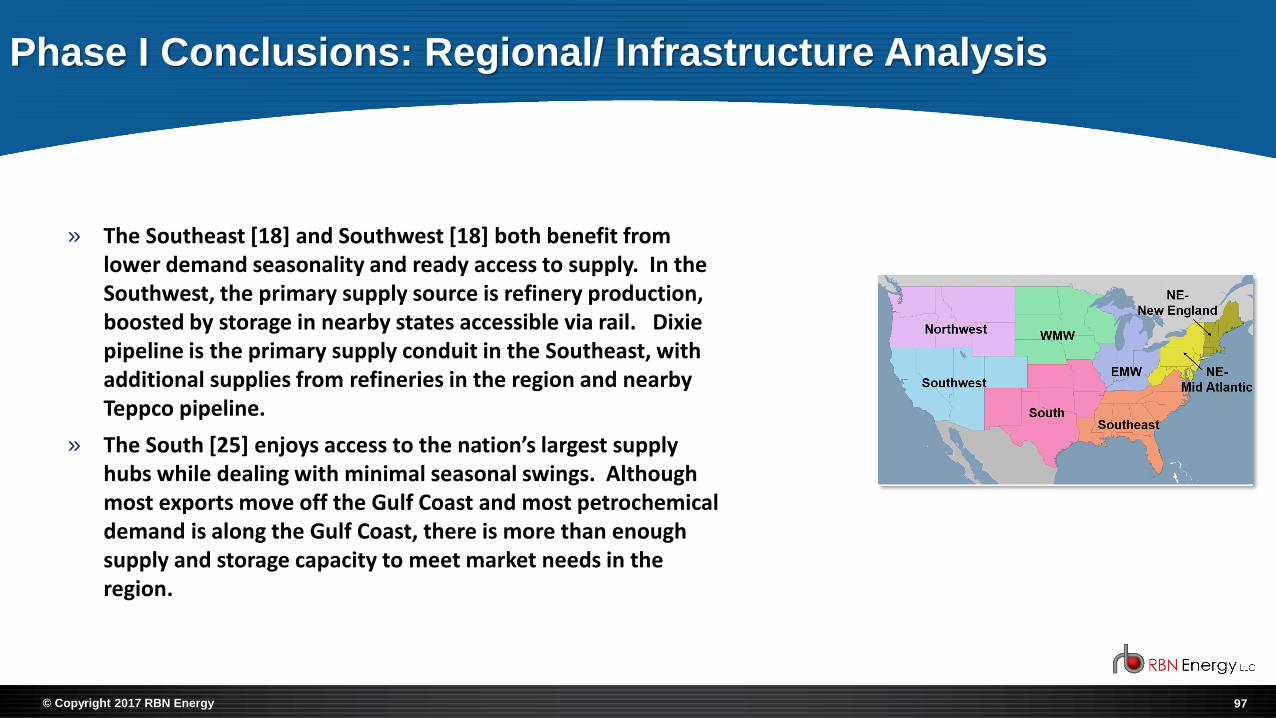
» The Southeast [18] and Southwest [18] both benefit from lower demand seasonality and ready access to supply. In the Southwest, the primary supply source is refinery production, boosted by storage in nearby states accessible via rail. Dixie pipeline is the primary supply conduit in the Southeast, with additional supplies from refineries in the region and nearby Teppco pipeline.
» The South [25] enjoys access to the nation’s largest supply hubs while dealing with minimal seasonal swings. Although most exports move off the Gulf Coast and most petrochemical demand is along the Gulf Coast, there is more than enough supply and storage capacity to meet market needs in the region.

98© Copyright 2017 RBN Energy
Phase I Conclusions: Strategic Propane Reserve
» In the aftermath of the Polar Vortex winter of 2013-14 there were calls to establish a “Strategic Propane Reserve” to provide additional supply reliability for the U.S. propane industry.
» If such a reserve was in a central location, there were significant doubts as to whether a Reserve would have helped during that winter. That is because most of the supply chain disruptions were due to local market and logistical glitches, not shortages at central hub locations. Thus to address supply chain disruption problems, there would need to be many such Reserves setup all across the various regions which are most susceptible to supply chain difficulties.
» Due to the wide disparity between the logistical networks in each region, any dispersed Reserve program would need to be customized for the specific area being served. By doing so, the Reserve facility would be likely to compete with commercial facilities offering similar services, creating a variety of commercial difficulties.
» Furthermore, due to the widely diverse needs of individual retail propane retailers, a program designed to incentivize investment by each retailer based on that firm’s needs is likely to be much more successful than a mandated, regional or national level Reserve.

99© Copyright 2017 RBN Energy
Propane Supply Chain and Infrastructure: Project Design
Phase II
» Overview: Phase II focused on the propane supply and distribution network, constraints that develop within that network, and strategies to mitigate those constraints.
» Progress to Date: RBN has conducted phone interviews so far with the following firms to help define and understand the Phase II project scope.
• AmeriGas • Ferrell Gas
• CHS • Targa Resources
• Crestwood Energy • Thompson Gas
100© Copyright 2017 RBN Energy
Propane Supply Chain and Infrastructure: Phase II
T
M
Rochester, NH
Newington, NH
P
Selkirk, NY
T
Walpole, NH
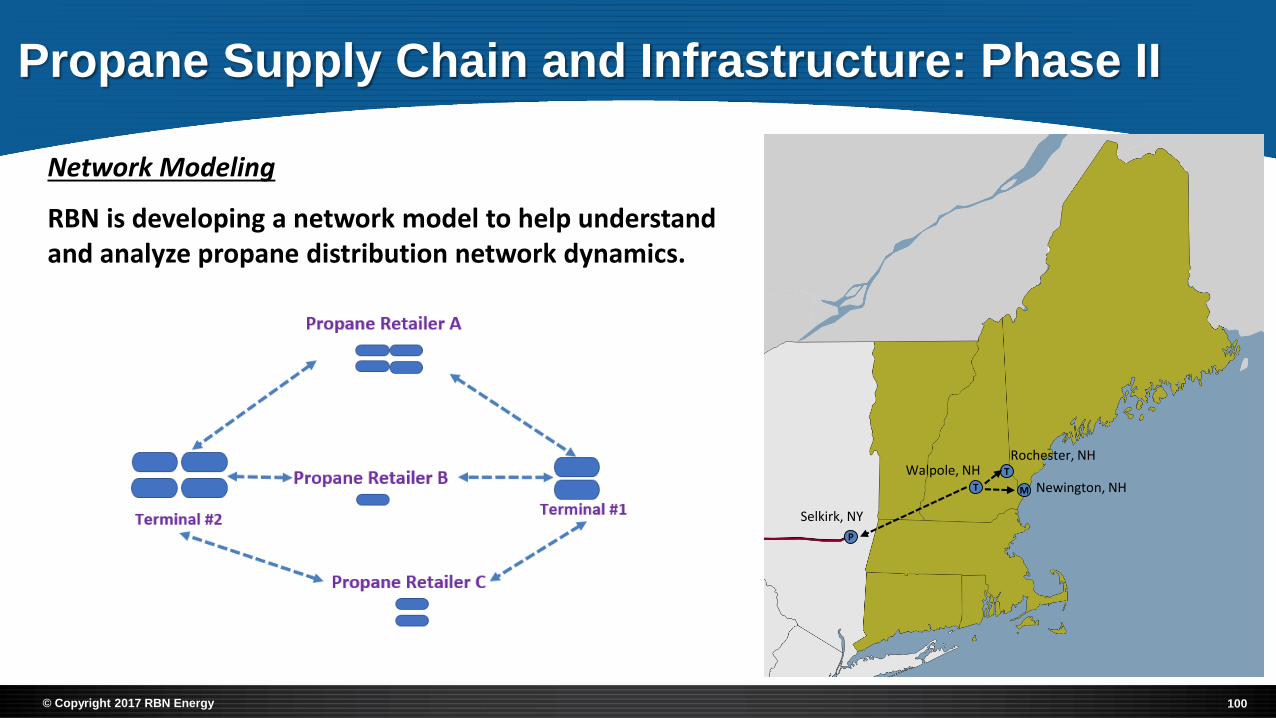
Network Modeling
RBN is developing a network model to help understand and analyze propane distribution network dynamics.

101© Copyright 2017 RBN Energy
Propane Supply Chain and Infrastructure: Phase II
Retailer Factor (Supply Chain Score)
Adjacency • “X” days of supply on hand in owned or directly controlled storage during peak season.• Distance (in hours) from primary and secondary supply points; fulfillment capacity of those supply points• Supply chain risk factors – transportation assets, transportation manpower, logistical vulnerabilities
Diversity • Number of physical supply source alternatives (physical supply source locations)• Diverse transport modes into supply sources (pipeline, rail, truck, barge, etc.)• Alternative supply pricing/contractual mechanisms (fixed/index/spot, owned/take-or-pay/spot)
Seasonality • Winter/summer ratio (relationship between average Oct-Mar demand vs. Apr-Sep)• Lowest to highest month ratio (e.g., Jan vs. Jul)• Demand spike factor (multiplier for peak period demand based on severe weather)

102© Copyright 2017 RBN Energy
Next Steps – Phase II
» Objectives for Phase II
▪ Delineate the supply chain risks faced by propane retailers related to potential severe weather events
▪ Develop a model of the propane supply network that simulates how triggering weather events can result in disruptions that cascade across the market into a specific retail propane business’s supply chain
▪ Recommend risk mitigation measures designed to minimize the impact on each propane retailer in a given region, thereby managing risk for the entire retail distribution network
» Phase II - Project Definition
▪ Scope
▪ Deliverables
▪ Timeline

103© Copyright 2017 RBN Energy

104© Copyright 2017 RBN Energy
The Domino Effect
“This book is about understanding
energy markets: prices, flows, infrastructure, value, and economics.”
Book about energy markets
From Rusty Braziel
www.thedominoeffect.com

© Copyright 2017 RBN Energy
Appendix I: Regional Infrastructure Analysis
106© Copyright 2017 RBN Energy
Southeast Region
Dixie Pipeline
RefineryFractionatorStorageTerminal
P= PipelineH= Hub
T= RailGP= Gas Plant
M= Marine R= Refinery
M
R
M
P
P
M
PH
Apex, NC
TEPPCO Pipeline
Memphis, TN
Hattiesburg, MS Albany, GA
Panama City, FL
Tampa, FL
13
185
24
5 8
44
3
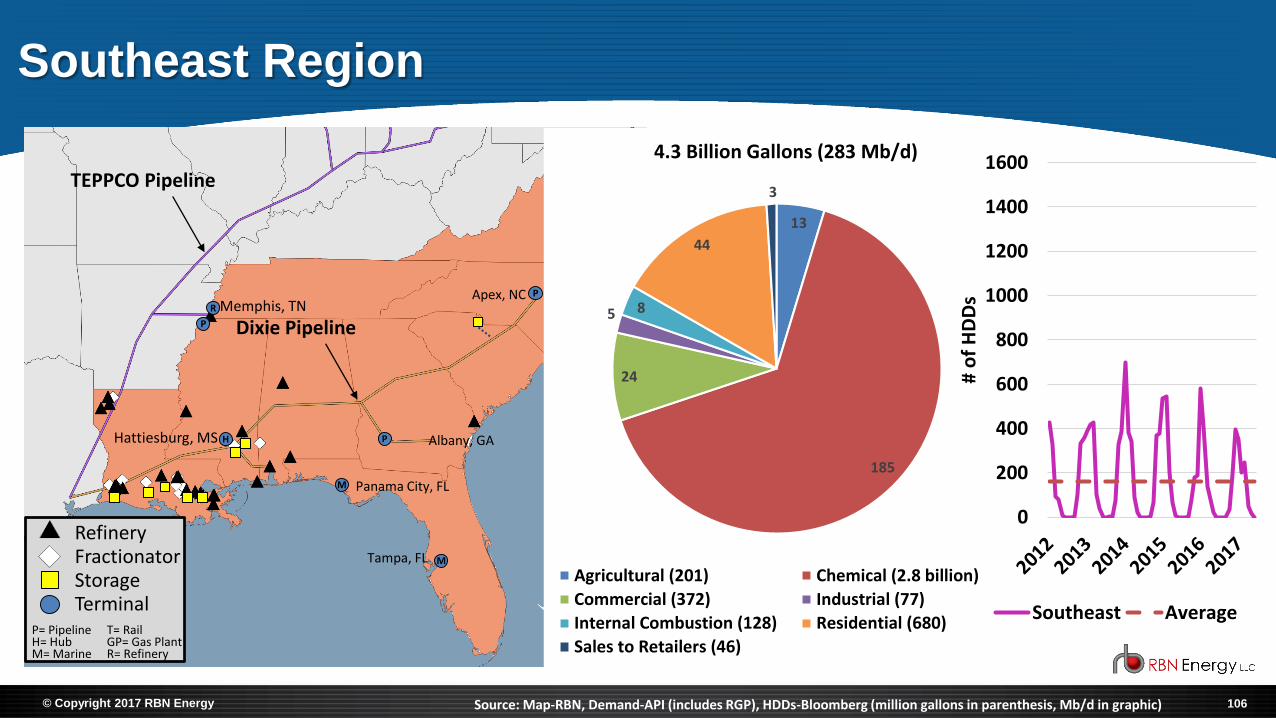
4.3 Billion Gallons (283 Mb/d)
Agricultural (201) Chemical (2.8 billion)
Commercial (372) Industrial (77)
Internal Combustion (128) Residential (680)
Sales to Retailers (46)
0
200
400
600
800
1000
1200
1400
1600
# o
f H
DD
s
Southeast Average
Source: Map-RBN, Demand-API (includes RGP), HDDs-Bloomberg (million gallons in parenthesis, Mb/d in graphic)
107© Copyright 2017 RBN Energy
Southeast Region
Dixie Pipeline
RefineryFractionatorStorageTerminal
P= PipelineH= Hub
T= RailGP= Gas Plant
M= Marine R= Refinery
M
R
M
P
P
M
PH
Apex, NC
Chesapeake, VA
TEPPCO Pipeline
Memphis, TN
Hattiesburg, MS Albany, GA
Panama City, FL
Tampa, FL
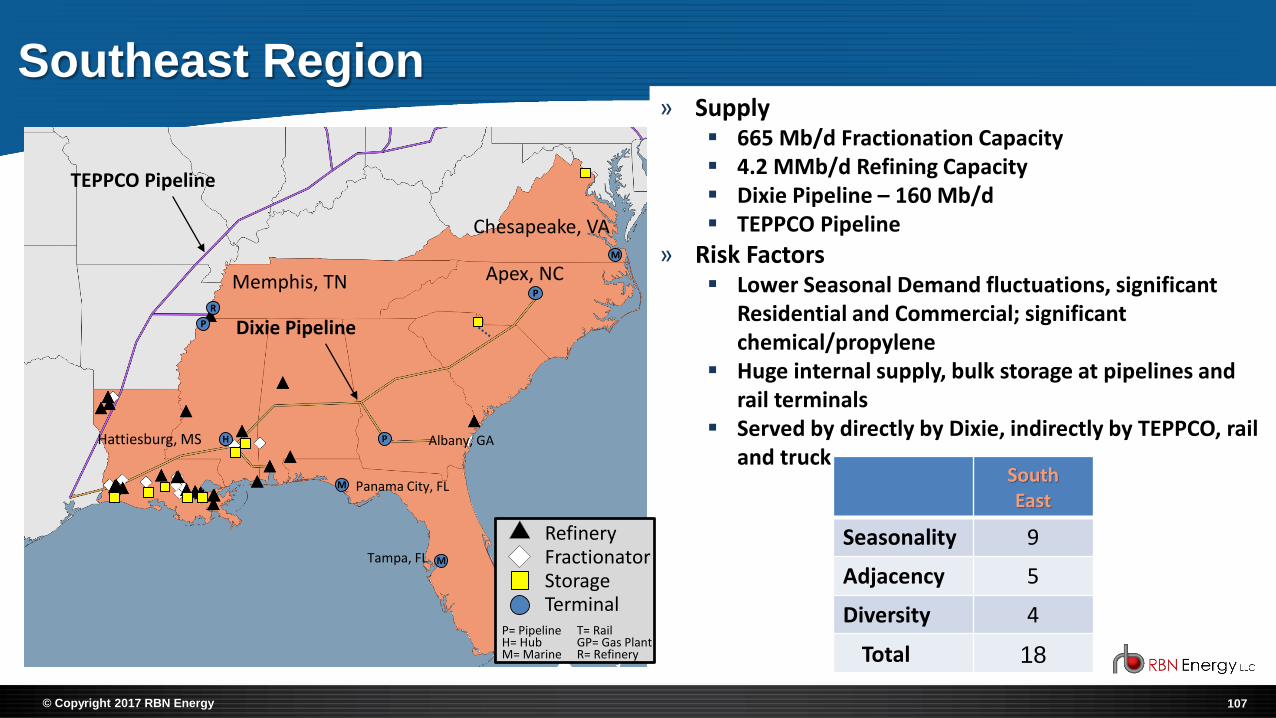
» Supply▪ 665 Mb/d Fractionation Capacity▪ 4.2 MMb/d Refining Capacity▪ Dixie Pipeline – 160 Mb/d▪ TEPPCO Pipeline
» Risk Factors▪ Lower Seasonal Demand fluctuations, significant
Residential and Commercial; significant chemical/propylene
▪ Huge internal supply, bulk storage at pipelines and rail terminals
▪ Served by directly by Dixie, indirectly by TEPPCO, rail and truck
SouthEast
Seasonality 9
Adjacency 5
Diversity 4
Total 18

108© Copyright 2017 RBN Energy
Western Midwest Region
EnterpriseMAPL Pipeline
ONEOK North Pipeline
NuStarEast Sys. Pipeline
Alliance Pipeline
RefineryFractionatorStorageTerminal
P= PipelineH= Hub
T= RailGP= Gas Plant
M= Marine R= Refinery
P
T
P
Iowa City, IA
Pine Bend, MN
Superior, WI
20
5
9
5
4
52
1
1.5 Billion Gallons (96 Mb/d)
Agricultural (303) Chemical (71)
Commercial (138) Industrial (76)
Internal Combustion (66) Residential (801)
Sales to Retailers (19)
0
200
400
600
800
1000
1200
1400
1600
# o
f H
DD
s
WMW Average
Source: Map-RBN, Demand-API (includes RGP), HDDs-Bloomberg (million gallons in parenthesis, Mb/d in graphic)

109© Copyright 2017 RBN Energy
Western Midwest Region
EnterpriseMAPL Pipeline
ONEOK North Pipeline
NuStarEast Sys. Pipeline
Alliance Pipeline
RefineryFractionatorStorageTerminal
P= PipelineH= Hub
T= RailGP= Gas Plant
M= Marine R= Refinery
P
T
P
Iowa City, IA
Pine Bend, MN
Superior, WI
» Supply▪ 26 Mb/d Fractionation Capacity▪ 480 Mb/d Refining Capacity▪ MAPL Pipeline ▪ ONEOK North Pipeline -- 125 Mb/d
» Risk Factors▪ Highly Seasonal Demand, Largest agricultural
demand sector▪ Served by pipelines, rail and truck▪ Significant rail imports from Canada
Western Midwest
Seasonality 1
Adjacency 4
Diversity 4
Total 9

110© Copyright 2017 RBN Energy
Eastern Midwest Region
RefineryFractionatorStorageTerminal
P= PipelineH= Hub
R= RailGP= Gas Plant
M= Marine R= Refinery
T T
P
GP
East St Louis, IL
Marysville, MI
St. Clair, MI
Hopedale, OH
9 2
9
5
7
61
2
1.5 Billion Gallons (95 Mb/d)
Agricultural (145) Chemical (29)
Commercial (134) Industrial (76)
Internal Combustion (111) Residential (933)
Sales to Retailers (34)
0
200
400
600
800
1000
1200
1400
1600
# o
f H
DD
s
EMW Average
Source: Map-RBN, Demand-API (includes RGP), HDDs-Bloomberg (million gallons in parenthesis, Mb/d in graphic)

111© Copyright 2017 RBN Energy
Eastern Midwest Region
RefineryFractionatorStorageTerminal
P= PipelineH= Hub
R= RailGP= Gas Plant
M= Marine R= Refinery
T T
P
GP
East St Louis, IL
Marysville, MI
St. Clair, MI
» Supply▪ 466 Mb/d Fractionation Capacity▪ 2.3 MMb/d Refining Capacity▪ MAPL Pipeline – 275 Mb/d▪ TEPPCO Pipeline – 60 Mb/d▪ Marysville Storage
» Risk Factors▪ Highly Seasonal Demand, largest residential sector in the U.S.▪ Significant new Utica production in Ohio▪ Served by pipelines, rail and truck▪ Canadian barrels delivered into Aux Sable via Alliance
Eastern Midwest
Seasonality 2
Adjacency 6
Diversity 5
Total 13
Hopedale, OH
112© Copyright 2017 RBN Energy
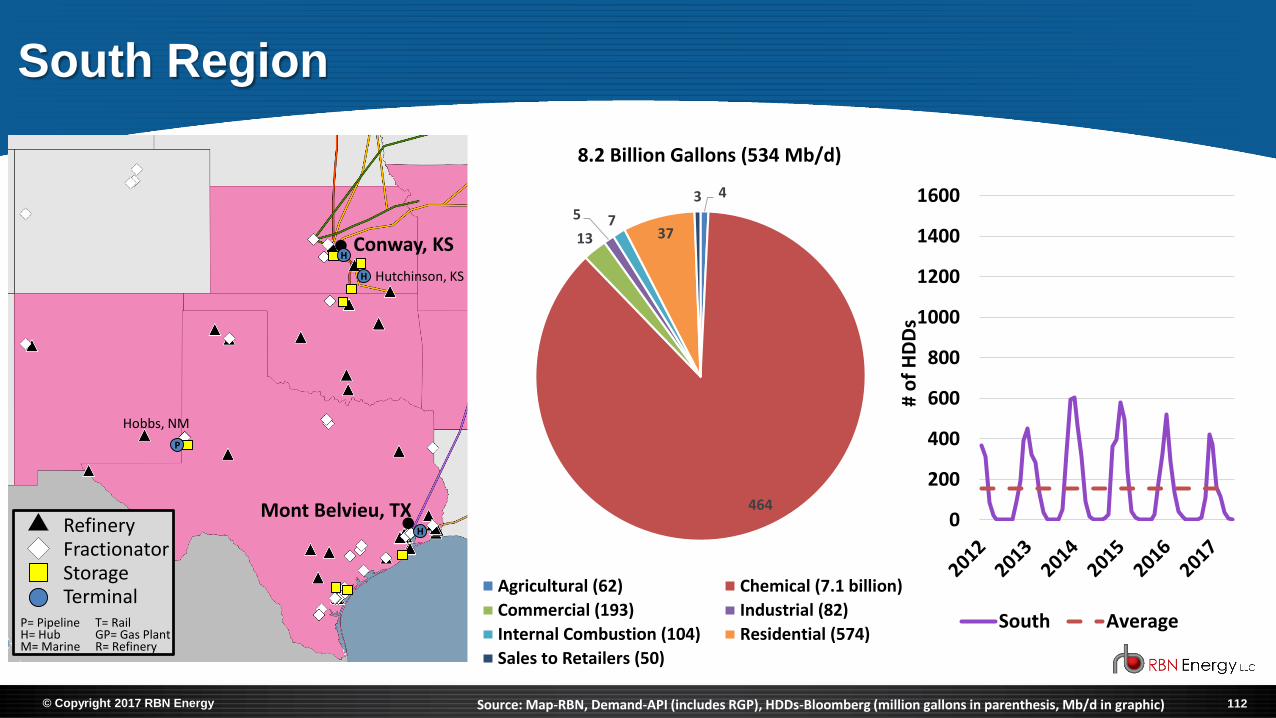
South Region
Conway, KS
Mont Belvieu, TXRefineryFractionatorStorageTerminal
P= PipelineH= Hub
T= RailGP= Gas Plant
M= Marine R= Refinery
H
P
H
H
Hobbs, NM
Hutchinson, KS
4
464
13
5 7 37
3
8.2 Billion Gallons (534 Mb/d)
Agricultural (62) Chemical (7.1 billion)
Commercial (193) Industrial (82)
Internal Combustion (104) Residential (574)
Sales to Retailers (50)
0
200
400
600
800
1000
1200
1400
1600
# o
f H
DD
s
South Average
Source: Map-RBN, Demand-API (includes RGP), HDDs-Bloomberg (million gallons in parenthesis, Mb/d in graphic)

113© Copyright 2017 RBN Energy
South Region
Conway, KS
Mont Belvieu, TXRefineryFractionatorStorageTerminal
P= PipelineH= Hub
T= RailGP= Gas Plant
M= Marine R= Refinery
H
P
H
H
Hobbs, NM
Hutchinson, KS
» Supply▪ 3 MMb/d Fractionation Capacity▪ 6.8 MMb/d Refining Capacity▪ Mont Belvieu and Conway Storage▪ Pipelines out of the region
» Risk Factors▪ Low seasonal demand fluctuations, by far the largest
petrochemical sector▪ Growing supply, mostly from Permian▪ Huge Gulf Coast exports▪ Served by pipelines, rail and truck
South
Seasonality 9
Adjacency 8
Diversity 8
Total 25

114© Copyright 2017 RBN Energy
2 -
6
3
2
13
1
421 Million Gallons (27 Mb/d)
Agricultural (31) Chemical
Commercial (91) Industrial (42)
Internal Combustion (38) Residential (200)
Sales to Retailers (19)
Northwest Region
Opal, WY
Ferndale, WA
Casper, WYRefineryFractionatorStorageTerminal
P= PipelineH= Hub
T= RailGP= Gas Plant
M= Marine R= Refinery 0
200
400
600
800
1000
1200
1400
1600
# o
f H
DD
s
Northwest Average
Source: Map-RBN, Demand-API (includes RGP), HDDs-Bloomberg (million gallons in parenthesis, Mb/d in graphic)
M
PGP
GP

115© Copyright 2017 RBN Energy
Northwest Region
RefineryFractionatorStorageTerminal
P= PipelineH= Hub
T= RailGP= Gas Plant
M= Marine R= Refinery
» Supply▪ 55 Mb/d Fractionation Capacity▪ 985 Mb/d Refining Capacity▪ Export capacity from Ferndale, WA▪ Significant rail imports from Canada
» Risk Factors▪ Moderate seasonal demand fluctuations, relatively
small market▪ Coastal demand distant from Rockies supply▪ Served by rail and truck▪ Increasing competition from Canadian exports to Asia
North West
Seasonality 5
Adjacency 3
Diversity 4
Total 12
M Ferndale, WA
PGP
GPCasper, WY
Opal, WY
116© Copyright 2017 RBN Energy
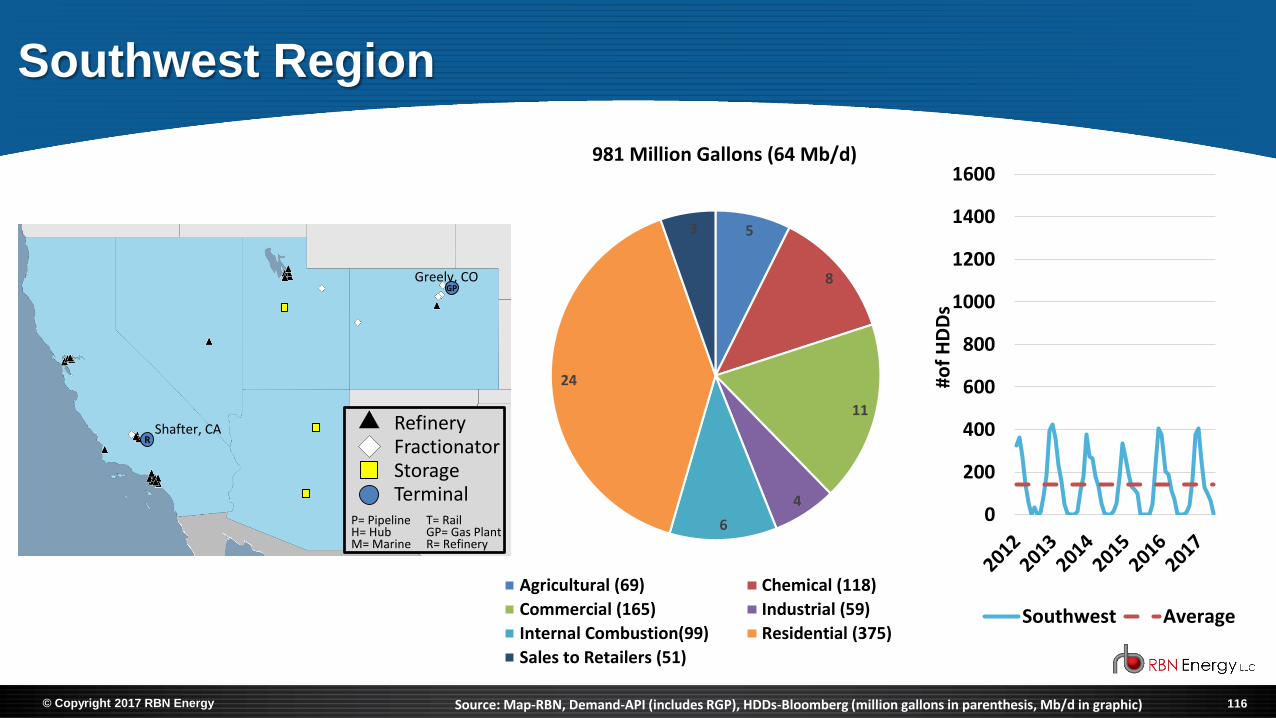
5
8
11
4
6
24
3
981 Million Gallons (64 Mb/d)
Agricultural (69) Chemical (118)
Commercial (165) Industrial (59)
Internal Combustion(99) Residential (375)
Sales to Retailers (51)
Southwest Region
Greely, CO
Shafter, CA RefineryFractionatorStorageTerminal
P= PipelineH= Hub
T= RailGP= Gas Plant
M= Marine R= Refinery
0
200
400
600
800
1000
1200
1400
1600
#of
HD
Ds
Southwest Average
Source: Map-RBN, Demand-API (includes RGP), HDDs-Bloomberg (million gallons in parenthesis, Mb/d in graphic)
R
GP
117© Copyright 2017 RBN Energy
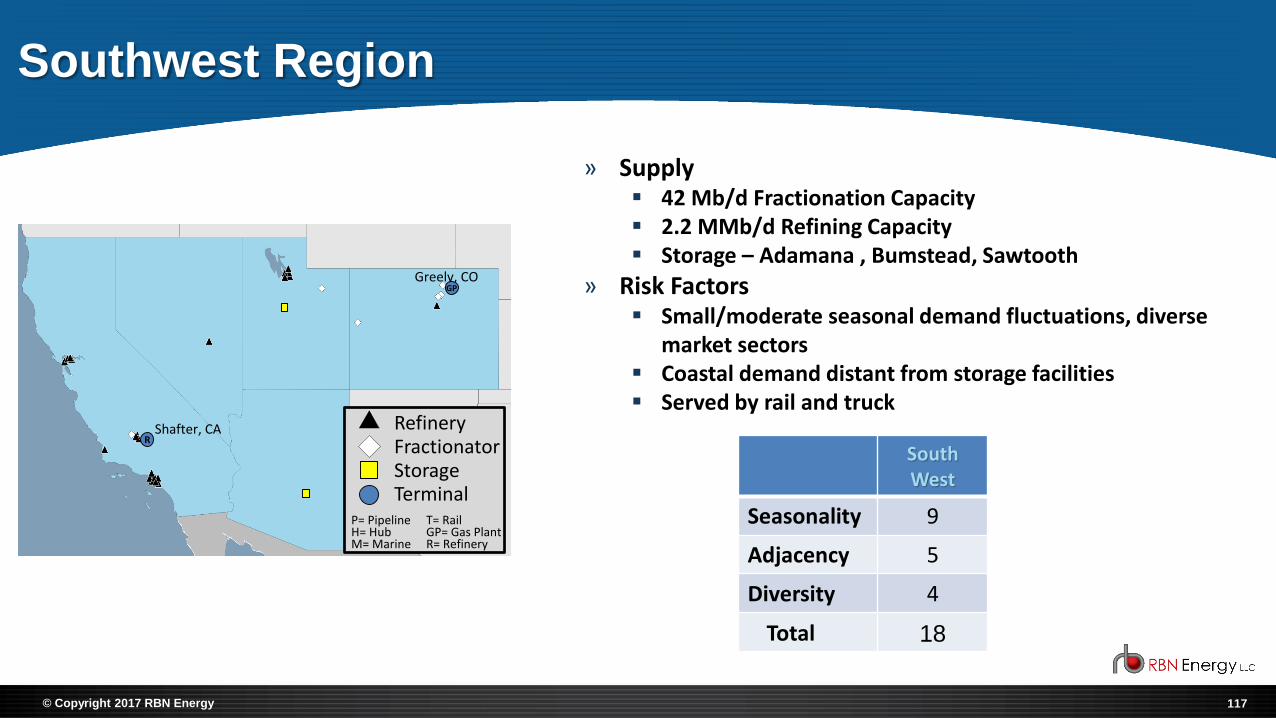
Southwest Region
Greely, CO
Shafter, CA RefineryFractionatorStorageTerminal
P= PipelineH= Hub
T= RailGP= Gas Plant
M= Marine R= Refinery
» Supply▪ 42 Mb/d Fractionation Capacity▪ 2.2 MMb/d Refining Capacity▪ Storage – Adamana , Bumstead, Sawtooth
» Risk Factors▪ Small/moderate seasonal demand fluctuations, diverse
market sectors▪ Coastal demand distant from storage facilities▪ Served by rail and truck
South West
Seasonality 9
Adjacency 5
Diversity 4
Total 18
GP
R

© Copyright 2017 RBN Energy
Appendix II: Supply/Demand Analysis
119© Copyright 2017 RBN Energy
8.5
8.6
8.7
8.8
8.9
9.0
9.1
9.2
9.3
9.4
MM
B/d
U.S. Crude Oil Production
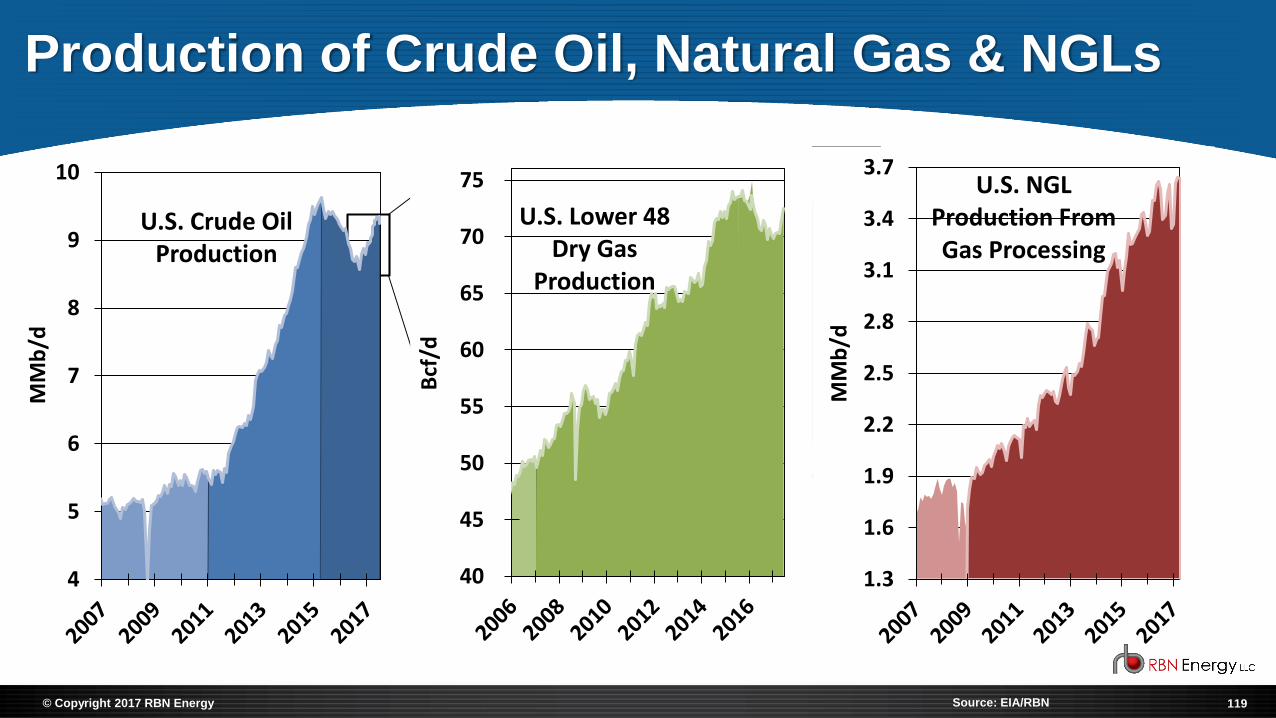
Production of Crude Oil, Natural Gas & NGLs
Source: EIA/RBN
4
5
6
7
8
9
10
MM
b/d
U.S. Crude Oil Production
40
45
50
55
60
65
70
75
Bcf
/d
U.S. Lower 48 Dry Gas
Production
1.3
1.6
1.9
2.2
2.5
2.8
3.1
3.4
3.7
MM
b/d
U.S. NGLProduction From Gas Processing
120© Copyright 2017 RBN Energy
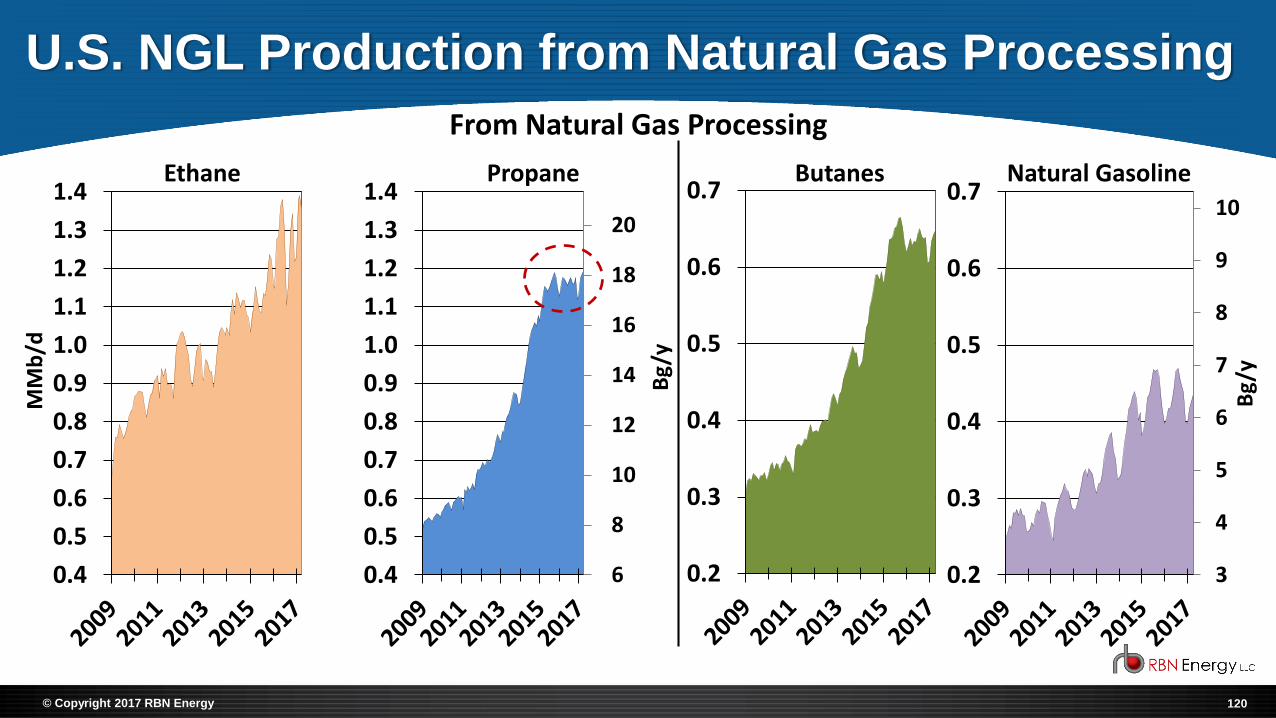
U.S. NGL Production from Natural Gas Processing
0.2
0.3
0.4
0.5
0.6
0.7Butanes
From Natural Gas Processing
3
4
5
6
7
8
9
10
0.2
0.3
0.4
0.5
0.6
0.7
Bg/
y
Natural Gasoline
6
8
10
12
14
16
18
20
0.4
0.5
0.6
0.7
0.8
0.9
1.0
1.1
1.2
1.3
1.4
Bg/
y
Propane
0.4
0.5
0.6
0.7
0.8
0.9
1.0
1.1
1.2
1.3
1.4
MM
b/d
Ethane

121© Copyright 2017 RBN Energy
U.S. LPG Exports (Propane & Butane)
-
2
4
6
8
10
12
14
16
-
200
400
600
800
1,000
Bg/
y
U.S. Total Overseas LPG Exports
West Coast
East Coast
Gulf Coast
Mb
/d
-
200
400
600
800
1,000
U.S. Total LPG Imports
Mb
/d
Source: RBN NGL Voyager Report

122© Copyright 2017 RBN Energy
Europe - Mt. Belvieu Propane Arb (Price Differential)
-20
0
20
40
60
80
c/ga
l

123© Copyright 2017 RBN Energy
Methodology: U.S. Propane Supply/Demand Balance
Propane Supply
Propane Demand

124© Copyright 2017 RBN Energy
U.S. Propane Supply Scenarios
Crude Oil Price
Natural Gas Price
Crude Oil Production
Natural Gas
Production
Gas Plant NGL
Production
Refinery Runs
Propane Production
Propane Imports
Propane Supply
125© Copyright 2017 RBN Energy
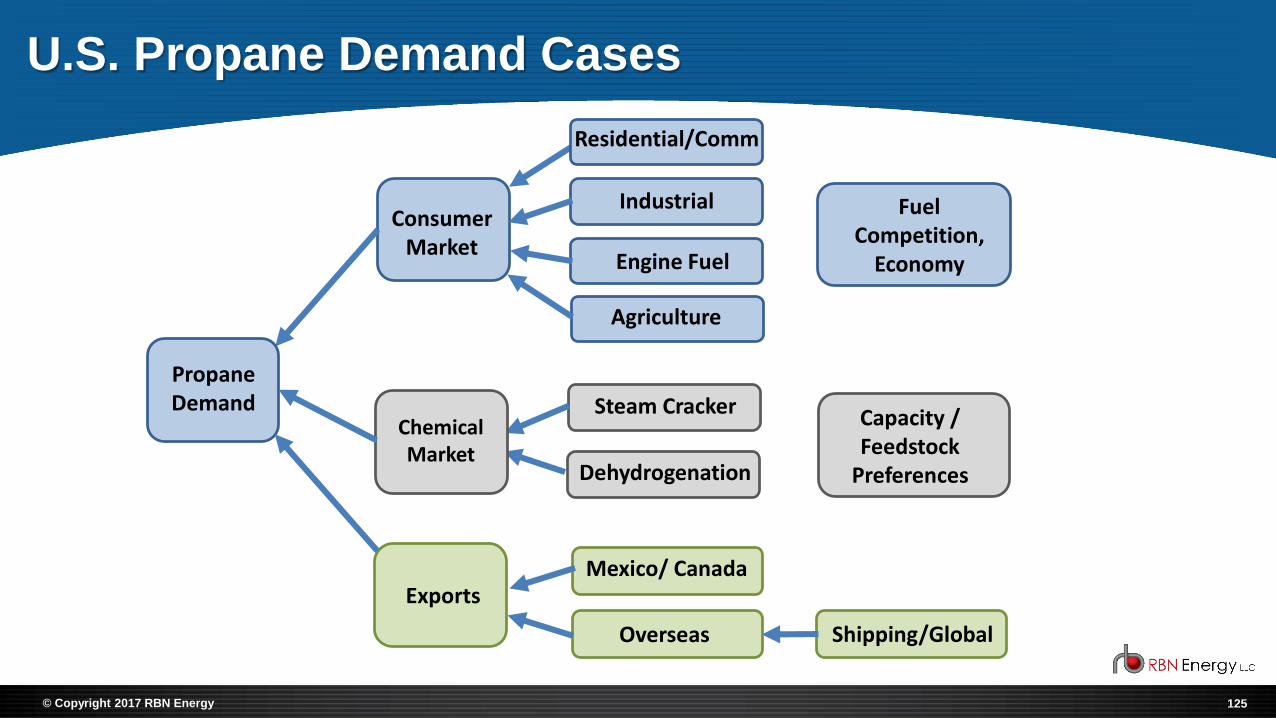
U.S. Propane Demand Cases
Consumer Market
Propane Demand
Exports
Fuel Competition,
Economy
Industrial
Engine Fuel
Agriculture
Residential/Comm
Capacity / Feedstock
Preferences
Steam Cracker
Dehydrogenation
Mexico/ Canada
Overseas Shipping/Global
Chemical Market
126© Copyright 2017 RBN Energy
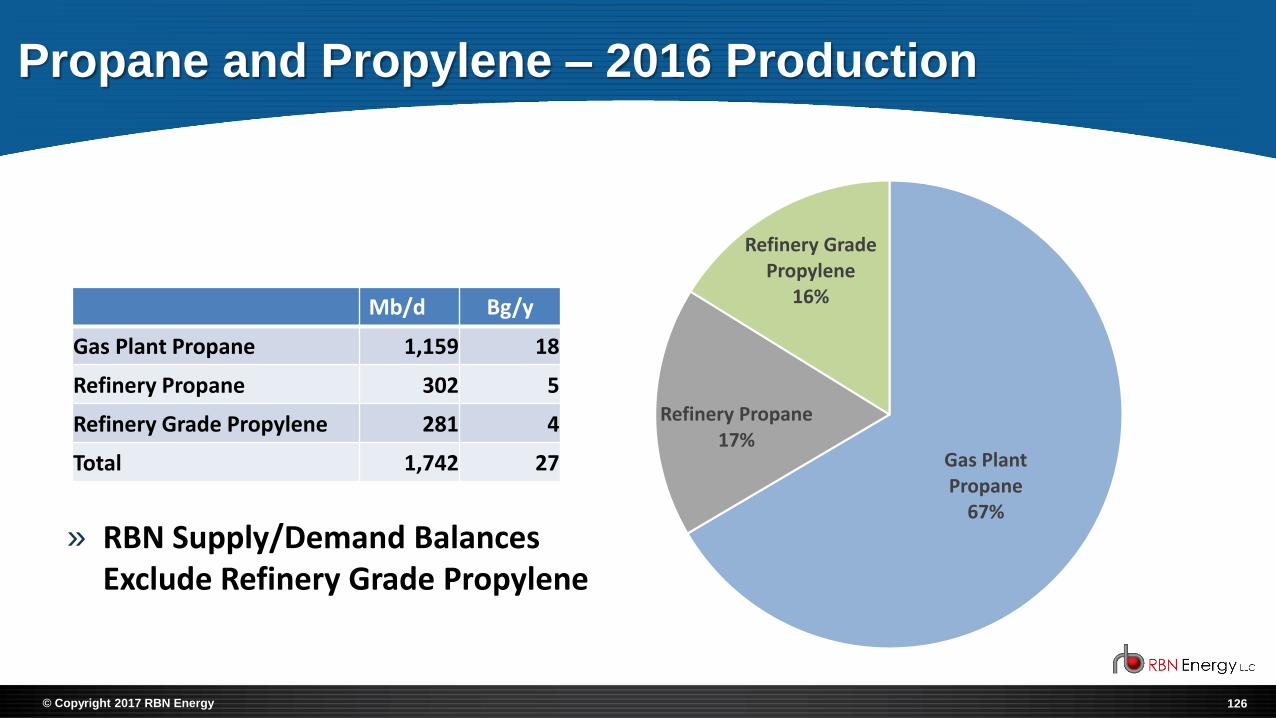
Propane and Propylene – 2016 Production
Gas Plant Propane
67%
Refinery Propane17%
Refinery Grade Propylene
16%Mb/d Bg/y
Gas Plant Propane 1,159 18
Refinery Propane 302 5
Refinery Grade Propylene 281 4
Total 1,742 27
» RBN Supply/Demand Balances Exclude Refinery Grade Propylene

127© Copyright 2017 RBN Energy
U.S. Crude Oil Production Forecast Scenarios
0.0
2.0
4.0
6.0
8.0
10.0
12.0
14.0
MM
b/d
2008-2015 2016-2022 Growth 2016-2022 Contraction
12.7
10.0
128© Copyright 2017 RBN Energy
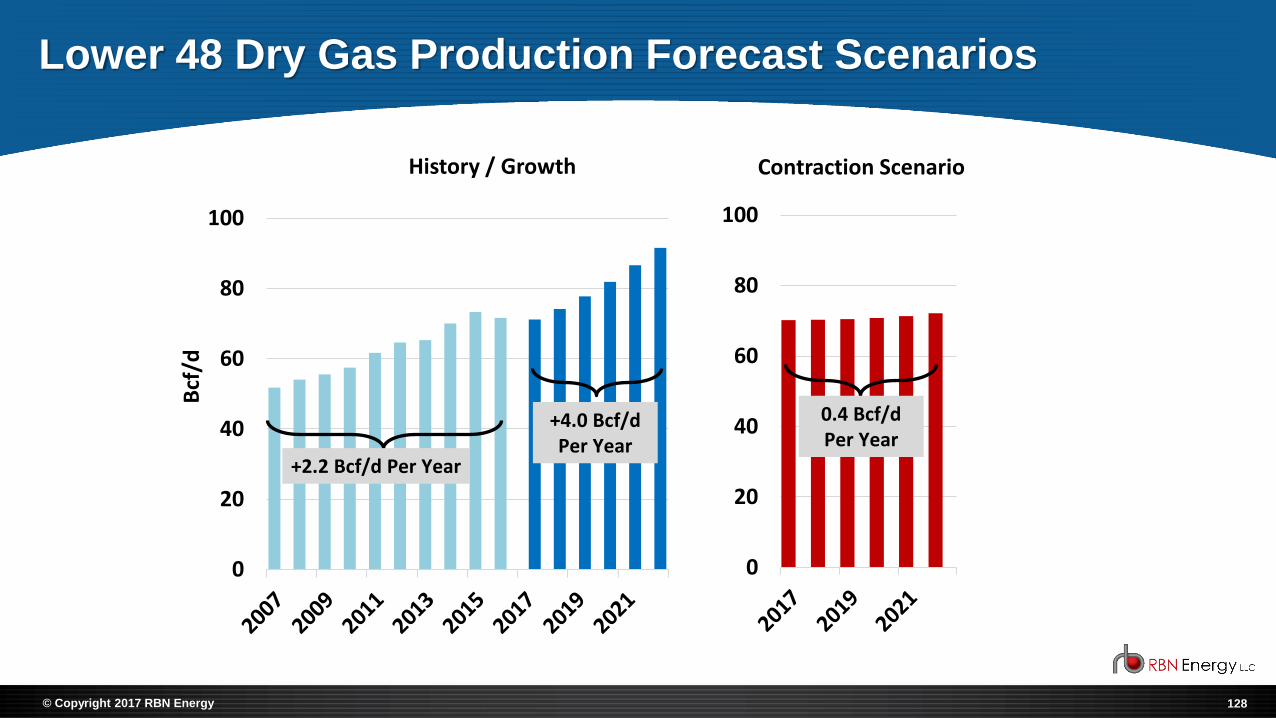
Lower 48 Dry Gas Production Forecast Scenarios
0
20
40
60
80
100B
cf/d
History / Growth
+4.0 Bcf/d Per Year
+2.2 Bcf/d Per Year
0
20
40
60
80
100
Contraction Scenario
0.4 Bcf/d Per Year

129© Copyright 2017 RBN Energy
U.S. NGL Gas Plant Potential Production
» Growing volumes of ‘wet’,
high-BTU gas are driving
increases in NGL production
» Pipeline constraints out of the
Northeast and Williston Basin
keep rejection happening
through 2022
0
20
40
60
80
2,000
2,500
3,000
3,500
4,000
4,500
5,000
5,500
6,000
Bg
/y
Mb
/d
NGL Production Ethane Rejection
Contraction Scenario
Growth Scenario
130© Copyright 2017 RBN Energy
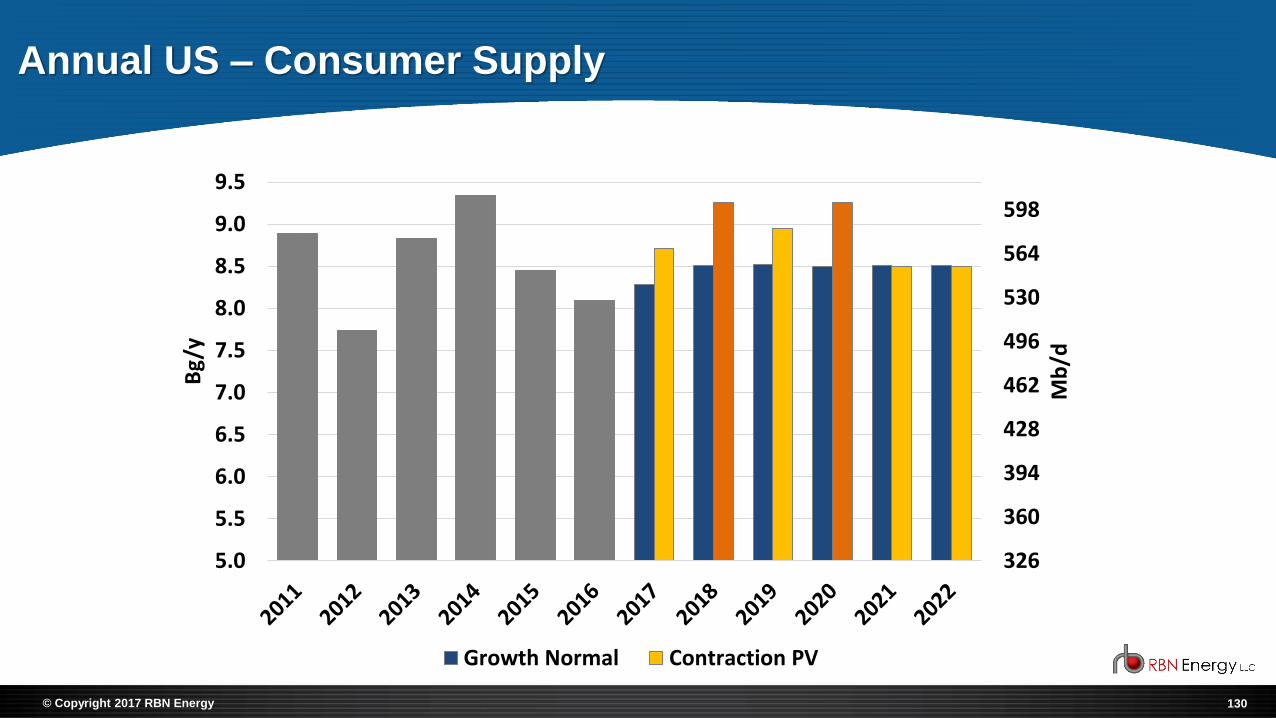
Annual US – Consumer Supply
326
360
394
428
462
496
530
564
598
5.0
5.5
6.0
6.5
7.0
7.5
8.0
8.5
9.0
9.5
Mb
/d
Bg/
y
Growth Normal Contraction PV

131© Copyright 2017 RBN Energy
0
2
4
6
8
10
12
0
100
200
300
400
500
600
700
800
Bg/
y
Mb
/d
Existing Mariner East
Mariner East II
ME2X
Mariner East II Expansion
Contraction - Polar Vortex
Growth - Normal
* Contracted and forecasted ethane volumes removed from capacity and volumes
Marcus Hook Propane Export Capacity vs. Volumes
» Demand cases assume that the Mariner East II Expansion increases capacity to 275 Mb/d, but actual flows (Contraction) average only 81 Mb/d in 2018, even with severe weather.
» Even in the Contraction Scenario, exports are assumed to fall no lower than 50% of total capacity, due to contractual commitments and overseas demand.
132© Copyright 2017 RBN Energy
Gulf Coast Propane Export Capacity vs. Export Volumes
-
2
4
6
8
10
12
14
16
18
0
200
400
600
800
1,000
1,200
Bg
/y
Mb
/d
Phillips 66
Oxy
Mariner South
Targa
Enterprise
Contraction - Polar Vortex
Growth - Normal

133© Copyright 2017 RBN Energy
Only Under Construction Propane Dehydrogenation Units
Will be Completed by 2021 in All Cases
0
0.2
0.4
0.6
0.8
1
1.2
1.4
1.6
1.8
0
20
40
60
80
100
120
Bg/
y
Pro
pan
e D
em
and
Mb
/d
Petrologistics Enterprise Dow Formosa
PDH Units Under Evaluation • Marcus Hook • C3 Petrochemicals (Ascend)
» Enterprise PDH starts up in July 2017, and Formosa in 2020 adding 54 Mb/d of demand

134© Copyright 2017 RBN Energy
PADD 2 - Seasonal Supply Demand – Contraction Severe Weather
0
2
4
6
8
10
0
100
200
300
400
500
600
700
Bg
/y
Mb
/d
Supply
Production Inventory Draw Net Receipts Imports
0
100
200
300
400
500
600
700
Mb
/d
Demand
Product Supplied Net Deliveries Inventory Injection Exports

135© Copyright 2017 RBN Energy
PADD 2 – Weather Sensitivities – Contraction Severe Weather
0
1
2
3
4
5
40
90
140
190
240
290
340
Bg/
y
Mb
/d
Net Deliveries
Net Deliveries - Normal Weather
Net Deliveries - Polar Vortex
0
5
10
15
20
25
30
35
MM
bb
l
Inventories
Last 5 year Range PV 19-20
136© Copyright 2017 RBN Energy
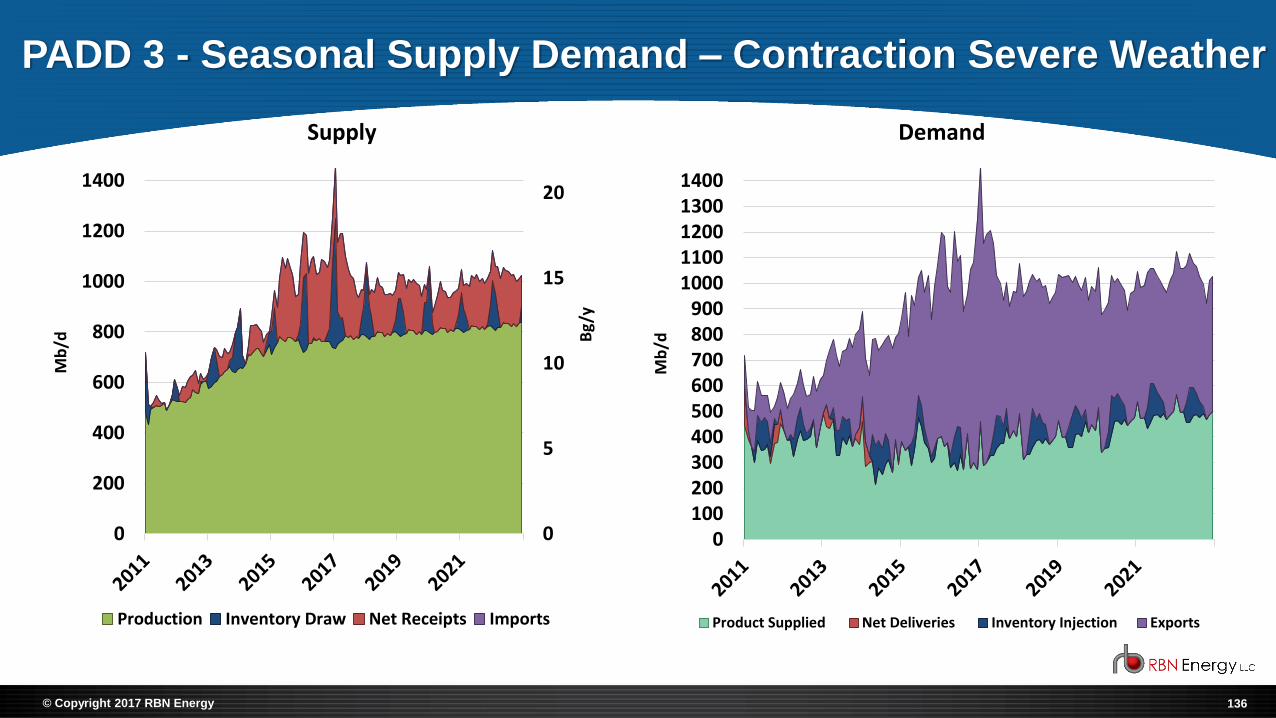
PADD 3 - Seasonal Supply Demand – Contraction Severe Weather
0
5
10
15
20
0
200
400
600
800
1000
1200
1400
Bg
/y
Mb
/d
Supply
Production Inventory Draw Net Receipts Imports
0100200300400500600700800900
10001100120013001400
Mb
/d
Demand
Product Supplied Net Deliveries Inventory Injection Exports

137© Copyright 2017 RBN Energy
PADD 3 – Weather Sensitivities – Contraction Severe Weather
6
7
8
9
10
11
12
13
14
15
400
500
600
700
800
900
1000
Bg/
y
Mb
/d
Exports
Exports - Normal Weather
Exports - Polar Vortex
0
10
20
30
40
50
60
70
MM
bb
l
Inventories
Last 5 year Range PV 19-20

138© Copyright 2017 RBN Energy
PADD 5 - Seasonal Supply Demand – Contraction Severe Weather
0
0.5
1
1.5
0
20
40
60
80
100
120
Bg
/y
Mb
/d
Supply
Production Inventory Draw Net Receipts Imports
0
20
40
60
80
100
120
Mb
/d
Demand
Product Supplied Net Deliveries Inventory Injection Exports


INDUSTRY & PUBLIC COMMENTS


PROPANE EDUCATION & RESEARCH COUNCILDENVER, COLORADO
July 11-12, 2017

PROPOSED 2018 BUDGET
Rob Chalmers
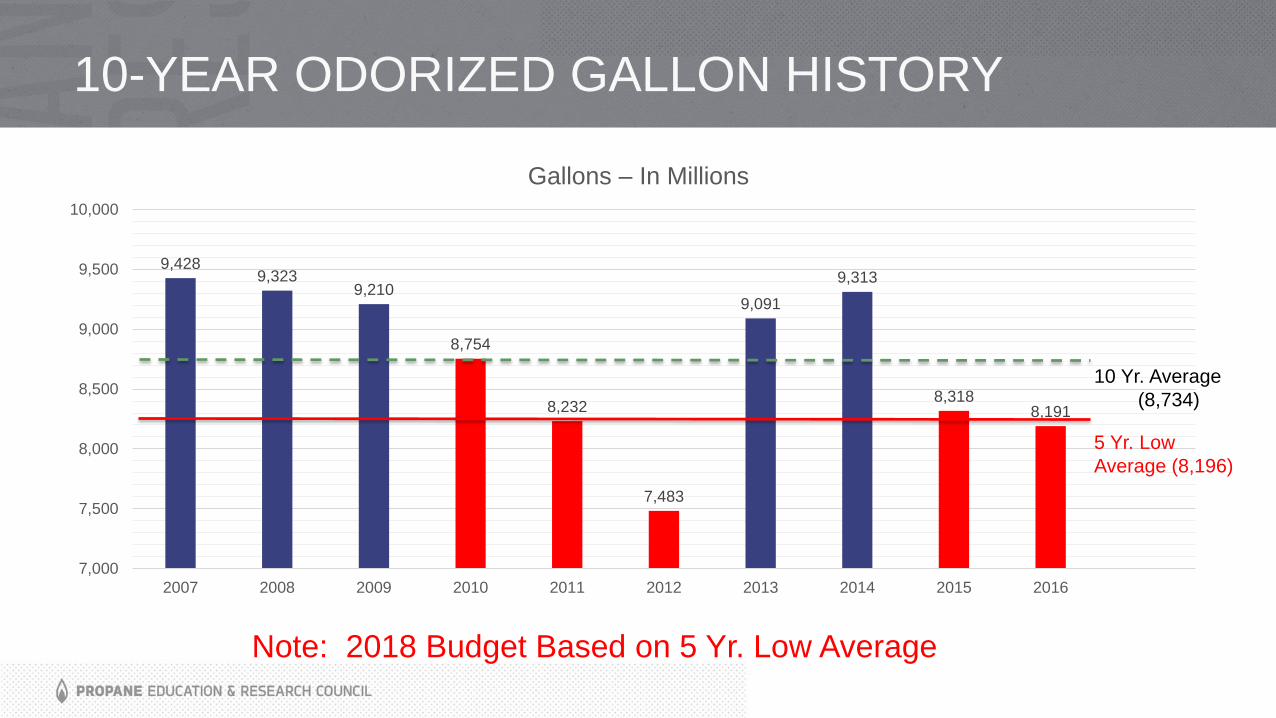
10-YEAR ODORIZED GALLON HISTORY
9,4289,323
9,210
8,754
8,232
7,483
9,091
9,313
8,3188,191
7,000
7,500
8,000
8,500
9,000
9,500
10,000
2007 2008 2009 2010 2011 2012 2013 2014 2015 2016
Gallons – In Millions
10 Yr. Average
(8,734)
5 Yr. Low
Average (8,196)
Note: 2018 Budget Based on 5 Yr. Low Average

PROPANE EDUCATION & RESEARCH COUNCIL
2018 BUDGET FOR APPROVAL
2017 Budget
2018 Budget
Proposal
Variance
Favorable
(Unfavorable)
2018 Budget
Proposal
Variance
Favorable
(Unfavorable)
REVENUES:
Assessment Collections 38,948,400$ 36,880,120$ (2,068,280)$ 40,977,911$ 2,029,511$
Less State Rebates (7,789,680)$ (7,376,024)$ 413,656$ (8,195,582)$ (405,902)$
Net Assessment Revenue 31,158,720$ 29,504,096$ (1,654,624)$ 32,782,329$ 1,623,609$
Investment Income 164,000$ 140,000$ (24,000)$ 140,000$ (24,000)$
Fulfillment -$ -$ -$ -$ -$
Total Revenues 31,322,720$ 29,644,096$ (1,678,624)$ 32,922,329$ 1,599,609$
EXPENDITURES:
Expenses
Administrative Expenses 2,653,500$ 2,751,867$ 98,367$ 2,751,867$ 98,367$
Other Expenses:
Assessment & Collections 82,000$ 83,500$ 1,500$ 83,500$ 1,500$
Depreciation Expenses 457,000$ 485,000$ 28,000$ 485,000$ 28,000$
Total Other Expenses 539,000$ 568,500$ 29,500$ 568,500$ 29,500$
Total expenses 3,192,500$ 3,320,367$ 127,867$ 3,320,367$ 127,867$
Program Funding
Operating programs 26,338,200$ 21,643,758$ 4,694,442$ 24,921,991$ 1,416,209$
Program Labor 3,685,000$ 4,112,604$ (427,604)$ 4,112,604$ (427,604)$
Program Benefits 538,000$ 567,366$ (29,366)$ 567,366$ (29,366)$
IT Support 447,000$ 600,000$ (153,000)$ 600,000$ (153,000)$
Total Program Funding 31,008,200$ 26,923,728$ 4,084,472$ 30,201,961$ 806,239$
TOTAL EXPENDITURES 34,200,700$ 30,244,095$ 3,956,605$ 33,522,328$ 678,372$
Increase/(Decrease) in Net Assets (2,877,980)$ (600,000)$ 2,277,980$ (600,000)$ 2,277,980$
Beginning Surplus 2,630,737$ 600,000$ (2,030,737)$ 600,000$ (2,030,737)$
Add De-obligations 500,000$ 500,000$ -$ 500,000$ -$
Ending Surplus 252,757$ 500,000$ 247,243$ 500,000$ 247,243$
Capital Budget: 183,000$ 645,000$ (462,000)$ 645,000$ (462,000)$
With Rate IncreaseNo Rate Increase
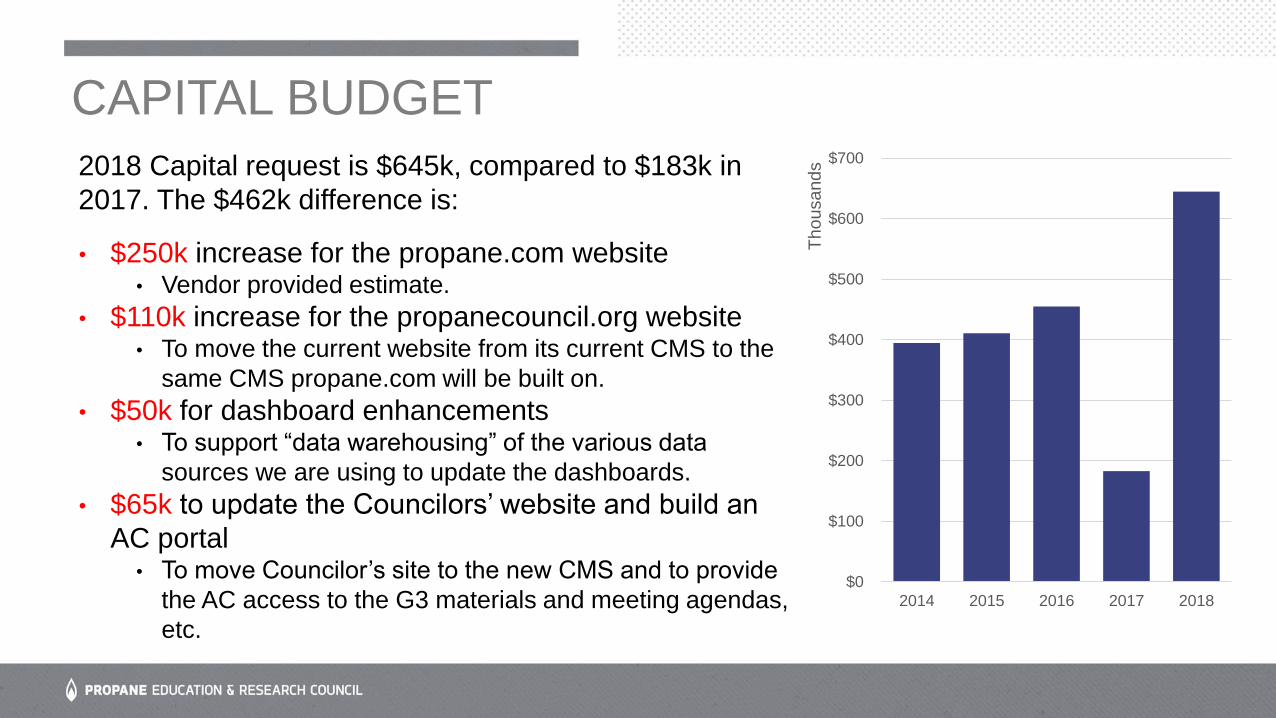
2018 Capital request is $645k, compared to $183k in
2017. The $462k difference is:
• $250k increase for the propane.com website• Vendor provided estimate.
• $110k increase for the propanecouncil.org website• To move the current website from its current CMS to the
same CMS propane.com will be built on.
• $50k for dashboard enhancements • To support “data warehousing” of the various data
sources we are using to update the dashboards.
• $65k to update the Councilors’ website and build an
AC portal • To move Councilor’s site to the new CMS and to provide
the AC access to the G3 materials and meeting agendas,
etc.
$0
$100
$200
$300
$400
$500
$600
$700
2014 2015 2016 2017 2018
Tho
usands
CAPITAL BUDGET
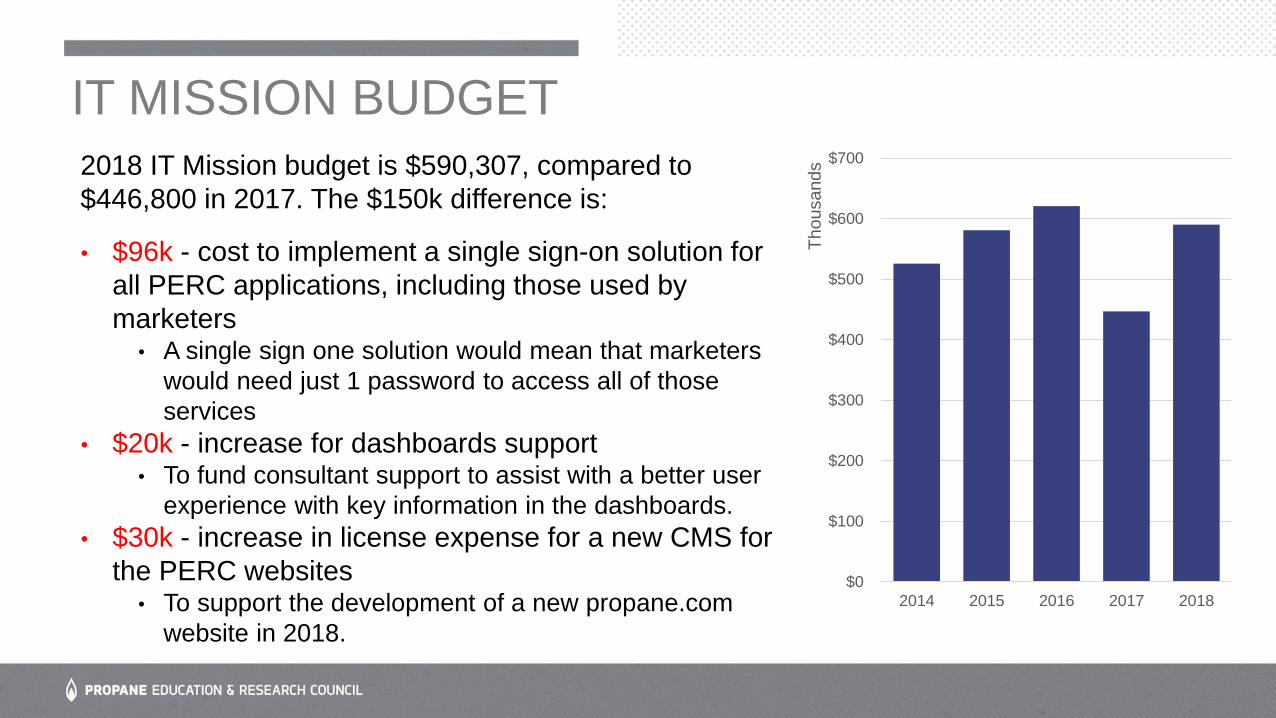
2018 IT Mission budget is $590,307, compared to
$446,800 in 2017. The $150k difference is:
• $96k - cost to implement a single sign-on solution for
all PERC applications, including those used by
marketers• A single sign one solution would mean that marketers
would need just 1 password to access all of those
services
• $20k - increase for dashboards support• To fund consultant support to assist with a better user
experience with key information in the dashboards.
• $30k - increase in license expense for a new CMS for
the PERC websites• To support the development of a new propane.com
website in 2018.
$0
$100
$200
$300
$400
$500
$600
$700
2014 2015 2016 2017 2018
Tho
usands
IT MISSION BUDGET

• Cash balances correspond to 2018 Monthly Cash Flows
• Balances
• Beginning of Year (January)
• $13M / $13.3M
• Highest Balance (April)
• $16.8M / $17.2M
• End of Year (December)
• $10.3M / $10.6M$5
$7
$9
$11
$13
$15
$17
$19
@ .45 cents
@ .5 cents
2018 PROJECTED CASH BALANCES @ .45 CENTS AND .5 CENTS PER GALLON (IN MILLIONS)
PROPOSED 2018 PROGRAM BUDGET

Strat Ranking
2018 STRATEGIC PRIORITIZATION
MOT Average
STT Average
RTD Average
Staff Average
Council (18:21)
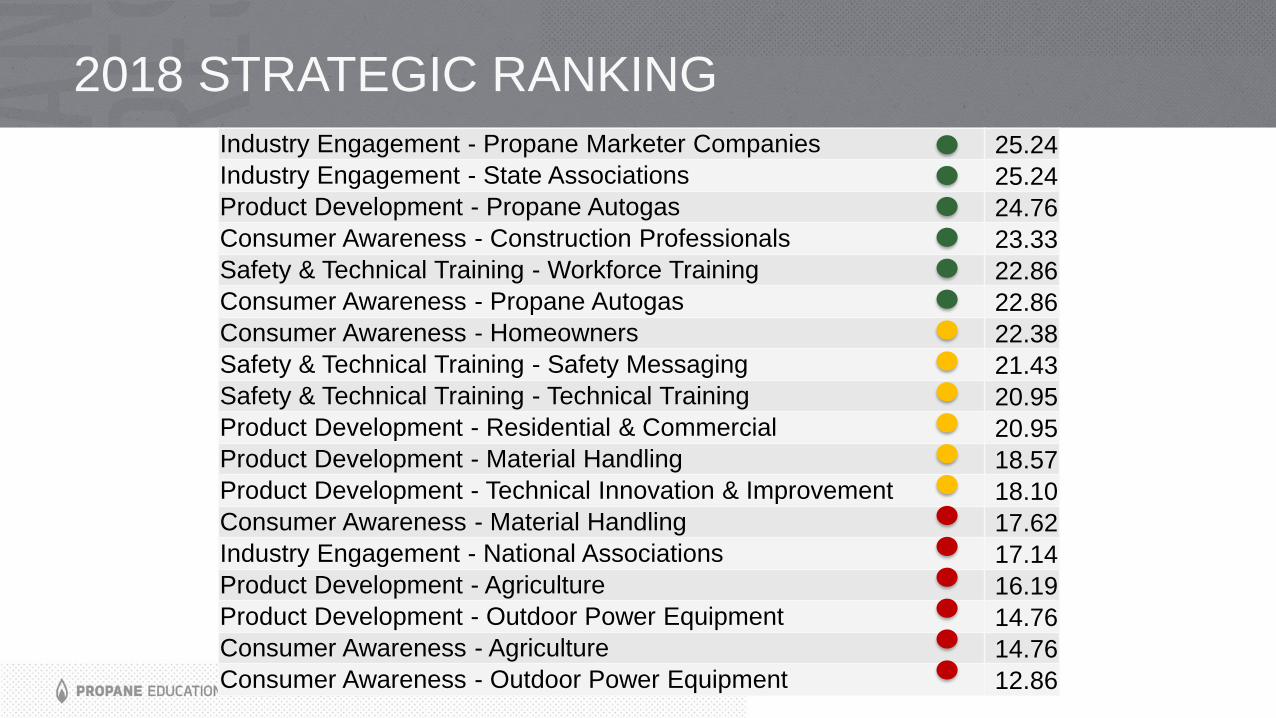
2018 STRATEGIC RANKING
Industry Engagement - Propane Marketer Companies 25.24
Industry Engagement - State Associations 25.24
Product Development - Propane Autogas 24.76
Consumer Awareness - Construction Professionals 23.33
Safety & Technical Training - Workforce Training 22.86
Consumer Awareness - Propane Autogas 22.86
Consumer Awareness - Homeowners 22.38
Safety & Technical Training - Safety Messaging 21.43
Safety & Technical Training - Technical Training 20.95
Product Development - Residential & Commercial 20.95
Product Development - Material Handling 18.57
Product Development - Technical Innovation & Improvement 18.10
Consumer Awareness - Material Handling 17.62
Industry Engagement - National Associations 17.14
Product Development - Agriculture 16.19
Product Development - Outdoor Power Equipment 14.76
Consumer Awareness - Agriculture 14.76
Consumer Awareness - Outdoor Power Equipment 12.86

0
1
2
3
4
5
Consu
me
r A
wa
rene
ss H
om
eo
wner
Consu
me
r A
wa
rene
ss C
on
str
uction
Pro
s
Consu
me
r A
wa
rene
ss A
gricu
ltu
re
Pro
du
ct D
eve
lopm
en
t A
uto
ga
s
Ind
ustr
y E
ng
ag
em
en
t S
tate
Assns
Consu
me
r A
wa
rene
ss O
PE
Adm
inis
trative
Ind
ustr
y E
ng
ag
em
en
t N
atio
nal
Associa
tio
ns
Ind
ustr
y E
ng
ag
em
en
t M
ark
ete
rC
om
pan
ies
Consu
me
r A
wa
rene
ss A
uto
ga
s
Pro
du
ct D
eve
lopm
en
t A
gricu
ltu
re
Pro
du
ct D
eve
lopm
en
t T
ech
Inn
ovatio
n
Consu
me
r A
wa
rene
ss
Safe
ty &
Te
ch T
rain
ing E
xte
rna
l A
ud
.T
rain
ing
Safe
ty &
Te
ch T
rain
ing W
ork
forc
eT
rain
ing
Consu
me
r A
wa
rene
ss M
ate
ria
lH
and
ling
Pro
du
ct D
eve
lopm
en
t M
ate
ria
lH
and
ling
Pro
du
ct D
eve
lopm
en
t R
es/C
om
Safe
ty &
Te
ch T
rain
ing S
afe
tyM
essa
gin
g
Pro
du
ct D
eve
lopm
en
t O
PE
Mill
ion
s
PROPOSED 2018 PROGRAM BUDGET

Budget @ .45¢: $21,653,758 Budget @ 0.5¢: $24,931,991
Consumer Awareness
56%
Product Development
20%
Industry Engagement
12%
Administrative6%
Safety & Technical Training
6%
2018 PROPOSED PROGRAM BUDGET BY STRATEGIC IMPERATIVE
Consumer Awareness
60%
Product Development
18%
Industry Engagement
11%
Safety & Technical Training6%
Administrative5%

PROPOSED 2018 PROGRAM BUDGET –ACTIVITY TYPE
$0
$2
$4
$6
$8
$10
$12
$14
Mill
ions
2017 2018 - 0.45¢ 2018 - 0.5¢
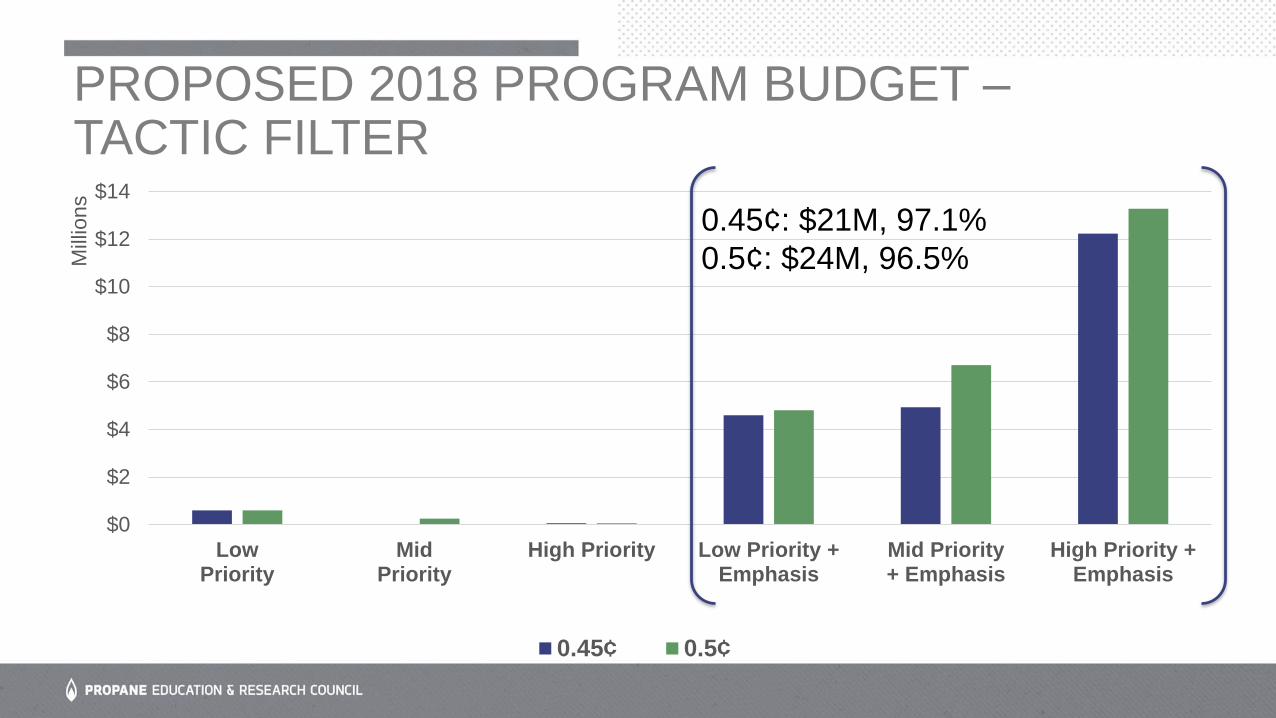
PROPOSED 2018 PROGRAM BUDGET –TACTIC FILTER
$0
$2
$4
$6
$8
$10
$12
$14
LowPriority
MidPriority
High Priority Low Priority +Emphasis
Mid Priority+ Emphasis
High Priority +Emphasis
Mill
ions
0.45¢ 0.5¢
0.45¢: $21M, 97.1%
0.5¢: $24M, 96.5%

VARIANCE FROM 2017 IN FUNDING AVAILABLE TO STATES
Variance from 2017 Budget
0.45¢
0.5¢

CHIEF MARKETING OFFICER’S REPORT
Dennis Vegas

NATIONAL CONSUMERBRAND CAMPAIGN

Integrated Brand
“Propane Clean American Energy”
OPE
Off-Road
Material Handling
Autogas
Ag
Res-Com
Homeowner
GALLON GROWTH
(logo)

BRAND STRATEGY
• Drive consumers from awareness to advocacy.
• Improve familiarity, favorability and willingness to consider propane.
• Promote the value, features, and benefits of propane and its applications.
• Inspire states to use campaign materials to promote propane.
• Increase consumer receptiveness to marketer messages.
PERC promotes the fuel, and marketers promote their companies.
AWARENESS CONSIDERATION ADOPTION EXPANDED USEFAVORABILITY LOYALTY ADVOCACY

WHAT PROGRESS HAS BEEN MADE?
• Developed and launched a strong
differentiated campaign.
• Effectively and efficiently delivered 24
weeks of on-air activity.
• Strong emotional engagement built
with core consumer audience.
• More than 500 marketers and various
states embraced the campaign.
• Above benchmark results consistently
delivered across digital media
channels.
• Growth in key brand health metrics.

2017 CONSUMER CAMPAIGN
• Dark Sept. 2016 to Mar. 2017
• MOT recommended two media flights: spring and fall
• On air with $5 million investment (29% reduction in budget from summer 2016) March through May.
• Proposed smaller media buy of $1.5 million for Sept. and Oct. (no TV; mainly digital)
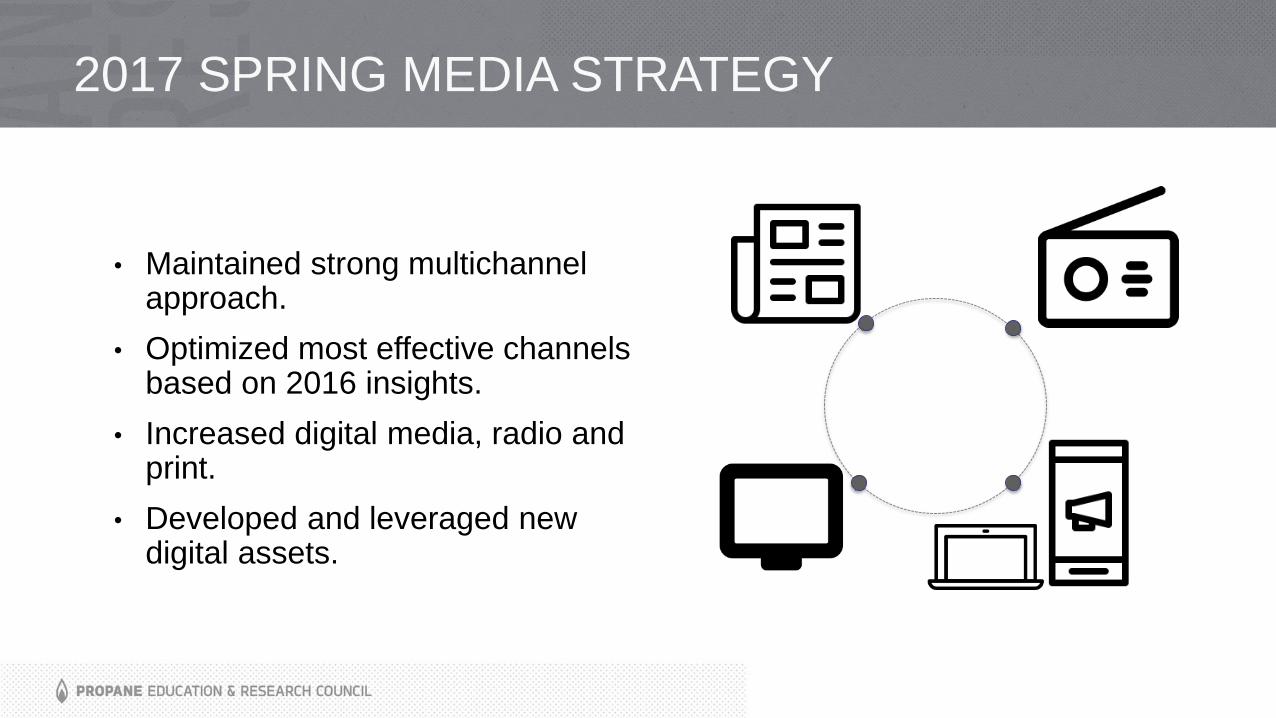
2017 SPRING MEDIA STRATEGY
• Maintained strong multichannel approach.
• Optimized most effective channels based on 2016 insights.
• Increased digital media, radio and print.
• Developed and leveraged new digital assets.

2016 comScore research proved value for all channels with different combinations achieving unique lifts in key brand metrics
IMPORTANCE OF A MEDIA MIX
Source: comScore – AdEffx Cross-Media Brand Survey Lift (October 2016)
Familiarity Favorability
GREATEST % LIFT
Intent to switch to propaneTrust

MEDIA MIX COMPARISON
$4,155,315
$2,135,337
$611,344
$721,234
$571,931
$679,678
$250,000
$1,584,377
$1,468,568
$1,250,000
$0
$1,000,000
$2,000,000
$3,000,000
$4,000,000
$5,000,000
$6,000,000
$7,000,000
2016 Fall 2017 Spring 2017 Fall
TV Print Radio Digital

MARKETER BUY-IN
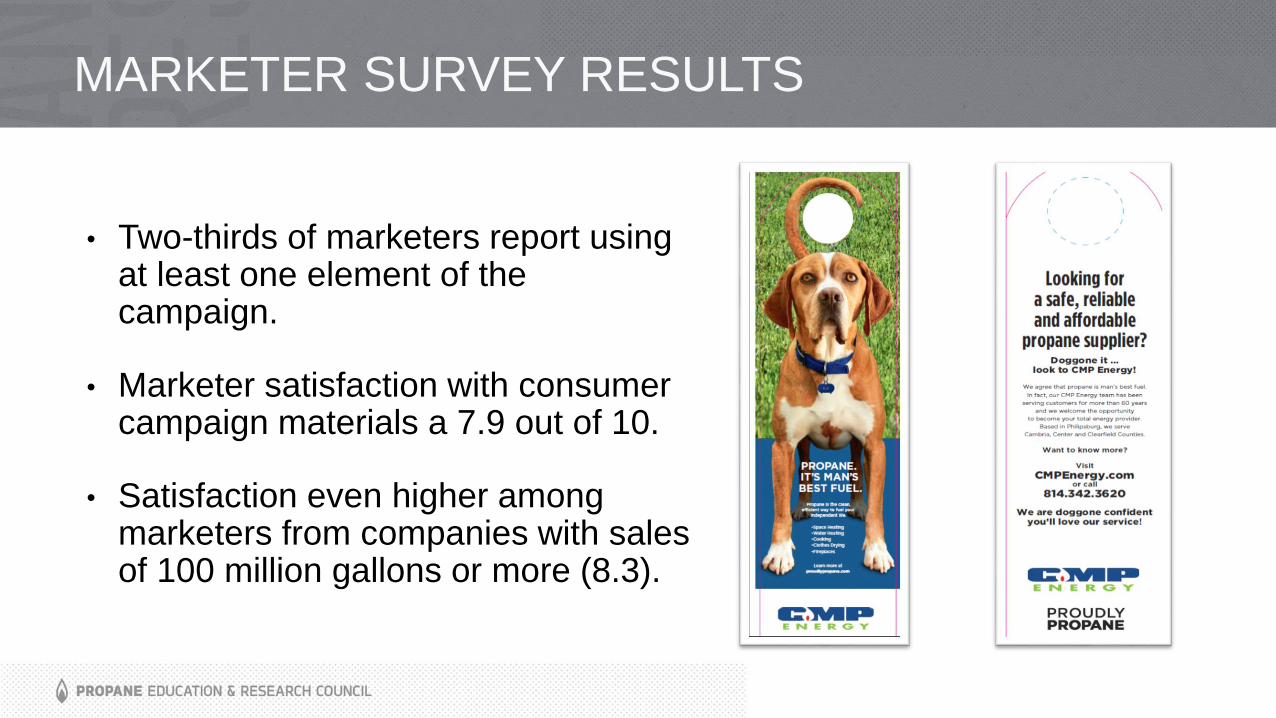
MARKETER SURVEY RESULTS
• Two-thirds of marketers report using at least one element of the campaign.
• Marketer satisfaction with consumer campaign materials a 7.9 out of 10.
• Satisfaction even higher among marketers from companies with sales of 100 million gallons or more (8.3).

CONSUMER CAMPAIGN ON THE CATALOG
• More than 500 companies have downloaded at least one consumer campaign item from the catalog at propanecouncil.org.
• The cutout sold out and has been reordered.

STATE COUNCILS AND FOUNDATIONS
• 2016
• Louisiana
• New England
• 2017
• Arizona
• Texas

SPRING 2017 DIGITAL RESULTS

SPRING 2017 DIGITAL RESULTS
Data shown covers January 9, 2017 – May 28, 2017
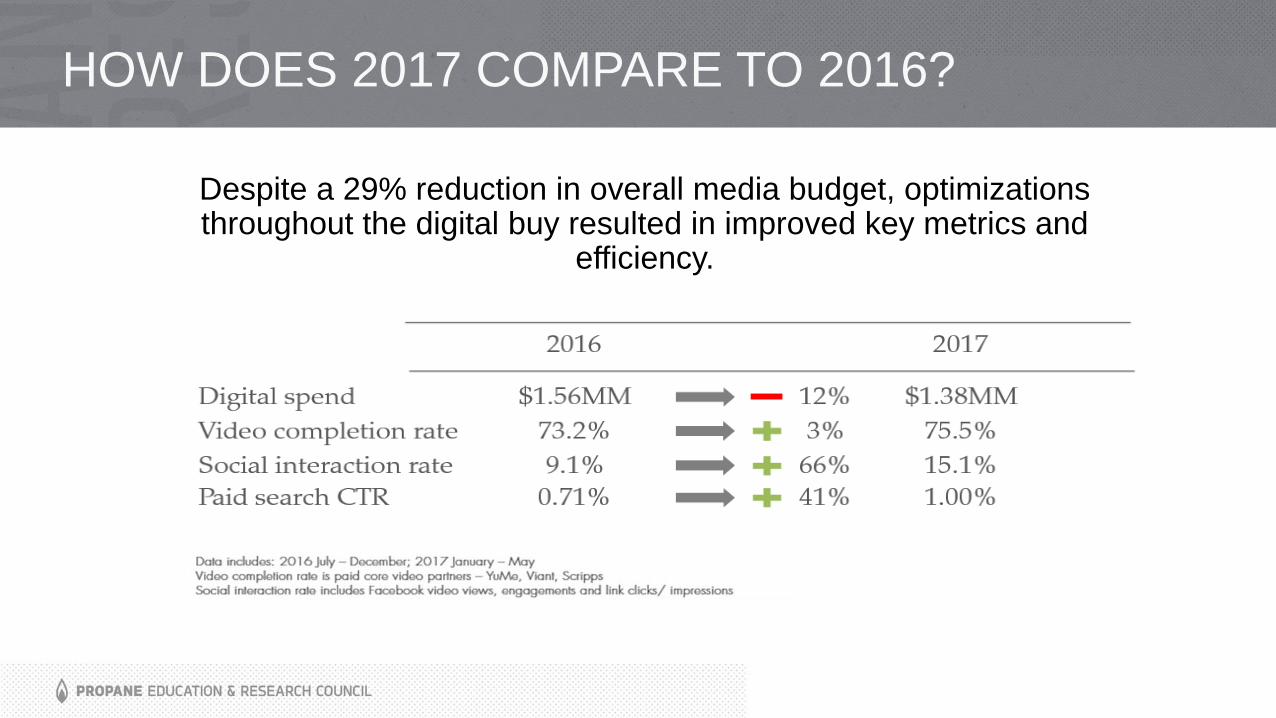
HOW DOES 2017 COMPARE TO 2016?
Despite a 29% reduction in overall media budget, optimizations throughout the digital buy resulted in improved key metrics and
efficiency.

SPRING 2017 CAMPAIGN IMPACT
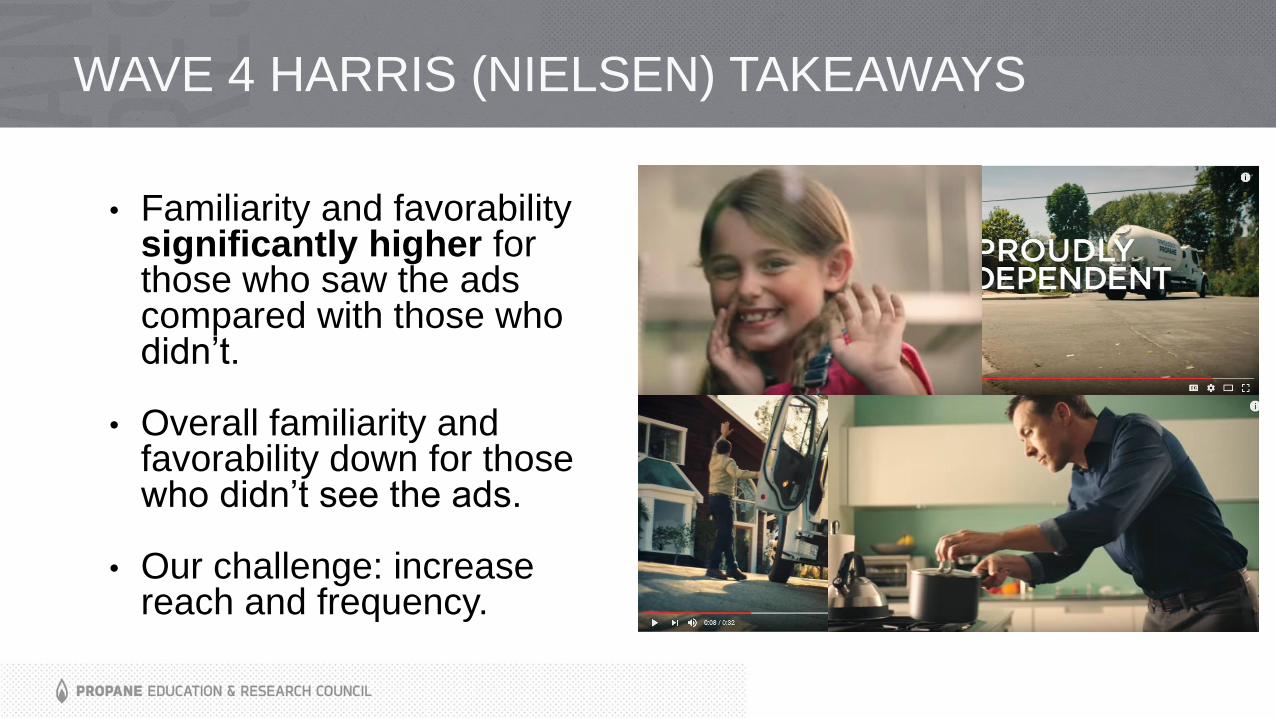
WAVE 4 HARRIS (NIELSEN) TAKEAWAYS
• Familiarity and favorability significantly higher for those who saw the ads compared with those who didn’t.
• Overall familiarity and favorability down for those who didn’t see the ads.
• Our challenge: increase reach and frequency.
RESEARCH FINDINGS JUNE 2017
PROPANE EDUCATION & RESEARCH COUNCILCONSUMER REPORT: WAVE 4

182
BACKGROUND AND OBJECTIVES
• The primary objective of this study (Wave 4) is to assess the impact of the national advertising campaign on perceptions of propane across the country.
• The findings of Wave 2 are compared against the findings from three previous studies.
• 20-minute online surveys• Wave 1: December 18, 2015 to January 19, 2016 • Wave 2: September 9 to 29, 2016• Wave 3: January 31 to February 28, 2017• Wave 4: May 11 to June 8, 2017
• Respondents viewed the ads during the survey in Waves 2, 3, and 4.

183
METHODOLOGY
3,001 (Wave 1)2,054 (Wave 2)
1,135 (Wave 3)2,044 (Wave 4)
Interviews With Homeowners
Sample Size
Region Wave 1 Wave 2 Wave 3 Wave 4
PADD 1 849 613 421 605
PADD 2 1,201 802 400 802
PADD 3 448 308 149 304
PADD 4 162 98 54 104
PADD 5 341 233 111 229

184
METHODOLOGY (CONT.)
Respondents were selected basedon the following:
• Ages 18+• Involved in energy decisions• Resides in qualifying zip code• Does not live on a natural gas line• Homeowner• Does not work for an energy supplier
Results have been weighted to be representative of key population demographics.
Propane users are those who use propane for any of the following appliances/applications:• Furnace or heat• Cooktop or range or oven• Traditional water heater• Tankless water heater• Fireplace• Clothes dryer
Propane users non-users
Wave 1 1,758 (59%) 1,243 (41%)
Wave 2 1,220 (58%) 834 (42%)
Wave 3 652 (57%) 483 (43%)
Wave 4 1,145 (56%) 899 (44%)
INTERVIEWS OF USERS VS. NON-USERS INTERVIEWS OF USERS VS. NON-USERS
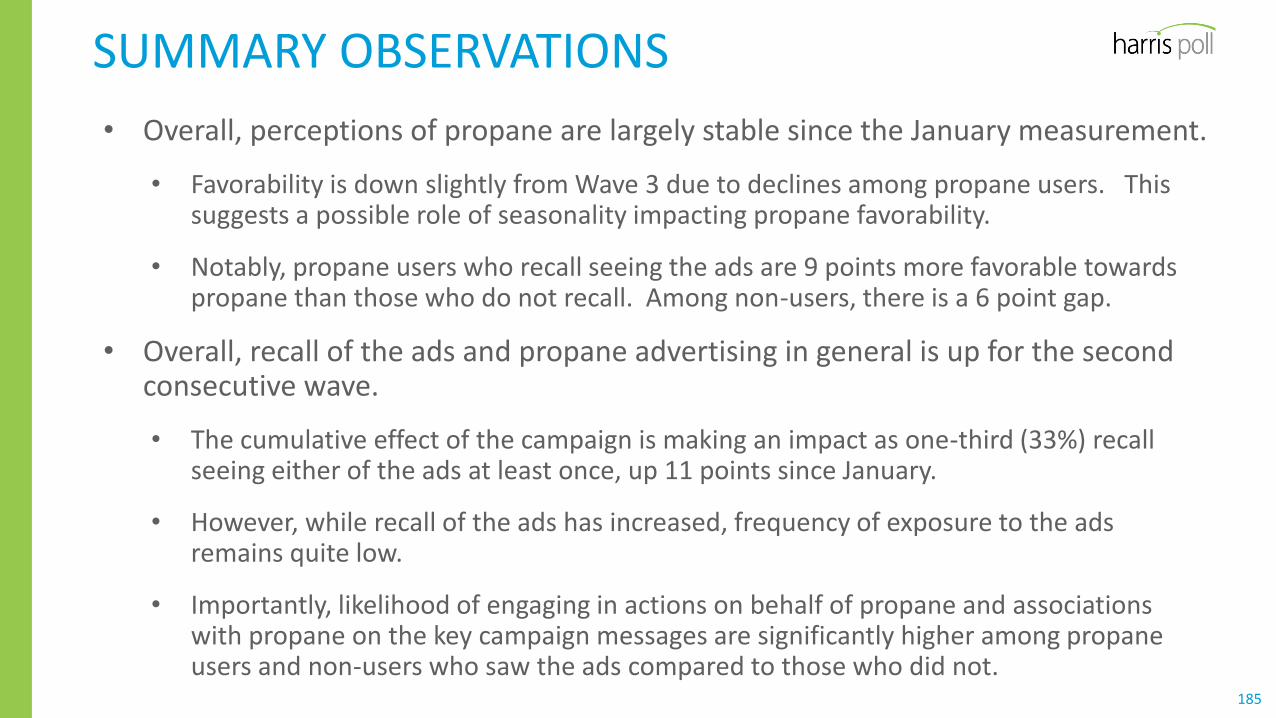
185
SUMMARY OBSERVATIONS
• Overall, perceptions of propane are largely stable since the January measurement.
• Favorability is down slightly from Wave 3 due to declines among propane users. This suggests a possible role of seasonality impacting propane favorability.
• Notably, propane users who recall seeing the ads are 9 points more favorable towards propane than those who do not recall. Among non-users, there is a 6 point gap.
• Overall, recall of the ads and propane advertising in general is up for the second consecutive wave.
• The cumulative effect of the campaign is making an impact as one-third (33%) recall seeing either of the ads at least once, up 11 points since January.
• However, while recall of the ads has increased, frequency of exposure to the ads remains quite low.
• Importantly, likelihood of engaging in actions on behalf of propane and associations with propane on the key campaign messages are significantly higher among propane users and non-users who saw the ads compared to those who did not.
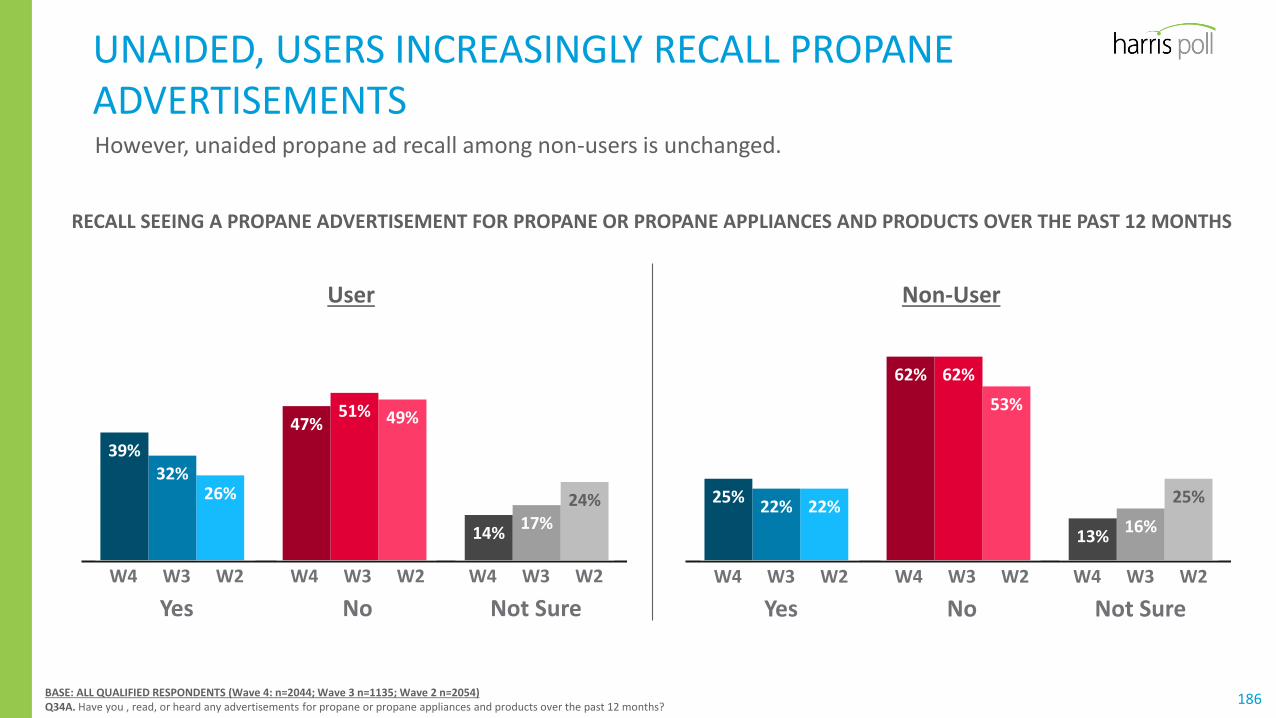
186
UNAIDED, USERS INCREASINGLY RECALL PROPANE ADVERTISEMENTS
BASE: ALL QUALIFIED RESPONDENTS (Wave 4: n=2044; Wave 3 n=1135; Wave 2 n=2054)Q34A. Have you , read, or heard any advertisements for propane or propane appliances and products over the past 12 months?
24%
49%
26%
17%
51%
32%
14%
47%
39%
W4 W3 W2
Yes
RECALL SEEING A PROPANE ADVERTISEMENT FOR PROPANE OR PROPANE APPLIANCES AND PRODUCTS OVER THE PAST 12 MONTHS
25%
53%
22%16%
62%
22%
13%
62%
25%
User Non-User
W4 W3 W2
No
W4 W3 W2
Not Sure
W4 W3 W2
Yes
W4 W3 W2
No
W4 W3 W2
Not Sure
However, unaided propane ad recall among non-users is unchanged.
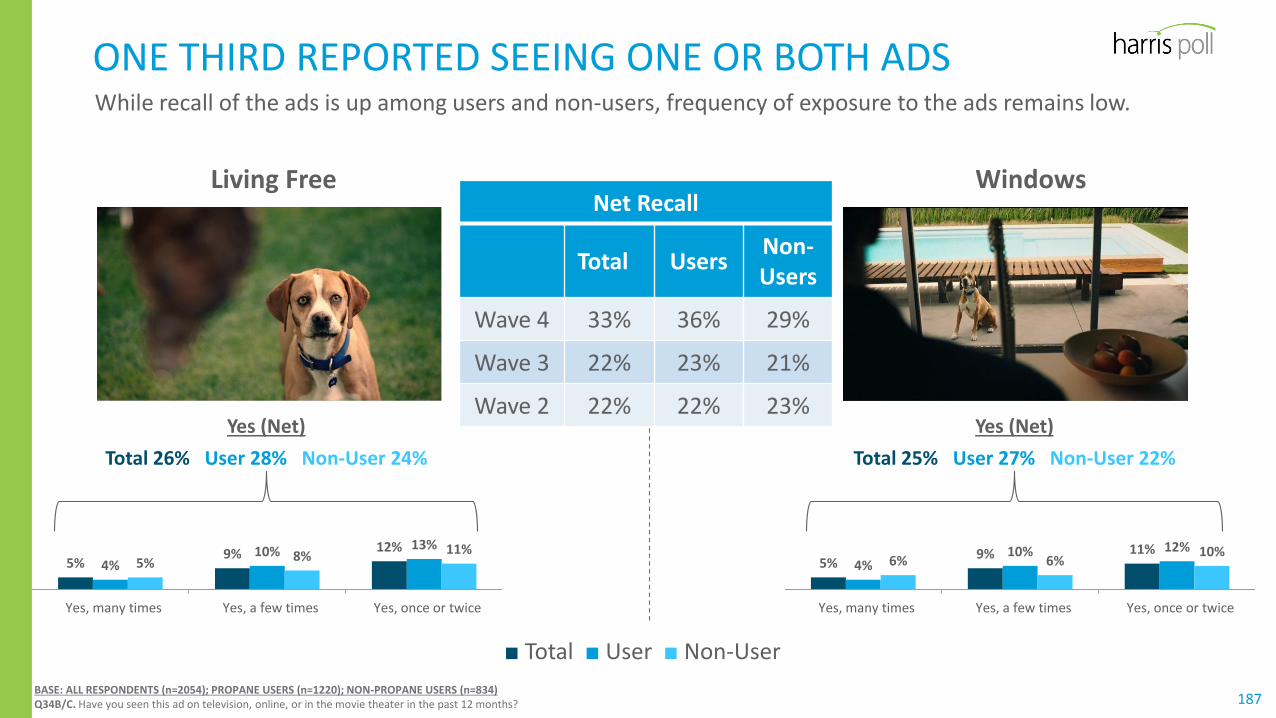
187
ONE THIRD REPORTED SEEING ONE OR BOTH ADS
5%9% 12%
4%10% 13%
5% 8% 11%
Yes, many times Yes, a few times Yes, once or twice
5%9% 11%
4%10% 12%
6% 6%10%
Yes, many times Yes, a few times Yes, once or twice
Yes (Net)
Total 26% User 28% Non-User 24%
Living Free Windows
BASE: ALL RESPONDENTS (n=2054); PROPANE USERS (n=1220); NON-PROPANE USERS (n=834)Q34B/C. Have you seen this ad on television, online, or in the movie theater in the past 12 months?
■ Total ■ User ■ Non-User
Yes (Net)
Total 25% User 27% Non-User 22%
Net Recall
Total UsersNon-Users
Wave 4 33% 36% 29%
Wave 3 22% 23% 21%
Wave 2 22% 22% 23%
While recall of the ads is up among users and non-users, frequency of exposure to the ads remains low.

188
FAMILIARITY & FAVORABILITY

189
USERS AND NON-USERS WHO SAW THE ADS ARE MORE FAMILIAR WITH PROPANE THAN THOSE WHO DID NOT
TOTAL PROPANE USERS NON-USERS
Electricity
Propane
Natural gas
Heating oil
FAMILIARITY WITH ENERGY SOURCES(Top 2 Box)
BASE: ALL RESPONDENTS (n=2054); PROPANE USERS (n=1220); NON-PROPANE USERS (n=834)BASE: USERS RECALL (N=368); USERS NO RECALL (N=777); NON-USERS RECALL (N=255); NON-USERS NO RECALL (N=644)Q2. How familiar are you with the following energy sources for major home appliances such as heating, cooking or water heating?
■ Overall■ Recall Advertising■ Does Not Recall Advertising
91%
70%
48%
30%
92%
75%
48%
32%
90%
67%
47%
28%
89%
87%
48%
30%
92%
90%
53%
27%
88%
86%
49%
26%
93%
46%
44%
33%
92%
50%
42%
39%
93%
45%
45%
31%
ALL RESPONDENTS

190
PROPANE’S SMALL DECLINE IN FAVORABILITY IS DRIVENBY USERS
TOTAL PROPANE USERS NON-USERS
Electricity
Propane
Natural gas
Heating oil
FAVORABILITY WITH ENERGY SOURCES(Top 2 Box)
BASE: ALL RESPONDENTS (n=2044); PROPANE USERS (n=1145); NON-PROPANE USERS (n=899)Q6. Now indicate how favorable you are towards the following energy sources.
66%
49%
48%
11%
70%
29%
40%
14%
Change from Wave 3
+2
-3
+1
-4
Change fromWave 3
+3
-3
+3
-5
Change from Wave 3
-1
-1
-1
-2
63%
64%
55%
9%
Favorable (6/7)
ALL RESPONDENTS
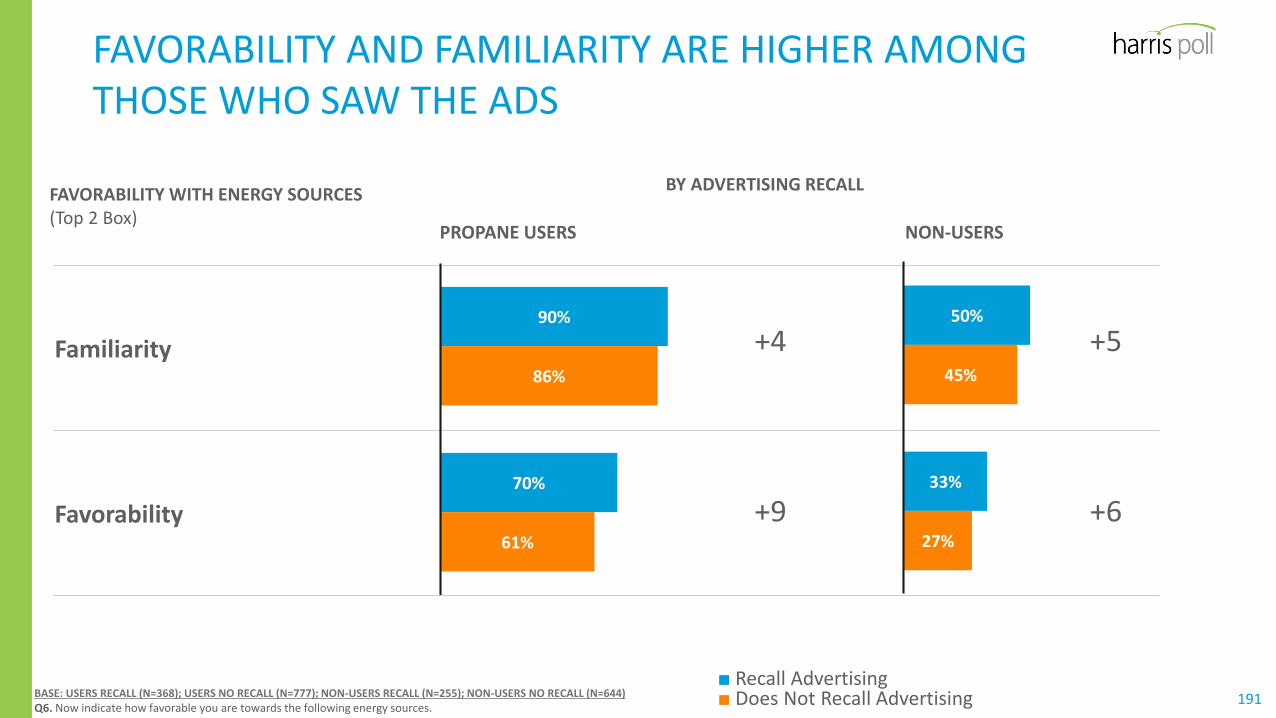
191
PROPANE USERS NON-USERS
Familiarity
Favorability
FAVORABILITY AND FAMILIARITY ARE HIGHER AMONG THOSE WHO SAW THE ADS
FAVORABILITY WITH ENERGY SOURCES(Top 2 Box)
BASE: USERS RECALL (N=368); USERS NO RECALL (N=777); NON-USERS RECALL (N=255); NON-USERS NO RECALL (N=644)Q6. Now indicate how favorable you are towards the following energy sources.
90%
70%
86%
61%
50%
33%
45%
27%
■ Recall Advertising■ Does Not Recall Advertising
+4
+9
+5
+6
BY ADVERTISING RECALL
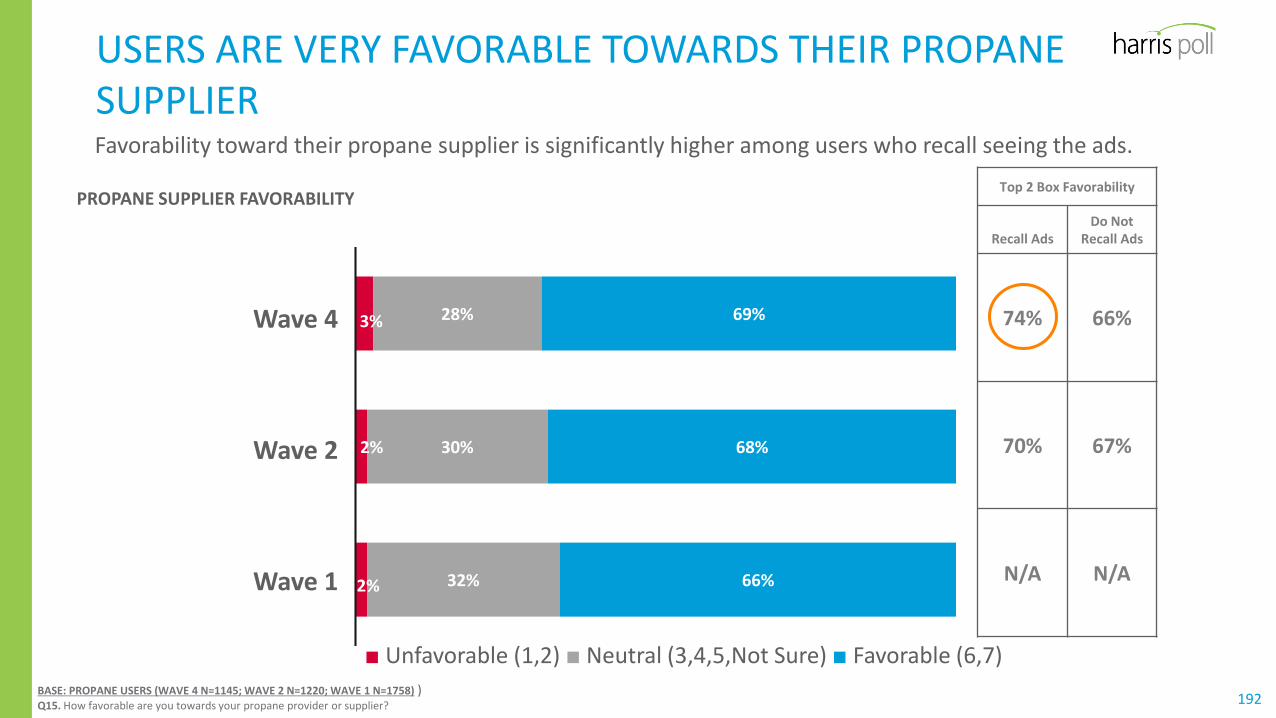
192BASE: PROPANE USERS (WAVE 4 N=1145; WAVE 2 N=1220; WAVE 1 N=1758) )Q15. How favorable are you towards your propane provider or supplier?
3%
2%
2%
28%
30%
32%
69%
68%
66%
Wave 4
Wave 2
Wave 1
■ Unfavorable (1,2) ■ Neutral (3,4,5,Not Sure) ■ Favorable (6,7)
USERS ARE VERY FAVORABLE TOWARDS THEIR PROPANE SUPPLIER
PROPANE SUPPLIER FAVORABILITYTop 2 Box Favorability
Recall AdsDo Not
Recall Ads
74% 66%
70% 67%
N/A N/A
Favorability toward their propane supplier is significantly higher among users who recall seeing the ads.

193BASE: PROPANE USERS (WAVE 4 N=1145; WAVE 2 N=1220; WAVE 1 N=1758) )Q15. How favorable are you towards your propane provider or supplier?
59%
64%
58%
67%
40%
35%
41%
32%
2%
1%
1%
Wave 4
Wave 3
Wave 2
Wave 1
USERS WHO RECALL THE ADS ARE MORE LIKELY TO HAVE CONTACTED THEIR PROPANE SUPPLIER
CONTACTED PROPANE SUPPLIER OR PROVIDER IN THE PAST SIX MONTHS
Contacted Propane Supplier
Recall AdsDo Not
Recall Ads
65% 56%
72% 62%
65% 56%
N/A N/A
■ Not Sure ■ No ■ Yes

194
ACTIONS, PERCEPTIONS & ATTRIBUTES
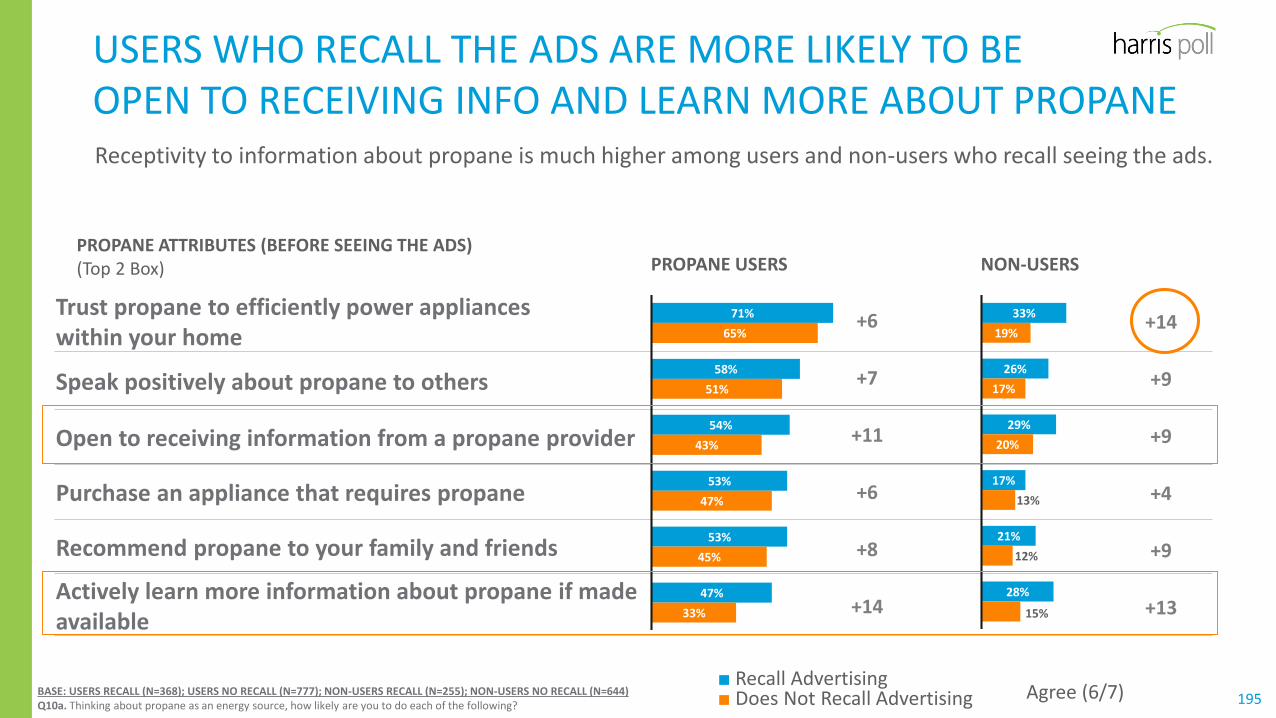
195
USERS WHO RECALL THE ADS ARE MORE LIKELY TO BEOPEN TO RECEIVING INFO AND LEARN MORE ABOUT PROPANE
PROPANE USERS NON-USERS
Trust propane to efficiently power applianceswithin your home
Speak positively about propane to others
Open to receiving information from a propane provider
Purchase an appliance that requires propane
Recommend propane to your family and friends
Actively learn more information about propane if made available
BASE: USERS RECALL (N=368); USERS NO RECALL (N=777); NON-USERS RECALL (N=255); NON-USERS NO RECALL (N=644)Q10a. Thinking about propane as an energy source, how likely are you to do each of the following?
71%
58%
54%
53%
53%
47%
65%
51%
43%
47%
45%
33%
+6
+7
+11
+6
+8
+14
Agree (6/7)
33%
26%
29%
17%
21%
28%
19%
17%
20%
13%
12%
15%
+14
+9
+9
+4
+9
+13
■ Recall Advertising■ Does Not Recall Advertising
Receptivity to information about propane is much higher among users and non-users who recall seeing the ads.
PROPANE ATTRIBUTES (BEFORE SEEING THE ADS)(Top 2 Box)
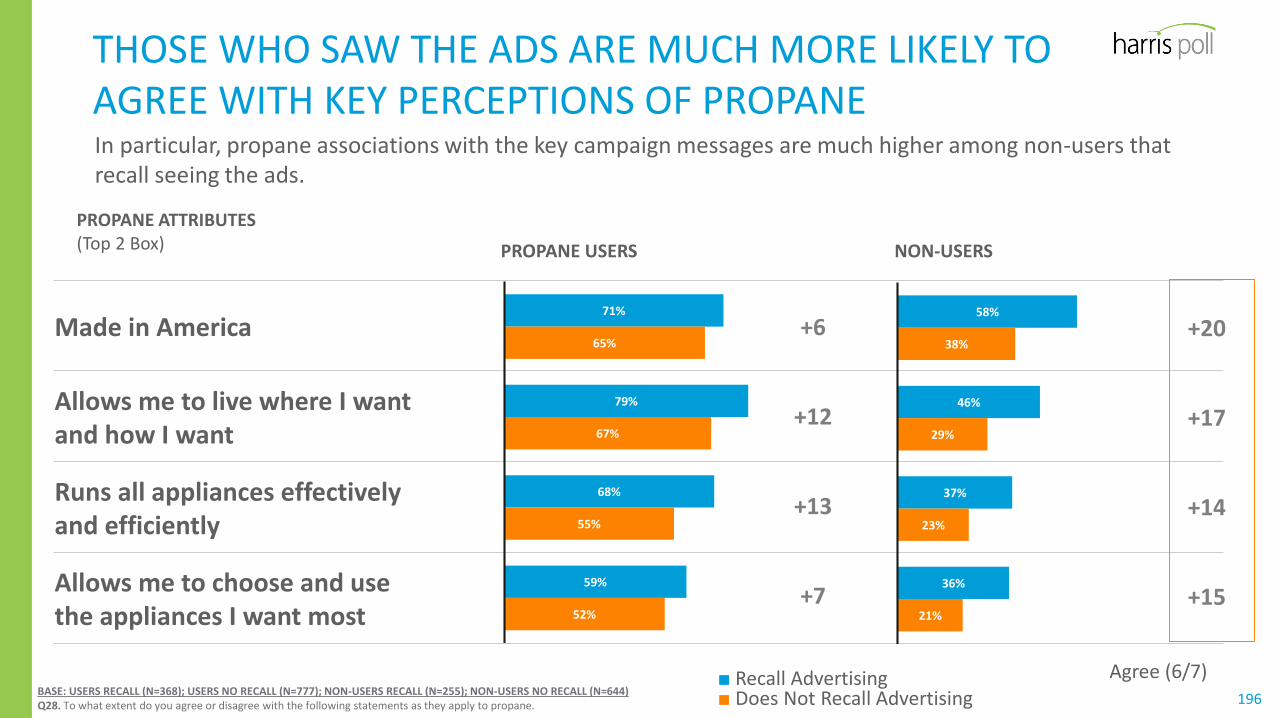
196
THOSE WHO SAW THE ADS ARE MUCH MORE LIKELY TO AGREE WITH KEY PERCEPTIONS OF PROPANE
PROPANE USERS NON-USERS
Made in America
Allows me to live where I wantand how I want
Runs all appliances effectivelyand efficiently
Allows me to choose and usethe appliances I want most
BASE: USERS RECALL (N=368); USERS NO RECALL (N=777); NON-USERS RECALL (N=255); NON-USERS NO RECALL (N=644)Q28. To what extent do you agree or disagree with the following statements as they apply to propane.
71%
79%
68%
59%
65%
67%
55%
52%
+6
+12
+13
+7
Agree (6/7)■ Recall Advertising■ Does Not Recall Advertising
58%
46%
37%
36%
38%
29%
23%
21%
+20
+17
+14
+15
In particular, propane associations with the key campaign messages are much higher among non-users that recall seeing the ads.
PROPANE ATTRIBUTES(Top 2 Box)
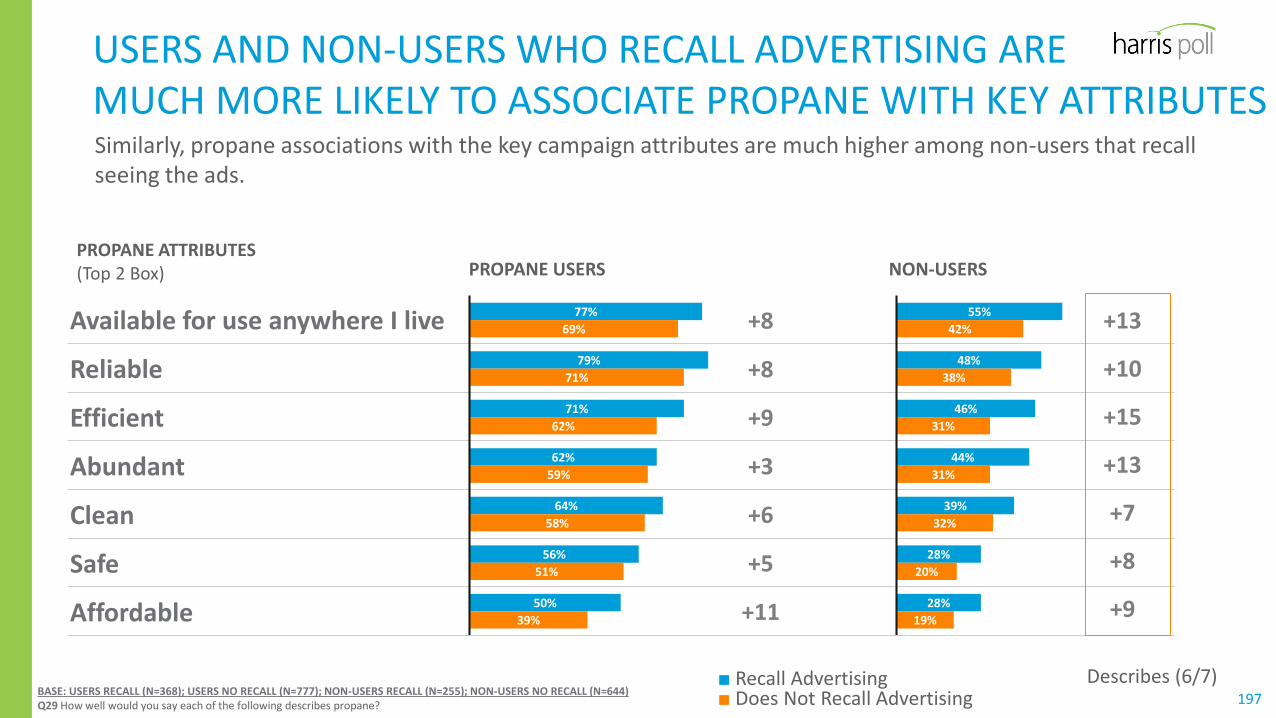
197
PROPANE USERS NON-USERS
Available for use anywhere I live
Reliable
Efficient
Abundant
Clean
Safe
Affordable
77%
79%
71%
62%
64%
56%
50%
69%
71%
62%
59%
58%
51%
39%
USERS AND NON-USERS WHO RECALL ADVERTISING ARE MUCH MORE LIKELY TO ASSOCIATE PROPANE WITH KEY ATTRIBUTES
PROPANE ATTRIBUTES(Top 2 Box)
BASE: USERS RECALL (N=368); USERS NO RECALL (N=777); NON-USERS RECALL (N=255); NON-USERS NO RECALL (N=644)Q29 How well would you say each of the following describes propane?
■ Recall Advertising■ Does Not Recall Advertising
Describes (6/7)
+8
+8
+9
+3
+6
+5
+11
55%
48%
46%
44%
39%
28%
28%
42%
38%
31%
31%
32%
20%
19%
+13
+10
+15
+13
+7
+8
+9
Similarly, propane associations with the key campaign attributes are much higher among non-users that recall seeing the ads.

198
THANK YOU

2017 FALL MEDIA PROPOSAL

INITIAL FALL MEDIA RECOMMENDATION
Please note: fall digital channel allocations are subject to change pending spring results
PERC 2017-2019 Strategic Plan

ADJUSTING THE CONSUMER CAMPAIGN
• Mixed reviews of the campaign from councilors and others in our industry.
• Desire to have more concrete metrics.
• Need to drive sales and capture new revenue.
• Limited funding.

2017 FALL INVESTMENT ANALYSIS
Reasons to do a Fall media buy of $1.5 Million
• Test a digital dominant strategy.
• Have a media presence during the fall heating season.
• Leverage the spring momentum.
• Avoid going totally dark till 2018.
Reasons not to do a Fall media buy of $1.5 Million
• Use a portion of the money to help offset PERC’s budget shortfall.
• Build out key elements needed to hit the ground running in 2018
• Use some resources to develop a national consumer program which is:
• consistent with our need for more measurable results
• develop an integrated brand strategy that works across the enterprise.

LOOKING AHEAD TO 2018
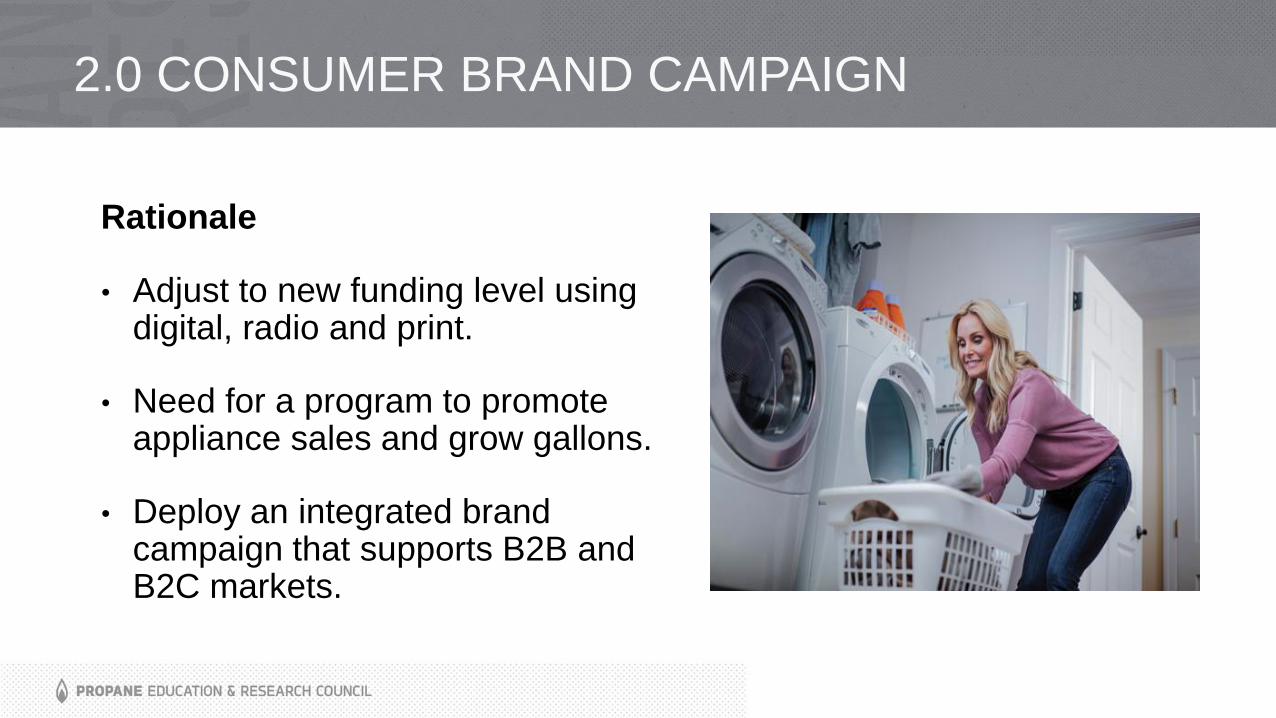
2.0 CONSUMER BRAND CAMPAIGN
Rationale
• Adjust to new funding level using digital, radio and print.
• Need for a program to promote appliance sales and grow gallons.
• Deploy an integrated brand campaign that supports B2B and B2C markets.
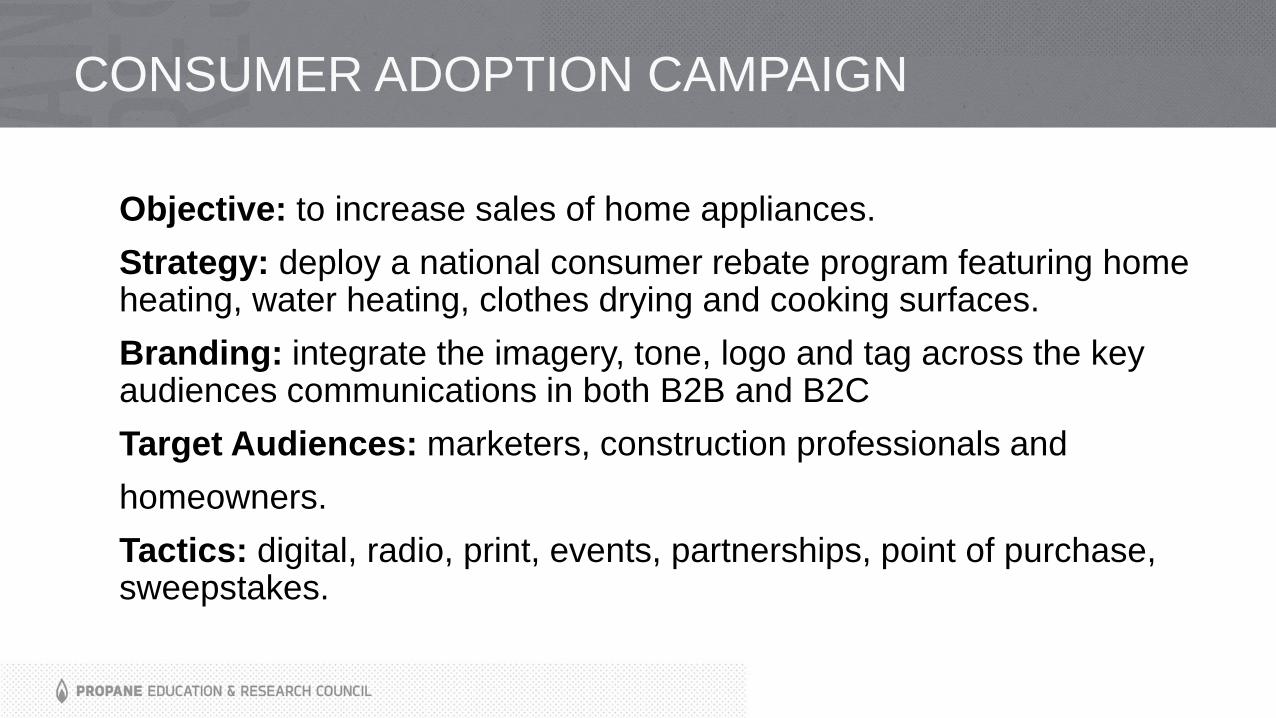
CONSUMER ADOPTION CAMPAIGN
Objective: to increase sales of home appliances.
Strategy: deploy a national consumer rebate program featuring home heating, water heating, clothes drying and cooking surfaces.
Branding: integrate the imagery, tone, logo and tag across the key audiences communications in both B2B and B2C
Target Audiences: marketers, construction professionals and
homeowners.
Tactics: digital, radio, print, events, partnerships, point of purchase, sweepstakes.

CONSUMER ADOPTION CAMPAIGN
PWS Incentive: provide states with a two-for-one match that complements
an existing safe appliance rebate program.
Key Consumer Messages: Propane is Clean American Energy, it allows you
to live where you want and how you want, runs all appliances effectively and
efficiently, its innovative and reliable.
Key Business Message: using propane is a win-win for you and your
customers, who will enjoy improved energy efficiency, comfort and reduced
emissions. Take advantage of our incentives to market your brand, acquire
new customers and build loyalty.
Suggested Project Team: MOT, state executives and other volunteers.
Budget: $5 million for media / $2.5 million for appliance rebates
Timing: Limited Rollout Jan. 2018

KEY ADOPTION CAMPAIGN CONSIDERATIONS
• MOT and state consultation
• Agency review and selection
• FPR enhancements
• Propane.com refresh
• Concept development
• Research
• Co-branded partnerships


INDUSTRY & PUBLIC COMMENTS

OLD BUSINESS

NEW BUSINESS

VALEDICTION
Roy Willis