joseph’s people, ltdjosephspeople.org/wp-content/uploads/2015/03/josephspeoplesurvey... ·...
TRANSCRIPT

Joseph’s People, Ltd A non-profit faith-based support
organization for the un/under-employed with Chapters in Berks, Chester, Delaware, Montgomery Counties and Pittsburgh
www.josephspeople.org
Survey of the Long-Term Unemployed
November 2014

SURVEY METHODOLOGY
• Long-term Unemployed defined as those out of full-time employment in their career for more than 27 weeks (the Fed. Guideline definition)
• Survey data collected over 8 week period • Survey accessed via Joseph’s People website
and collected by SurveyMonkey.com • Survey respondents included Joseph’s People
members, members of participating parish communities, and other ad hoc participants from indirect sources
Survey of the Long-Term Unemployed, November 2014
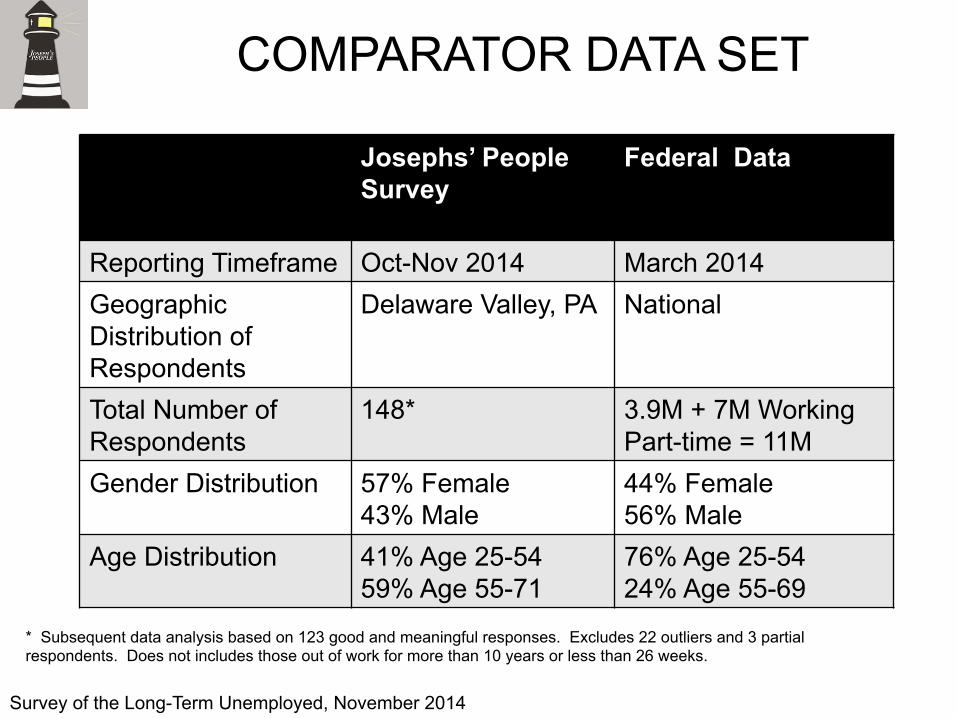
Josephs’ People Survey
Federal Data
Reporting Timeframe Oct-Nov 2014 March 2014 Geographic Distribution of Respondents
Delaware Valley, PA National
Total Number of Respondents
148* 3.9M + 7M Working Part-time = 11M
Gender Distribution 57% Female 43% Male
44% Female 56% Male
Age Distribution 41% Age 25-54 59% Age 55-71
76% Age 25-54 24% Age 55-69
COMPARATOR DATA SET
Survey of the Long-Term Unemployed, November 2014
* Subsequent data analysis based on 123 good and meaningful responses. Excludes 22 outliers and 3 partial respondents. Does not includes those out of work for more than 10 years or less than 26 weeks.

Lost Career Time Distribution
SURVEY DEMOGRAPHICS
Survey: Long-Term Unemployed, November 2014
22.9%
13.6%
20.3%
10.2%
16.9%
4.2%3.4%
1.7%
4.2%
2.5%
6-11 mos 1-2 yrs 2-3 yrs 3-4 yrs 4-5 yrs 5-6 yrs 6-7 yrs 7-8 yrs 8-9 yrs 9-10 yrsLost Time
LOST TIME DISTRIBUTION
80% of respondents were out of work for 5 years or less.
Yrs 2013-2009
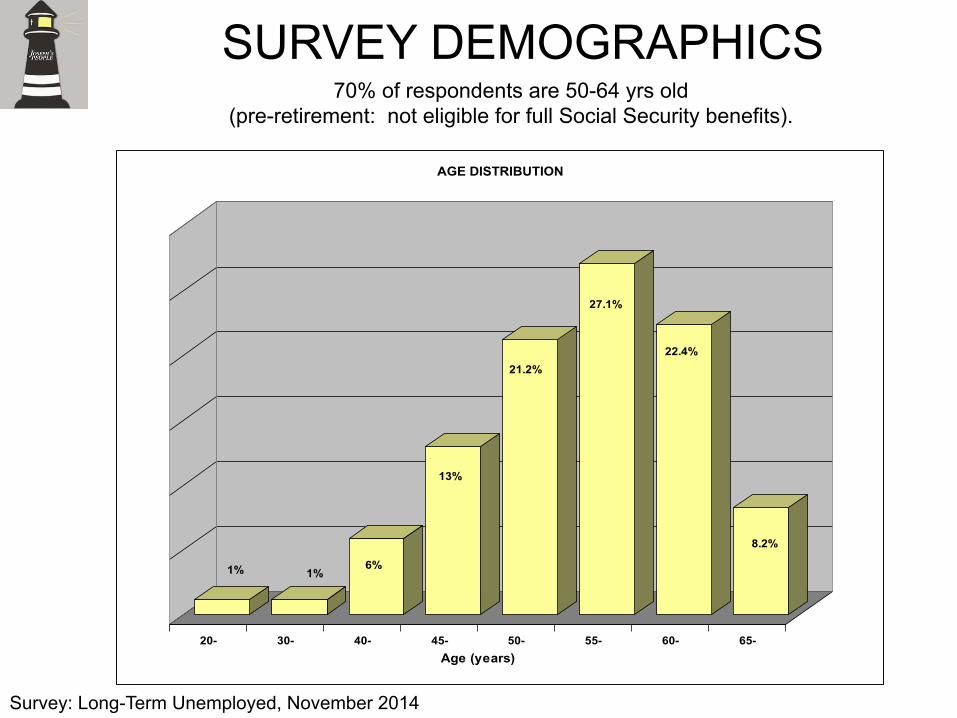
70% of respondents are 50-64 yrs old (pre-retirement: not eligible for full Social Security benefits).
SURVEY DEMOGRAPHICS
Survey: Long-Term Unemployed, November 2014
1% 1%6%
13%
21.2%
27.1%
22.4%
8.2%
20- 30- 40- 45- 50- 55- 60- 65-Age (years)
AGE DISTRIBUTION
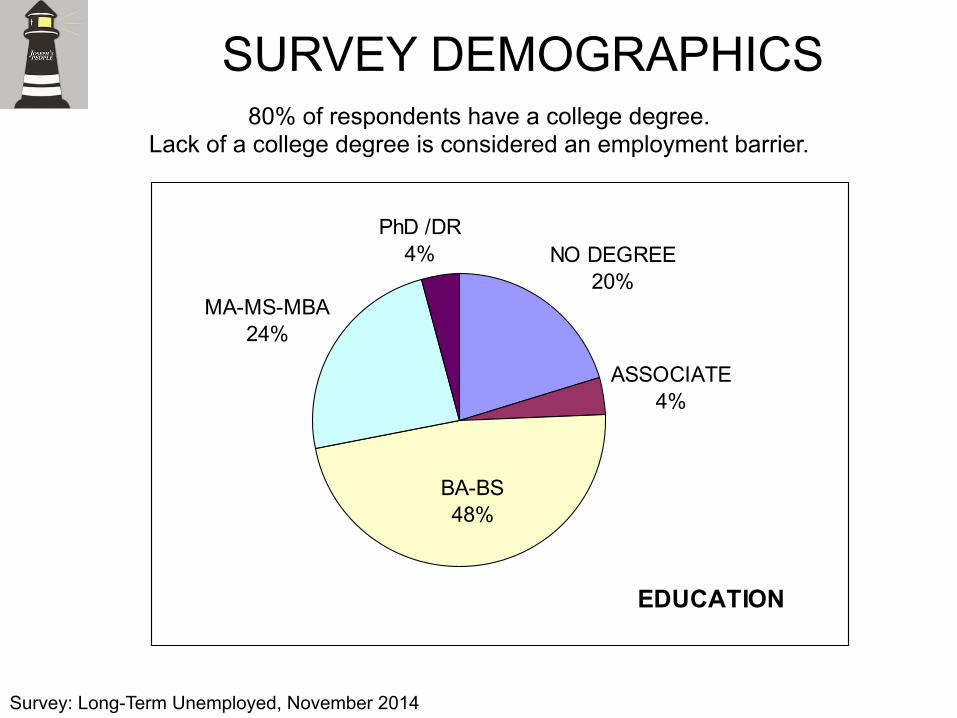
80% of respondents have a college degree. Lack of a college degree is considered an employment barrier.
SURVEY DEMOGRAPHICS
Survey: Long-Term Unemployed, November 2014
EDUCATION
NO DEGREE20%
ASSOCIATE4%
MA-MS-MBA24%
PhD /DR4%
BA-BS48%
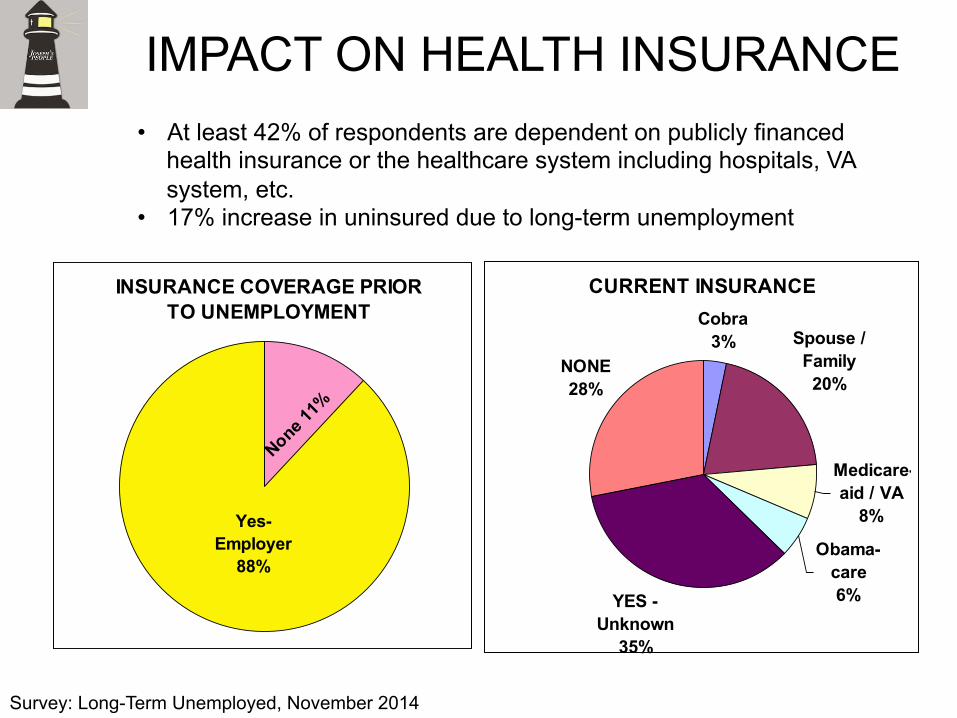
INSURANCE COVERAGE PRIOR TO UNEMPLOYMENT
None 11%
Yes-Employer
88%
• At least 42% of respondents are dependent on publicly financed health insurance or the healthcare system including hospitals, VA system, etc.
• 17% increase in uninsured due to long-term unemployment
IMPACT ON HEALTH INSURANCE
Survey: Long-Term Unemployed, November 2014
CURRENT INSURANCECobra
3% Spouse / Family20%
Medicare-aid / VA
8%
Obama-care6%YES -
Unknown35%
NONE28%

DEMOGRAPHIC DATA: HIGHEST RISK UNEMPLOYED
Survey: Long-Term Unemployed, November 2014
CAREER BEFORE / AFTER(Part-Time - Sporadic - None)
0% 5% 10% 15% 20% 25% 30% 35% 40%
None
Retail / Service
Cont/SE/Bs/Conslt
Education
Pharma / Health
Sales / Marketng
Government
IT + Tech
Legal / Fin / Ins
Non-Prof / Voluntr
Mgmt / Admin
BEFOREAFTER
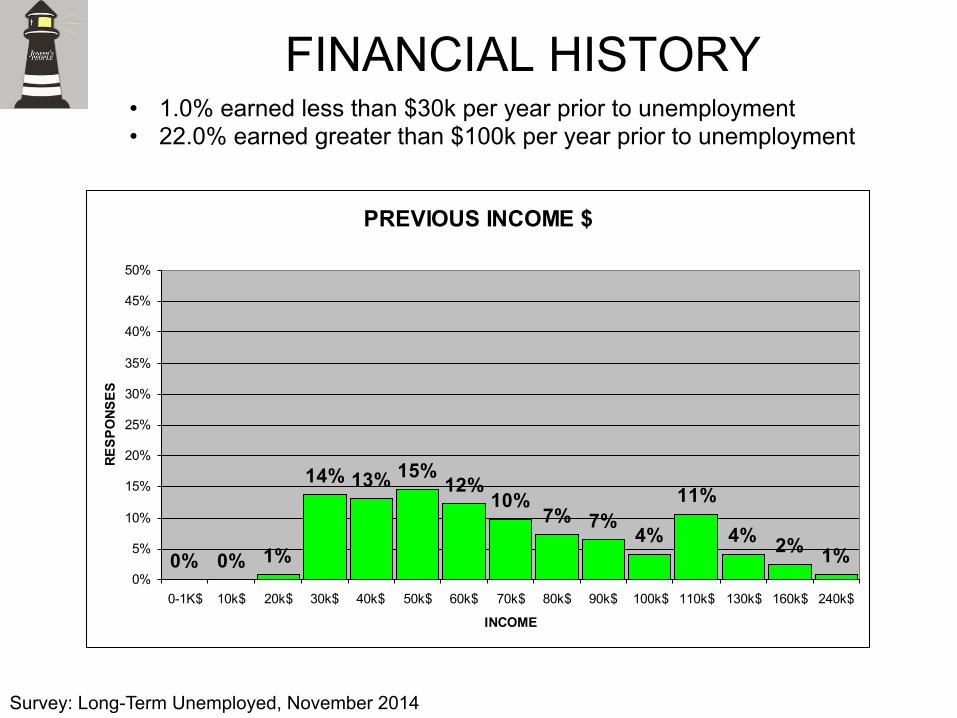
FINANCIAL HISTORY • 1.0% earned less than $30k per year prior to unemployment • 22.0% earned greater than $100k per year prior to unemployment
Survey: Long-Term Unemployed, November 2014
PREVIOUS INCOME $
0% 0% 1%
14% 13% 15%12%
10%7% 7%
4%
11%
4% 2% 1%0%
5%
10%
15%
20%
25%
30%
35%
40%
45%
50%
0-1K$ 10k$ 20k$ 30k$ 40k$ 50k$ 60k$ 70k$ 80k$ 90k$ 100k$ 110k$ 130k$ 160k$ 240k$
INCOME
RESP
ONS
ES
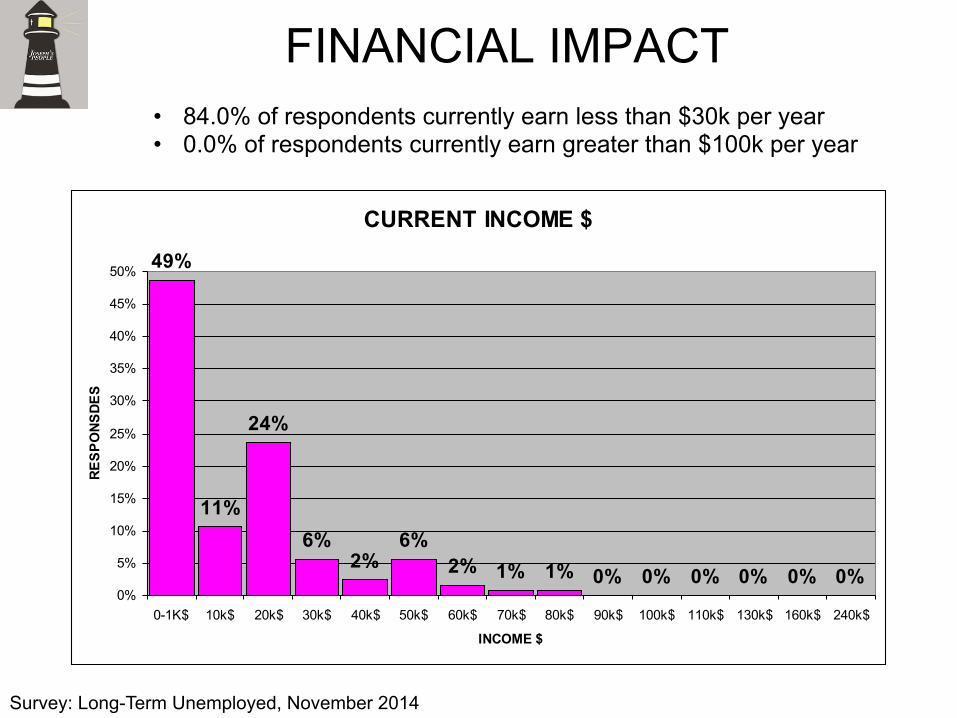
FINANCIAL IMPACT • 84.0% of respondents currently earn less than $30k per year • 0.0% of respondents currently earn greater than $100k per year
Survey: Long-Term Unemployed, November 2014
CURRENT INCOME $
49%
11%
24%
6%2%
6%2% 1% 1% 0% 0% 0% 0% 0% 0%
0%
5%
10%
15%
20%
25%
30%
35%
40%
45%
50%
0-1K$ 10k$ 20k$ 30k$ 40k$ 50k$ 60k$ 70k$ 80k$ 90k$ 100k$ 110k$ 130k$ 160k$ 240k$
INCOME $
RESP
ONS
DES

FINANCIAL IMPACT: CHANGE IN EARNINGS
• Respondents make on average 33% of previous earnings or a 66% reduction in average annual earnings
Survey of the Long-Term Unemployed, November 2014
0-1K$30k$
60k$90k$
130k$
49%
11%
24%
6%
2%6%
2%1% 1%
0% 0% 0% 0% 0% 0%
0% 0% 1%14%13%15%12%
10%7%
7% 4% 11%4% 2%
1%
0%5%10%15%20%25%30%35%40%45%50%
CURRENT VS PREVIOUS INCOME $

SUMMARY OF FINANCIAL IMPACT Federal Poverty Guideline is less than $16k per year for an individual
• Before unemployment: No respondents met Federal Poverty Guidelines • After unemployment: 69% of respondents meet Federal Poverty Guidelines
Survey: Long-Term Unemployed, November 2014
• 123 respondents counted in survey
• 35 months average since unemployed in their career field
• $51.8k annual average earnings lost per respondent
• $6.1 million per year lost by local group
• 344 years of lost earnings in total
• $17.8 M lost earnings for local group
Individual Impact Total Impact of Survey
Group
KEY LEARNINGS
• The economy lost a significant amount of potential spending money that was not received due to unemployment.
• Lack of college degree is considered a barrier to employment, however 80% of the respondents have a college degree; there must be other barriers.
• There is a 69% increase in individuals eligible for and utilizing social services.
• There is a greater strain on the emergency healthcare system due to a 17% increase in the uninsured.
• The longer they are unemployed, the more difficult it becomes to obtain a career position.
Survey of the Long-Term Unemployed, November 2014

Joseph’s People Plan CHANGING THE FUTURE
• Create Pathway To Employment Program – Partnership with CC CareerLink and Financial Stability Center to
educate long-term unemployed on available services – Partnership with HireOne to link Pathway to Employment Program with
jobs • Create Pathway to Self-Employment/Business Ownership Program
– Partnership with CC CareerLink and Financial Stability Center to educate long-term unemployed on available services
– Partnership with micro-lending institutions and SCORE • Develop legislation to remove the barriers to employers hiring long-
term unemployed – Funding component (“carrot”) – Anti-discrimination component (“stick”)
Survey of the Long-Term Unemployed, November 2014