jg heller global q2 2015 review linkedin
TRANSCRIPT

Q2Quarterly Market Review
Second Quarter 2015Insert Firm Logo
JGHELLERPrivateWealthAdvisors

Quarterly Market ReviewSecond Quarter 2015
Overview:
Market Summary
World Stock Market Performance
World Asset Classes
US Stocks
International Developed Stocks
Emerging Markets Stocks
Select Country Performance
Real Estate Investment Trusts (REITs)
Commodities
Fixed Income
Global Diversification
Quarterly Topic: The Seven Roles of an Advisor
This report features world capital market performance and a timeline of events for the past quarter. It begins with a global overview, then features the returns of stock and bond asset classes in the US and international markets.
The report also illustrates the performance of globally diversified portfolios and features a quarterly topic.
JGHELLER

3
US StockMarket
GlobalReal Estate
International Developed Stocks
US Bond Market
GlobalBondMarket ex US
+0.14% +0.48% -7.90% -1.68%
Emerging MarketsStocks
BONDSSTOCKS
+0.69%
Market Summary
Past performance is not a guarantee of future results. Indices are not available for direct investment. Index performance does not reflect the expenses associated with the management of an actual portfolio. Market segment (index representation) as follows: US Stock Market (Russell 3000 Index), International Developed Stocks (MSCI World ex USA Index [net div.]), Emerging Markets (MSCI Emerging Markets Index [net div.]), Global Real Estate (S&P Global REIT Index), US Bond Market (Barclays US Aggregate Bond Index), and Global Bond ex US Market (Citigroup WGBI ex USA 1−30 Years [Hedged to USD]). The S&P data are provided by Standard & Poor's Index Services Group. Russell data © Russell Investment Group 1995–2015, all rights reserved. MSCI data © MSCI 2015, all rights reserved. Barclays data provided by Barclays Bank PLC. Citigroup bond indices © 2014 by Citigroup.
Second Quarter 2015 Index Returns
-3.19%
JGHELLER

4
World Stock Market Performance
Graph Source: MSCI ACWI Index. MSCI data © MSCI 2015, all rights reserved.It is not possible to invest directly in an index. Performance does not reflect the expenses associated with management of an actual portfolio. Past performance is not a guarantee of future results.
MSCI All Country World Index with selected headlines from Q2 2015
These headlines are not offered to explain market returns. Instead, they serve as a reminder that investors should view daily events from a long-term perspective and avoid making investment decisions based solely on the news.
180
190
200
210
Apr May Jun
“European Stocks
Set New Record”
“Eurozone GDP Growth Accelerates, Boosted by France, Italy”
“Home Building Surges to
Best Pace since 2007”
“Economists See Bright Consumer Outlook”
“China’s Economy Hits Slowest Growth since 2009”
“Nasdaq Composite, S&P 500 Close at New Highs”
“Fed Flags Slow Pacefor Rate Hikes”
“Eurozone Finance Ministers Reject Greek Request for One-Month Bailout Extension”
“US Jobless Claims Fall to Lowest Level in 15 Years”
“US Economy Contracted 0.7% in First Quarter”
“Oil Prices Gain in Second Quarter”
JGHELLER

5
World Asset ClassesInsert Firm Logo
Past performance is not a guarantee of future results. Indices are not available for direct investment. Index performance does not reflect the expenses associated with the management of an actual portfolio. The S&P data is provided by Standard & Poor's Index Services Group. Russell data © Russell Investment Group 1995–2015, all rights reserved. MSCI data © MSCI 2015, all rights reserved. Dow Jones data (formerly Dow Jones Wilshire) provided by Dow Jones Indexes. Barclays data provided by Barclays Bank PLC.
Looking at broad market indices, emerging markets outperformed both the US and developed ex US markets in US dollars during the quarter. REITs recorded the lowest performance in developed markets, including the US.
The value effect was positive in emerging markets but negative in developed markets, including the US. Small caps outperformed large caps in the US, non-US developed markets, and emerging markets. The US dollar had mixed performance during the quarter.
Second Quarter 2015 Index Returns
MSCI Emerging Markets Small Cap Index (net div.)
MSCI World ex USA Small Cap Index (net div.)
MSCI Emerging Markets Value Index (net div.)
MSCI Emerging Markets Index (net div.)
MSCI World ex USA Index (net div.)
Russell 2000 Index
S&P 500 Index
MSCI World ex USA Value Index (net div.)
Russell 1000 Value Index
One-Month US Treasury Bills
Russell 2000 Value Index
Barclays US Aggregate Bond Index
S&P Global ex US REIT Index (net div.)
Dow Jones US Select REIT Index
4.50
4.16
1.79
0.69
0.48
0.42
0.28
0.12
0.11
0.00
-1.20
-1.68
-3.15
-10.00
JGHELLER
6
Small Cap Growth
Small Cap
Large Cap
Marketwide
Large Cap Growth
Large Cap Value
Small Cap Value
1.98
0.42
0.28
0.14
0.12
0.11
-1.20
Ranked Returns for the Quarter (%)
US StocksSecond Quarter 2015 Index Returns
Past performance is not a guarantee of future results. Indices are not available for direct investment. Index performance does not reflect the expenses associated with the management of an actual portfolio . Market segment (index representation) as follows: Marketwide (Russell 3000 Index), Large Cap (S&P 500 Index), Large Cap Value (Russell 1000 Value Index), Large Cap Growth (Russell 1000 Growth Index), Small Cap (Russell 2000 Index), Small Cap Value (Russell 2000 Value Index), and Small Cap Growth (Russell 2000 Growth Index). World Market Cap represented by Russell 3000 Index, MSCI World ex USA IMI Index, and MSCI Emerging Markets IMI Index. Russell 3000 Index is used as the proxy for the US market. Russell data © Russell Investment Group 1995–2015, all rights reserved. The S&P data are provided by Standard & Poor's Index Services Group.
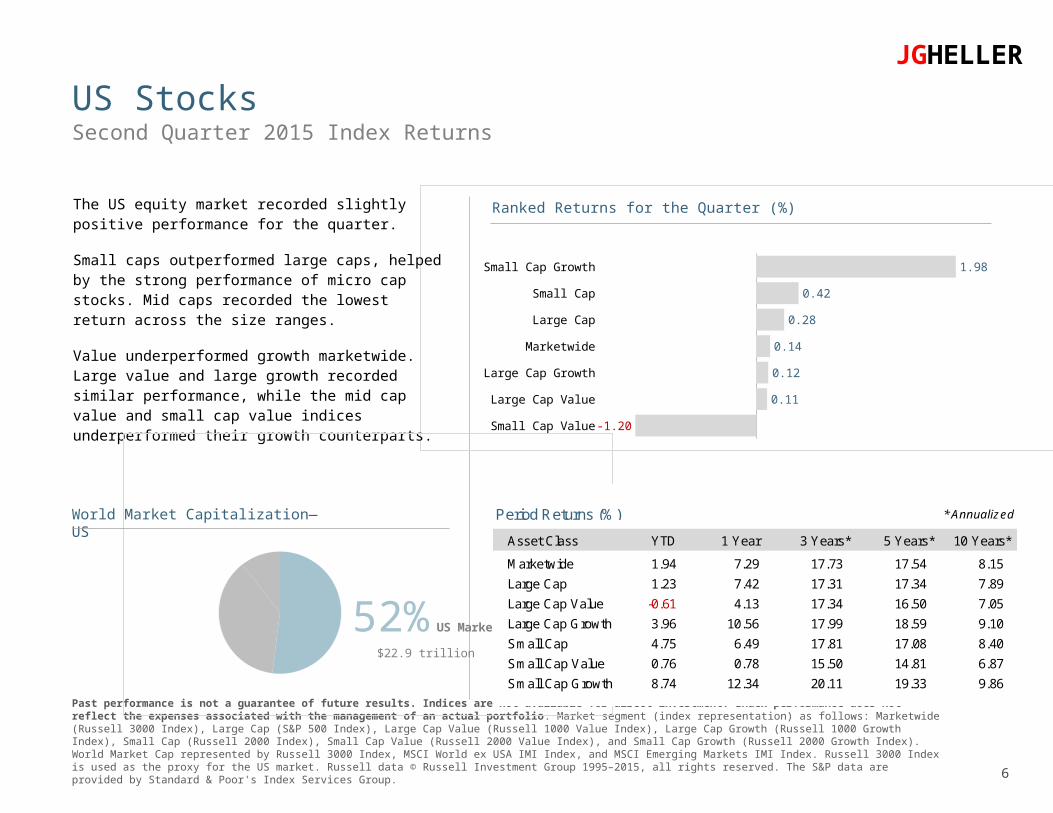
The US equity market recorded slightly positive performance for the quarter.
Small caps outperformed large caps, helped by the strong performance of micro cap stocks. Mid caps recorded the lowest return across the size ranges.
Value underperformed growth marketwide. Large value and large growth recorded similar performance, while the mid cap value and small cap value indices underperformed their growth counterparts.
52% US Market $22.9 trillion
World Market Capitalization—US Period Returns (%) * Annualized
Asset Class YTD 1 Year 3 Years** 5 Years** 10 Years**
Marketwide 1.94 7.29 17.73 17.54 8.15Large Cap 1.23 7.42 17.31 17.34 7.89Large Cap Value -0.61 4.13 17.34 16.50 7.05Large Cap Growth 3.96 10.56 17.99 18.59 9.10Small Cap 4.75 6.49 17.81 17.08 8.40Small Cap Value 0.76 0.78 15.50 14.81 6.87Small Cap Growth 8.74 12.34 20.11 19.33 9.86
JGHELLER
International Developed Stocks
7
Insert Firm Logo
Second Quarter 2015 Index Returns
Past performance is not a guarantee of future results. Indices are not available for direct investment. Index performance does not reflect the expenses associated with the management of an actual portfolio. Market segment (index representation) as follows: Large Cap (MSCI World ex USA Index), Small Cap (MSCI World ex USA Small Cap Index), Value (MSCI World ex USA Value Index), and Growth (MSCI World ex USA Growth). All index returns are net of withholding tax on dividends. World Market Cap represented by Russell 3000 Index, MSCI World ex USA IMI Index, and MSCI Emerging Markets IMI Index. MSCI World ex USA IMI Index used as the proxy for the International Developed market. MSCI data © MSCI 2015, all rights reserved.
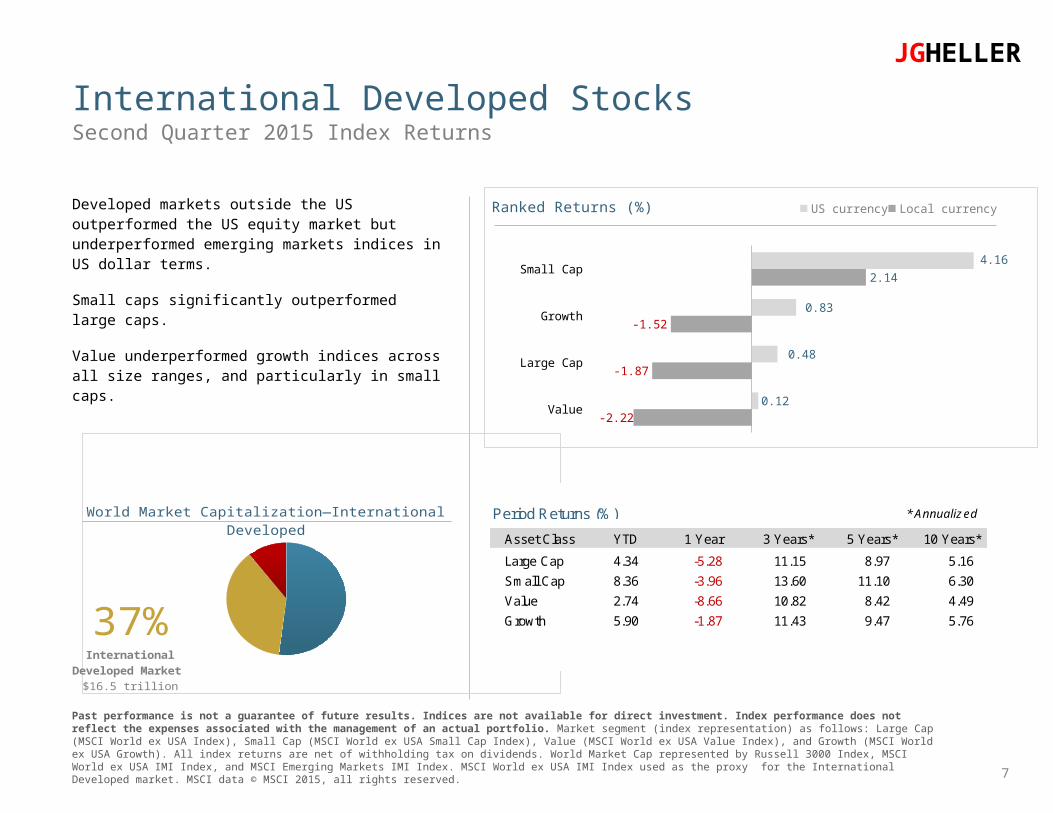
Developed markets outside the US outperformed the US equity market but underperformed emerging markets indices in US dollar terms.
Small caps significantly outperformed large caps.
Value underperformed growth indices across all size ranges, and particularly in small caps.
Value
Large Cap
Growth
Small Cap
-2.22
-1.87
-1.52
2.14
0.12
0.48
0.83
4.16
Ranked Returns (%) US currency Local currency
37%International Developed
Market $16.5 trillion
World Market Capitalization—International Developed * Annualized
Asset Class YTD 1 Year 3 Years** 5 Years** 10 Years**
Large Cap 4.34 -5.28 11.15 8.97 5.16Small Cap 8.36 -3.96 13.60 11.10 6.30Value 2.74 -8.66 10.82 8.42 4.49Growth 5.90 -1.87 11.43 9.47 5.76
Period Returns (%)
JGHELLER

Emerging Markets Stocks
8
Insert Firm Logo
Second Quarter 2015 Index Returns
Past performance is not a guarantee of future results. Indices are not available for direct investment. Index performance does not reflect the expenses associated with the management of an actual portfolio. Market segment (index representation) as follows: Large Cap (MSCI Emerging Markets Index), Small Cap (MSCI Emerging Markets Small Cap Index), Value (MSCI Emerging Markets Value Index), and Growth (MSCI Emerging Markets Growth Index). All index returns are net of withholding tax on dividends. World Market Cap represented by Russell 3000 Index, MSCI World ex USA IMI Index, and MSCI Emerging Markets IMI Index. MSCI Emerging Markets IMI Index used as the proxy for the emerging market portion of the market. MSCI data © MSCI 2015, all rights reserved.
Emerging markets indices outperformed developed markets indices, including the US, in US dollar terms during the quarter.
Small cap indices significantly outperformed large cap indices for the quarter.
Value outperformed growth marketwide, influenced by the strong performance of large caps. Value indices underperformed growth indices in both mid caps and small caps.
Small
Value
Large Cap
Growth
4.50
1.79
0.69
-0.29
4.71
1.70
0.70
-0.20
Ranked Returns (%) Local currency US currency
11%Emerging Markets
$4.7 trillion
World Market Capitalization—Emerging Markets * Annualized
Asset Class YTD 1 Year 3 Years** 5 Years** 10 Years**
Large Cap 2.95 -5.12 3.71 3.68 8.11Small Cap 8.25 0.34 7.98 5.04 9.96Value 2.18 -7.67 1.44 2.14 8.16Growth 3.66 -2.64 5.92 5.17 8.01
Period Returns (%)
JGHELLER

UAEHungary
ChinaRussia
BrazilGreece
ColombiaCzech Republic
PeruQatar
TurkeyMexicoTaiwan
KoreaSouth Africa
PolandThailand
ChileIndia
PhilippinesMalaysia
EgyptIndonesia
-0.88-0.89-1.20
-3.51-3.82-3.92
-6.13-7.30
-8.91-14.11
10.859.65
7.807.54
6.766.61
3.241.77
0.870.550.420.050.00
Ranked Emerging Markets Returns (%)
IrelandHong Kong
NorwayUK
JapanDenmark
ItalyNetherlands
BelgiumAustria
SwitzerlandFrance
USSingapore
PortugalCanada
IsraelSpain
SwedenFinland
GermanyAustralia
New Zealand
-0.09-0.45-0.55
-1.86-2.57
-3.59-5.04
-6.15-11.85
7.405.58
4.364.13
3.343.07
2.602.48
1.951.67
1.090.500.140.08
Ranked Developed Markets Returns (%)
Select Country Performance
9
Insert Firm Logo
Past performance is not a guarantee of future results. Indices are not available for direct investment. Index performance does not reflect the expenses associated with the management of an actual portfolio . Country performance based on respective indices in the MSCI World ex US IMI Index (for developed markets), Russell 3000 Index (for US), and MSCI Emerging Markets IMI Index. All returns in USD and net of withholding tax on dividends. MSCI data © MSCI 2015, all rights reserved. Russell data © Russell Investment Group 1995–2015, all rights reserved. UAE and Qatar have been reclassified as emerging markets by MSCI, effective May 2014.
Smaller countries recorded the highest performance for the quarter, with Ireland and Hong Kong leading the way in developed markets and the UAE and Hungary in emerging markets. Currency played a role for each of the countries that recorded the lowest performance in developed and emerging markets, as the New Zealand dollar and the Indonesian rupiah depreciated vs. the US dollar.
Second Quarter 2015 Index Returns
JGHELLER

10
Real Estate Investment Trusts (REITs)Second Quarter 2015 Index Returns
Past performance is not a guarantee of future results. Indices are not available for direct investment. Index performance does not reflect the expenses associated with the management of an actual portfolio. Number of REIT stocks and total value based on the two indices. All index returns are net of withholding tax on dividends. Total value of REIT stocks represented by Dow Jones US Select REIT Index and the S&P Global ex US REIT Index. Dow Jones US Select REIT Index used as proxy for the US market, and S&P Global ex US REIT Index used as proxy for the World ex US market. Dow Jones US Select REIT Index data provided by Dow Jones ©. S&P Global ex US REIT Index data provided by Standard and Poor’s Index Services Group © 2014.
REITs both in the US and non-US markets significantly underperformed the broad equity markets during the quarter.
57%US
$549 billion92 REITs
43%World ex US $409 billion
236 REITs(22 other countries)
Total Value of REIT Stocks
US REITs
Global REITs (ex US)
-10.00
-3.15
Ranked Returns (%)
Period Returns (%) * Annualized
Asset Class YTD 1 Year 3 Years** 5 Years** 10 Years**
US REITs -5.75 5.21 8.67 14.43 6.78 Global REITs (ex US) -1.05 -3.21 9.24 11.93 4.01
JGHELLER

11
CommoditiesInsert Firm Logo
Second Quarter 2015 Index Returns
Past performance is not a guarantee of future results. Index is not available for direct investment. Index performance does not reflect the expenses associated with the management of an actual portfolio. All index returns are net of withholding tax on dividends. Securities and commodities data provided by Bloomberg.
Commodities were broadly positive during the second quarter. The Bloomberg Commodity Index Total Return gained 4.66%. The energy complex led the period with unleaded gas returning 17.99% and WTI crude oil returning 17.50%.
Grains also posted positive returns; Chicago wheat added 19.26%, while soybean meal added 11.44%.
Metals were negative; aluminum declined 7.25% and silver dropped 6.63%.
Asset Class YTD Q2 1 Year 3 Years** 5 Years** 10 Years**
Commodities -1.56 4.66 -23.71 -8.76 -3.91 -2.62
Period Returns (%) * Annualized
Aluminum
Silver
Copper
Zinc
Coffee
Nickel
Live Cattle
Gold
Lean Hogs
Natural Gas
Sugar
Cotton
Corn
Heating Oil
Soybeans
Soybean Oil
Brent Oil
WTI Crude Oil
Unleaded Gas
Wheat
-7.25
-6.63
-4.79
-4.39
-3.85
-3.67
-1.83
-1.05
-0.99
1.82
2.20
6.21
7.79
9.09
9.17
10.66
10.67
17.50
17.99
19.26
Ranked Returns for Individual Commodities (%)
JGHELLER

12
10-Year US Treasury
State and Local Munic-
ipals
AAA-AA Corporates
A-BBB Corporates
2.35
3.80
2.70
3.43
Bond Yields across Issuers
Fixed Income
Past performance is not a guarantee of future results. Indices are not available for direct investment. Index performance does not reflect the expenses associated with the management of an actual portfolio. Yield curve data from Federal Reserve. State and local bonds are from the Bond Buyer Index, general obligation, 20 years to maturity, mixed quality. AAA-AA Corporates represent the Bank of America Merrill Lynch US Corporates, AA-AAA rated. A-BBB Corporates represent the Bank of America Merrill Lynch US Corporates, BBB-A rated. Barclays data provided by Barclays Bank PLC. US long-term bonds, bills, inflation, and fixed income factor data © Stocks, Bonds, Bills, and Inflation (SBBI) Yearbook™, Ibbotson Associates, Chicago (annually updated work by Roger G. Ibbotson and Rex A. Sinquefield). Citigroup bond indices © 2014 by Citigroup. The BofA Merrill Lynch Indices are used with permission; © 2014 Merrill Lynch, Pierce, Fenner & Smith Incorporated; all rights reserved. Merrill Lynch, Pierce, Fenner & Smith Incorporated is a wholly owned subsidiary of Bank of America Corporation.
Second Quarter 2015 Index Returns
Interest rates across the US fixed income markets generally increased during the second quarter. The 5-year Treasury note added 25 basis points to end the period yielding 1.63%. The 10-year Treasury note increased 42 basis points to end the quarter at 2.35%. The 30-year Treasury bond added 56 basis points to finish with a yield of 3.10%.
On the short end of the curve, the 2-year Treasury note added 8 basis points to finish at 0.64%. Yields on securities within one year to maturity were generally lower by 2 basis points.
Short-term corporate bonds gained 0.06%, while intermediate-term corporate bonds lost 1.09%.
Short-term municipal bonds were relatively unchanged, but intermediate municipal bonds declined 0.89%. Municipal general obligation and revenue bonds experienced similar returns.
Period Returns (%)
Asset Class YTD 1 Year 3 Years** 5 Years** 10 Years**
BofA Merrill Lynch Three-Month US Treasury Bill Index 0.01 0.02 0.06 0.08 1.42BofA Merrill Lynch 1-Year US Treasury Note Index 0.21 0.24 0.28 0.36 1.92Citigroup WGBI 1−5 Years (hedged to USD) 0.51 1.27 1.40 1.54 2.93Barclays Long US Government Bond Index -4.52 6.20 1.25 6.23 6.12Barclays US Aggregate Bond Index -0.10 1.86 1.83 3.35 4.44Barclays US Corporate High Yield Index 2.53 -0.40 6.81 8.61 7.89Barclays Municipal Bond Index 0.11 3.00 3.10 4.50 4.45Barclays US TIPS Index 0.34 -1.73 -0.76 3.29 4.14
* Annualized
0
1
2
3
4
US Treasury Yield Curve
1Yr
5Yr
10Yr
30Yr
6/30/15
6/30/14
3/31/15
JGHELLER

13
12/1988 12/1993 12/1998 12/2003 12/2008 12/2013$10,000
$20,000
$30,000
$40,000
$50,000
$60,000
$70,000
$80,000
Growth of Wealth: The Relationship between Risk and Return
Stock/Bond Mix
100% Stocks
75/25
50/50
25/75
100% Treasury Bills
Global DiversificationSecond Quarter 2015 Index Returns
Diversification does not eliminate the risk of market loss. Past performance is not a guarantee of future results. Indices are not available for direct investment. Index performance does not reflect expenses associated with the management of an actual portfolio. Asset allocations and the hypothetical index portfolio returns are for illustrative purposes only and do not represent actual performance. Global Stocks represented by MSCI All Country World Index (gross div.) and Treasury Bills represented by US One-Month Treasury Bills. Globally diversified allocations rebalanced monthly, no withdrawals. Data © MSCI 2015, all rights reserved. Treasury bills © Stocks, Bonds, Bills, and Inflation Yearbook™, Ibbotson Associates, Chicago (annually updated work by Roger G. Ibbotson and Rex A. Sinquefield).
These portfolios illustrate the performance of different global stock/bond mixes and highlight the benefits of diversification. Mixes with larger allocations to stocks are considered riskier but have higher expected returns over time.
100% Treasury Bills
25/75
50/50
75/25
100% Stocks
0.00
0.14
0.28
0.40
0.52
Ranked Returns (%)
Asset Class YTD 1 Year 3 Years** 5 Years** 10 Years**
100% Stocks 2.97 1.23 13.61 12.52 6.97
75/25 2.27 0.99 10.14 9.46 5.81
50/50 1.54 0.71 6.72 6.35 4.47
25/75 0.78 0.38 3.35 3.21 2.96
100% Treasury Bills 0.01 0.01 0.03 0.04 1.30
* AnnualizedPeriod Returns (%)
6/2015
JGHELLER

14
What is a financial advisor for? One view is that advisors have unique insights into market direction that give their clients an advantage. But of the many roles a professional advisor should play, soothsayer is not one of them.
The truth is that no one knows what will happen next in investment markets. And if anyone really did have a working crystal ball, it is unlikely they would be plying their trade as an advisor, broker, analyst, or financial journalist.
Some folks may still think an advisor’s role is to deliver market-beating returns year after year. Generally, those are the same people who believe good advice equates to making accurate forecasts.
But in reality, the value a professional advisor brings is not dependent on the state of markets. Indeed, their value can be even more evident when volatility and emotions are running high.
The best of this new breed play multiple and nuanced roles with their clients. None of these roles involve making forecasts about markets or economies. Indeed, there are at least seven hats an advisor can wear to help clients without ever once having to look into a crystal ball:
1. The Expert: Investors need advisors who can provide client-centered expertise in assessing the state of their finances and developing risk-aware strategies to help them meet their goals.
2. The Independent Voice: The global financial turmoil of recent years demonstrated the value of an independent and objective voice in a world full of product pushers and salespeople.
3. The Listener: A good advisor will listen to clients’ fears, tease out the issues driving those feelings, and provide practical, long-term answers.
4. The Teacher: Getting beyond the fear-and-flight phase often is just a matter of teaching investors about risk and return, diversification, the role of asset allocation, and the virtueof discipline.
5. The Architect: Once these lessons are understood, the advisor becomes an architect, building a long-term wealth management strategy that matches each person’s risk appetites and lifetime goals.
6. The Coach: Even when the strategy is in place, doubts and fears inevitably arise. At this point, the advisor becomes a coach, reinforcing
first principles and keeping the client on track.
7. The Guardian: Beyond these experiences is a long-term role for the advisor as a kind of lighthouse keeper, scanning the horizon for issues that may affect the client and keeping them informed.
These are just seven valuable roles an advisor can play in understanding and responding to clients’ whole-of-life needs, which are a world away from the old notions of selling product off the shelf or making forecasts.
Knowing the advisor is independent—and not plugging product—can lead the client to trust the advisor as a listener or sounding board. From this point, the listener can become the teacher, architect, coach, and, ultimately, the guardian. Just as people’s needs and circumstances change over time, the nature of the advice service evolves.
However you characterize these various roles, good financial advice ultimately is defined bythe patient building of a long-term relationship founded on the values of trust and independence and knowledge of each individual.
Now, how can you put a price on that?
The Seven Roles of an AdvisorInsert Firm Logo
Adapted from “The Seven Roles of an Advisor” by Jim Parker, Outside the Flags column, May 2015. Dimensional Fund Advisors LP ("Dimensional") is an investment advisor registered with the Securities and Exchange Commission. Diversification does not eliminate the risk of market loss. There is no guarantee investment strategies will be successful. Past performance is no guarantee of future results. All expressions of opinion are subject to change without notice in reaction to shifting market conditions. This content is provided for informational purposes, and it is not to be construed as an offer, solicitation, recommendation, or endorsement of any particular security, products, or services.
Second Quarter 2015
JGHELLER