jesus javier aranda , sebastian bader * and bengt oelmann
TRANSCRIPT
sensors
Article
Self-Powered Wireless Sensor Using a Pressure FluctuationEnergy Harvester
Jesus Javier Aranda , Sebastian Bader * and Bengt Oelmann
Citation: Aranda, J.J.; Bader, S.;
Oelmann, B. Self-Powered Wireless
Sensor Using a Pressure Fluctuation
Energy Harvester. Sensors 2021, 21,
1546. https://doi.org/10.3390/
s21041546
Academic Editor: Massimo Conti
Received: 26 January 2021
Accepted: 19 February 2021
Published: 23 February 2021
Publisher’s Note: MDPI stays neutral
with regard to jurisdictional claims in
published maps and institutional affil-
iations.
Copyright: © 2021 by the authors.
Licensee MDPI, Basel, Switzerland.
This article is an open access article
distributed under the terms and
conditions of the Creative Commons
Attribution (CC BY) license (https://
creativecommons.org/licenses/by/
4.0/).
Department of Electronics Design, Mid Sweden University, 85170 Sundsvall, Sweden;[email protected] (J.J.A.); [email protected] (B.O.)* Correspondence: [email protected]
Abstract: Condition monitoring devices in hydraulic systems that use batteries or require wiredinfrastructure have drawbacks that affect their installation, maintenance costs, and deploymentflexibility. Energy harvesting technologies can serve as an alternative power supply for systemloads, eliminating batteries and wiring requirements. Despite the interest in pressure fluctuationenergy harvesters, few studies consider end-to-end implementations, especially for cases with low-amplitude pressure fluctuations. This generates a research gap regarding the practical amount ofenergy available to the load under these conditions, as well as interface circuit requirements andtechniques for efficient energy conversion. In this paper, we present a self-powered sensor thatintegrates an energy harvester and a wireless sensing system. The energy harvester converts pressurefluctuations in hydraulic systems into electrical energy using an acoustic resonator, a piezoelectricstack, and an interface circuit. The prototype wireless sensor consists of an industrial pressure sensorand a low-power Bluetooth System-on-chip that samples and wirelessly transmits pressure data. Wepresent a subsystem analysis and a full system implementation that considers hydraulic systemswith pressure fluctuation amplitudes of less than 1 bar and frequencies of less than 300 Hz. The studyexamines the frequency response of the energy harvester, the performance of the interface circuit,and the advantages of using an active power improvement unit adapted for piezoelectric stacks. Weshow that the interface circuit used improves the performance of the energy harvester comparedto previous similar studies, showing more power generation compared to the standard interface.Experimental measurements show that the self-powered sensor system can start up by harvestingenergy from pressure fluctuations with amplitudes starting at 0.2 bar at 200 Hz. It can also sampleand transmit sensor data at a rate of 100 Hz at 0.7 bar at 200 Hz. The system is implemented withoff-the-shelf circuits.
Keywords: energy harvesting; piezoelectric energy harvesting; pressure fluctuation; self-poweredsensor; wireless sensor nodes; integration with wireless sensors
1. Introduction
Energy harvesting from pressure fluctuations in hydraulic systems can enable self-powered wireless sensors. Pressure fluctuations are a by-product of the system operation,often regarded as unwanted acoustic noise, and ubiquitous in the pressurized fluid. Theabatement of this noise is mandatory on all hydraulic machinery since it can cause suchproblems as pipe leakage, the fatigue of mechanical components, and auditory dam-age [1–3]. Several studies have investigated pressure fluctuation energy harvesters (PFEHs)for converting this acoustic energy into electrical power to enable self-powered systems.These studies have mainly focused on the subsystems of the PFEH. For instance, the fluid-to-mechanical interface [4–6], performance improvement through acoustic resonance [7,8],and interface circuits [9] have been investigated. These investigations show that the adop-tion of pressure fluctuation energy harvesting, and consequently self-powered systemsbased on PFEHs, can lead to the elimination of unwanted wired connections and batteries,increasing the flexibility to deploy sensors and reduce maintenance costs.
Sensors 2021, 21, 1546. https://doi.org/10.3390/s21041546 https://www.mdpi.com/journal/sensors

Sensors 2021, 21, 1546 2 of 18
Self-powered wireless sensors can have many applications in industrial contexts. Forexample, excavators, hoists, and other hydraulic machinery often undergo a hydraulicpressure change before a fault occurs. Often, a visual inspection is required to read analoguegauges at various locations on the machine [10]. This can lead to dangerous situations forpersonnel (e.g., high-pressure leaks), machine downtime, and time-consuming rounds ofinspections. PFEHs can increase the deployment flexibility of wireless sensors and enablethe measurement of pressure data without visual inspection. In addition, other applicationssuch as hydraulic motors require temperature, flow, rotation, and pressure readings fromthe system. Wired connections and batteries are not an ideal solution for these types ofmotors, as maintenance or battery replacement can be difficult. Self-powered devices cantransmit sensor data to the main system controller in the pump, where a Bluetooth LowEnergy (BLE) central can be installed [11,12].
The development of PFEH has been of great interest over the last decade, with dif-ferent harvesters and approaches being adapted to different hydraulic environments.Skow et al. [8,9,13] have reported on various PFEHs with multilayer piezoelectric stacksfor low- and high-pressure systems. Their studies focused on the pressure fluctuationgenerated by a hydraulic pump with contributions in the range of 225 Hz to 1000 Hz. Al-though their proposed harvesters report AC power up to 13 mW for a pressure amplitudeof 2 bar, they have not shown any evaluation of the harvester in a fully integrated system.Another PFEH using a piezoelectric stack was reported by [14]. The PFEH was designedwith an amplified stack structure operating in a water system with a static pressure of 2 bar.The authors reported simulated results with an open circuit voltage of 83.6 mV RMS at apressure fluctuation with an amplitude of 0.095 bar and a frequency of 93.19 Hz. However,the study does not investigate a suitable power conditioning solution under these condi-tions. Ren et al. [15] reported an electromagnetic PFEH in a gas environment with pressurefluctuations of 0.4 bar at 20 Hz, showing 1.2 V and 2.0 mW of AC power at a resistiveload. The system was designed for a static pressure of 1 bar. No power conditioning wasspecified. An alternative PFEH device using a flexible diaphragm with a piezoelectric wasdescribed in [16]. The authors reported 0.7 nW AC power for an excitation of 0.003 bar at52 Hz, but no power conditioning or system implementation was discussed.
It is evident that, apart from the studies of Skow et al. the majority of studies onPFEH are tailored to very low static pressures in an attempt to design mechanical resonantmechanical structures. For higher static pressures, which are more common in industrialhydraulic systems, resonant structures are not practical as they may fail due to the highstresses [4,8,16,17]. Compared with the other PFEH designs, the advantages of the PFEHwith multilayer piezoelectric stack, as reported in [4,7,8,14], are the higher static pressurerating and the advantages of the stack for off-resonance energy generation.
Although the literature shows that the development of PFEH is of interest, thereare few studies that address end-to-end implementation, i.e., the development of self-powered devices with PFEH. Indeed, studies of self-powered sensor systems operatingvia energy harvesting of pressure fluctuations are currently limited to proof-of-conceptimplementations at single operating points. In [12], Schwartz et al. evaluated a full sys-tem implementation. They investigated the output power of a PFEH and measured thepower consumption of a commercial wireless sensor system, as well as the feasibility ofenergy-autonomous operation. Their study focused on the operating conditions of anindustrial pump with pressure fluctuations at 225 Hz, 450 Hz and 675 Hz. The system wasoptimized for a dominant pressure fluctuation frequency at 450 Hz with an amplitude ofabout 2 bar. At this excitation, their PFEH implementation produced an output powerof 2.6 mW. Toothman et al. [11] studied a different wireless sensing system under thesame operating conditions. Their work assumed the same output power as determinedby Schwartz et al. and theoretically evaluated the achievable performance of the sensingsystem. Consequently, their study was limited to the same excitation condition, and lossesin the interface circuits were overlooked.

Sensors 2021, 21, 1546 3 of 18
To support the use of PFEH in a wider range of operating conditions, various meth-ods and techniques such as (a) fluid-mechanics interface optimization [6], (b) acousticimpedance matching [7,8], (c) circuit techniques that enable efficient rectification at lowinput voltage [9,18,19], and (d) circuit techniques to increase power generation can be usedto enhance the performance of the PFEH [20–22]. The focus of this work is to propose andevaluate a self-powered wireless pressure sensor (SP-WPS) considering pressure fluctua-tions with amplitudes less than 1 bar at frequencies less than 300 Hz. Systems with loweracoustic power density (lower frequencies and amplitudes) are common in a variety ofindustrial applications [7,9,14], and the lower power density makes obtaining sufficientenergy challenging.
First, we measure the power requirements of the wireless sensor, which consists ofa pressure sensor and a BLE-enabled System on Chip (SoC), and highlight the designtradeoffs for its implementation. Second, we perform an experimental analysis of thefrequency response of the PFEH and show the estimated power and the impact of a res-onator on power generation. Third, we integrate and evaluate the complete system toshow the conditions for system start-up and operation, namely the minimum pressureamplitude and frequency, and the overall performance of the prototype. In addition,we present an analysis of the performance enhancement using a power improvementunit. The study presents the implementation of a self-powered synchronized switch oninductor circuit to improve the power generation performance of the PFEH. Compared topreviously reported self-powered active power improvement units that require integratedcircuit design, complex control techniques [23–26] or high-voltage amplitudes for oper-ation [21,22,27,28], we present a circuit implementation adapted for lower voltages andusing off-the-shelf components.
2. System Design and Implementation
Figure 1 shows the SP-WPS and its subsystems, namely the Energy Harvesting Systemand the Wireless Sensor System (WSS). The energy harvesting system consists of (a) aPFEH to convert pressure fluctuations in hydraulic systems into AC power and (b) aninterface circuit to convert AC power into DC power. The wireless sensor system has twomain components: (a) a hydraulic pressure sensor and (b) a SoC with BLE capabilitiesthat controls the acquisition, processing, and transmission of data. The pressure datatransmitted by the SoC can be read by any BLE-enabled receiver. The SP-WPS is designedto be active only when the hydraulic system is operating, enabled by the SYSEN signal.Pressure fluctuations are a form of noise in hydraulic systems that are constantly presentwhen the main energy source, i.e., the pump, is in operation [1–3]. Long-term energystorage is therefore not included in the proposed system implementation, but it can beadded for other application scenarios if required.
Figure 2 shows the different components of the physical SP-WPS prototype and thegeneral working principle of the PFEH. The PFEH can be connected to any port in ahydraulic system where there is access to hydraulic fluid.

Sensors 2021, 21, 1546 4 of 18
Figure 1. Overview of the self-powered wireless sensor and its subsystems.
Figure 2. (a) Overview of the self-powered wireless sensor detailing the different components.(b) General principle of the pressure fluctuation energy harvester and its components.
2.1. Pressure Fluctuation Energy Harvester
The PFEH converts pressure fluctuations into electrical energy by converting dynamicpressure fluctuations. The characteristics of the pressure fluctuations are directly related tothe operating variables and the design of the pump. Previous works associate the frequencyand amplitude of pressure fluctuations with the static pressure and speed of the mainpump in a system [1–4,7]. In these works, it was reported that the amplitude of the pressurevariation can reach 10% of the static operating pressure.
Considering that the dynamic pressure fluctuations are only a fraction of the staticpressure, the PFEH structure must be able to withstand high-pressure forces and stillcapture the small dynamic pressure fluctuations. In these scenarios, resonant energyharvesters, such as cantilevers, cannot be used [4,23,29,30]. For this reason, a multilayer

Sensors 2021, 21, 1546 5 of 18
stack of lead zirconate titanate (PZT) is used in this work. This transducer has shown highcompressive strength, superior off-resonance performance, and higher static capacitancecompared to other transducers [4,31]. The PZT stack converts mechanical force intoelectrical energy through the direct piezoelectric effect. The open circuit voltage generatedis given by
Vp =d∗33Fsin(ωt)
Cp. (1)
where d∗33 is the effective piezoelectric coefficient, F is the force amplitude, and Cp is thecapacitance of the piezoelectric stack [31]. The force compressing the PZT stack resultsfrom the pressure fluctuations acting on the fluid-to-mechanical interface, a thin metalplate connecting the stack to the fluid, as shown in Figure 2.
The fluid-to-mechanical interface converts pressure fluctuations into axial mechanicalforce and protects the stack from the fluid. The interface is installed between two stainlesssteel housings. Both the static pressure and the amplitude of the pressure fluctuations areconsidered in the design of the fluid-mechanical interface. The diameter and thicknessof the plate are based on the operating characteristics of the hydraulic system. A largerdiameter may result in higher power generation, but it may compromise the integrity ofthe PZT by increasing the static pressure force. The force transmission ratio describes theratio of pressure to force that a fluid interface can achieve. In [4–6], the authors reportedpressure-to-force transfer ratios ranging from 0.5 to 0.9, depending on the design, material,and dimensions of the fluid-mechanical interface.
Recent studies have shown that adding an acoustic resonator or compliant struc-ture can significantly increase the power generation of an acoustic energy harvester [32].In hydraulic systems where compliant systems are not feasible due to high static pres-sure [7,8,32], acoustic resonators can increase power generation without increasing thestatic load on the transducers. For example, Helmholtz Resonator, have shown pressurefluctuation amplification for frequencies greater than 450 Hz [8] and SCR [7] with goodamplification performance in the range of 200 Hz to 1000 Hz. The gain is a function ofthe design material, volume, frequency, and hydraulic fluid properties [7]. Space-coiledstructures are of great interest for hydraulic applications and energy harvesting of acousticnoise in air due to their improved acoustic amplification performance [7,32–34]. In thisstudy, a SCR is used to improve the performance of the PFEH for frequencies below 300 Hzto avoid excessive static compressive forces on the transducer (without increasing thefluid-to-mechanical interface area). The design of the SCR is made possible by 3D printingtechniques that allow the design and fabrication of more complex geometries [7]. TheSCR is an acoustic resonator based on the classical Helmholtz resonator. Compared to theHelmholtz Resonator, the SCR can provide better performance at lower frequencies withthe same volume constraints, i.e., it can resonate at lower frequencies without increasingthe volume of the resonator. Essentially, the SCR benefits from a long neck and widerneck opening, which improves acoustic gain due to lower narrow-neck losses and enablesthe design of compact structures [7,8,32]. The SCR allows the transmission of pressurefluctuations from the fluid in the hydraulic system to a small chamber where the interfacebetween the fluid and the stack is installed. Figure 2b shows the main working principle ofthe PFEH and the SCR.
The theoretical effective AC power that can be generated by the PFEH without inter-face circuit, can be estimated by
PAC =π f CpV2
p√2
. (2)
According to [31], up to 70% of effective AC power can be delivered to a matched re-sistive load without power improvement circuits. However, in a real system, the DC powerthat can be delivered to a load depends on the performance of the PFEH in combination

Sensors 2021, 21, 1546 6 of 18
with the interface circuitry, i.e., the performance of the rectifier, the power improvementcircuit, and the efficiency of the power management unit (PMU).
2.2. Interface Circuit
Since embedded systems cannot employ AC power to operate, proper power rectifica-tion and conditioning is required. The interface circuit rectifies, stores, and manages theAC power generated by the piezoelectric transducer. As depicted in Figure 1, the interfacecircuit comprises a power improvement unit (PIU), a rectifier circuit, and a PMU. Figure 3shows a schematic of the circuit implementation in this work. The circuit consists mainly of(a) Parallel Synchronized Switch Harvesting in Inductor (PSSHI) as a power improvementunit; (b) voltage doubler for rectification; (c) PMU with system capacitors and load switchto disconnected the system load from the interface circuit; and (d) wireless SoC (NRF52840)and sensor system.
Figure 3. Schematic of the self-powered wireless pressure sensor system.
Since no long-term energy storage is used in this implementation, the interface circuitmust convert enough AC to DC power to meet the minimum requirements for self-poweredoperation. This limitation is mainly dictated by the PMU, which requires a minimum DCvoltage (Vcs
DC) and power (PcsDC) to start. The system load, i.e., the wireless sensor system,
does not consume power until the PMU reaches a predetermined voltage.A voltage doubler is used for rectification. This topology facilitates the start of the
PMU by providing a step-up to reach the minimum VcsDC. Furthermore, preliminary work
shows the improvement of the voltage doubler over other passive topologies such as thefull-wave bridge rectifier [35]. In addition, the voltage doubler enables the use of the PSSHIas PIU. The PSSHI is a circuit technique that increases power by inverting the voltageacross the piezoelectric transducer at each voltage peak by inducing a resonant circuitformed by the internal capacitance of the PZT stack (Cp) and an external inductor (Lp). Inthis way, the circuit can harvest the energy that would otherwise be lost when charging theinternal capacitance of the piezoelectric [20,23,24,36]. Voltage inversion is achieved by twoanalog switches (SW1 and SW2) that are activated at each voltage peak. The switches arecontrolled by two peak detectors implemented with low-power comparators and simplelogic gates, as shown in Figure 3.
The low-power comparators (Comp1 and Comp2) detect the difference between thevoltage Vp+ and Vp− and the signal modified by the RC circuit. The Nout signal drives afrequency divider that generates the clock signal to control the analog switches of the PSSHI.When one of the switches is closed, a resonant network is created between the stack (Cp)

Sensors 2021, 21, 1546 7 of 18
and the inductor (Lp), causing a voltage inversion. After the inversion, the reverse currentis stopped by the diode (Dp1 or Dp2) [27]. In practice, the voltage inversion efficiency andpower generation improvement is a function of frequency, open circuit voltage, diodevoltage drop, and peak detection accuracy [20,27,35,37]. This circuit implementation is asimple control technique that can improve the power generation of the PFEH. However,it deviates from the ideal PSSHI technique due to the voltage drop of the diode in theinversion network and the delay introduced by the peak detection implementation.
Figure 4 shows the waveforms for the operation of the voltage doubler in combinationwith the PSSHI. The operating frequency is 200 Hz with an open circuit voltage Vp ≈ 0.7 V.The figures show the estimated current generated by the stack due to the pressure fluctua-tions, the output of the logic gate (Nout), the clock signal (CLK), the voltage across the stackVp−p, and the output voltage (VDC) supplied to the power management unit.
Figure 4. Waveforms of the voltage doubler and parallel synchronized switch on inductor duringoperation at 200 Hz.
We have implemented the PSSHI circuit using low-power, off-the-shelf components,which enables low-power design and implementation in low-volume applications. In thisimplementation, low impedance analog switches (Texas Instruments TS3A4741) and apassive inductor are used. The diodes used are the CTS05S30. Compared to previouslyreported circuit implementations of the PSSHI for stack-based energy harvesters (e.g., [22]),we have focused particularly on a design that operates at low voltages. The PSSHI is anactive, self-powered PIU, which starts operating after the PMU is fully started. Figure 3shows the voltage doubler, the PSSHI circuit implementation, and the control circuit. Previ-ous implementations of the PSSHI have focused on harvesting vibrational energy usingcantilevers, which are typically operated at resonance. These types of transducers gener-ally produce large open circuit voltage amplitudes. Common implementations of PSSHIcontrol circuits for these cases consist of digital controls that can be very power hungry(up to 1 mW) [26]; bipolar transistor switches which require large voltage amplitudes foroperation (typically > 1 V) [20,22,38]; or integrated circuits that, despite their low inputvoltage requirements, can become costly for low-volume applications.
Sensors 2021, 21, 1546 8 of 18
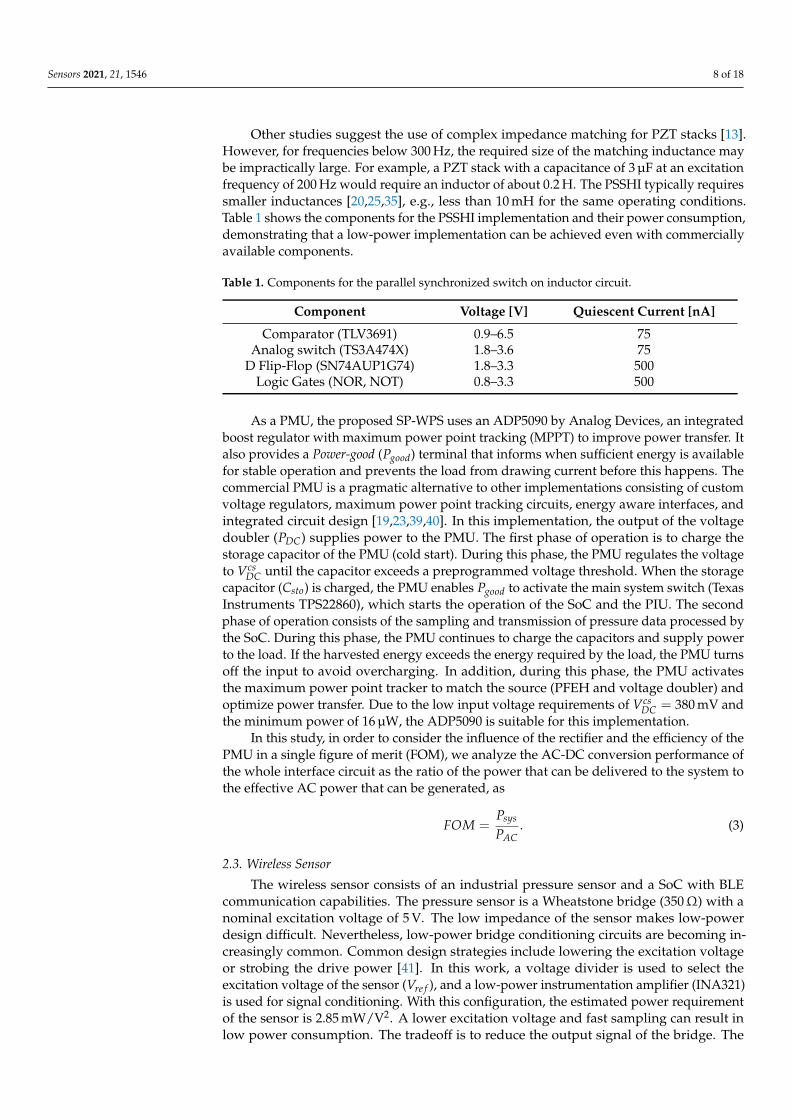
Other studies suggest the use of complex impedance matching for PZT stacks [13].However, for frequencies below 300 Hz, the required size of the matching inductance maybe impractically large. For example, a PZT stack with a capacitance of 3 µF at an excitationfrequency of 200 Hz would require an inductor of about 0.2 H. The PSSHI typically requiressmaller inductances [20,25,35], e.g., less than 10 mH for the same operating conditions.Table 1 shows the components for the PSSHI implementation and their power consumption,demonstrating that a low-power implementation can be achieved even with commerciallyavailable components.
Table 1. Components for the parallel synchronized switch on inductor circuit.
Component Voltage [V] Quiescent Current [nA]
Comparator (TLV3691) 0.9–6.5 75Analog switch (TS3A474X) 1.8–3.6 75
D Flip-Flop (SN74AUP1G74) 1.8–3.3 500Logic Gates (NOR, NOT) 0.8–3.3 500
As a PMU, the proposed SP-WPS uses an ADP5090 by Analog Devices, an integratedboost regulator with maximum power point tracking (MPPT) to improve power transfer. Italso provides a Power-good (Pgood) terminal that informs when sufficient energy is availablefor stable operation and prevents the load from drawing current before this happens. Thecommercial PMU is a pragmatic alternative to other implementations consisting of customvoltage regulators, maximum power point tracking circuits, energy aware interfaces, andintegrated circuit design [19,23,39,40]. In this implementation, the output of the voltagedoubler (PDC) supplies power to the PMU. The first phase of operation is to charge thestorage capacitor of the PMU (cold start). During this phase, the PMU regulates the voltageto Vcs
DC until the capacitor exceeds a preprogrammed voltage threshold. When the storagecapacitor (Csto) is charged, the PMU enables Pgood to activate the main system switch (TexasInstruments TPS22860), which starts the operation of the SoC and the PIU. The secondphase of operation consists of the sampling and transmission of pressure data processed bythe SoC. During this phase, the PMU continues to charge the capacitors and supply powerto the load. If the harvested energy exceeds the energy required by the load, the PMU turnsoff the input to avoid overcharging. In addition, during this phase, the PMU activatesthe maximum power point tracker to match the source (PFEH and voltage doubler) andoptimize power transfer. Due to the low input voltage requirements of Vcs
DC = 380 mV andthe minimum power of 16 µW, the ADP5090 is suitable for this implementation.
In this study, in order to consider the influence of the rectifier and the efficiency of thePMU in a single figure of merit (FOM), we analyze the AC-DC conversion performance ofthe whole interface circuit as the ratio of the power that can be delivered to the system tothe effective AC power that can be generated, as
FOM =Psys
PAC. (3)
2.3. Wireless Sensor
The wireless sensor consists of an industrial pressure sensor and a SoC with BLEcommunication capabilities. The pressure sensor is a Wheatstone bridge (350Ω) with anominal excitation voltage of 5 V. The low impedance of the sensor makes low-powerdesign difficult. Nevertheless, low-power bridge conditioning circuits are becoming in-creasingly common. Common design strategies include lowering the excitation voltageor strobing the drive power [41]. In this work, a voltage divider is used to select theexcitation voltage of the sensor (Vre f ), and a low-power instrumentation amplifier (INA321)is used for signal conditioning. With this configuration, the estimated power requirementof the sensor is 2.85 mW/V2. A lower excitation voltage and fast sampling can result inlow power consumption. The tradeoff is to reduce the output signal of the bridge. The

Sensors 2021, 21, 1546 9 of 18
reduced drive voltage produces a correspondingly reduced bridge signal, reducing thesignal-to-noise ratio [41]. The sensing performance tradeoff is application dependent, andsoftware and circuit strategies can further optimize low-power operation [42–44].
The WSS uses the NRF52840 SoC to activate, read, and transmit pressure sensor dataat fixed intervals via non-connectable advertisement packages (advertising-only mode)and characteristic notification packets (connectable mode). Figure 3 shows the schematicconfiguration of the WSS and components. With this configuration, any BLE-enableddevice can receive the pressure data and perform additional operations or upload theinformation to a server. After system initialization (first phase of operation), the SoC startssampling and reading the sensor data at a fixed interval. For connected mode, the SoCbegins sampling and sending pressure data after the system connects to a BLE-enableddevice. The NRF52840 processes these events in a sequence with predefined timers. First,the NRF52840 wakes up at a predefined time before a radio event and activates the sensorand its conditioning circuitry. After a small delay, the ADC samples and processes the data.After the data transmission, the NRF52840 goes back to idle-mode.
3. Methods3.1. Experimental Setup and Prototype
In order to evaluate the PFEH in a controlled environment and investigate its responseto different excitation characteristics, this study employs an apparatus that can reproducethe working conditions of a hydraulic system. The experimental setup can generate custompressure fluctuation signals in a small volume of fluid (ISO VG-32) with a linear actuator.Pressure fluctuations can be generated with frequencies up to kHz, and static pressurecan be set manually. Pressure is monitored by pressure sensors (PCB 113B26, Honeywellmodel S). Figure 5 shows the diagram of the apparatus used in this work, and more detailsabout it can be found in [45].
Figure 5. Apparatus for the exploration of the pressure fluctuation energy harvester [45].
The PFEH prototype consists of a 3D-printed nylon SCR, a commercial multi-layerpiezoelectric stack, and a fluid-to-mechanical interface. The resonator and stack are en-closed in a metal housing as shown in Figure 2. The properties of the multi-layer piezo-electric stack (ThorLabs PK4FYP2) used in the PFEH are shown in Table 2. The fluid-to-mechanical interface is a stainless steel plate with a diameter of 16 mm and a thickness of50 µm. Figure 6 shows a picture of the prototype.
Table 2. Properties of PK4FYP2 multilayer piezoelectric stack.
Property Value
Cp 3.5 ± %15 µFd∗33 ≈240 nC N−1
Resonant Frequency 34 kHz

Sensors 2021, 21, 1546 10 of 18
Figure 6. Picture of the system and its components.
3.2. System Evaluation
The evaluation of the SP-WPS consists of three analyses. In the first analysis, weexperimentally measure the power consumption of the WSS using a Power AnalyzerN6705C and an MSOX3024T oscilloscope during sensor sampling, wireless transmission,and idle-mode for a Vsys = 3.3 V. This analysis allows the elaboration of a power profile ofthe WSS operation.
In the second analysis, the frequency response of the PFEH is studied for a sweptsinusoidal pressure signal in the range of 25 Hz to 300 Hz. The static pressure is set to35 bar. We measure the piezoelectric voltage Vp with an oscilloscope and calculate thetheoretical effective AC power that can be obtained at each frequency using (2). Thismeasurement shows the influence of the resonator and the estimated harvested AC powergiven the pressure fluctuation amplitude.
The third analysis evaluates the performance of the complete SP-WPS for pressurefluctuations with amplitudes in the range of 0.2 bar to 0.8 bar at 200 Hz. These characteris-tics correspond to the expected operating environment of a commercial hydraulic motorwith low-speed and high-torque [7]. We measure the power at the PMU (Psys) and, basedon the energy demand of the WSS measured in the first analysis, estimate the achievablesampling rate of the system. In addition, we calculate the FOM describing the performanceof the system to show the difference between power generation with and without PIU for arange of excitations.
4. Results and Discussions4.1. Wireless Sensor Power Consumption
Figures 7 and 8 show the power profiles of the wireless sensor for the “advertising-only” and “connectable” modes, respectively. The energy consumption in the figuresare the energy costs for performing the task once (in one cycle of operation). The powerprofiles show the different events for an operating voltage of 3.3 V. The system in idle modeconsumes on average 13 µW. The energy required for sampling and data processing is6.9 µJ, which is about one-fourth of the energy required for data transmission in advertising-only mode. For the connectable mode, the energy required for data transmission (12.3 µJ)is comparable to the energy required for sensor sampling, and less than half of the energyrequired for radio transmission in advertising-only mode (28 µJ). The SoC limits thesampling rate to about 8 Hz for the advertising-only mode and 100 Hz for the connectablemode. So, the connectable mode has lower power consumption and faster sampling rates.However, the energy required to connect the SoC to a BLE-enabled central device can be upto a few milli-joules, resulting in a significant startup delay. Advertising-only mode doesnot require a connection event. In this mode, the system can start sampling and sendingsensor data without waiting for a BLE-enabled device to connect.

Sensors 2021, 21, 1546 11 of 18
Figure 7. Power profile for the sensor sampling and BLE communication for the advertising-onlymode. The calculated energy is for one cycle of operation.
Figure 8. Power profile for the sensor sampling and BLE communication for the connectable mode.The calculated energy is for one cycle of operation.
The measurements consider the excitation voltage of the sensor (Vre f ) at 1 V, whichhas been selected based on a trade-off between sensing accuracy and energy consumption.As was previously discussed, there exist different software and hardware techniques, suchas oversampling and noise shaping [42], power strobing [41], sampling and hold and turnon optimization [43], and custom interfaces for Wheatstone-bridge based sensors [44] thatcan overcome the challenges of low-energy sensing.
4.2. Frequency Response and Power Estimation
Figure 9 shows the frequency response detailing the measured open circuit voltage(Vp) and the calculated AC power (PAC) as a function of the pressure amplitude obtainedfrom the PFEH under sinusoidal excitation. The SCR shows resonance at about 200 Hz,increasing both the open-circuit voltage and PAC. Indeed, considerable gain is observedin the 125 Hz to 250 Hz region. Thus, the SCR can enhance the power generation over arelatively wide bandwidth and in different scenarios. Due to the high resonant frequency ofthe piezoelectric stack of about 34 kHz, without the SCR the PFEH would have a constantopen-circuit voltage even at higher frequencies, and the power would only increase linearlywith frequency [7,31].
Figure 9 suggests that a pressure amplitude of 0.1 bar is sufficient to generate enoughpower to start the PMU. However, the AC-DC conversion involves losses and minimumoperating requirements that may affect system performance. For full system integration, itmust be taken into account that the PFEH in combination with the rectifier has a differentpower optimum at different excitation. Therefore, the PMU must utilize the MPPT toimprove power transfer and provide sufficient power to the load for continuous operation.

Sensors 2021, 21, 1546 12 of 18
Figure 9. (a) Frequency response of the system. (b) Estimated average AC power as a function ofpressure amplitude.
4.3. Full System Implementation Analysis
Table 3 shows the comparison between the characteristics of the interface circuitused in our SP-WPS implementation and other relevant studies, both with piezoelectriccantilevers and stacks. A commonly used metric to compare the performance of theinterface circuit for piezoelectric energy harvesters is to obtain the ratio of DC power(Psys) obtained after the interface circuit and the power that can be obtained with anideal full-wave bridge rectifier (improvement = Psys(Cp f V2
p )−1) [25,46]. For the cases of
cantilever energy harvesters using PSSHI, the most common approaches for self-poweredoperation are to use switches based on bipolar junction transistors (BJT) or integratedcircuits. BJT switches are constrained to a minimum input voltage for operation, i.e.,the voltage generated by the transducer must be greater than the forward voltage of thediodes and the saturation voltage of the transistors in the inversion network. Even foroptimized structures that have demonstrated operation at Vp > 1V, their performance ispoor at low input voltages [20–22,38]. PSSHI with digital controls and integrated circuitsolutions have also been reported for piezoelectric cantilevers and generally show the bestimprovement. Although studies show PSSHI operation at very low input voltages withgood performance (up to 4.75 times compared to the full-wave bridge rectifier) [19], thereare no reports of circuits for piezoelectric stacks. In addition, integrated circuit designfor low-volume implementations can be costly. For piezoelectric stacks, Liu et-al. [22]reported a factor of around 1.7 improvement for low frequencies (1.5 Hz to 2.3 Hz) andlarge input voltages (around 20 V) using a PSSHI with BJT switches. Skow et al. reporteda voltage multiplier with impedance matching (additional indutance) showing a 4.8-foldimprovement. However, for systems with lower frequencies of pressure fluctuations,impedance matching may not be feasible due to the size of the inductor required [13].The table shows that, compared to the other PSSHIs for piezoelectric stacks operatingoutside resonance, our proposed interface circuit has comparable performance, requiresonly single-supply voltage comparators, and can operate at a lower Vp.

Sensors 2021, 21, 1546 13 of 18
Table 3. Interface circuit performance comparison to other relevant studies.
Reference [22] [19] [9] [26] [47] [18] [35] This Work
Transducer Amplified Stack MEMS Stack Stack Cantilever Cantilever Cantilever Stack
Capacitance 2.1 uF 2 nF 1.9 uF 661 nF 18 nF 30 nF 110 nF 3 uF
Technique PSSHI SSH Impedance matching PSSHI PSSHI PSSHI PSSHI PSSHI
Control Circuit BJT switch Digital - Digital Comparator Mosfet Comparator Comparator
Type ofImplementation
Discrete CMOS 180 nm Discrete Digital Discrete Discrete Off-the-shelf Off-the-shelf
Open CircuitVoltage (Vp)
20 V 1.12 V 0.27 V - 2.4 V 0.28–0.7 V 5 V 0.6–1.36 V
Frequency 1.5 Hz–2.3 Hz 317 Hz 450 Hz 18.7 Hz 225 Hz 100 Hz 112 Hz 200 Hz
Self-Powered Yes Yes - Yes Yes Yes No Yes
ImprovementPsys( f CpV2
p)−1
1.7 4.75 4.8 - 5.8 - 1.2 1–2
Details - - Multiplier - - - - -
OperationMode
Off-resonance Resonance Off-resonance Resonance Resonance Resonance Resonance Off-resonance
DC-DC orPower Management
No Yes No Yes No No No Yes

Sensors 2021, 21, 1546 14 of 18
4.4. Evaluation of the Self-Powered Sensor System
To investigate the impact of available power on WSS operation, we calculate theachievable sampling rates as a function of the pressure fluctuation amplitude. This studyconsiders the entire system, including the harvester, interface circuit, and load. First,we calculate the FOM according to Equation (3) for the system with and without PIU,and the results are shown in Figure 10. For the lower range of pressure fluctuationamplitudes, the performance metric is less than 0.2, showing that a considerable amountof energy is lost in rectification and voltage boosting. For larger pressure fluctuationamplitudes, for the scenario without PIU, the FOM settles at about 0.33, showing thedifficulty of efficiently extracting energy from the transducer without PIU. With PIU, thepower increases significantly with increasing pressure fluctuation amplitude, reaching aFOM of 1 at about 0.8 bar. However, the performance at lower pressure amplitude (<0.4 bar)is limited and even drops below the performance without PIU.
0.2 0.3 0.4 0.5 0.6 0.7 0.8
Pressure Amplitude [bar]
0.2
0.4
0.6
0.8
1.0
FO
M
NO PIU
PIU
Figure 10. Performance of the system showing the figure of metric for the AC-DC conversion andthe impact of the power improvement unit.
Figure 11 shows the measured DC power Psys of the overall system at increasing pres-sure fluctuation amplitudes for a frequency of 200 Hz, as well as the calculated achievablesampling rate with the current program implementation. The figure shows that the systemstarts with as low as 0.2 bar (Vp ≈ 0.35 V), with an achievable sampling rate of approxi-mately 0.5 Hz for advertising-only mode and 1.2 Hz for the connectable mode. The PIUimpact is notable from 0.35 bar (Vp ≈ 0.6 V) and shows significant improvement at increas-ing amplitudes compared to the case without PIU. It achieves up to 3-fold improvementin the range of higher pressure fluctuation amplitudes. At about 0.4 bar (Vp ≈ 0.68 V), thesystem exceeds the required power to reach the maximum sampling rate for the advertising-only mode, which means that the system can allow higher sensor excitation, more sensorsamples, or higher radio transmission power as amplitudes continue to increase. For pres-sure fluctuations with an amplitude of about 0.7 bar (Vp ≈ 1.2 V), the system can sampleand transmit pressure data at a rate of nearly 100 Hz, the maximum sampling rate forthe connectable mode. Further optimization of the PMU and PSSHI, particularly in thelower range of excitation, can improve overall performance and enable higher samplingrates. Table 4 shows a comparison of the performance and operating range of the proposedself-powered wireless sensor and the results of previous proposed solutions [11,12].

Sensors 2021, 21, 1546 15 of 18
100
101
Ad
vert
isin
g-on
lyM
od
e
0.2 0.3 0.4 0.5 0.6 0.7 0.8
Pressure Amplitude [bar]
10−1
100
DC
Pow
er[m
W]
Max Sample Rate
Max Sample Rate
No PIU
PIU 100
101
102
Con
nec
tab
leM
od
e
Sam
ple
Fre
qu
ency
[Hz]
Figure 11. Measured DC power of the system and estimated sampling frequency.
Table 4. Comparison of self-powered wireless sensors for hydraulic systems.
Source MinimumPressure [bar]
HarvestedPower [mW]
OperatingFrequency [Hz] Sensors Sampling Rate [Hz] Wireless
Technology
[11] 2 2.6 450 Pressure andtemperature
- BLE
[12] 2 2.6 450 Pressure andtemperature
333 2.4 GHz ISM
This Work 0.2 0.02–2.4 200 Pressure up to 8:Advertising-Onlyup to 100:connected
BLE
The PFEH performed well in the scenario studied, but some limitations should benoted. First, the PFEH was investigated with harmonic pressure signals. In real hydraulicenvironments, the pressure fluctuations may have more frequency components and varyin frequency over time [1,2]. This can lead to challenging scenarios, for example: (a) theresonant frequency of the SCR is fixed by design, limiting the operation of the PFEH tothe gain band offered by the resonator. Changes in the frequency of pressure fluctuationscan drop the performance of the PFEH and thus the impact of the sensor’s predefinedtransmission interval, and (b) the performance of the PSSHI may be affected by noiseand other frequency contributions. Therefore, the next studies may address software orhardware implementations such as those presented in [39] to adjust the sensor transmissioninterval depending on the harvested energy levels. Moreover, the control circuit of thePSSHI and the power management circuit can be optimized to automatically adapt to theenvironment. Second, the system is designed for static pressures of less than 50 bar. Higherstatic pressures can damage the interface and piezoelectric transducer. For higher staticpressures, the size of the fluid-to-mechanical interface and transducer should be revised towithstand higher compression forces.
5. Conclusions
This paper presented the design, development, and evaluation of a self-powered wire-less pressure sensor, focusing on low amplitude and frequency excitation. We calculated theenergy required for sampling and wireless data advertising of a commercial pressure sensorand achieved an energy cost of 34.9 µJ and 19.2 µJ per sample for the advertising-only andconnected modes, respectively. Experimental measurements of the prototype implemen-tation show that the self-powered system can start with as low as 0.2 bar (Vp ≈ 0.35 V) ofpressure amplitude at a frequency of 200 Hz. The system has its highest power output at the

Sensors 2021, 21, 1546 16 of 18
resonance of the acoustic resonator used by the harvesting device, which is approximately200 Hz. At this frequency, the pressure fluctuation energy harvester generates enoughenergy to provide the maximum sampling rate of about 100 Hz for a system with pressurefluctuations having an amplitude of about 0.7 bar (Vp ≈ 1.2 V). The self-powered wirelesspressure sensor is designed assuming a standard hydraulic environment where pressurefluctuations are present whenever the host system is operating, and is not intended forintermittent energy harvesting that requires long-term energy buffering.
The system evaluation showed improvement in power generation, even at low ex-citation, with a parallel switch on inductor power improvement circuit employing onlyoff-the-shelf circuits. The simple design of the power improvement unit allows its optimiza-tion for different operating ranges and a simple implementation. However, experimentalmeasurements show that the PIU does not provide performance improvement for pressurefluctuations with amplitudes smaller than 0.35 bar and may even reduce the performancebelow this point. The operating range of the PSSHI is limited by the voltage drop of thediodes in the inversion network and the performance of the circuit that generates thecontrol signals.
Self-powered wireless devices can minimize the use of wired connections, preventmaintenance in high-risk environments, and reduce operational costs. Taken together, theresults show that our proposed system design succeeds in extending the operating rangeof current power conditioning circuits for pressure fluctuation energy harvesters to lowexcitation applications, thus filling the identified research gap. We have highlighted thedesign requirements and end-to-end implementation challenges. For example, the role ofthe space coiling resonator in power enhancement; the advantages of combining a voltagedoubler and power improvement circuit to enable operation at low input excitation; and thefeasibility of an interface circuit including a commercial power management unit for coldstart, voltage regulation, and management of power generated by the pressure fluctuationenergy harvester. Our study demonstrates the practicality of self-powered wireless sensorsfor condition monitoring in hydraulic applications and provides a framework that can beused as a basis for developing these devices.
Author Contributions: Conceptualization, J.J.A.; Formal Analysis, J.J.A.; Visualization, J.J.A.; writing—original draft preparation, J.J.A.; writing—review and editing, J.J.A., S.B. and B.O.; supervision, S.B.and B.O. All authors have read and agreed to the published version of the manuscript.
Funding: This research was funded by the Knowledge Foundation under grant NIIT 20180170.
Conflicts of Interest: The authors declare no conflicts of interest. The funders had no role in thedesign of the study; in the collection, analyses, or interpretation of data; in the writing of themanuscript, or in the decision to publish the results.
References1. Freitas, F. The Generation and Transmission of Pressure Fluctuations in Pump Suction Lines. Ph.D. Thesis, University of Bath,
Bath, UK, 1982.2. Wang, K.; Zhang, Z.; Xia, C.; Liu, Z. Experimental Investigation of Pressure Fluctuation, Vibration, and Noise in a Multistage
Pump. Shock Vib. 2018, 2018, 1–13. [CrossRef]3. Ericson, L. On Fluid Power Pump and Motor Design: Tools for Noise Reduction. Ph.D. Thesis, Linköping University, Linköping,
Sweden, 2012.4. Cunefare, K.A.; Verma, N.; Erturk, A.; Skow, E.; Savor, J.; Cacan, M. Energy Harvesting from Hydraulic Pressure Fluctuations; ASME
SMASIS: Atlanta, GA, USA, 2012;5. Aranda, J.J.; Bader, S.; Oelmann, B. Force Transmission Interfaces for Pressure Fluctuation Energy Harvesters; IEEE IECON: Washington,
DC, USA, 2018; pp. 4230–4235. [CrossRef]6. Xiao, H.; Qie, H.; Bowen, C.R. Modelling of the circular edge-clamped interface of a hydraulic pressure energy harvester to
determine power, efficiency and bandwidth. MSSP 2021, 146, 107013. [CrossRef]7. Aranda, J.J.; Bader, S.; Oelmann, B. A space-coiling resonator for improved energy harvesting in fluid power systems. Sens.
Actuator A Phys. 2019, 291, 58–67. [CrossRef]8. Skow, E.; Cunefare, K.; Koontz, Z. Pressure ripple amplification within a hydraulic pressure energy harvester via Helmholtz
resonator. J. Acoust. Soc. Am. 2015, 138, 1769–1769. [CrossRef]

Sensors 2021, 21, 1546 17 of 18
9. Skow, E.; Leadenham, S.; Cunefare, K.A.; Erturk, A. Power conditioning for low-voltage piezoelectric stack energy harvesters.Proc. SPIE 2016, 9799, 97990P. [CrossRef]
10. Swedberg, C. Stauff Markets RFID-Based Hydraulic Pressure Measurement System. Available online: https://www.rfidjournal.com/stauff-markets-rfid-based-hydraulic-pressure-measurement-system (accessed on 23 February 2021).
11. Toothman, M.F.; Ting, E.; Skow, E.; Cunefare, K.A. Multifunctional Self-Powered Hydraulic System Sensor Node; SPIE Sensors andSmart Structures Technologies: Denver, CO, USA, 2018. [CrossRef]
12. Schwartz, F.J.; Skow, E.A.; Erturk, A.; Cunefare, K.A. Energy Harvesting from Acoustic Fields for Self-Powered Sensors in Pumped FluidSystems; SPIE: Portland, OR, USA, 2017. [CrossRef]
13. Skow, E.A.; Cunefare, K.A.; Erturk, A. Power performance improvements for high pressure ripple energy harvesting. SmartMater. Struct. 2014, 23, 104011. [CrossRef]
14. Cao, D.X.; Duan, X.J.; Guo, X.Y.; Lai, S.K. Design and performance enhancement of a force-amplified piezoelectric stack energyharvester under pressure fluctuations in hydraulic pipeline systems. Sens. Actuators A Phys. 2020, 309, 112031. [CrossRef]
15. Ren, H.; Wang, T. Development and modeling of an electromagnetic energy harvester from pressure fluctuations. Mechatronics2018, 49, 36–45. [CrossRef]
16. Wang, D.A.; Chao, C.W.; Chen, J.H. A miniature hydro-energy generator based on pressure fluctuation in Kármán vortex street. J.Intell. Mater. Syst. Struct. 2012, 24, 612–626. [CrossRef]
17. Mo, C.; Radziemski, L.J.; Clark, W.W. Analysis of piezoelectric circular diaphragm energy harvesters for use in a pressurefluctuating system. Smart Mater. Struct. 2010, 19, 025016. [CrossRef]
18. Edla, M.; Lim, Y.Y.; Deguchi, M.; Padilla, R.V.; Izadgoshasb, I. An Improved Self-Powered H-Bridge Circuit for VoltageRectification of Piezoelectric Energy Harvesting System. IEEE J. Electron Devices Soc. 2020, 8, 1050–1062. [CrossRef]
19. Chamanian, S.; Muhtaroglu, A.; Kulah, H. A Self-Adapting Synchronized-Switch Interface Circuit for Piezoelectric EnergyHarvesters. IEEE Trans. Power Electron. 2020, 35, 901–912. [CrossRef]
20. Shu, Y.C.; Lien, I.C.; Wu, W.J. An improved analysis of the SSHI interface in piezoelectric energy harvesting. Smart Mater. Struct.2007, 16, 2253–2264. [CrossRef]
21. Liu, W.; Badel, A.; Formosa, F.; Zhu, Q.; Zhao, C.; Hu, G. A Comprehensive Analysis and Modeling of the Self-PoweredSynchronous Switching Harvesting Circuit With Electronic Breakers. IEEE Trans. Ind. Electron. 2018, 65, 3899–3909. [CrossRef]
22. Liu, H.; Hua, R.; Lu, Y.; Wang, Y.; Salman, E.; Liang, J. Boosting the efficiency of a footstep piezoelectric-stack energy harvesterusing the synchronized switch technology. J. Intell. Mat. Syst. 2019. [CrossRef]
23. Covaci, C.; Gontean, A. Piezoelectric Energy Harvesting Solutions: A Review. Sensors 2020, 20, 3512. [CrossRef]24. Dell Anna, F.; Dong, T.; Li, P.; Wen, Y.; Yang, Z.; Casu, M.R.; Azadmehr, M.; Berg, Y. State-of-the-Art Power Management Circuits
for Piezoelectric Energy Harvesters. IEEE Circ. Syst. Mag. 2018, 18, 27–48. [CrossRef]25. Ramadass, Y.K.; Chandrakasan, A.P. An efficient piezoelectric energy harvesting interface circuit using a bias-flip rectifier and
shared inductor. IEEE J. Solid State Circ. 2010. [CrossRef]26. Hara, Y.; Saito, K.; Makihara, K. Compact, digital and self-powered piezoelectric vibration energy harvester with generation
control using voltage measurement circuit. Sens. Actuators A Phys. 2019, 299, 111609. [CrossRef]27. Liang, J.; Liao, W. Improved Design and Analysis of Self-Powered Synchronized Switch Interface Circuit for Piezoelectric Energy
Harvesting Systems. IEEE Trans. Ind. Electron 2012, 59, 1950–1960. [CrossRef]28. Tabesh, A.; Frechette, L.G. A Low-Power Stand-Alone Adaptive Circuit for Harvesting Energy From a Piezoelectric Micropower
Generator. IEEE Trans. Ind. Electron 2010, 57, 840–849. [CrossRef]29. Zhao, S.; Erturk, A. Energy harvesting from harmonic and noise excitation of multilayer piezoelectric stacks: modeling and
experiment. In Active and Passive Smart Structures and Integrated Systems 2013; SPIE: San Diego, CA, USA, 2013. [CrossRef]30. Safaei, M.; Sodano, H.A.; Anton, S.R. A review of energy harvesting using piezoelectric materials: state-of-the-art a decade later
(2008–2018). Smart Mater. Struct. 2019, 28, 113001. [CrossRef]31. Xu, T.B.; Siochi, E.J.; Kang, J.H.; Zuo, L.; Zhou, W.; Tang, X.; Jiang, X. Energy harvesting using a PZT ceramic multilayer stack.
Smart Mater. Struct. 2013. [CrossRef]32. Yuan, M.; Cao, Z.; Luo, J.; Chou, X. Recent Developments of Acoustic Energy Harvesting: A Review. Micromachines 2019, 10, 48.
[CrossRef] [PubMed]33. Yuan, M.; Cao, Z.; Luo, J.; Pang, Z. Helix structure for low frequency acoustic energy harvesting. Rev. Sci. Instruments 2018,
89, 055002. [CrossRef]34. Sun, K.H.; Kim, J.E.; Kim, J.; Song, K. Sound energy harvesting using a doubly coiled-up acoustic metamaterial cavity. Smart
Mater. Struct. 2017, 26, 075011. [CrossRef]35. Kushino, Y.; Koizumi, H. Piezoelectric Energy Harvesting Circuit Using Full-Wave Voltage Doubler Rectifier and Switched Inductor;
IEEE ECCE: Pittsburgh, PA, USA, 2014; pp. 2310–2315.36. Do, X.; Ko, Y.; Nguyen, H.; Le, H.; Lee, S. An Efficient Parallel SSHI Rectifier for Piezoelectric Energy Scavenging Systems; ICACT:
Gangwon, Korea, 2011; pp. 1394–1397.37. Liang, J.; Chung, H.S.H.; Liao, W.H. Dielectric loss against piezoelectric power harvesting. Smart Mater. Struct. 2014, 23, 092001.
[CrossRef]38. Shi, G.; Xia, Y.; Ye, Y.; Qian, L.; Li, Q. An efficient self-powered synchronous electric charge extraction interface circuit for
piezoelectric energy harvesting systems. J. Intell. Mater. Syst. Struct. 2016, 27, 2160–2178. [CrossRef]

Sensors 2021, 21, 1546 18 of 18
39. Chew, Z.J.; Ruan, T.; Zhu, M. Power Management Circuit for Wireless Sensor Nodes Powered by Energy Harvesting: On theSynergy of Harvester and Load. IEEE Trans. Power Electron. 2019, 34, 8671–8681. [CrossRef]
40. Chew, Z.J.; Zhu, M. Adaptive Self-Configurable Rectifier for Extended Operating Range of Piezoelectric Energy Harvesting.IEEE Trans. Ind. Electron. 2020, 67, 3267–3276. [CrossRef]
41. Dobkin, B. Analog Circuit and System Design: A Tutorial Guide to Applications and Solutions; Elsevier/Newnes: Boston, MA, USA,2011.
42. Aziz, P.; Sorensen, H.; Van der Spiegel, J. An Overview of Sigma-Delta Converters: How a 1-bit ADC achieves more than 16-bitresolution. IEEE Signal Process. Mag. 1996, 13, 61–84. [CrossRef]
43. Walid, A.; Ismail, A.H. A 14-Bit Low-Power Interface Circuit for Piezo-Resistive Pressure Sensors; ICM: Casablanca, Morocco, 2015;pp. 166–169.
44. Yurish, S. A Simple and Universal Resistive-Bridge Sensors Interface. Sens. Transducers. 2011, 10, 46–59.45. Aranda, J.J.; Bader, S.; Oelmann, B. An Apparatus for the Performance Estimation of Pressure Fluctuation Energy Harvesters.
IEEE Trans. Instrum. Meas 2018, 67, 2705–2713. [CrossRef]46. Krihely, N.; Ben-Yaakov, S. Self-Contained Resonant Rectifier for Piezoelectric Sources Under Variable Mechanical Excitation.
IEEE Trans. Power Electron. 2011, 26, 612–621. [CrossRef]47. Lu, S.; Boussaid, F. A Highly Efficient P-SSHI Rectifier for Piezoelectric Energy Harvesting. IEEE Trans. Power Electron. 2015,
30, 5364–5369. [CrossRef]