japanese facts on car demand & others
TRANSCRIPT

Vehicle Kilometer
Traveled (VKT)
Trip length
# of trips
Population
# of HH Size of HH
Aging
Child reduction
Marriage Age
Driver attribution
GDP
Income distribution
Gas price Fare
# of cars
# of license holders
Size of car
Total distance of expressway
Trend of all modes
Household (HH)
Economic
Infrastructure
Car ownership
more
more
more
more
more more
Clickable, move to figure
Japanese Facts on Car Demand & others
Tetsuro HYODO Professor, Tokyo University of Marine Science and Technology
more
more
contact address
Tentative working
hypothesis
Car demand
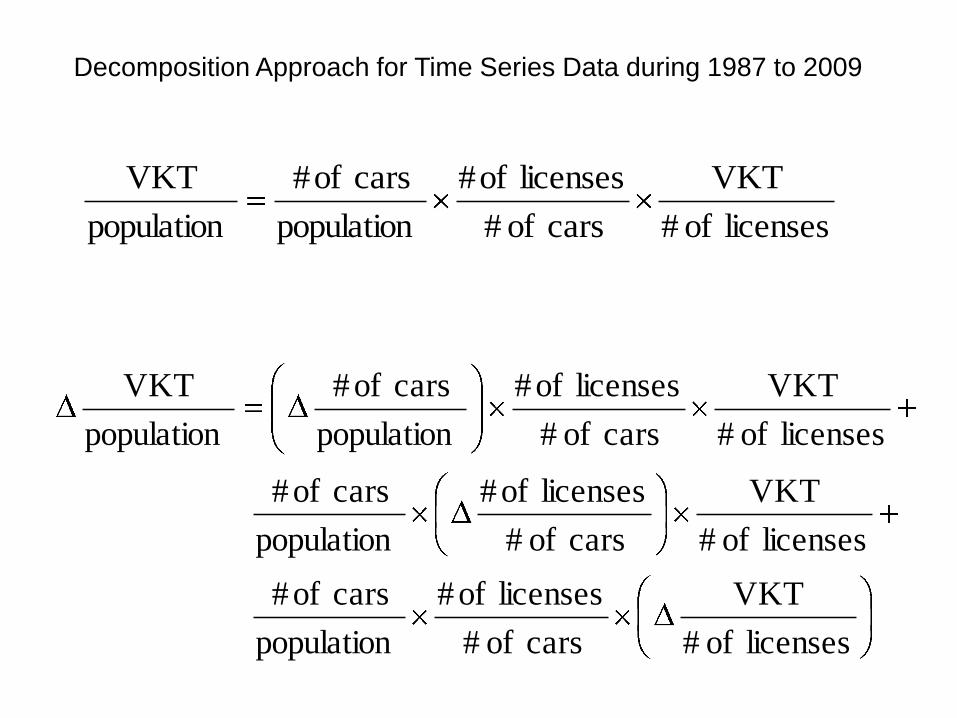
licenses of #
VKT
cars of #
licenses of#
population
cars of#
population
VKT
Decomposition Approach for Time Series Data during 1987 to 2009
licenses of #
VKT
cars of #
licenses of#
population
cars of#
licenses of #
VKT
cars of #
licenses of#
population
cars of#
licenses of #
VKT
cars of #
licenses of#
population
cars of#
population
VKT

licenses of #
VKT
cars of #
licenses of#
population
cars of#
population
VKT
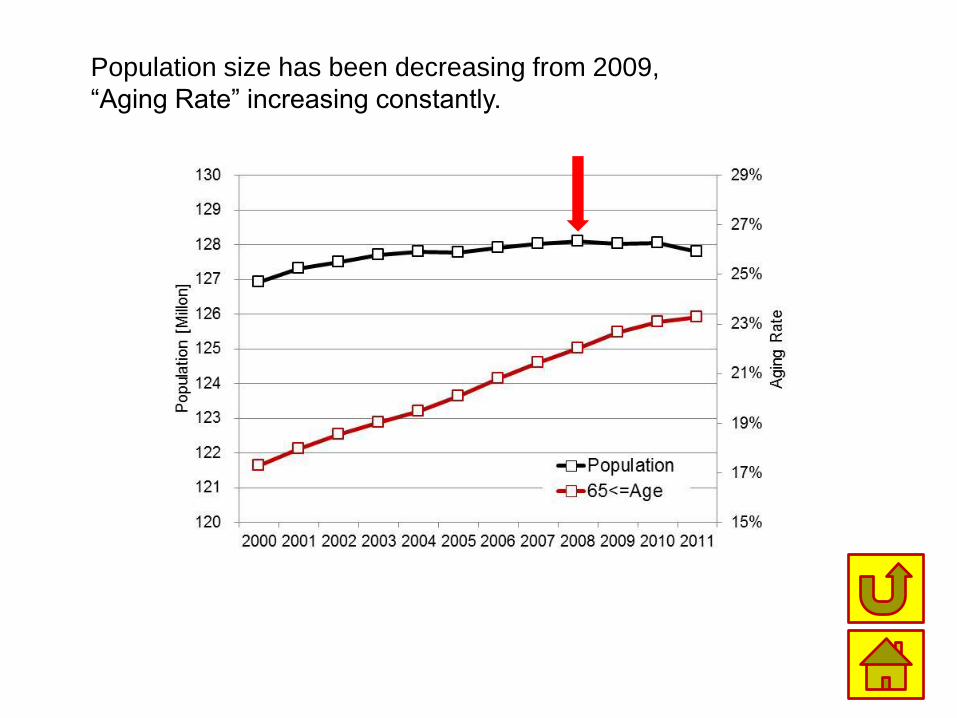
Population size has been decreasing from 2009,
“Aging Rate” increasing constantly.
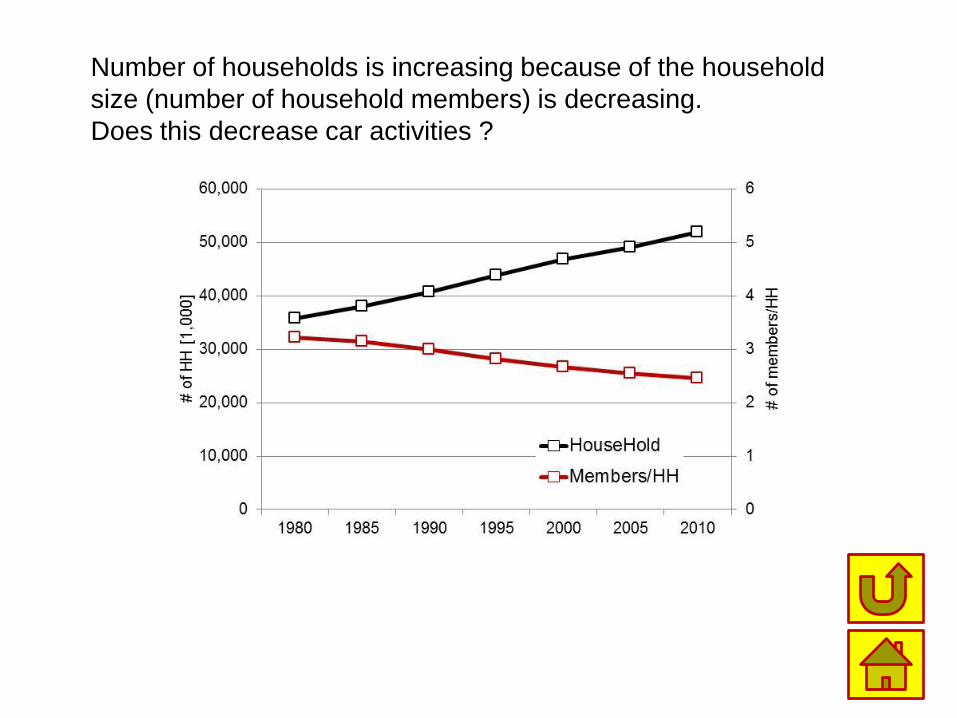
Number of households is increasing because of the household
size (number of household members) is decreasing.
Does this decrease car activities ?

Increase of average marriage age causes reduction of number of
child, car activities, reduction of car sales market…
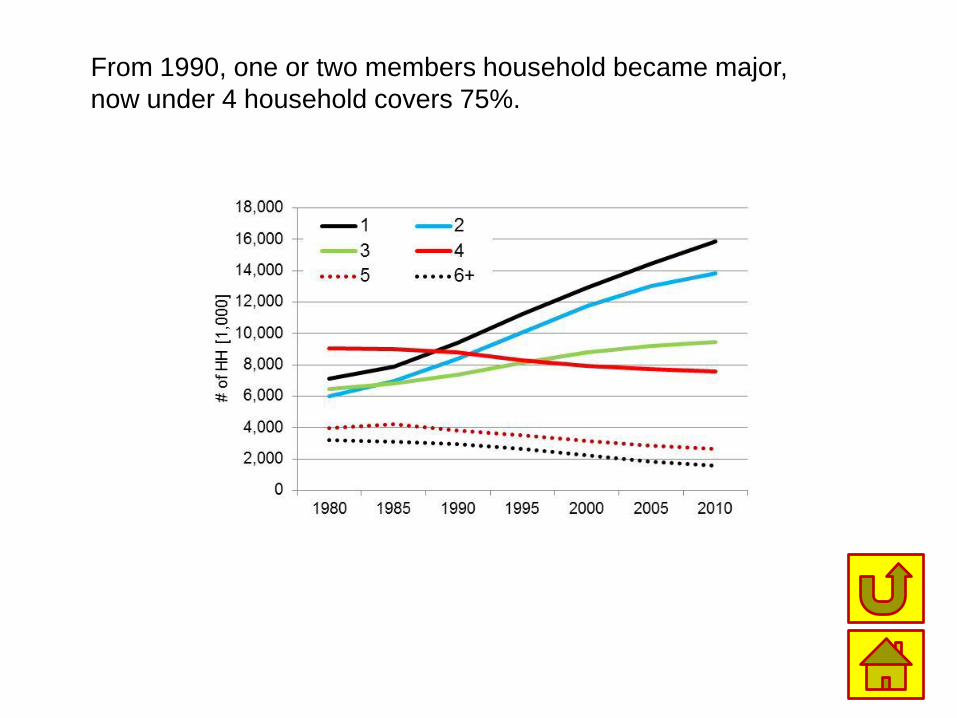
From 1990, one or two members household became major,
now under 4 household covers 75%.
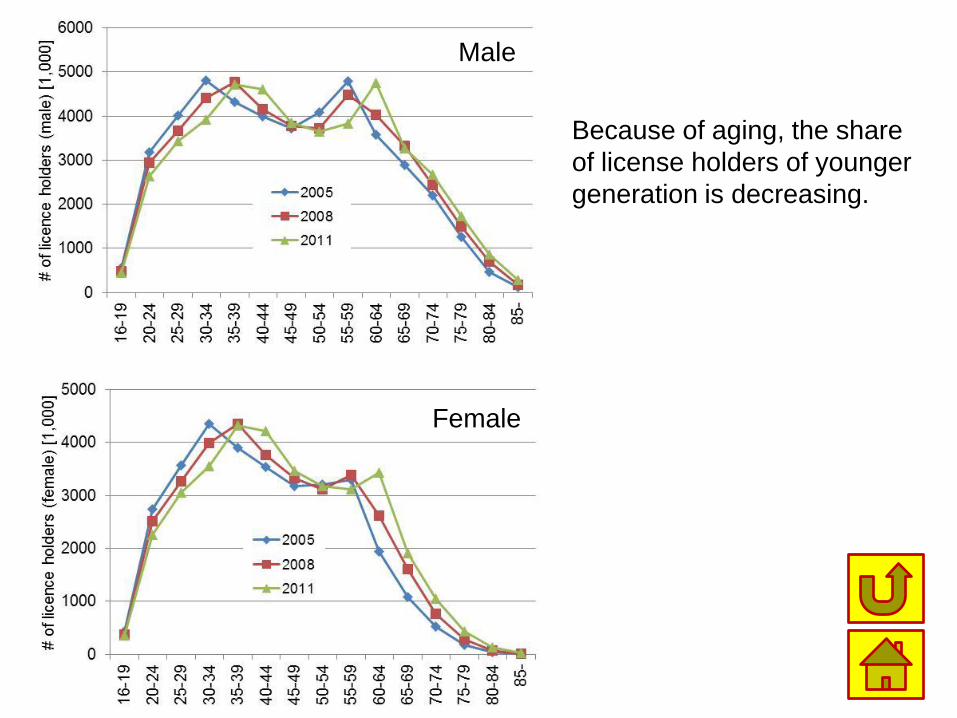
Because of aging, the share
of license holders of younger
generation is decreasing.
Male
Female

Number of cars has already saturated, however,
small size vehicle share is increasing because of
efficient & low price, and increase of female drivers
“Downsizing”
(“Small car”: engine displacement is under 660 cc)

Vehicle Kilometers Traveled (VKT) has been
apparently decreasing from 2004, simultaneously
downsizing occurred.
(“Small car”: engine displacement is under 660 cc)
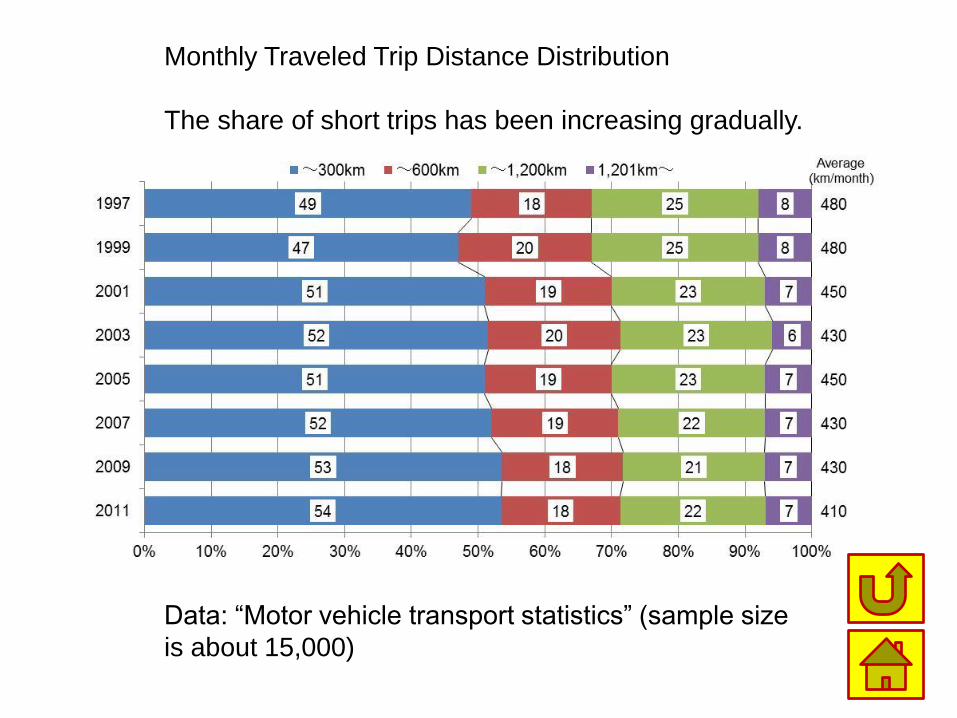
Monthly Traveled Trip Distance Distribution
The share of short trips has been increasing gradually.
Data: “Motor vehicle transport statistics” (sample size
is about 15,000)

Low economic growth rate and high level of gas price
were one of the major reasons for shrinking car activities.

Low income, especially increasing low income people
causes car demand reduction

The share of short trip had been increasing, however,
it was decreased in 2010.
Data: “Road Traffic Census” (sampling rate is about 3% of car owners)
Trip distance distribution on a weekday

The share of elder drivers is dramatically increasing,
young drivers (20 or 30 years old male drivers) decreasing
Share of characteristics of each car’s driver Data: “Road Traffic Census” (sampling rate is about 3% of car owners)

Male
Female
Female young drivers is decreasing dramatically. Data: “Road Traffic Census” (sampling rate is about 3% of car owners)
Characteristics of each car’s driver
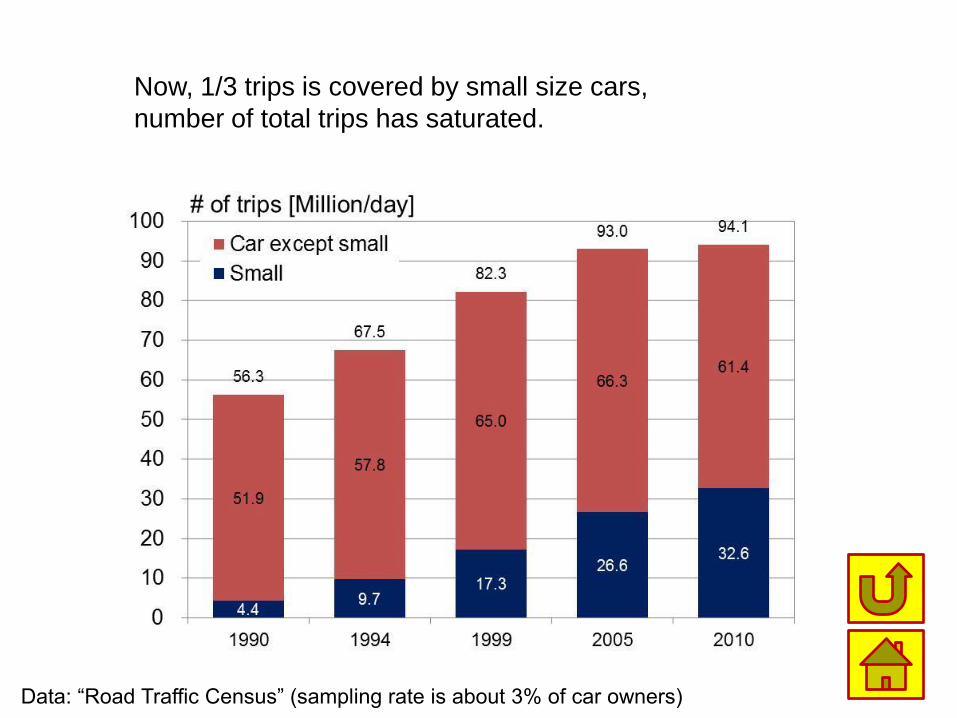
Now, 1/3 trips is covered by small size cars,
number of total trips has saturated.
Data: “Road Traffic Census” (sampling rate is about 3% of car owners)

Average trip distance of small cars is shorter than others,
however, it has been increasing. Small car is not “additive
car”, alternates medium or large size car ?
Data: “Road Traffic Census” (sampling rate is about 3% of car owners)

Because of difference of main purpose of car usage, female’s
number of trips is greater than male.
Data: “Road Traffic Census” (sampling rate is about 3% of car owners)
Result in 2010 survey

Because of difference of main purpose of car usage, male’s
average trip length is greater than male.
Data: “Road Traffic Census” (sampling rate is about 3% of car owners)
Result in 2010 survey

Amount of passenger kilometers of all modes peaked out
from 2004.

Number of
passengers
Average trip
length
Amount of
passenger
kilometers
*
||

Projection of future population in Japan.
How to keep our activities under the hyper-aging society…

24
Transition of License Holders by age license holder ratio(%)
0
20
40
60
80
100
16-19 20-24
25-29 30-34
35-39 40-44
45-49 50-54
55-59 60-64
65-69 70-
1980 1990
2000
2005
0%
20%
40%
60%
80%
100%
16-19 20-24
25-29 30-34
35-39 40-44
45-49 50-54
55-59 60-64
65-69 70-
1980
1990 2000 2005
(male) (female)

Delaying marriage
Falling birthrate
Aging
Decreasing income
Low economic
growth
Vehicle downsizing
Shrinkage of HH size
Decreasing trip length
Decreasing VKT
Social environment
Saturating # of trips
Urbanization ?
Gas price ?
# of license
holders ?
Tentative working hypothesis for discussion
01 02
03
04
05 06 07
08 09
10 11
12 13 14
15
16
A-1
A-3
A-2
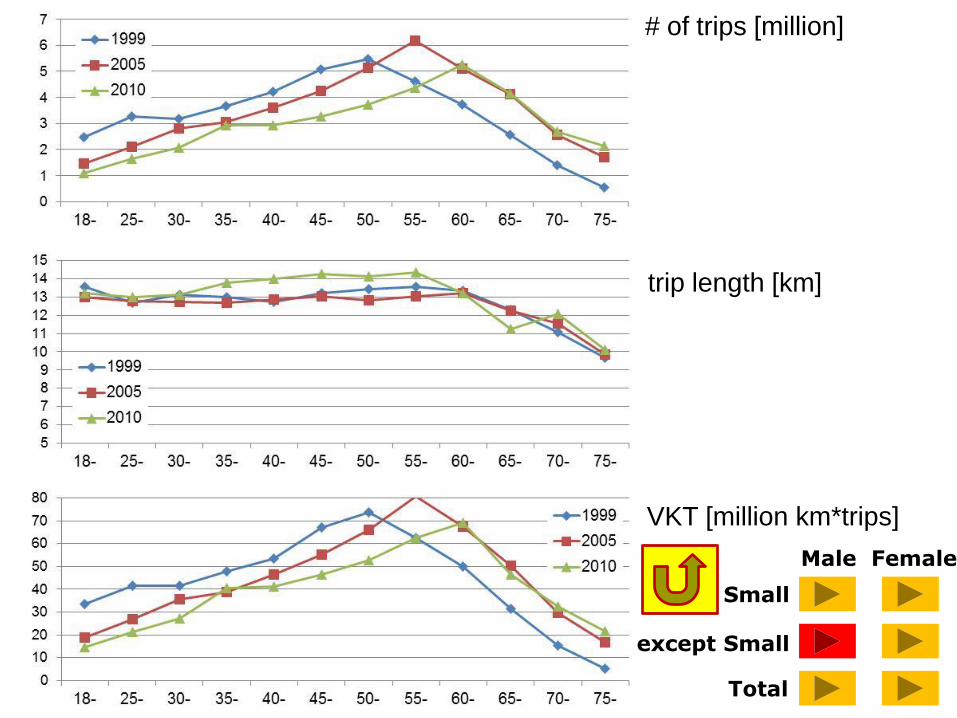
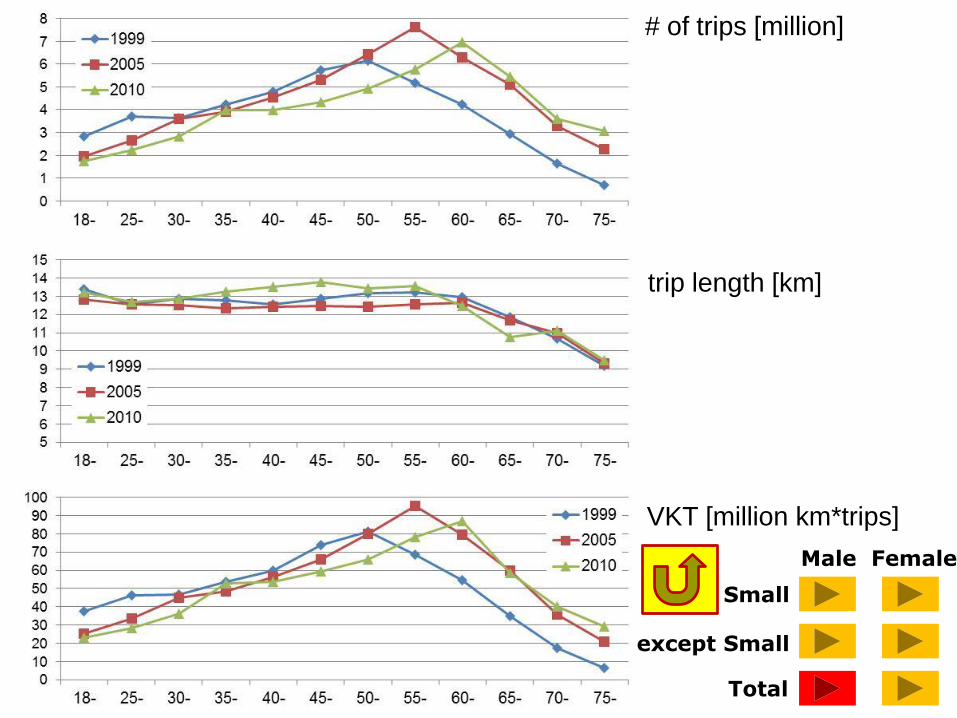
VKT by sex, vehicle size, year

# of trips [million]
trip length [km]
VKT [million km*trips]
Small
except Small
Total
Male Female

# of trips [million]
trip length [km]
VKT [million km*trips]
Small
except Small
Total
Male Female
# of trips [million]
trip length [km]
VKT [million km*trips]
Small
except Small
Total
Male Female

# of trips [million]
trip length [km]
VKT [million km*trips]
Small
except Small
Total
Male Female
# of trips [million]
trip length [km]
VKT [million km*trips]
Small
except Small
Total
Male Female

# of trips [million]
trip length [km]
VKT [million km*trips]
Small
except Small
Total
Male Female

Tetsuro HYODO [email protected]
Tokyo University of Marine Science and Technology Dept. of Logistics and Information Engineering
2-1-6, Etchujima, Koto-ku, Tokyo #135-8533, JAPAN