japan-10: shinano-gawa japan-11: tone-gawa japan-12: yodo … · prefectures of shiga, kyoto,...
TRANSCRIPT
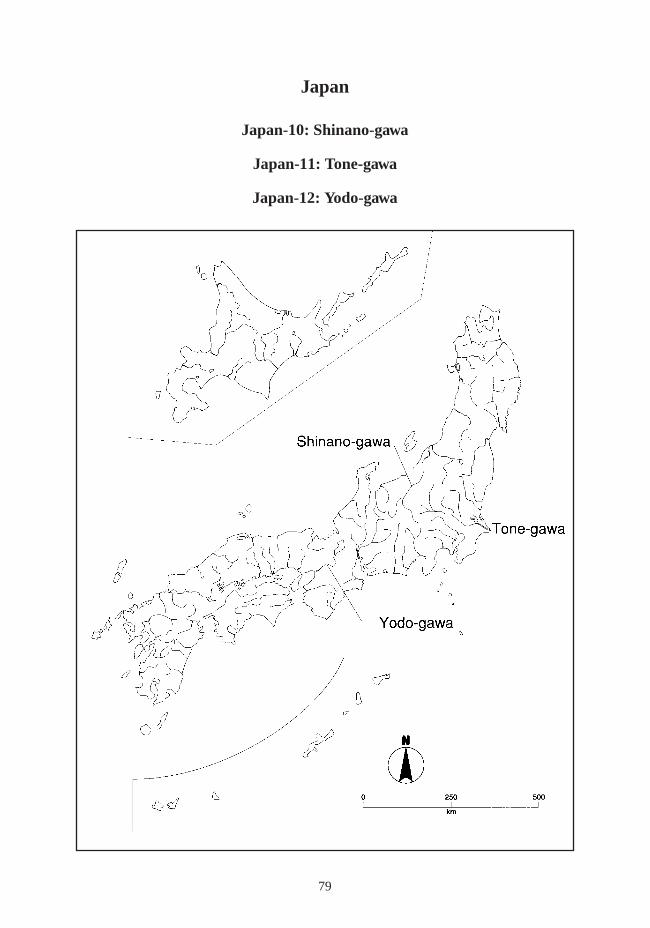
Japan
Japan-10: Shinano-gawa
Japan-11: Tone-gawa
Japan-12: Yodo-gawa
79
80
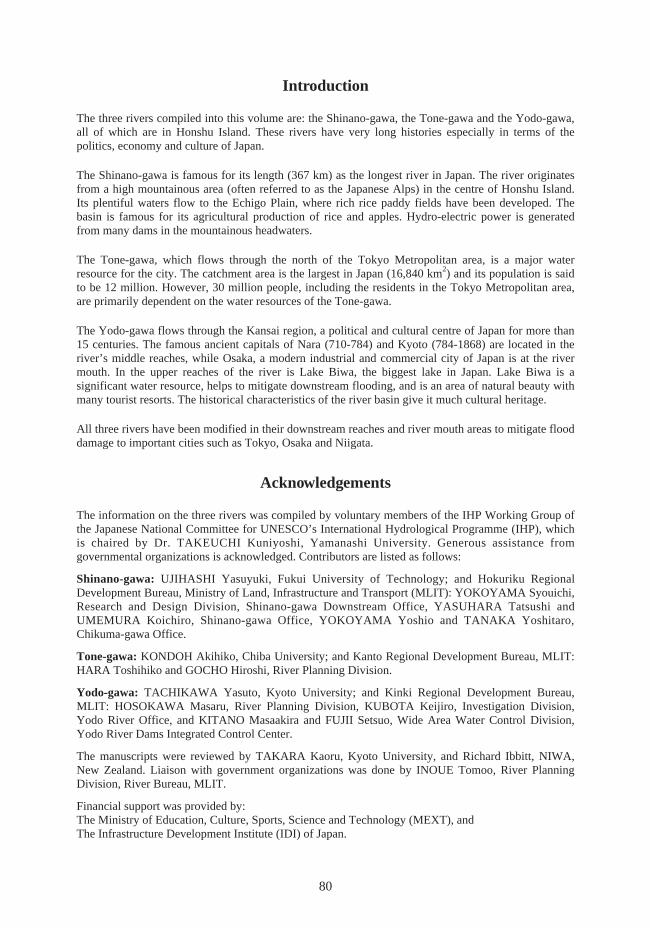
Introduction
The three rivers compiled into this volume are: the Shinano-gawa, the Tone-gawa and the Yodo-gawa,all of which are in Honshu Island. These rivers have very long histories especially in terms of thepolitics, economy and culture of Japan.
The Shinano-gawa is famous for its length (367 km) as the longest river in Japan. The river originatesfrom a high mountainous area (often referred to as the Japanese Alps) in the centre of Honshu Island.Its plentiful waters flow to the Echigo Plain, where rich rice paddy fields have been developed. Thebasin is famous for its agricultural production of rice and apples. Hydro-electric power is generatedfrom many dams in the mountainous headwaters.
The Tone-gawa, which flows through the north of the Tokyo Metropolitan area, is a major waterresource for the city. The catchment area is the largest in Japan (16,840 km2) and its population is saidto be 12 million. However, 30 million people, including the residents in the Tokyo Metropolitan area,are primarily dependent on the water resources of the Tone-gawa.
The Yodo-gawa flows through the Kansai region, a political and cultural centre of Japan for more than15 centuries. The famous ancient capitals of Nara (710-784) and Kyoto (784-1868) are located in theriver’s middle reaches, while Osaka, a modern industrial and commercial city of Japan is at the rivermouth. In the upper reaches of the river is Lake Biwa, the biggest lake in Japan. Lake Biwa is asignificant water resource, helps to mitigate downstream flooding, and is an area of natural beauty withmany tourist resorts. The historical characteristics of the river basin give it much cultural heritage.
All three rivers have been modified in their downstream reaches and river mouth areas to mitigate flooddamage to important cities such as Tokyo, Osaka and Niigata.
Acknowledgements
The information on the three rivers was compiled by voluntary members of the IHP Working Group ofthe Japanese National Committee for UNESCO’s International Hydrological Programme (IHP), whichis chaired by Dr. TAKEUCHI Kuniyoshi, Yamanashi University. Generous assistance fromgovernmental organizations is acknowledged. Contributors are listed as follows:
Shinano-gawa: UJIHASHI Yasuyuki, Fukui University of Technology; and Hokuriku RegionalDevelopment Bureau, Ministry of Land, Infrastructure and Transport (MLIT): YOKOYAMA Syouichi,Research and Design Division, Shinano-gawa Downstream Office, YASUHARA Tatsushi andUMEMURA Koichiro, Shinano-gawa Office, YOKOYAMA Yoshio and TANAKA Yoshitaro,Chikuma-gawa Office.
Tone-gawa: KONDOH Akihiko, Chiba University; and Kanto Regional Development Bureau, MLIT:HARA Toshihiko and GOCHO Hiroshi, River Planning Division.
Yodo-gawa: TACHIKAWA Yasuto, Kyoto University; and Kinki Regional Development Bureau,MLIT: HOSOKAWA Masaru, River Planning Division, KUBOTA Keijiro, Investigation Division,Yodo River Office, and KITANO Masaakira and FUJII Setsuo, Wide Area Water Control Division,Yodo River Dams Integrated Control Center.
The manuscripts were reviewed by TAKARA Kaoru, Kyoto University, and Richard Ibbitt, NIWA,New Zealand. Liaison with government organizations was done by INOUE Tomoo, River PlanningDivision, River Bureau, MLIT.
Financial support was provided by:The Ministry of Education, Culture, Sports, Science and Technology (MEXT), andThe Infrastructure Development Institute (IDI) of Japan.

110
Japan―12
Yodo-gawa
Map of River
111
Japan―12
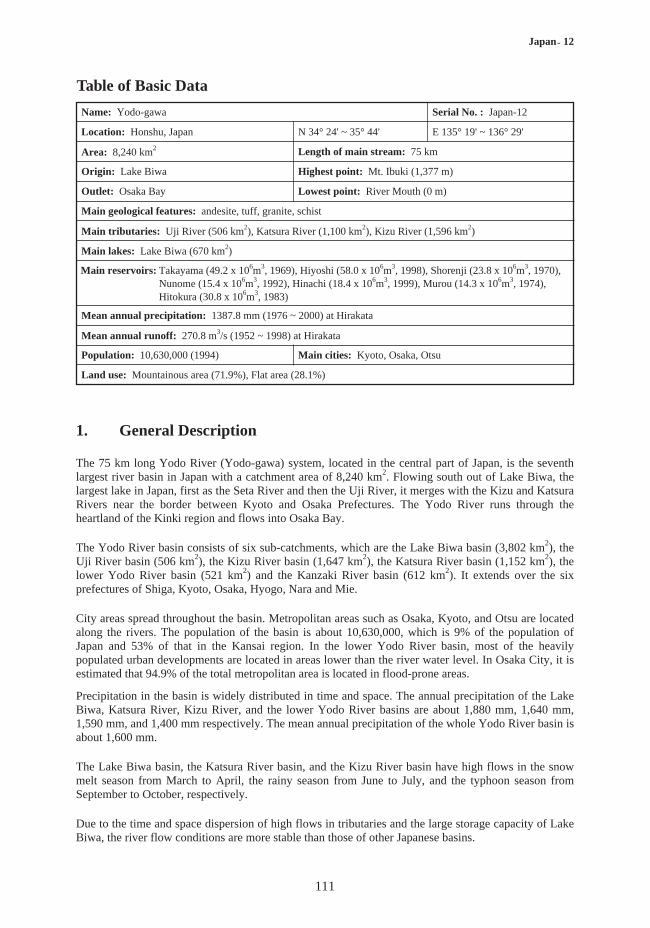
Table of Basic Data
Serial No. : Japan-12
Location: Honshu, Japan
Area: 8,240 km2
Origin: Lake Biwa
Outlet: Osaka Bay
Main geological features: andesite, tuff, granite, schist
Main tributaries: Uji River (506 km2), Katsura River (1,100 km2), Kizu River (1,596 km2)
Main lakes: Lake Biwa (670 km2)
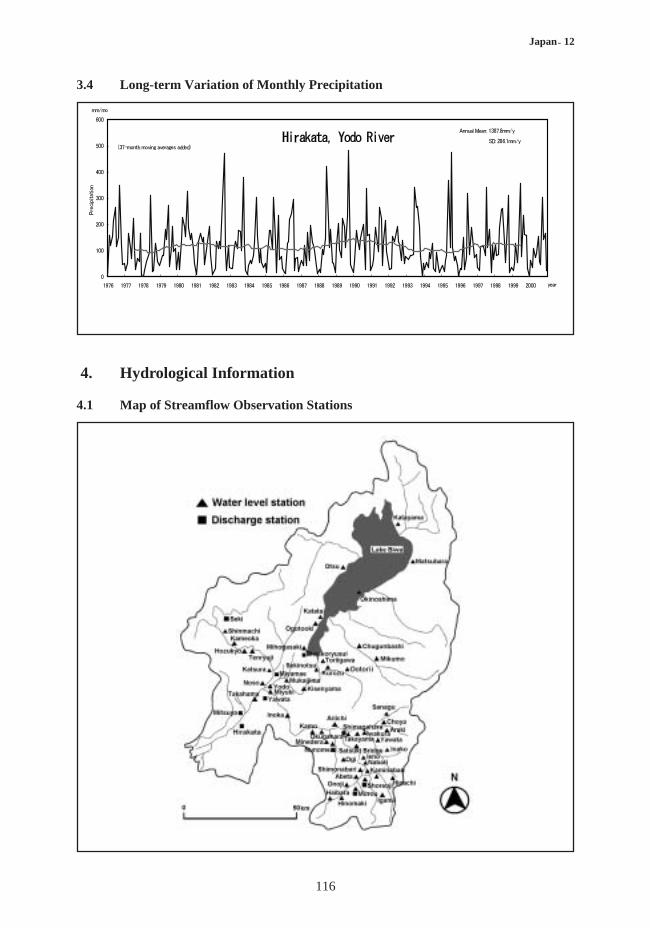
Mean annual precipitation: 1387.8 mm (1976 ~ 2000) at Hirakata
Mean annual runoff: 270.8 m3/s (1952 ~ 1998) at Hirakata
Population: 10,630,000 (1994)
Land use: Mountainous area (71.9%), Flat area (28.1%)
E 135° 19' ~ 136° 29'
Length of main stream: 75 km
Highest point: Mt. Ibuki (1,377 m)
Lowest point: River Mouth (0 m)
N 34° 24' ~ 35° 44'
Main cities: Kyoto, Osaka, Otsu
Name: Yodo-gawa
Main reservoirs: Takayama (49.2 x 10⁶m3, 1969), Hiyoshi (58.0 x 10⁶m3, 1998), Shorenji (23.8 x 10⁶m3, 1970),Nunome (15.4 x 10⁶m3, 1992), Hinachi (18.4 x 10⁶m3, 1999), Murou (14.3 x 10⁶m3, 1974),Hitokura (30.8 x 10⁶m3, 1983)
1. General Description
The 75 km long Yodo River (Yodo-gawa) system, located in the central part of Japan, is the seventhlargest river basin in Japan with a catchment area of 8,240 km2. Flowing south out of Lake Biwa, thelargest lake in Japan, first as the Seta River and then the Uji River, it merges with the Kizu and KatsuraRivers near the border between Kyoto and Osaka Prefectures. The Yodo River runs through theheartland of the Kinki region and flows into Osaka Bay.
The Yodo River basin consists of six sub-catchments, which are the Lake Biwa basin (3,802 km2), theUji River basin (506 km2), the Kizu River basin (1,647 km2), the Katsura River basin (1,152 km2), thelower Yodo River basin (521 km2) and the Kanzaki River basin (612 km2). It extends over the sixprefectures of Shiga, Kyoto, Osaka, Hyogo, Nara and Mie.
City areas spread throughout the basin. Metropolitan areas such as Osaka, Kyoto, and Otsu are locatedalong the rivers. The population of the basin is about 10,630,000, which is 9% of the population ofJapan and 53% of that in the Kansai region. In the lower Yodo River basin, most of the heavilypopulated urban developments are located in areas lower than the river water level. In Osaka City, it isestimated that 94.9% of the total metropolitan area is located in flood-prone areas.
Precipitation in the basin is widely distributed in time and space. The annual precipitation of the LakeBiwa, Katsura River, Kizu River, and the lower Yodo River basins are about 1,880 mm, 1,640 mm,1,590 mm, and 1,400 mm respectively. The mean annual precipitation of the whole Yodo River basin isabout 1,600 mm.
The Lake Biwa basin, the Katsura River basin, and the Kizu River basin have high flows in the snowmelt season from March to April, the rainy season from June to July, and the typhoon season fromSeptember to October, respectively.
Due to the time and space dispersion of high flows in tributaries and the large storage capacity of LakeBiwa, the river flow conditions are more stable than those of other Japanese basins.

112
Japan―12
2. Geographical Information
2.1 Geological Map

113
Japan―12
2.2 Land Use Map
No.
1
Name of river
Yodo(Main river)
Length [km]Catchment area
[km2]
37231
Highest peak [m]Lowest point [m]
Sekidougaoka 680River mouth 0
Citiespopulation
Osaka2,607,700
Land use[%]
M 71.9
F 28.1
2Biwa(Lake)
-3,802
Mt. Ibuki 1,377Outlet 80.8
Otsu289,601
3Uji
(Tributary)38506
Mt. Shubu 681Confluence 19.0
Uji191,122
4Katsura
(Tributary)114
1,100Mt. Jizou 948
Confluence 17.7Kyoto
1,467,521
5Kizu
(Tributary)99
1,596Mt. Kuroso 1,038Confluence 15.8
Ueno59,765
6Kanzaki
(Tributary)13612
Mt. Keno 785River mouth 0
Osaka2,607,700
M: Mountainous area F: Flat area
2.3 Characteristics of River and Main Tributaries

114
Japan―12
2.4 Longitudinal Profiles
3. Climatological Information
3.1 Annual Isohyetal Map and Observation Stations
115
Japan―12
No.2)
60051
60131
60216
53112
61271
61286
62051
62046 Hirakata
Toyonaka
Kyoto
Sonobe
Ueno
Otsu
Hikone
Imazu
Station
26
9
41
195
159
86
87
88
Elevation[m]
N 34° 48' 18"E 135° 40' 36"
N 34° 46' 24"E 135° 26' 54"
N 35° 00' 42"E 135° 44' 06"
N 35° 03' 12"E 135° 27' 30"
N 34° 45' 30"E 136° 08' 56"
N 34° 59' 18"E 135° 54' 54"
N 35° 16' 24"E 136° 14' 48"
N 35° 24' 36"E 136° 01' 54"
Location
1975 ~ present
1974 ~ present
1974 ~ present
1974 ~ present
1985 ~ present
1977 ~ present
1974 ~ present
1974 ~ present
Observationperiod
1,453.21989 ~ 1998
1,378.21989 ~ 1998
1,565.91989 ~ 1998
1,650.41989 ~ 1998
1,480.01989 ~ 1998
1,659.71989 ~ 1998
1,608.81989 ~ 1998
1,829.71989 ~ 1998
Mean annualprecipitation
[mm]
DS, P, T, W
DS, P, T, W
DS, P, T, W
DS, P, T, W
DS, P, T, W
DS, P, T, W
DS, P, T, W
DS, P, T, W
Observationitems3)
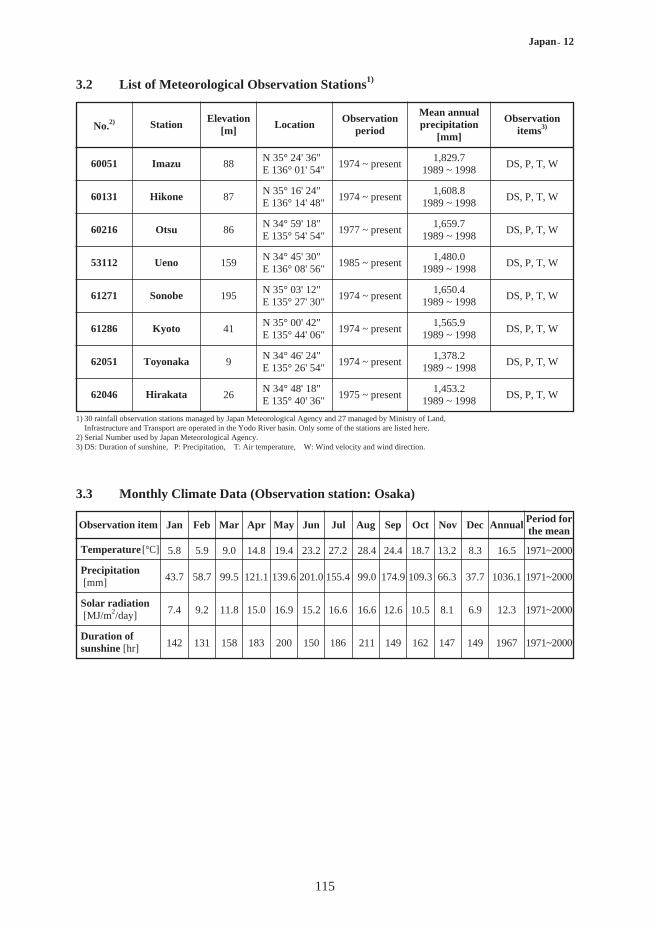
3.2 List of Meteorological Observation Stations1)
1) 30 rainfall observation stations managed by Japan Meteorological Agency and 27 managed by Ministry of Land,Infrastructure and Transport are operated in the Yodo River basin. Only some of the stations are listed here.
2) Serial Number used by Japan Meteorological Agency.3) DS: Duration of sunshine, P: Precipitation, T: Air temperature, W: Wind velocity and wind direction.
Observation item Jan Feb Mar Apr May Jun Jul Aug Sep Oct Nov Dec AnnualPeriod forthe mean
5.8 5.9 9.0 14.8 19.4 23.2 27.2 28.4 24.4 18.7 13.2 8.3 16.5 1971~2000
43.7 58.7 99.5 121.1 139.6 201.0 155.4 99.0 174.9 109.3 66.3 37.7 1036.1 1971~2000
7.4 9.2 11.8 15.0 16.9 15.2 16.6 16.6 12.6 10.5 8.1 6.9 12.3 1971~2000
142 131 158 183 200 150 186 211 149 162 147 149 1967 1971~2000
Temperature[°C]
Precipitation[mm]
Solar radiation[MJ/m2/day]
Duration ofsunshine [hr]
3.3 Monthly Climate Data (Observation station: Osaka)
116
Japan―12
3.4 Long-term Variation of Monthly Precipitation
4. Hydrological Information
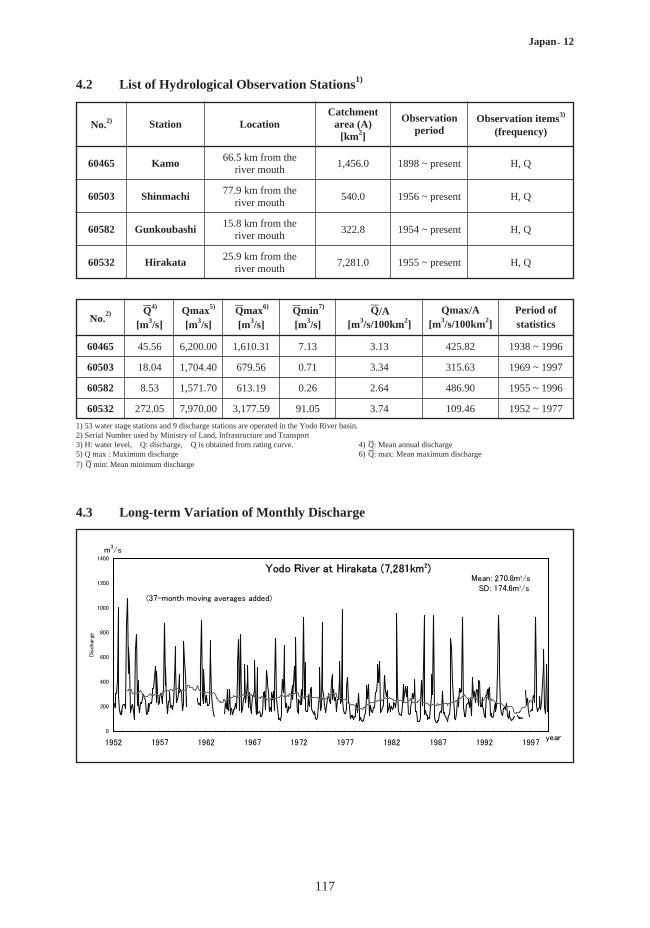
4.1 Map of Streamflow Observation Stations
117
Japan―12
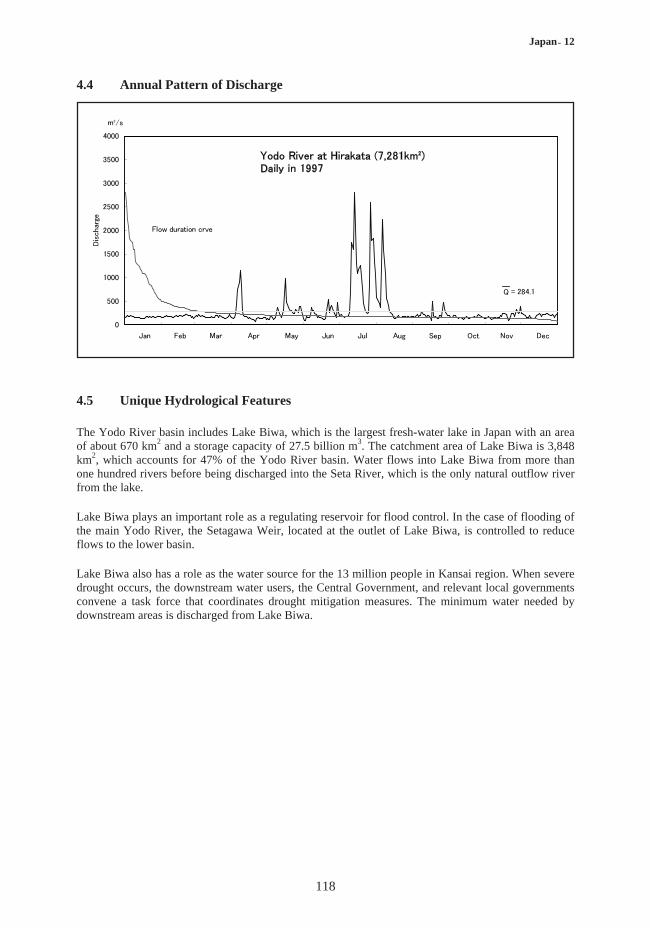
4.2 List of Hydrological Observation Stations1)
No.2)
60465 Kamo
Station
66.5 km from theriver mouth
Location
1,456.0
Catchmentarea (A)
[km2]
1898 ~ present
Observationperiod
H, Q
Observation items3)
(frequency)
60503
60582
Shinmachi77.9 km from the
river mouth540.0 1956 ~ present H, Q
Gunkoubashi15.8 km from the
river mouth322.8 1954 ~ present H, Q
60532 Hirakata25.9 km from the
river mouth7,281.0 1955 ~ present H, Q
No.2)
60465 45.56 6,200.00 1,610.31 7.13 3.13 425.82 1938 ~ 1996
60503 18.04 1,704.40 679.56 0.71 3.34 315.63 1969 ~ 1997
60582 8.53 1,571.70 613.19 0.26 2.64 486.90 1955 ~ 1996
60532 272.05 7,970.00 3,177.59 91.05 3.74 109.46 1952 ~ 1977
-Q4)
[m3/s]Qmax5)
[m3/s]
-Qmax6)
[m3/s]
-Qmin7)
[m3/s]
-Q/A[m3/s/100km2]
Qmax/A[m3/s/100km2]
Period ofstatistics
1) 53 water stage stations and 9 discharge stations are operated in the Yodo River basin.2) Serial Number used by Ministry of Land, Infrastructure and Transport3) H: water level, Q: discharge, Q is obtained from rating curve. 4) -Q: Mean annual discharge5) Q max : Maximum discharge 6) -Q: max: Mean maximum discharge7) -Q min: Mean minimum discharge
4.3 Long-term Variation of Monthly Discharge
118
Japan―12
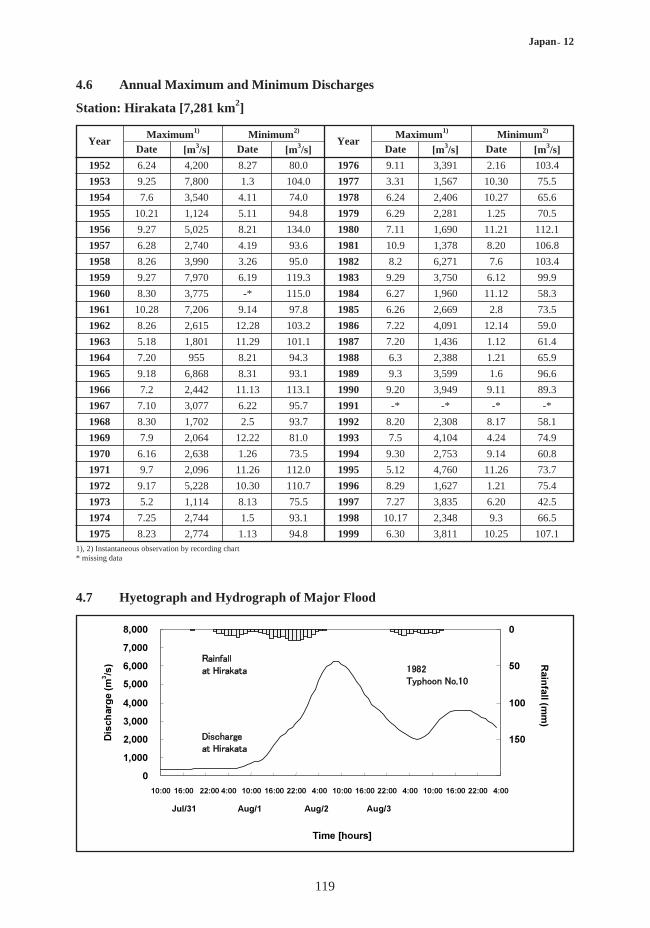
4.4 Annual Pattern of Discharge
4.5 Unique Hydrological Features
The Yodo River basin includes Lake Biwa, which is the largest fresh-water lake in Japan with an areaof about 670 km2 and a storage capacity of 27.5 billion m3. The catchment area of Lake Biwa is 3,848km2, which accounts for 47% of the Yodo River basin. Water flows into Lake Biwa from more thanone hundred rivers before being discharged into the Seta River, which is the only natural outflow riverfrom the lake.
Lake Biwa plays an important role as a regulating reservoir for flood control. In the case of flooding ofthe main Yodo River, the Setagawa Weir, located at the outlet of Lake Biwa, is controlled to reduceflows to the lower basin.
Lake Biwa also has a role as the water source for the 13 million people in Kansai region. When severedrought occurs, the downstream water users, the Central Government, and relevant local governmentsconvene a task force that coordinates drought mitigation measures. The minimum water needed bydownstream areas is discharged from Lake Biwa.
119
Japan―12
4.6 Annual Maximum and Minimum Discharges
Station: Hirakata [7,281 km2]
1), 2) Instantaneous observation by recording chart* missing data
Year
1952 6.24 4,200 8.27 80.0 1976 9.11 3,391 2.16 103.4
1953 9.25 7,800 1.3 104.0 1977 3.31 1,567 10.30 75.5
1954 7.6 3,540 4.11 74.0 1978 6.24 2,406 10.27 65.6
1955 10.21 1,124 5.11 94.8 1979 6.29 2,281 1.25 70.5
1956 9.27 5,025 8.21 134.0 1980 7.11 1,690 11.21 112.1
1957 6.28 2,740 4.19 93.6 1981 10.9 1,378 8.20 106.8
1958 8.26 3,990 3.26 95.0 1982 8.2 6,271 7.6 103.4
1959 9.27 7,970 6.19 119.3 1983 9.29 3,750 6.12 99.9
1960 8.30 3,775 -* 115.0 1984 6.27 1,960 11.12 58.3
1961 10.28 7,206 9.14 97.8 1985 6.26 2,669 2.8 73.5
1962 8.26 2,615 12.28 103.2 1986 7.22 4,091 12.14 59.0
1963 5.18 1,801 11.29 101.1 1987 7.20 1,436 1.12 61.4
1964 7.20 955 8.21 94.3 1988 6.3 2,388 1.21 65.9
1965 9.18 6,868 8.31 93.1 1989 9.3 3,599 1.6 96.6
1966 7.2 2,442 11.13 113.1 1990 9.20 3,949 9.11 89.3
1967 7.10 3,077 6.22 95.7 1991 -* -* -* -*
1968 8.30 1,702 2.5 93.7 1992 8.20 2,308 8.17 58.1
1969 7.9 2,064 12.22 81.0 1993 7.5 4,104 4.24 74.9
1970 6.16 2,638 1.26 73.5 1994 9.30 2,753 9.14 60.8
1971 9.7 2,096 11.26 112.0 1995 5.12 4,760 11.26 73.7
1972 9.17 5,228 10.30 110.7 1996 8.29 1,627 1.21 75.4
1973 5.2 1,114 8.13 75.5 1997 7.27 3,835 6.20 42.5
1974 7.25 2,744 1.5 93.1 1998 10.17 2,348 9.3 66.5
1975 8.23 2,774 1.13 94.8 1999 6.30 3,811 10.25 107.1
Maximum1)
Date [m3/s]
Minimum2)
Date [m3/s]Year
Maximum1)
Date [m3/s]
Minimum2)
Date [m3/s]
4.7 Hyetograph and Hydrograph of Major Flood
120
Japan―12
5. Water Resources
5.1 General Description
The water of the Yodo River was mainly used for agricultural water and transportation services in thepast. The first water utilization canal from Lake Biwa to the Kyoto City area (the Lake Biwa Canal)was constructed in 1890 and the water was used for various purposes including the nation’s firsthydroelectric power generation, transportation, irrigation and public water supply. In 1912, the secondwater utilization canal was completed aimed at expansion of the public water supply and powergeneration. In the Uji River, hydroelectric power generation was developed, and the Uji powergeneration plant was built.
After that, the first phase of the Yodo River Water Control Works was implemented to cope with theincreasing demand for water needed for the development of an industrial economy, and the waterutilization started through the regulation of the water level in Lake Biwa.
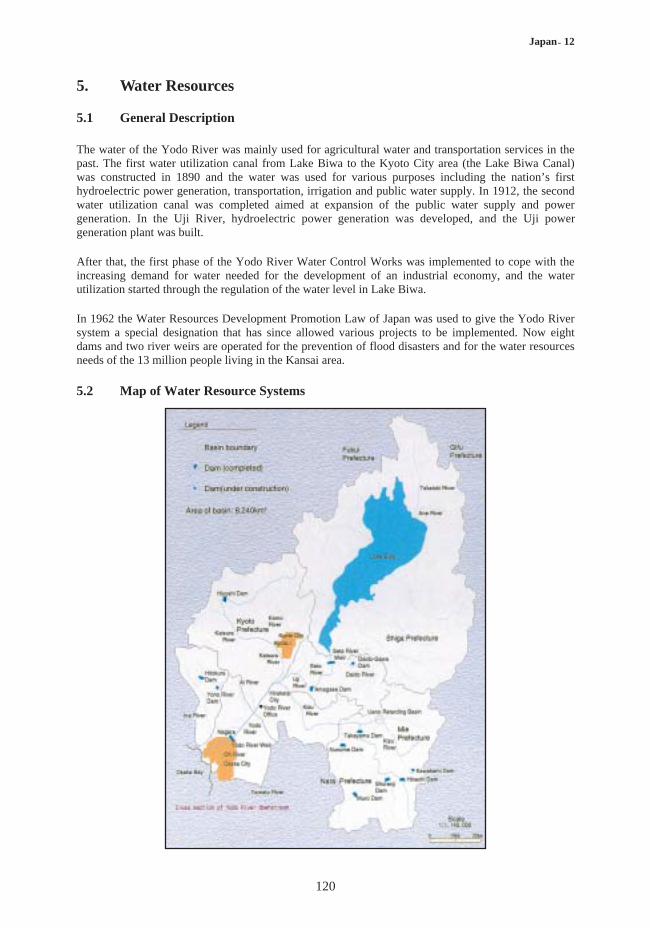
In 1962 the Water Resources Development Promotion Law of Japan was used to give the Yodo Riversystem a special designation that has since allowed various projects to be implemented. Now eightdams and two river weirs are operated for the prevention of flood disasters and for the water resourcesneeds of the 13 million people living in the Kansai area.
5.2 Map of Water Resource Systems
121
Japan―12
1) A: Agricultural use F: Flood control I: Industrial use N: Maintenance of normal flowsP: Hydro-power W: Municipal water supply
Nunome Nunome 75 17.3 15.4 F, N, W 1992
Nabari Hinachi 76 20.8 18.4 F, N, P, W 1999
Nabari Takayama 615 56.8 49.2 F, N, P, W 1969
Katsura Hiyoshi 290 66.0 58.0 F, N, W 1998
Shorenji Shorenji 100 27.2 23.8 A, F, N, P, W 1970
Uda Murou 169 16.9 14.3 F, N, W 1974
Ina Hitokura 115 33.3 30.8 F, N, W 1983
Name of riverName of dam
(reservoir)
Catchmentarea[km2]
Grosscapacity[106m3]
Effectivecapacity[106m3]
Purpose1) Year ofcompletion
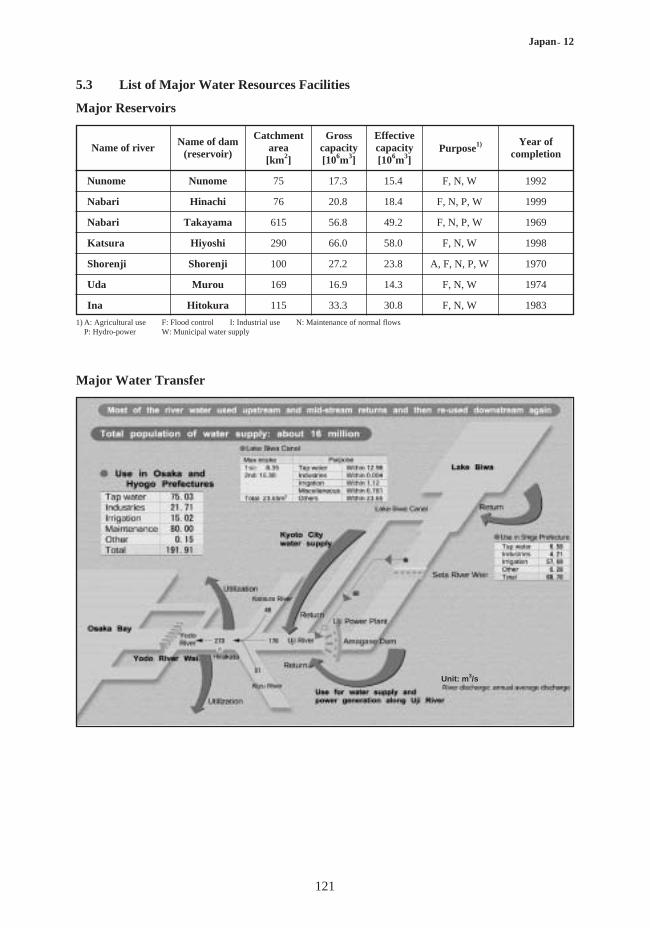
Major Water Transfer
5.3 List of Major Water Resources Facilities
Major Reservoirs
Unit: m3/s
122
Japan―12
6 days
199
2 days
261 268 265
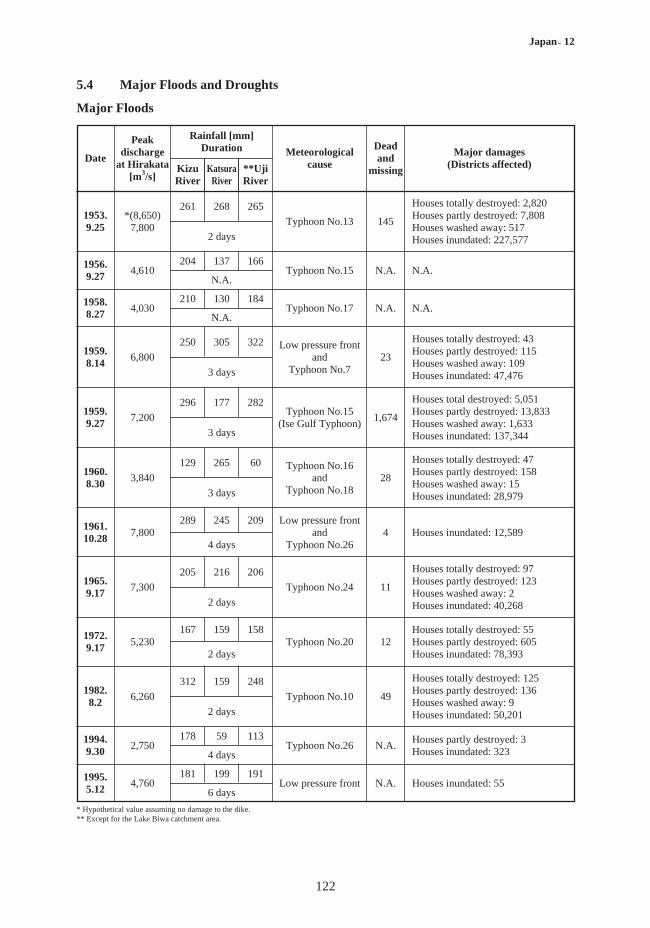
Date
Peakdischarge
at Hirakata[m3/s]
Rainfall [mm]Duration Meteorological
cause
Deadand
missing
Major damages(Districts affected)Kizu
RiverKatsura
River**UjiRiver
1953.9.25
1956.9.27
1958.8.27
1959.8.14
1959.9.27
1960.8.30
1961.10.28
1965.9.17
1972.9.17
1982.8.2
1994.9.30
1995.5.12
4,760
2,750
6,260
5,230
7,300
7,800
3,840
7,200
6,800
4,030
4,610
*(8,650)7,800
181
178
312
167
205
289
129
296
250
210
204
Low pressure front
Typhoon No.26
Typhoon No.10
Typhoon No.20
Typhoon No.24
Low pressure frontand
Typhoon No.26
Typhoon No.16and
Typhoon No.18
Typhoon No.15(Ise Gulf Typhoon)
Low pressure frontand
Typhoon No.7
Typhoon No.17
Typhoon No.15
Typhoon No.13
N.A.
N.A.
49
12
11
4
28
1,674
23
N.A.
N.A.
145
Houses inundated: 55
Houses partly destroyed: 3Houses inundated: 323
Houses totally destroyed: 125Houses partly destroyed: 136Houses washed away: 9Houses inundated: 50,201
Houses totally destroyed: 55Houses partly destroyed: 605Houses inundated: 78,393
Houses totally destroyed: 97Houses partly destroyed: 123Houses washed away: 2Houses inundated: 40,268
Houses inundated: 12,589
Houses totally destroyed: 47Houses partly destroyed: 158Houses washed away: 15Houses inundated: 28,979
Houses total destroyed: 5,051 Houses partly destroyed: 13,833Houses washed away: 1,633Houses inundated: 137,344
Houses totally destroyed: 43Houses partly destroyed: 115Houses washed away: 109Houses inundated: 47,476
N.A.
N.A.
Houses totally destroyed: 2,820Houses partly destroyed: 7,808Houses washed away: 517Houses inundated: 227,577
N.A.
N.A.
3 days
3 days
3 days
4 days
2 days
2 days
2 days
4 days
137 166
130 184
305 322
177 282
265 60
245 209
216 206
159 158
159 248
59 113
191
* Hypothetical value assuming no damage to the dike.** Except for the Lake Biwa catchment area.
5.4 Major Floods and Droughts
Major Floods
123
Japan―12
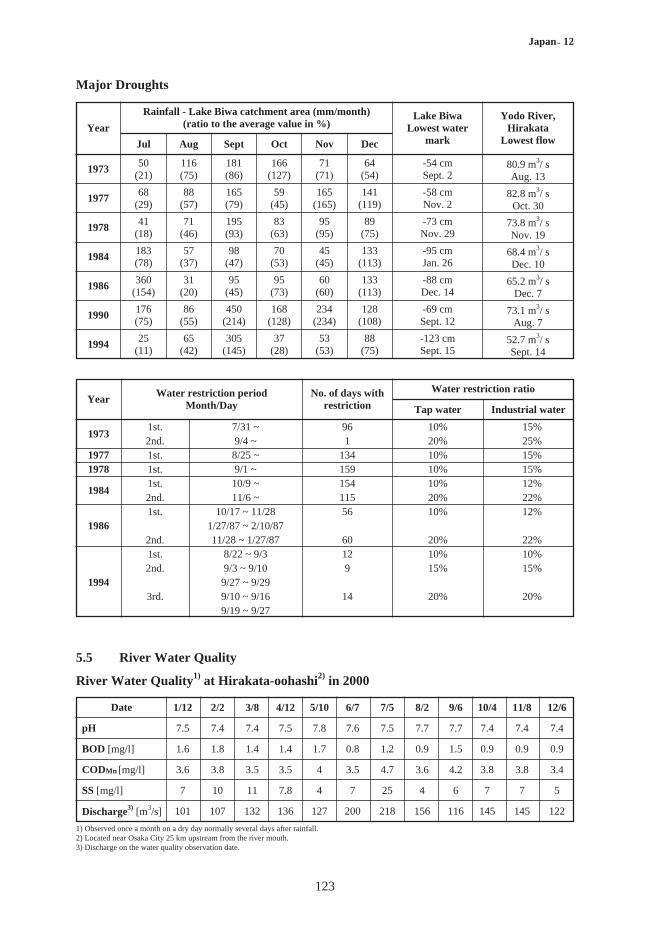
Major Droughts
Year
Rainfall - Lake Biwa catchment area (mm/month)(ratio to the average value in %)
Lake BiwaLowest water
mark
Yodo River,Hirakata
Lowest flow
197350
(21)116(75)
181(86)
166(127)
71(71)
64(54)
-54 cmSept. 2
80.9 m3/ sAug. 13
197768
(29)88
(57)165(79)
59(45)
165(165)
141(119)
-58 cmNov. 2
82.8 m3/ sOct. 30
197841
(18)71
(46)195(93)
83(63)
95(95)
89(75)
-73 cmNov. 29
73.8 m3/ sNov. 19
1984183(78)
57(37)
98(47)
70(53)
45(45)
133(113)
-95 cmJan. 26
68.4 m3/ sDec. 10
1986360
(154)31
(20)95
(45)95
(73)60
(60)133
(113)-88 cmDec. 14
65.2 m3/ sDec. 7
1990176(75)
86(55)
450(214)
168(128)
234(234)
128(108)
-69 cmSept. 12
73.1 m3/ sAug. 7
199425
(11)65
(42)305
(145)37
(28)53
(53)88
(75)-123 cmSept. 15
52.7 m3/ sSept. 14
Jul Aug Sept Oct Nov Dec
YearWater restriction period
Month/DayNo. of days with
restriction Tap water
Water restriction ratio
Industrial water
19731st. 7/31 ~ 96 10% 15%2nd. 9/4 ~ 1 20% 25%
1977 1st. 8/25 ~ 134 10% 15%1978 1st. 9/1 ~ 159 10% 15%
19841st. 10/9 ~ 154 10% 12%2nd. 11/6 ~ 115 20% 22%1st. 10/17 ~ 11/28 56 10% 12%
1986 1/27/87 ~ 2/10/872nd. 11/28 ~ 1/27/87 60 20% 22%1st. 8/22 ~ 9/3 12 10% 10%2nd. 9/3 ~ 9/10 9 15% 15%
1994 9/27 ~ 9/293rd. 9/10 ~ 9/16 14 20% 20%
9/19 ~ 9/27
Date
BOD [mg/l]
pH
1/12 2/2 3/8 4/12 5/10 6/7 7/5 8/2 9/6 10/4 11/8 12/6
7.5 7.4 7.4 7.5 7.8 7.6 7.5 7.7 7.7 7.4 7.4 7.4
1.6 1.8 1.4 1.4 1.7 0.8 1.2 0.9 1.5 0.9 0.9 0.9
3.6 3.8 3.5 3.5 4 3.5 4.7 3.6 4.2 3.8 3.8 3.4
7 10 11 7.8 4 7 25 4 6 7 7 5
101 107 132 136 127 200 218 156 116 145 145 122
CODMn [mg/l]
SS [mg/l]
Discharge3) [m3/s]
1) Observed once a month on a dry day normally several days after rainfall.2) Located near Osaka City 25 km upstream from the river mouth.3) Discharge on the water quality observation date.
5.5 River Water Quality
River Water Quality1) at Hirakata-oohashi2) in 2000

124
Japan―12
Present water quality of the Yodo River
6. Socio-cultural Characteristics
The Yodo River basin contains two large historical cities, Kyoto and Osaka. Kyoto played a central rolein the development of Japan’s history. The ancient capital was transferred from Nara to Kyoto in 794,which then became the centre of Japanese politics and culture for about 1,100 years until the transfer ofthe government to Tokyo in 1868. Osaka also fulfilled a vital role as a city of commerce, trade anddiplomatic relations with Asian countries.
To support the development of the region, many river works have been conducted. The oldest floodcontrol works in the area date back to the time of Emperor Nintoku (about 320 A.D.). Many floodcontrol works have been performed since then, such as the separation of Ogura pond and the Uji River,the construction of the Bunrokutsutsumi (Bunroku Dike) by Hideyoshi Toyotomi in the 16th century,and the Yamato River redirection works during the first part of the 18th century. In the Meiji Period,western techniques were introduced to Japan by De Lekay, an engineer from Holland, Tadao Okino andothers, which brought about the start of modern flood control water works and reformed the YodoRiver into a new waterway.
Based on the historical development, this region constitutes the second largest economic bloc after theTokyo Metropolitan area.
7. References, Databooks and Bibliography
Geographical Survey Institute (1984): The national atlas of Japan, Ministry of Construction.Biwa Lake Construction Work Office: Seta River Weir (brochure in English), Kinki Regional
Construction Bureau, Ministry of Construction, 19pp.Kinki Regional Bureau: Yodogawa Hyaku-nenn-shi (History of The Yodo River for a hundred years),
Ministry of Construction, 1821pp.River Bureau: Uryo nenphyo (Rainfall Yearbook), Ministry of Land, Infrastructure and Transport.River Bureau: Ryuryo nenphyo (Stream flow Yearbook), Ministry of Land, Infrastructure and
Transport.River Bureau: Suisitsu nenphyo (River Water Quality Yearbook), Ministry of Land, Infrastructure and
Transport.Yodo River Office: The Yodo River (brochure in English), Kinki Regional Development Bureau,
Ministry of Land, Infrastructure and Transport, 10pp.