natori-gawa - hydrology and water resources research
TRANSCRIPT

72
Japan―14
Natori-gawa
Map of River
Table of Basic Data
Serial No. : Japan-14
Location: Northeast Honshu, Japan
Area: 939 km2
Origin: Mt Kamurodake
Outlet: Pacific Ocean
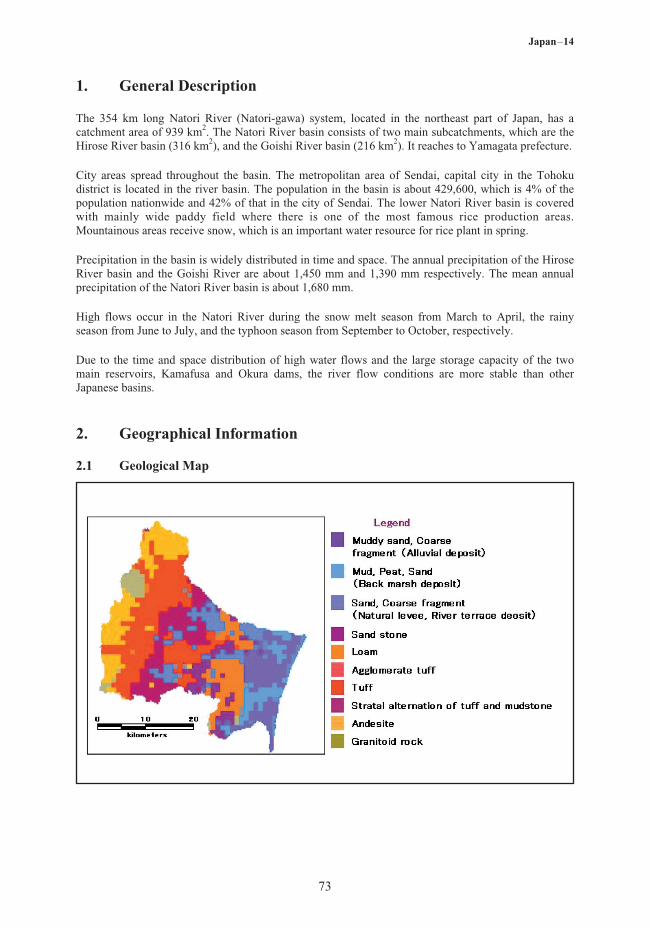
Main geological features: volcanic rock, tuff, alluvial deposit
Main tributaries: Hirose River (316 km2) , Goishi River (216 km2)
Main lakes: Kamafusa (39.3 x 10⁶ m3)
Mean annual precipitation: 1,241.8 mm at Sendai (1971-2000).
Mean annual runoff: 17.11 m3/s at Yokata (1960-2000)
Population: 429,600
Land use: Forest (71.2%), Paddy field (16%), Cropland (3.6%), Orchard (1%),Urban of Residential area (7%), Water surface (1.2%)
E 140° 26' ~ 140° 58'
Length of main stream: 55 km
Highest point: Mt. Zao (Kumano-dake) (1,841 m)
Lowest point: River mouth (0 m)
N 38° 08' ~ 38° 37'
Main cities: Sendai
Name: Natori-gawa
Main reservoirs: Kamafusa (39.3 x 10⁶m3, 1970), Okura (25.0 x 10⁶m3, 1961),Tarumizu (4.2 x 10⁶m3, 1977)
73
Japan―14
1. General Description
The 354 km long Natori River (Natori-gawa) system, located in the northeast part of Japan, has acatchment area of 939 km2. The Natori River basin consists of two main subcatchments, which are theHirose River basin (316 km2), and the Goishi River basin (216 km2). It reaches to Yamagata prefecture.
City areas spread throughout the basin. The metropolitan area of Sendai, capital city in the Tohokudistrict is located in the river basin. The population in the basin is about 429,600, which is 4% of thepopulation nationwide and 42% of that in the city of Sendai. The lower Natori River basin is coveredwith mainly wide paddy field where there is one of the most famous rice production areas.Mountainous areas receive snow, which is an important water resource for rice plant in spring.
Precipitation in the basin is widely distributed in time and space. The annual precipitation of the HiroseRiver basin and the Goishi River are about 1,450 mm and 1,390 mm respectively. The mean annualprecipitation of the Natori River basin is about 1,680 mm.
High flows occur in the Natori River during the snow melt season from March to April, the rainyseason from June to July, and the typhoon season from September to October, respectively.
Due to the time and space distribution of high water flows and the large storage capacity of the twomain reservoirs, Kamafusa and Okura dams, the river flow conditions are more stable than otherJapanese basins.
2. Geographical Information
2.1 Geological Map

74
Japan―14
2.2 Land Use Map
No.
1
Name of river
Natori(Main river)
Length [km]Catchment area
[km2]
55939
Highest peak [m]Lowest point [m]
Mt. Zao 1,841River mouth 0
CitiesPopulation
Sendai(995,725)
Sendai(995,725)
Natori(68,193)
Kawasaki(11,032)
2Hirose
(Tributary)125.9315.9
Mt.Funakata 1,500Confluence 0
3Masuda
(Tributary)25.239.6
305Confluence 0
4Goishi
(Tributary)80.1216.4
Mt. Kamafusa 385Confluence 30
2.3 Characteristics of River and Main Tributaries

75
Japan―14
3. Climatological Information
3.1 Annual Isohyetal Map
3.2 List of Meteorological Observation Stations
No.
344211)
349511)
Station
Kawasaki
Nikkawa
Elevation[m]
200
264
Location
N 38° 10.8'E 140° 37.9'
N 38° 18.2'E 140° 38.1'
Observationperiod
22
22
Mean annualprecipitation
[mm]
1,451.0
1,522.7
Mean annualtemperature
[°C]
10.6
10.0
Observationitems3)
A
A
475902) Sendai 39N 38° 15.7'E 140° 53.8'
30 1,219.7 12.1 M
1) Serial Number used by JMA (Japan Meteorological Agency) 2) Serial Number used by WMO (World Meteorological Organization) 3) A: The AMeDAS (Automatic Meteorological Data Acquisition System) observation. The observation items are precipitation, air temperature, wind
speed, wind direction and sunshine duration.M: Meteorological observation. Fourteen items including precipitation, air temperature, sunshine duration, solar radiation, wind speed, wind direction.

76
Japan―14
3.3 Monthly Climate Data (Observation station: Sendai)
ObservationItem
Observationstation
Jan Feb Mar Apr May Jun Jul Aug Sep Oct Nov Dec AnnualPeriod forthe mean
Sendai 1.5 1.7 4.5 10.1 14.9 18.3 22.1 24.1 20.4 14.8 9.1 4.3 12.1 1971-2000
Sendai 33.1 48.4 73.0 98.1 107.9 137.9 159.7 174.2 218.4 99.2 66.8 26.4 1,241.8 1971-2000
Sendai 7.9 10.5 13.4 16.1 17.7 14.5 14.1 14.6 11.4 10.3 7.9 7.0 12.1 1972-2000
Sendai 151.3 151.9 182.3 190.9 198.7 127.9 127.7 155.4 119.8 151.8 140.2 144.7 1,842.6 1971-2000
Temperature[°C]
Precipitation[mm]
Solar radiation [MJ/m2/d]
Duration ofSunshine [hr]
3.4 Long-term Variation of Monthly Precipitation
77
Japan―14
4. Hydrological Information
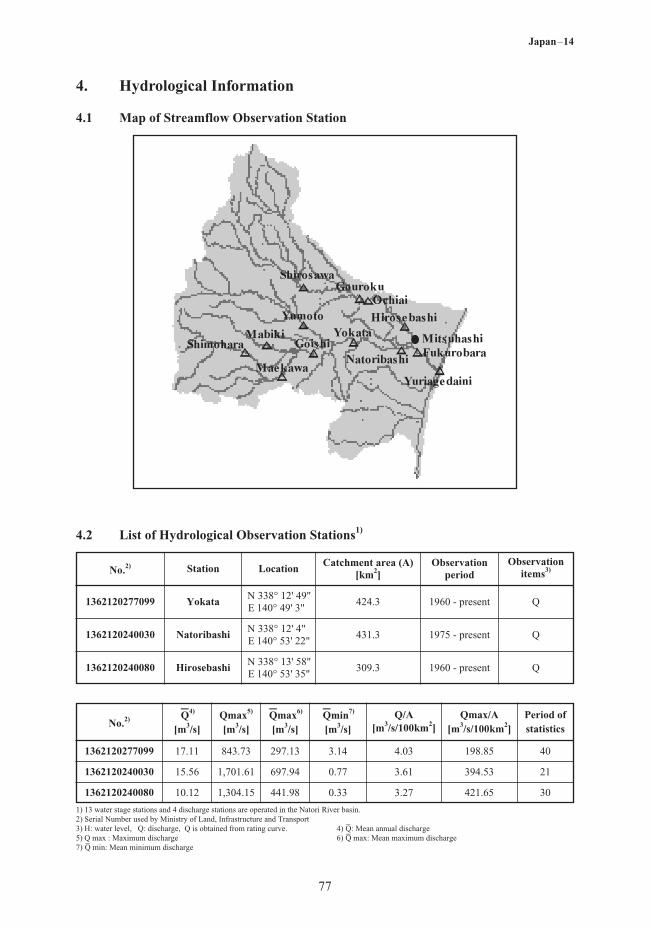
4.1 Map of Streamflow Observation Station
No.2)
1362120277099 Yokata
Station
N 338° 12' 49"E 140° 49' 3"
Location
424.3
Catchment area (A) [km2]
1960 - present
Observationperiod
Q
1362120240030 NatoribashiN 338° 12' 4"E 140° 53' 22"
431.3
1960 - present Q1362120240080 HirosebashiN 338° 13' 58"E 140° 53' 35"
309.3
1975 - present Q
Observationitems3)
No.2)-Q4)
[m3/s]Qmax5)
[m3/s]
-Qmax6)
[m3/s]
-Qmin7)
[m3/s]Q/A
[m3/s/100km2]Qmax/A
[m3/s/100km2]Period ofstatistics
1362120277099 17.11 843.73 297.13 3.14 4.03 198.85 40
1362120240030 15.56 1,701.61 697.94 0.77 3.61 394.53 21
1362120240080 10.12 1,304.15 441.98 0.33 3.27 421.65 30
1) 13 water stage stations and 4 discharge stations are operated in the Natori River basin.2) Serial Number used by Ministry of Land, Infrastructure and Transport3) H: water level, Q: discharge, Q is obtained from rating curve. 4)-Q: Mean annual discharge5) Q max : Maximum discharge 6)-Q max: Mean maximum discharge7)-Q min: Mean minimum discharge
4.2 List of Hydrological Observation Stations1)

78
Japan―14
4.3 Long-term Variation of Monthly Discharge
4.4 Annual Pattern of Discharge

79
Japan―14
4.5 Unique Hydrological Features
The Natori River basin has two main reservoirs, which are Okura dam reservoir with a lake area ofabout 1.6 km2 and a storage capacity of 28 million m3, and Kamafusa dam reservoir with an area ofabout 3.9 km2 and storage capacity of 45.3 million m3. The catchment areas of Okura and Kamafusa are88.5 km2 and 195.3 km2 respectively.
These two dams play an important role of a regulating reservoir for flood control and water supply. Incase of flooding of the main Natori River, these dams are controlled to reduce the high water flow tothe lower basins. Also, a headwork in the middle steam irrigates 32 km2 of paddy field.
The Natori River also provides a water supply for 1 million people in Sendai city. When severe droughtoccurs, the users of the water in the downstream areas, the central government and related localgovernments convene a task force committee and coordinate measures against drought. The minimumnecessary water is discharged from the two dams and the headwork for water use in the downstreamareas.
4.6 Annual Maximum and Minimum Discharges
At Yokata [424.3 km2]
Year
1970 152.17 4.41 1980 245.90 2.31 1990 331.37 4.23
1971 222.32 4.87 1981 368.64 6.65 1991 417.73 4.23
1972 153.67 10.64 1982 391.07 2.60 1992 85.26 0.98
1973 59.78 3.32 1983 264.46 2.92 1993 383.80 2.37
1974 327.93 5.94 1984 195.61 1.64 1994 750.92 1.52
1975 58.08 4.60 1985 242.29 1.00 1995 154.16 1.26
1976 73.39 5.12 1986 843.73 0.74 1996 113.47 1.62
1977 297.92 1.99 1987 141.18 1.84 1997 269.75 1.05
1978 114.59 4.00 1988 373.27 5.44 1998 330.03 2.14
1979 198.74 2.84 1989 563.30 2.59 1999 672.16 1.25
Maximum[m3/s]
Minimum[m3/s]
YearMaximum
[m3/s]Minimum
[m3/s]Year
Maximum[m3/s]
Minimum[m3/s]
80
Japan―14
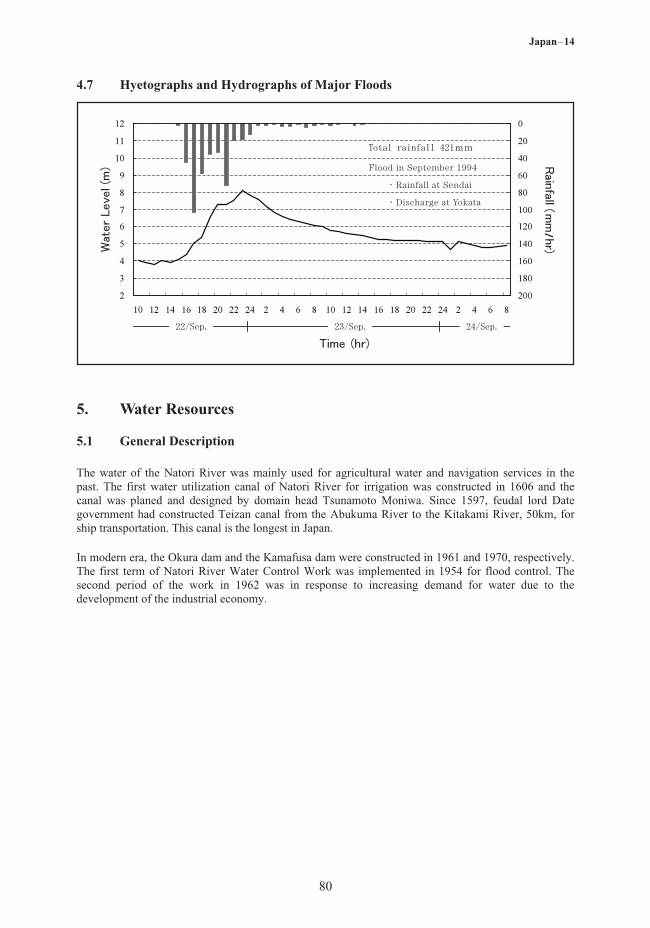
4.7 Hyetographs and Hydrographs of Major Floods
Flood in September 1994
・Rainfall at Sendai
・Discharge at Yokata
5. Water Resources
5.1 General Description
The water of the Natori River was mainly used for agricultural water and navigation services in thepast. The first water utilization canal of Natori River for irrigation was constructed in 1606 and thecanal was planed and designed by domain head Tsunamoto Moniwa. Since 1597, feudal lord Dategovernment had constructed Teizan canal from the Abukuma River to the Kitakami River, 50km, forship transportation. This canal is the longest in Japan.
In modern era, the Okura dam and the Kamafusa dam were constructed in 1961 and 1970, respectively.The first term of Natori River Water Control Work was implemented in 1954 for flood control. Thesecond period of the work in 1962 was in response to increasing demand for water due to thedevelopment of the industrial economy.

81
Japan―14
5.2 Map of Water Resource Systems
1) A: Agricultural use F: Flood control I: Industrial use N: Maintenance of normal flows P: Hydro power W: Municipal water supply
Goishi Kamafusa 195.25 45.3 39.3 F,N,P,W,I 1970
Okura Okura 88.5 28 25 F,N,A,P,W,I 1961
Masuda Tarumizu 9.7 4.7 4.2 F,W,N 1977
5.3 List of Major Water Resources Facilities
Major Reservoirs
Name of riverName of dam
(reservoir)
Catchmentarea[km2]
Grosscapacity[106m3]
Effectivecapacity[106m3]
Purposes1) Year ofcompletion

82
Japan―14
5.4 Major Floods and Droughts
Major Floods
DateWater Level atNatori Bridge
[m]
Rainfall [mm]Duration
Meteorologicalcause
Deathand
MissingMajor damages
1947.9 9.65302 at Sendai(11th - 15th)
Typhoon“Catherine” ― IBF: 2021
1948.9 9.85351 at Sendai(15th - 17th)
Typhoon“Ion” ―
House destroy,House inundated
1950.810.65
(3,060 m3/s) 233 at Sendai
(2nd - 4th) Tropical storm
64
House destroy,House inundated
1958.9 8.06132 at Sendai(17th - 18th)
Tropical storm ― House inundated
1986.8 7.65402 at Sendai
(4th - 5th) Tropical storm ―
House totally destroyed 3IAF: 2080IBF 12000
1994.9 8.12251 at Sendai(22nd - 23rd)
Regional downpour ―House totally destroyed 7
IAF: 2080IBF: 3139
1982.9 7.65 189 at Sendai Tyhoon ―
Year SeasonMinimumDischarge
(m3/s) Water Restriction period
Restrictionratio
1973 Jul. - Sep. 4.11st 10/Aug. - 26/Sep.2nd 21/Aug. - 12/Sep.
80%67%
1978 Jul. - Aug. 0.71 ― ―
1982 Jul. 2.25 ― ―
1985 Aug. - Sep. 0.62 ― ―
1987 May 0.08 ― ―
1994 Jul. - Sep. 0.84 ― ―
Major Droughts
IAF: Inundation above floor, IBF: Inundation below floor in number of houses.

83
Japan―14
5.5 Groundwater and River Water Quality
River Water Quality1) at Natori bridge2) in 2000
Date
BOD [mg/l]
pH
1/5 2/2 3/1 4/19 5/10 6/7 7/5 8/1 9/6 10/4 11/8 12/6
7.7 7.7 7.7 8.1 7.6 7.9 7.9 7.7 7.9 7.9 8.0 7.7
0.8 0.5 1.0 0.7 0.5 1.2 0.8 1.6 0.8 0.6 1.2 0.6
1.3 1.7 1.6 1.5 1.3 3.1 2.4 1.8 2.4 3.0 1.9 1.7
2 1 1 4 3 2 3 1 2 4 3 2
9.01 7.99 8.24 29.11 10.57 4.16 1.07 3.01 4.96 19.79 11.20 9.60
CODMn [mg/l]
SS [mg/l]
Discharge3) [m3/s]
1) Observed once a month on a dry day normally several days after rainfall.2) Located near Sendai City 7.4 km upstream from the river mouth.3) Discharge on the water quality observation date.
6. Socio-cultural Characteristics
The Natori River basin is located in the central of Miyage prefecture, and includes Sendai city, thecapital city of the Tohoku district. Many industrial activities are concentrated in this basin.
The watercourse supplies much water to Sendai Plain with a population of one million people and thenflows into the Pacific Ocean. The river mouth is named as the Idoura lagoon, which supports largepopulations of birds, and is designated as a wildlife refuge area.
Although one of the tributaries, the Hirose River is in the urban area of Sendai city, there is muchnature that can be seen, including sweet fishes and singing frogs. The ministry of Environment hasselected the Hirose River as one of the 100 best waters in Japan.
From the era of Feudal Lord, Masamune Date, the Natori River has been indispensable for water supplyand ship transportation. Teizan Unga (Canal) is the longest canal in Japan, which connects theAbukuma, Natori, Naruse, and Kitakami rivers. The Kinagashi trench was also linked between theHirose and Natori rivers for ship transportation for timbers.
The Natroi River basin will continue to be developed and support the Tohoku district as expresswaysand new railway systems will be constructed for upgrading of infrastructure.
7. References, Databooks and Bibliography
Sendai Construction Work Office (1995): Essential, Abukuma and Natori River handbook, 203pp.Tohoku District Bureau, Ministry of Construction (1994), Flood Record, 94pp.Tohoku District Bureau, Ministry of Construction (1995), Flood Record, 92pp.Tohoku District Bureau, Ministry of Construction (1986), Flood Record, 82pp.Tohoku District Bureau, Ministry of Construction (1995), Summer drought report in 1994, 400pp.