jane e. west ph.d. [email protected] december 5, 2014 teacher preparation regulations proposed by...
TRANSCRIPT

JANE E. WEST PH.D.JANEWESTDC@GMAIL .COM
DECEMBER 5 , 2014
Teacher Preparation RegulationsProposed by US Department of
Education

PROPOSED REGULATIONS!
61 day comment period
Comments due February 2, 2015
Department of Education needs to hear your comments!!
Link to proposed regs and related material:
Teacher Preparation Issues

Background
Negotiated rulemaking failed to reach consensus in 2012
Department now publishing proposed rulesTitle II of Higher Education Act has never
had regulationsTEACH grant regulations being modifiedCrux of regulatory nexus: What is a “high
quality teacher preparation program” for TEACH grant participation?
Intertwine Title II and TEACH grants

Title II and TEACH Grant Nexus
Every state must rate every teacher prep program every year on a 1-4 scale
Only those in the top two ratings will be eligible for TEACH grants
Ingredients for rating: Student learning outcomes (or teacher evaluations)* Employment and retention with focus on high need
schools** Survey results of graduates and employers Professional accreditation or program approval with certain
components * must be satisfactory to be in top two categories ** “significant part” employment outcomes in high need schools

Some Facts
Total of 25,000 individual teacher preparation programs
22,312 are at institutions of higher education2,688 are at entities other than higher
educationThere are 1500 institutions of higher
education with teacher prep programsThere are 1300 non-higher education entities
with teacher preparation programsThe average IHE offers 15 teacher prep
programs

Performance Levels
State must have at least 4: Low-performing At-risk Effective Exceptional
Based on 4 factors including “in significant part, employment outcomes for high-need schools and student learning outcomes.”

Student Learning Outcomes
“data, for each teacher preparation program in a state, on the aggregate learning outcomes of students taught by new teachers that are calculated by the state using one or both of the following:” “student growth” “teacher evaluation measures”

“Student Growth”
“change in student achievement in tested grades and subjects and the change in student achievement in non-tested grades and subjects for an individual student between two points in time” Could be “value-added” “Student achievement in tested grades and subjects”
= ESEA required assessments

“Student Growth” cont.
“Student achievement in non-tested grades and subjects” = “determined by measures of student learning and performance, such as student results on pre-tests and end-of-course tests, objective performance based assessments, student learning objectives, student performance on English Language proficiency assessments and other measures of student achievement, that are rigorous and comparable across schools and consistent with State requirements.”
Definitions nearly identical to waivers

“Teacher Evaluation Measure”
“the percentage of new teachers, by grade span and subject level, rated at each performance level under an LEA teacher evaluation system consistent with statewide parameters that differentiates teachers on an annual basis using at least three performance levels and multiple valid measures determining the performance levels.”
“Multiple valid measures”… “ include data on student growth for all students as a significant factor as well as observations based on rigorous teacher performance standards and other measures of professional practice.”

Employment Outcomes
Two components: Placement and retention“Teacher Placement Rate” = percentage of
new teachers and recent graduates who have been hired in a full-time teaching position for the grade level, span and subject area in which the teachers were prepared Does not have to include graduates who go to other
states, private schools, positions that don’t require certification or those who have enrolled in graduate school or joined military

Teacher Retention Rate
Three options:1) % of new teachers hired in full time teaching positions
who have served for at least 3 consecutive school years within 5 years of being granted certification that allows them to teach as teacher of record
2) % of new teachers hired in full time teaching positions and reached a level of tenure or equivalent measure of retention within 5 years of being granted a level or certification that allows them to be teacher of record
3) 100% minus % of new teachers hired in full time positions and whose employment was not continued by their employer for reasons other than budgetary constraints within five years of being teacher of record

Placement and Retention in High Need Schools
Both calculated separately in relation to high need schools
High Need School = meets one or both definitions: Highest quartile of schools in LEA with % of students
from low income families based on one or a composite of: % students in poverty; % eligible for free and reduced lunch; % receiving Social Security subsidies; % eligible for Medicaid.
Elementary school where 60% or more are eligible for free or reduced price lunch or others school where 45% or more are eligible for free or reduced price lunch.
Must be “significant part” of indicators
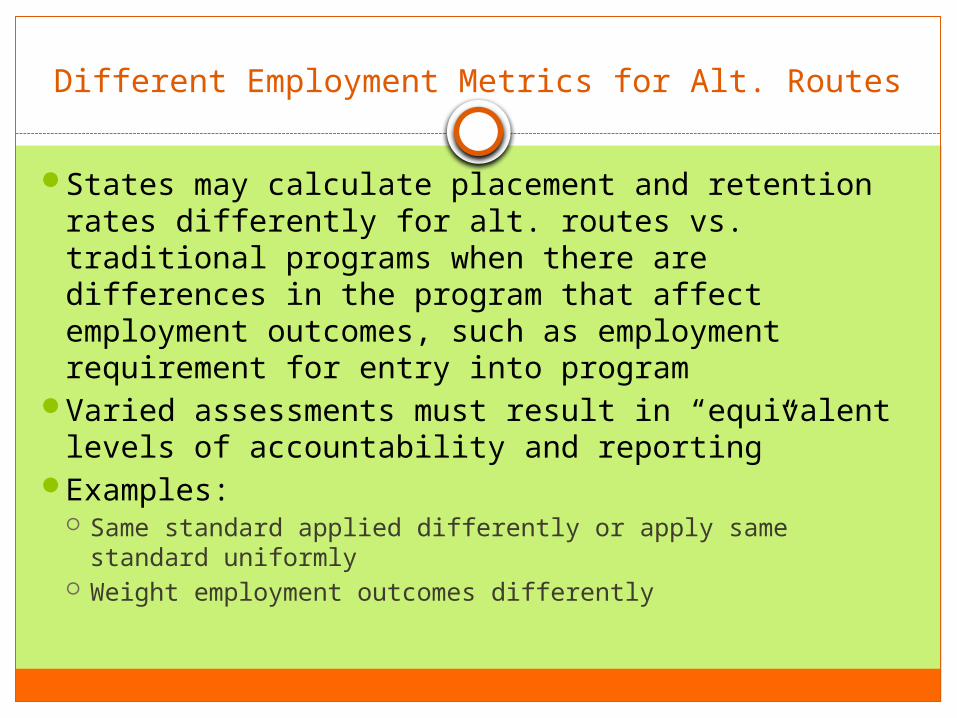
Different Employment Metrics for Alt. Routes
States may calculate placement and retention rates differently for alt. routes vs. traditional programs when there are differences in the program that affect employment outcomes, such as employment requirement for entry into program
Varied assessments must result in “equivalent levels of accountability and reporting”
Examples: Same standard applied differently or apply same standard
uniformly Weight employment outcomes differently

Survey Outcomes
Results of surveys of first year teachers and their employers every year
Designed to capture perceptions of whether new teachers possess the skills needed to succeed in the classroom
May develop surveys and/or employment and retention rates in conjunction with CAEP

CAEP Accreditation or State Program Approval
States choose oneState Program Approval with these measures:
Produces teacher candidates with content and pedagogical knowledge
Quality clinical preparation (include multiple clinical or field experiences that serve diverse, rural or under represented populations, including ELL and SWD assessed with performance based protocol)
Rigorous entry and exit qualifications (entrance on multiple measures and exit based on performance assessment)
States may choose additional measures (applied equally to alt routes and traditional programs)

Consultation with Stakeholders
State must consult with at a minimum: Leaders and faculty of traditional and alt. route programs; students of
teacher prep programs; superintendents, school board members; elem and sec school leaders and instructional staff; elem and sec. school students and their parents; IHEs that serve high proportions of low-income or minority students or ELLs; advocates for ELLs and students with disabilities and officials of state’s standards board or other standards body.
Must consult about: Procedures for assessing and reporting the performance of each teacher
prep program Weighting of indicators Method of aggregation of programs State level rewards or consequences for performance levels Opportunities for programs to appeal

Aggregation of Data
Must report on programs that produce 25 or more new teachers per year
States may create a threshold lower than 25Must try to reach threshold by
aggregating programs operated by the same entity e.g. 2 different special ed programs
or aggregating over multiple years, up to 4 or a combination of the two

Low Performing and At Risk Programs
States must identifyMust use 4 indicatorsMust include, “in significant part” student
learning outcomes
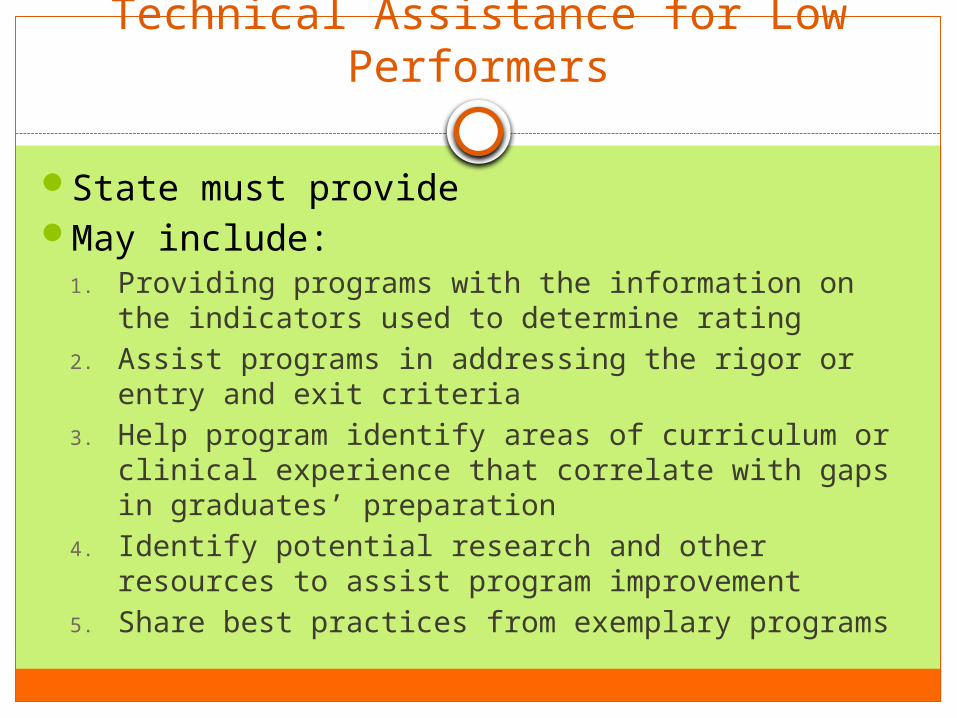
Technical Assistance for Low Performers
State must provideMay include:
1. Providing programs with the information on the indicators used to determine rating
2. Assist programs in addressing the rigor or entry and exit criteria
3. Help program identify areas of curriculum or clinical experience that correlate with gaps in graduates’ preparation
4. Identify potential research and other resources to assist program improvement
5. Share best practices from exemplary programs

Consequences for Low Performers
Loss of state approvalLoss of access to federal financial aid (Title IV)Provision of transitional services (remedial
services, career counseling, locating another program) to students enrolled in the program for no more than 150% of the length of the program
Estimated that 50 programs will lose state approval because of low performance

TEACH Grants
Scholarships for teacher candidates up to $4000 per year for undergraduates and $4000 per year for two years for graduate students
Must have 3.25 GPA and/or be in top 25% of standardized admissions test
Service obligation of 4 out of 8 years in high need school and high need field
Scholarship becomes loan to be repaid if service obligation not complete

TEACH Grants
$100 million programOf the 22,312 teacher prep programs at IHEs,
16,721 have participated in TEACHAbout 800 IHEs and 34,000 students participateAlmost half of TEACH disbursements to students
in private not-for-profit IHEsFewer than 100 institutions enroll the majority of
participantsEstimated that 3% to 8% of programs will lose
TEACH eligibility with new rating system

“TEACH Grant Eligible Program”
“high quality teacher prep program” = rated as effective or exceptional for 2 out of 3 years
“TEACH Grant-eligible STEM program” = physical, life, or computer sciences; technology; engineering or mathematics” over the most recent three years for which data are available have not been identified by the Secretary as having fewer than 60% of its TEACH recipients complete at least one year of teaching that fulfills the service obligation within 3 years of program completion.
Secretary publishes annual list of TEACH grant eligible STEM programs identified by CIP codes

Timeline
October 2017 – institutional reporting for 2016-7 academic year
April 2018 – pilot states begin reporting on 2016-17 data
April 2019 – Full state reporting on 2017-18 data
2020-2021 school year – levels of performance in April 2019 and April 2020 State Report Cards determine TEACH grant eligibility

Economic Impact of Regulation
Considered a “significant regulatory action”May have an annual effect on the economy of
$100 million or more or adversely affect a sector of the economy, productivity, competition, jobs etc… or raise novel legal or policy issues
Determination that the benefits justify the costs and the alternative chosen maximizes the benefits

Cost and Benefits
$42 million – 42.1 million over 10 years – total cost of regs
Benefits: Prospective students in choosing programs Employers in recruiting and hiring States in making funding decisions Teacher prep programs in improving
Current Title II data created “a market failure due to imperfect information”

Cost to IHE’s
No additional data collected as a result of this regulation
4 hours per institution (entity) to adjust from aggregated to disaggregated program data
Want to eliminate data in the future: clock-hours prior to clinical; equivalent faculty, prior year pass rate and completer data; drop down rather than narratives
Drop from 146 hours to 78 hours per institutionAnnual total cost for ALL IHEs to meet
Institutional Report Card requirements = $3.7 million annually

Overall Burden
Annual total reporting burden for states = reduction of 15,000 hours
Total aggregate burden = 1.3 million hours nationwide for section 612; increase of 507,000 hours

Comments on Data Collection – Due Jan. 2
OMB is required to make a decision concerning the collections of information contained in these proposed regulations between 30 and 60 days after publication of this document in the Federal Register. Therefore, to ensure that OMB gives your comments full consideration, it is important that OMB receives your comments by January 2, 2015. This does not affect the deadline for your comments to us on the proposed regulations.

Data Collection Comments
If you want to comment on the proposed information collection requirements, please send your comments to the Office of Information and Regulatory Affairs, OMB, Attention: Desk Officer for U.S. Department of Education. Send these comments by email to [email protected] or by fax to (202) 395-6974. You may also send a copy of these comments to the Department contact named in the ADDRESSES section of this preamble.Show citation box
We have prepared an Information Collection Request (ICR) for OMB collection 1840-0744. In preparing your comments you may want to review the ICR, which is available at www.reginfo.gov and for which the comment period will run concurrently with the comment period of the NPRM. To review the ICR on www.reginfo.gov, click on Information Collection Review.
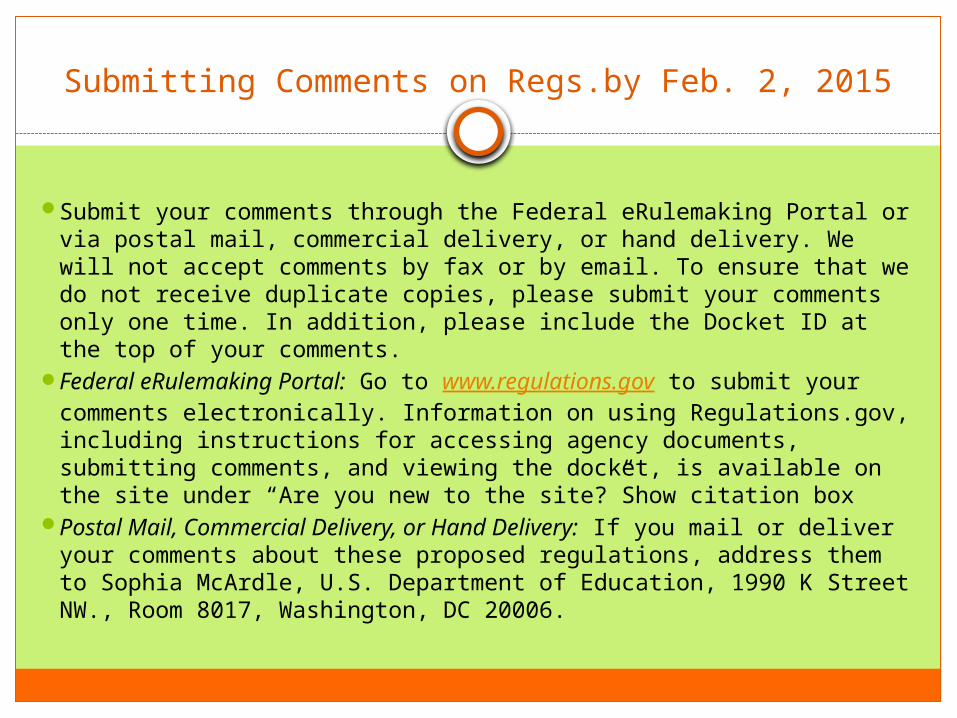
Submitting Comments on Regs.by Feb. 2, 2015
Submit your comments through the Federal eRulemaking Portal or via postal mail, commercial delivery, or hand delivery. We will not accept comments by fax or by email. To ensure that we do not receive duplicate copies, please submit your comments only one time. In addition, please include the Docket ID at the top of your comments.
Federal eRulemaking Portal: Go to www.regulations.gov to submit your comments electronically. Information on using Regulations.gov, including instructions for accessing agency documents, submitting comments, and viewing the docket, is available on the site under “Are you new to the site?”Show citation box
Postal Mail, Commercial Delivery, or Hand Delivery: If you mail or deliver your comments about these proposed regulations, address them to Sophia McArdle, U.S. Department of Education, 1990 K Street NW., Room 8017, Washington, DC 20006.

For Your Consideration
Will these regulations result in stronger teacher preparation programs?
What might the unintended consequences be – positive and negative?
Is your institution/state/entity able to absorb the cost/work requirements? Will your state be able to provide the additional support needed in relation to the cost and work to implement the regs?
How would this new proposal interact with current state/institutional decision making/authority?

Next Steps
Read the proposal carefullyShare broadly with your
colleagues/networks/constituents/stakeholders
Discuss potential impact broadlyAnalyze impact on your program/stateBe in touch with the organizations you
affiliate withConfer with your local/state stakeholders –
legislators/governors/Presidents and provostsSubmit comments by Jan. 2 and/or by Feb. 2