issue paper: equalization - gadoe georgia department of education
TRANSCRIPT

Issue Paper: EqualizationIssue Paper: EqualizationIssue Paper: EqualizationIssue Paper: Equalization
1

� What are they?◦ Equalization grants are additional aid provided to
school systems above the core QBE formula earnings.
� Currently funded at $436 million (earnings exceed � Currently funded at $436 million (earnings exceed $600 million)
� Second largest grant in DOE budget
� Seventh largest program in the state budget
2

� Why do we provide them?
◦ Equalization is intended to narrow the gap between systems in terms of property tax wealth per pupil.
� Equalize educational opportunities across school districts. school districts.
� No expenditure controls – funds may be spent as needed by each system.
3

� How are funds earned?◦ Each year 134 of the 180 systems (75%) receive
an equalization grant.
◦ The amount of the grant received each year is determined by a system’s property tax wealth per determined by a system’s property tax wealth per weighted FTE in relation to the benchmark system and effort in terms of a school system’s millage.
◦ There are two key components to Equalization
� Property tax wealth rankings per weighted FTE
� Earnings each system receives based on their taxing effort
4

� Wealth Rankings◦ System property tax wealth and rank is determined
based on the most recent equalized tax digest (less exemptions).
� Annual Sales Ratio Study by Department of Audits
◦ The equalized digest is then divided by the average weighted FTE for that system in the year of the digest weighted FTE for that system in the year of the digest to determine property wealth per weighted FTE for each system.
5

� Wealth Rankings◦ Systems are then ranked from highest to lowest based
on the amount their tax digest generates per weighted FTE.
◦ This is how the state determines who is eligible for an Equalization grant. The school system that is the 75thEqualization grant. The school system that is the 75th
percentile becomes the benchmark.
� The benchmark system and those wealthier do not receive an Equalization grant.
� The systems that fall below the benchmark are eligible for an Equalization grant.
6

� Reward for Effort◦ The actual earnings a system will receive for
Equalization is based on the wealth gap between each system and the benchmark and the amount of effort a system puts into generating local funds via their effective mills. their effective mills.
� Effective mills – All local tax revenues divided by the assessed valuation and multiplied by 1,000.
7
� Reward for Effort◦ Each system will receive a grant that equals the
wealth difference from the benchmark times the number of eligible mills (up to 15) times the weighted FTE.
The higher a system’s effective mills, the larger the ◦ The higher a system’s effective mills, the larger the grant they will receive.
◦ This is what makes Equalization a “reward for effort program”.
8

Digest Wealth Equalized Eligible Weighted Total
Percentile System Per Mill Per WFTE Difference Mills FTEs Grant Earnings
100 Greene 747.81$ N/A 0
76 Warren 187.92$ N/A 0
75 Quitman 176.25$ Benchmark 0
9
74 Cherokee 175.23$ 1.02 11.07 52,585 593,758$
50 Thomas 133.79$ 42.46 6.98 6,491 1,923,743$
25 Johnson 110.39$ 65.86 9.01 1,466 869,922$
0 Pelham City 24.21$ 152.04 12.59 1,904 3,644,606$
Equalization Calculation: Difference X Eligible Mills X FTEs = Earnings
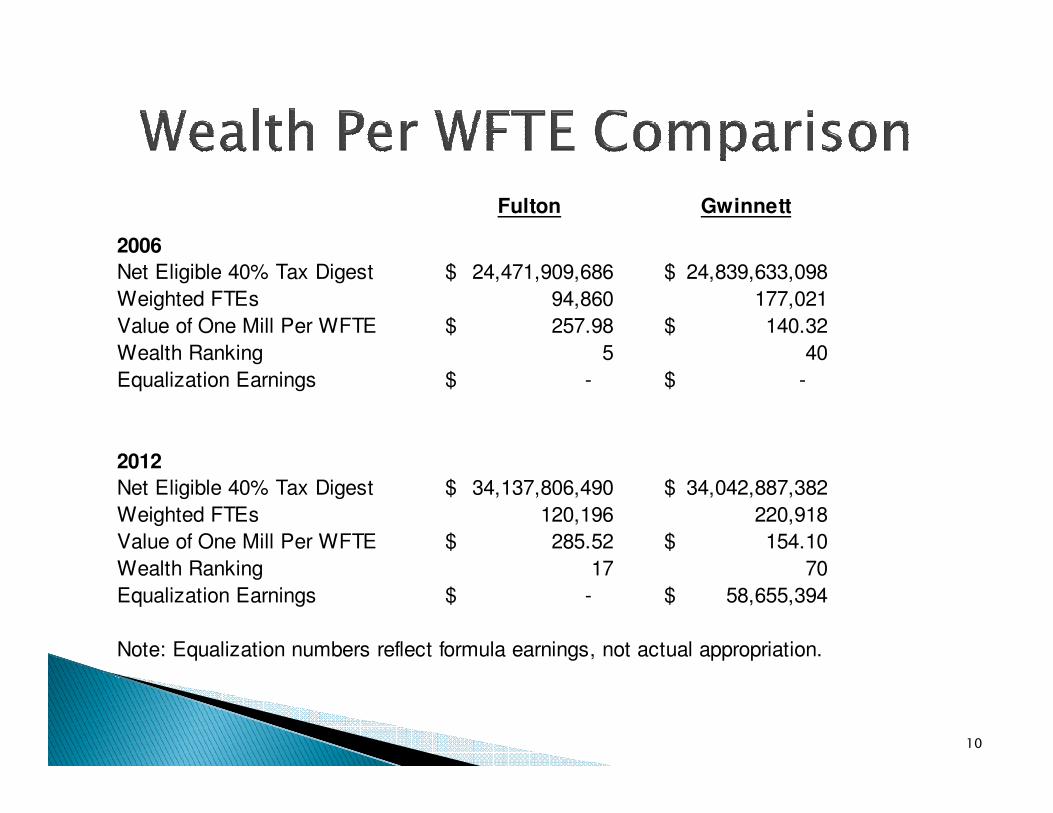
Fulton Gwinnett
2006
Net Eligible 40% Tax Digest 24,471,909,686$ 24,839,633,098$
Weighted FTEs 94,860 177,021
Value of One Mill Per WFTE 257.98$ 140.32$
Wealth Ranking 5 40
Equalization Earnings -$ -$
10
2012
Net Eligible 40% Tax Digest 34,137,806,490$ 34,042,887,382$
Weighted FTEs 120,196 220,918
Value of One Mill Per WFTE 285.52$ 154.10$
Wealth Ranking 17 70
Equalization Earnings -$ 58,655,394$
Note: Equalization numbers reflect formula earnings, not actual appropriation.

Quitman - 75th Pelham City Difference
Value of One Mill Per WFTE 176.25 24.21
Weighted FTEs 458 1,912
QBE Earnings 2,301,847 8,168,893
Local Five Mill Share (415,807) (235,444)
Equalization 0 3,643,539
Other Local Revenue 1,027,969 828,164
11
Total 2,914,009 12,405,152
Per WFTE With Equalization 6,362.47 6,488.05 125.59
Per WFTE Without Equalization 6,362.47 4,582.43 (1,780.03)
Note: Shows full earnings for QBE, LFMS and Equalization - not actual appropriation

� Equalization was first funded in FY1987 at a cost of $84 million
◦ Equalized to the 90th Percentile
◦ Recognized 3 mills
� In FY1990 the state recognized an extra .25 mill –for a total of 3.25 millsfor a total of 3.25 mills
� HB 1187 in 2000 made major changes to Equalization
◦ Equalize to the 75th Percentile (phased in over 5 years)
◦ Recognize up to 15 mills (reward for effort)
◦ Provide a mid-term adjustment for systems that increase millage
12

$400,000,000
$500,000,000
$600,000,000
$700,000,000
Equalize to 90th percentileand 3.25
HB 1187: Equalize to 75th percentile and up to15 mills. Also provide a midterm adjustment for school systems that increase millage.
13
$0
$100,000,000
$200,000,000
$300,000,000
$400,000,000 and 3.25 mills

� In recent years, the amount of funds that Equalization has earned according to the current formula has exceeded the state’s ability to pay for the full grant.
� Since FY10, the state has funded the grant at $436 million – despite earnings that exceed well over $600 million. Also, no mid-term adjustment has been million. Also, no mid-term adjustment has been provided.
� In FY12, Equalization earnings were $641 million. Actual appropriations were 68% of earnings.
� This has lead to a proration in formula earnings without any regard given to the wealth rankings – meaning the poorest system will still receive the same percentage of the grant as systems that rank higher in wealth.
14

$400,000,000
$500,000,000
$600,000,000
$700,000,000
15
$0
$100,000,000
$200,000,000
$300,000,000
Appropriation
Earnings

� Sustainability◦ Growth exceeds state’s ability to pay
� Predictability◦ Lack of predictability in earnings causes difficultly
for both the state and school systemsfor both the state and school systems
� Transparency◦ While the premise of the formula is easy to
understand, some of the calculations are not
� Meet program’s objective◦ Ensure that the state’s limited resources make it to
the systems that need it the most
16

� Equalize to statewide average◦ Straight average
◦ Remove outliers, then average
◦ Equalize to a percent of the state average (ie, 95%)
� Require a minimum millage for participation� Require a minimum millage for participation
� Cap number of mills we equalize
� Consider median family income
� Graduated level of funding so that the systems with the lowest wealth would receive a higher percentage of funding
17