georgia department of education (gadoe) · georgia department of education (gadoe) ... technical...
TRANSCRIPT

Georgia Department of Education (GaDOE)
Indicator 17: State Systemic Improvement Plan (SSIP)
Submitted to the Office of Special Education Programs (OSEP) Debbie Gay, State Director
Division for Special Education Services and Supports
April 1, 2016

i
Georgia’s State Systemic Improvement Plan (SSIP)
TABLE OF CONTENTS
Indicator 17: State Systemic Improvement Plan (Revisions)………………………………...…….……...Page 1
Historical Data and Targets (Revisions)……………..………………………………………..………..….Page 1
Explanation of Changes (Revisions).…………………..……………………………………..………..…..Page 1
Targets: Description of Stakeholder Input (Revisions)………………………………………..…..….........Page 2
Overview (New)………………………………………………………………………………...….………Page 5
Data Analysis (Revisions)……………………………………………………………………………….....Page 6
Analysis of State Infrastructure to Support Improvement and Build Capacity (Revisions).......…………..Page 19
State-identified Measurable Result(s) for Children with Disabilities (Revisions)………………………....Page 22
Selection of Coherent Improvement Strategies (Revisions)………………………………….……………Page 23
Theory of Action (Revisions)……………………………………………………………………………...Page 31
Phase II: Infrastructure Development (New)………………………….………………………………..….Page 32
Phase II: Support for LEA Implementation of Evidence-Based Practices (New)……………………..…..Page 42
Phase II: Evaluation (New)……………………………………………………………………….………..Page 45
Phase II: Technical Assistance and Support (New)……………………………………….……………....Page 54
Appendix A (Georgia SSIP Evaluation Plan) (New)…………………………………………………………………………………..Page 55
Note – Redlined content denotes revision in sections previously submitted during Phase I.
Note – Blue text boxes include OSEP’s federal guidance used to guide this process.

1 | P a g e
Indicator 17: State Systemic Improvement Plan
Historical Data and Targets
Historical Data
Baseline Year: FFY 2013
FFY 2013 2014
Target ≥ 41.00%
Data 39.46% 59.35%
Key: Gray – Data Prior to Baseline Yellow – Baseline Blue – Data Update
FFY 2014 – FFY 2018 Targets
FFY 2014 2015 2016 2017 2018
Target ≥ 41.00% 60.5% 61.50% 63.00% 65.00%
Explanation of Changes Georgia’s State-identified Measurable Result (SIMR) is based on the Annual Event Graduation Rate for
Students with Disabilities (SWD). During FFY 2014, Georgia experienced a significant increase in graduation
for All Students and Students with Disabilities. Policy changes require that all students satisfy course
requirements for graduation, earning a minimum of 23 credits in specific content areas but have eliminated the
high stakes testing. March 30, 2015, Governor Nathan Deal signed House Bill 91 into law, which states that
students shall no longer be required to earn a passing score on any graduation tests to earn a high school
diploma.
Georgia's baseline, representing fifty districts receiving intensive technical assistance, was 39.46%, which
increased 19.89 percentage points to 59.35% in FFY 2014. Georgia met its FFY 2014 target while exceeding
the FFY 2018 target, which required stakeholder engagement to reset the targets. The State did not establish
new baseline because there were no changes in calculation for either the Cohort Graduation Rate or the
Annual Event Graduation Rate. Georgia’s revised targets demonstrate incremental increases because
stakeholders do not anticipate statistically significant gains that are commensurate with the FFY 2014 data.
Georgia's graduation rate increased consistently for the 4-Year Adjusted Cohort Rate as compared to the Annual
Event Graduation Rate. The FFY 2014 4-Year Adjusted Cohort Graduation Rate for Students with Disabilities
increased by 17.8 percentage points (54.3%). The Cohort Graduation Rate for All Students increased by 6
percentage points, (78.5%).
Monitoring Priority: General Supervision
The State’s SPP/APR includes a State Systemic Improvement Plan (SSIP) that meets the requirements
set forth for this indicator.

P a g e 2
Targets: Description of Stakeholder Input
The Georgia Department of Education authentically engaged stakeholders to provide input for the targets and
activities in the State Performance Plan (SPP) and Annual Performance Report (APR): State Advisory Panel
(SAP) for Special Education, Local Education Agencies (LEAs), Directors of Special Education, and Division
staff and personnel from other Divisions at the Department. During Phase I of Georgia’s State Systemic
Improvement Plan (SSIP), a diverse group of stakeholders assisted the State in analyzing trend data, examining
State Infrastructure, selecting a State-identified Measurable Result for Children with Disabilities, and
identifying Coherent Improvement Strategies. Ultimately, Georgia developed a Theory of Action that
represented varied perspectives that incorporated a logical flow of overarching activities.
Georgia has chosen to brand its SSIP as “Student Success: Imagine the Possibilities!” A public webpage has
been created for Georgia’s SSIP to engage the public, share Technical Assistance Resources, and obtain
ongoing feedback. The webpage is accessible by using the following link: Georgia's Student Success
Webpage. A SSIP Video was created to provide awareness for the work during Phase I. Georgia has convened
a Stakeholder Engagement Committee that has been critical for the implementation of Phase I and will continue
to support Georgia's efforts to implement and monitor all phases of the SSIP. Additional information
concerning general stakeholder involvement can be found in the Introduction of the SPP/APR.
Numerous internal and external stakeholders supported Phase I of the SSIP process.
Intradepartmental Stakeholders: (1) Georgia State Board of Education; (2) Division for School Improvement;
(3) Title I Part A; (4) Division for Curriculum and Instruction; (5) Division for Accountability and Assessment;
(6) Division for Policy; (7) Division for Data Collections; (8) Career, Technical and Agricultural Education
(CTAE); (9) School Counseling Program; (10) Division for Teacher/Leader Effectiveness; (11) Safe and Drug
Free Schools; (12) Race to the Top; (13) Title III (English Speakers of Other Languages); (14) 619
Young Children Coordinator, and (15) Division for Special Education
External Stakeholders: (1) Institutions of Higher Education; (2) Georgia Learning Resources System (GLRS);
(3) Regional Educational Service Agency (RESA); (4) Georgia's State Personnel Development Grant
Leadership; (5) Georgia Parent Training Information Center (PTI); (6) Georgia Vocational Rehabilitation
Agency; (7) Special Education Parent Mentors; (8) Special Education Directors; (9) State Advisory Panel
(SAP); (10) Special Education Teachers; (11) Part C: Babies Can't Wait Agency; (12) Governor Office of
Student Achievement (GOSA); and (13) Georgia Department of Early Care and Learning (DECAL)
In general, Georgia demonstrated a strong commitment to engage internal and external stakeholders during
Phase I. Based on evidence, documentation, and feedback, the State rated its “Depth of Interaction” between
the “Informing Level” (Sharing/Sending) and “Networking Level” (Exchanging) as measured by the IDEA
Partnership Leading by Convening Rubric. Primarily, the engagement activities created a universal awareness
of the State Systemic Improvement Plan requirement and other critical sources of evidence to clearly identify
specific needs for student results. During the latter part of Phase I, the Depth of Interaction progressed to
stronger networking practices and exchanges.
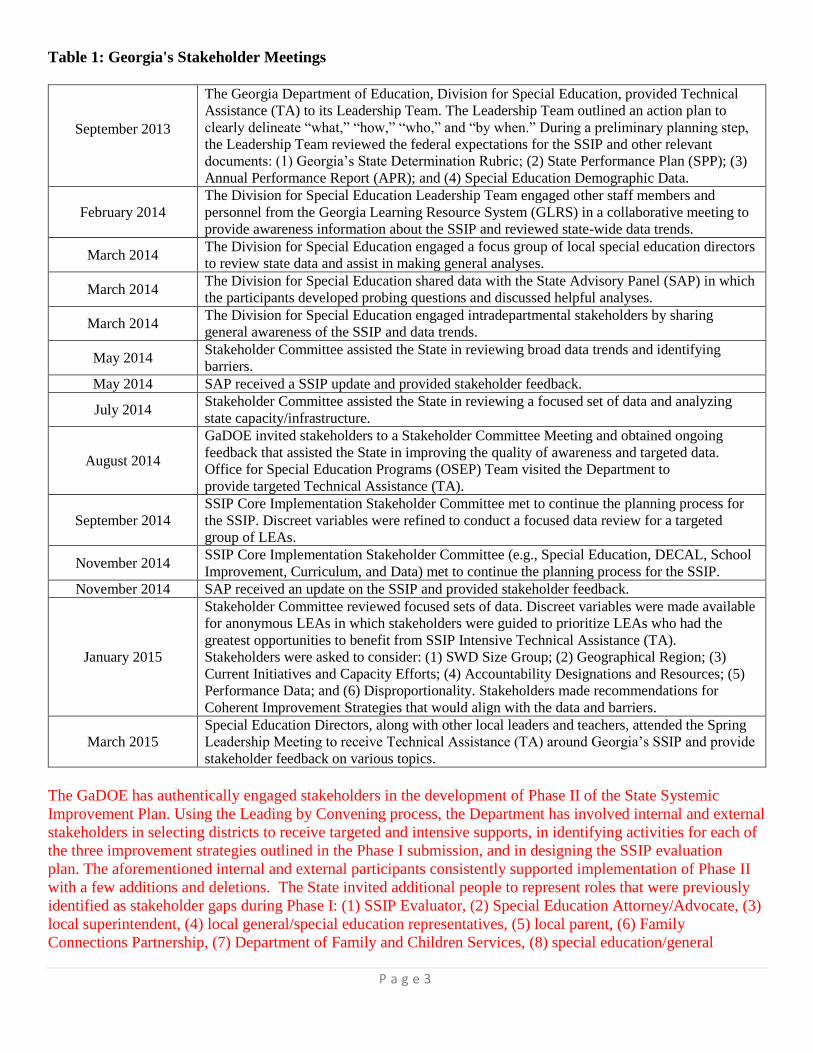
Table 1 summarizes a sampling of opportunities to authentically engage stakeholders during Phase 1. Initially
the Stakeholder Committee reviewed robust data sources such as 618 Data, Annual Performance Report data,
and demographic data for the "All Students" group and Students with Disabilities (SWD); they also reviewed
disaggregated data to enable the State to identify targeted needs for specific students and LEAs.
P a g e 3
Table 1: Georgia's Stakeholder Meetings
September 2013
The Georgia Department of Education, Division for Special Education, provided Technical
Assistance (TA) to its Leadership Team. The Leadership Team outlined an action plan to
clearly delineate “what,” “how,” “who,” and “by when.” During a preliminary planning step,
the Leadership Team reviewed the federal expectations for the SSIP and other relevant
documents: (1) Georgia’s State Determination Rubric; (2) State Performance Plan (SPP); (3)
Annual Performance Report (APR); and (4) Special Education Demographic Data.
February 2014
The Division for Special Education Leadership Team engaged other staff members and
personnel from the Georgia Learning Resource System (GLRS) in a collaborative meeting to
provide awareness information about the SSIP and reviewed state-wide data trends.
March 2014 The Division for Special Education engaged a focus group of local special education directors
to review state data and assist in making general analyses.
March 2014 The Division for Special Education shared data with the State Advisory Panel (SAP) in which
the participants developed probing questions and discussed helpful analyses.
March 2014 The Division for Special Education engaged intradepartmental stakeholders by sharing
general awareness of the SSIP and data trends.
May 2014 Stakeholder Committee assisted the State in reviewing broad data trends and identifying
barriers.
May 2014 SAP received a SSIP update and provided stakeholder feedback.
July 2014 Stakeholder Committee assisted the State in reviewing a focused set of data and analyzing
state capacity/infrastructure.
August 2014
GaDOE invited stakeholders to a Stakeholder Committee Meeting and obtained ongoing
feedback that assisted the State in improving the quality of awareness and targeted data.
Office for Special Education Programs (OSEP) Team visited the Department to
provide targeted Technical Assistance (TA).
September 2014
SSIP Core Implementation Stakeholder Committee met to continue the planning process for
the SSIP. Discreet variables were refined to conduct a focused data review for a targeted
group of LEAs.
November 2014 SSIP Core Implementation Stakeholder Committee (e.g., Special Education, DECAL, School
Improvement, Curriculum, and Data) met to continue the planning process for the SSIP.
November 2014 SAP received an update on the SSIP and provided stakeholder feedback.
January 2015
Stakeholder Committee reviewed focused sets of data. Discreet variables were made available
for anonymous LEAs in which stakeholders were guided to prioritize LEAs who had the
greatest opportunities to benefit from SSIP Intensive Technical Assistance (TA).
Stakeholders were asked to consider: (1) SWD Size Group; (2) Geographical Region; (3)
Current Initiatives and Capacity Efforts; (4) Accountability Designations and Resources; (5)
Performance Data; and (6) Disproportionality. Stakeholders made recommendations for
Coherent Improvement Strategies that would align with the data and barriers.
March 2015
Special Education Directors, along with other local leaders and teachers, attended the Spring
Leadership Meeting to receive Technical Assistance (TA) around Georgia’s SSIP and provide
stakeholder feedback on various topics.
The GaDOE has authentically engaged stakeholders in the development of Phase II of the State Systemic
Improvement Plan. Using the Leading by Convening process, the Department has involved internal and external
stakeholders in selecting districts to receive targeted and intensive supports, in identifying activities for each of
the three improvement strategies outlined in the Phase I submission, and in designing the SSIP evaluation
plan. The aforementioned internal and external participants consistently supported implementation of Phase II
with a few additions and deletions. The State invited additional people to represent roles that were previously
identified as stakeholder gaps during Phase I: (1) SSIP Evaluator, (2) Special Education Attorney/Advocate, (3)
local superintendent, (4) local general/special education representatives, (5) local parent, (6) Family
Connections Partnership, (7) Department of Family and Children Services, (8) special education/general

P a g e 4
education teachers, and (9) local guidance counselor. Stakeholders who represented Georgia’s Race to the Top
were no longer available during Phase II based on the grant funding period.
Georgia, in partnership with Silvia DeRuvo (NCSI State Contact), convened a formal stakeholder meeting
during November 2015 in which thirty-seven stakeholders attended the meeting and collaborated on
the following topics: SSIP Updates, Curriculum and Other Policy Updates, Data Review, Phase II
Requirements, Phase II Evaluation Plan and Next Steps. The facilitators provided stakeholders with guiding
questions based on the selected topic areas and summarized the general feedback to further inform Phase II.
Georgia’s Student Success Updates: Primarily, the facilitator shared quick updates of the Phase I
implementation. The State used stakeholders to target fifty districts to receive intensive technical
assistance during Phase I; however, the technical assistance began during Phase II.
Curriculum and Other Policy Updates: The facilitator provided a general overview of policy changes
that directly impact the graduation rate. Georgia experienced a significant increase in the percent of
Students with Disabilities who graduated with a general education diploma. The increase was
commensurate with the improved graduation rate for all students. Stakeholders required additional
insight of the policy changes and consideration of other barriers that should be addressed through policy.
Data Review: Georgia’s FFY 2014 data exceeded the FFY 2018 targets. The stakeholders agreed that
Georgia should not reestablish baseline since the measurement construct had not changed. Stakeholders
made suggestions to reset the targets for FFY 2015 and beyond.
SSIP Phase II Requirements and Evaluation Plan: The facilitators shared clear expectations of the Phase
II roll out and highlights of the SSIP evaluation plan. Stakeholders provided feedback that strengthened
the evaluation plan such as specific questions and outcomes.
Next Steps: Finally, stakeholders discussed the strengths and weaknesses of Georgia’s Phase I, made
recommendations for Phase II and shared additional feedback via an online evaluation link.
In addition to the formal stakeholder meeting, the State utilized other stakeholder engagement strategies.
The State Director for Special Education participates on the State Superintendent's Executive Cabinet.
Georgia developed a new state-wide strategic plan in which SSIP has been included. Also, Special
Education participates in a cross-department collaborative meeting with other federal programs.
The SSIP State Leadership Team represents diverse leadership across the Department along with several
external stakeholders. The Leadership Team assumes the role of guiding the SSIP work, overseeing the
development of state and regional infrastructure, and advising the State of necessary feedback.
The SSIP State Implementation Teams provide critical feedback directly aligned with the state-
identified barriers and local implementation of the SSIP.
The State Special Education Director attends ongoing meetings with the RESA to encourage seamless
alignment of resources and technical assistance.
The GLRS Regional Teams (technical assistance providers) are critical stakeholders and often
communicate the needs and barriers identified in the local districts.
The Department hosts quarterly webinars for leadership teams (in the fifty districts) and GLRS Regional
Teams to support infrastructure development, local implementation, and consistent communication.
The SSIP Webpage allows any stakeholder to share ongoing feedback via a feedback document.
The State Advisory Panel receives ongoing updates and provides invaluable feedback.
A subset of the stakeholder committee convened to provide the SSIP Evaluator with specific guidance
that strengthened the development of Georgia’s evaluation plan.
The State Special Education Director engages stakeholders using ongoing forums and conferences:
Special Education Directors’ Forum, Georgia Compensatory Educational Leaders (GCEL) Conference,
Georgia Council of Administrators of Special Education (GCASE) Conference, Georgia Curriculum
Directors' Conference, and Georgia School Counselors' Conference.

P a g e 5
Overview
Georgia’s State Systemic Improvement Plan (SSIP) has been coined as Student Success: Imagine the
Possibilities. Based on stakeholder engagement and review of data, the State identified three main barriers to
student success that ultimately impacted school completion: (1) Access to the General Curriculum; (2) Access
to Positive School Climate; and (3) Access to Specially Designed Instruction. More specifically, the State must
improve capacity for local districts and schools to address various challenges around curriculum, instruction and
climate. Why do local districts and schools struggle to expose students to effective instruction and engaging
school climate? Stakeholders noted inconsistent, failing infrastructure as the root cause of the problem. The
article, “Addressing Dropout Related Factors at the Local Level: Recommendations for Administrators”
provided a framework by which local administrators should address school completion: (1) Efficient
Infrastructure, (2) Effective Instruction, and (2) Engaging School Climate.
Local districts must be able to support implementation of evidence-based practices in their schools; however,
district leadership teams must be able to select appropriate evidence-based practices and support these practices
with efficient infrastructure. During Phase I, the Department utilized quantitative and qualitative data to clearly
identify why these concerns were happening in local districts. District leadership teams required additional
supports to engage critical stakeholders, analyze various data, and select evidence-based practices. State
leadership from multiple federal programs noted similar concerns. Stakeholders strongly suggested that
Georgia’s SSIP address infrastructure development, as well as, the selection and implementation of evidence-
based practices. Thus, the Student Success Process supports district/school infrastructure and the
selection/implementation of evidence-based practices: (1) Engage stakeholders, (2) Examine local capacity and
infrastructure, (3) Review strengths and weaknesses of the General Supervision System, (4) Analyze salient
data trends, (5) Use the data to identify local barriers, and (6) Develop short-term and long-term actionable
steps that will support local implementation of evidence-based practices. Georgia worked with the GLRS
Regional Teams to develop and align resources to support local districts in implementing these steps. More
importantly, a guidance document has been developed to clearly communicate expectations and ensure fidelity
of implementation among districts.
Currently, Georgia's SSIP addresses two broad Coherent Improvement Strategies that will ultimately result in
improved graduation outcomes for all students-including students with disabilities. Georgia’s Coherent
Improvement Strategies were revised since the April 1, 2015 submission based on implementation progress
and stakeholder feedback.
1. Coherent Improvement Strategy One: Improve State and Regional Infrastructure to better support
districts to implement and scale up evidence-based practices that will improve graduation rates for all
students-including SWD
2. Coherent Improvement Strategy Two: Improve district infrastructure and implementation of
evidence-based practices in fifty districts identified to receive intensive technical assistance to improve
effective instruction, engaging school climate, and transition
During Phase I, Georgia identified critical gaps in its infrastructure at the state, regional, district, and school
levels that must be addressed to improve student success. More importantly, Georgia realized that the district-
level infrastructure thrives within context of well-developed and aligned state and regional infrastructure. Phase
I and part of Phase II have prioritized improving the state and regional infrastructure to better support district
infrastructure during the latter part of Phase II. Additional information about the Coherent Improvement
Strategies can be found in "Selection of Coherent Improvement Strategies."

P a g e 6
Data Analysis
The Georgia Department of Education (GaDOE) has engaged internal and external stakeholders to provide
awareness of the State Systemic Improvement Plan (SSIP) and review various sources of data necessary to
implement Phase I. Georgia believes that its data system is of high quality and can be leveraged as strength for
the SSIP work. The perception data supported more of a concern with data access and usage, which is an area in
need of improvement. LEAs and schools have access to many different types of data sets that could inform local
improvement efforts. However, local leaders communicated concerns with appropriate access and use of the
data. In many instances, the data sets are available across multiple systems and require a general understanding
of accountability constructs. The GaDOE has developed a Data Toolkit that will be used as technical assistance
for the Coherent Improvement Strategy to build capacity in this area.
Another area of improvement relative to data is an analysis across multiple variables. During Phase I, Georgia
was unable to disaggregate the data for variables by race, gender, disability and poverty. During Phase II,
stakeholders noted that Georgia’s total student enrollment eligible for free/reduced lunch increased to 62%;
however, total White students enrolled showed the largest discrepancy as compared to percent of White students
who were economically disadvantaged. In contrast, percent of economically disadvantaged students represented
a large majority for all other racial/ethnic groups. While we may readily note that black SWD experience less
positive outcomes with school completion, the State was unable to disaggregate the data by black males with
disabilities as compared to black females with disabilities. Stakeholders' data analyses and feedback were
paramount in clearly identifying barriers, analyzing current capacity and infrastructure, selecting the State-
identified Measurable Result (SIMR), and developing appropriate Coherent Improvement Strategies. The varied
perspectives provided an in-depth opportunity to create inclusive strategies to change outcomes for students.
Georgia Department of Education (GaDOE) has a nationally recognized partnership among various Federal
Programs and Initiatives. As an example, the work of the SSIP will impact and improve outcomes for all
students. Georgia’s SSIP has been written into the Elementary Secondary Education Act (ESEA) Wavier and
aligns with the work of other federal programs; SSIP will be embedded in the Every Student Succeed Act
(ESSA), as well. Stakeholders believe that this inclusion demonstrates a heightened commitment from the
Department to share this work among programs and divisions.
Stakeholders began a broad data analysis by reviewing general demographic data for students. During FFY
2013, Georgia's total student enrollment was 1,723,439 to include 190,965 SWD depicting a disability
incidence rate of 10.8%. The State of Georgia's demographic data have changed over the past 10 years because
the White subgroup represented 49% of the FFY 2004 total enrollment and 43% of the FFY 2013 total
enrollment; black students represented 38% of the FFY 2004 total enrollment and 37% of the FFY 2013 total
enrollment. Other racial/ethnic groups have continued to increase such as the Hispanic population. The
distribution of racial/ethnic groups represented in the total enrollment is commensurate with the distribution of
A description of how the State identified and analyzed key data, including data from SPP/APR indicators, 618
data collections, and other available data as applicable, to: (1) select the State-identified Measurable Result(s) for
Children with Disabilities, and (2) identify root causes contributing to low performance. The description must
include information about how the data were disaggregated by multiple variables (e.g., LEA, region,
race/ethnicity, gender, disability category, placement, etc.). As part of its data analysis, the State should also
consider compliance data and whether those data present potential barriers to improvement. In addition, if the
State identifies any concerns about the quality of the data, the description must include how the State will address
these concerns. Finally, if additional data are needed, the description should include the methods and timelines to
collect and analyze the additional data.

P a g e 7
racial/ethnic groups represented in the special education enrollment. The percent of students eligible for free
and reduced lunch has consistently increased from 47.88% in FFY 2004 to 62.16% in FFY 2013. Stakeholders
discussed the unique barriers that directly correlate with high poverty and how pervasive those barriers are
throughout the state. Based on FFY 2012 data, schools identified in the highest poverty quartile (23,000
teachers) demonstrated a 3.9 difference for the Mean Student Growth Percentile as compared to schools
identified in the lowest poverty quartile (33,000 teachers). Essentially, students in schools with high poverty
demonstrated less growth than students in schools with low poverty. Georgia's student enrollment showed a
declining enrollment trend across grades. The FFY 2013 fall count identified 136,658 kindergarten students and
103,000 12th Grade students. Why might there be such a declining enrollment during later grades? The
Stakeholder Committee hypothesized that this trend was the negative impact of Georgia’s dropout rate.
Although Georgia has 200 Local Educational Agencies (LEAs), 74.1% of the State’s SWD enrollment is in
21.9% of the LEAs. The 3-21enrollment has increased from 177,070 (FFY 2009) to 190,965 (FFY 2013), and
the composition of disability categories has changed overtime. Stakeholders noted decreases in Intellectual
Disabilities (-1.86%), Emotional Behavioral Disorders (-2.97%) and Speech/Language Impairment (-2.44); yet,
the change rate has increased for Autism (1.97%) and Significant Developmental Delay (2.44%). As a critical
data point for stakeholders, Specific Learning Disabilities (33%), Other Health Impaired (15%) and
Speech/Language Impairment (15%) represented the highest enrollment categories. There was a disaggregated
review of disability categories by racial/ethnic groups and gender in which Other Health Impaired and
Intellectual Disabilities demonstrated the greatest discrepancies. Approximately 10,000 black students were
identified as OHI compared to approximately 15,000 White students. Stakeholders hypothesized that this
finding could be an access issue based on the medical requirement outlined in the OHI Eligibility Rule. With
increased poverty for specific racial/ethnic groups, did all students have access to health care and physicians to
support eligibility in this area?
In the Intellectual Disability catchment, the discrepancy was observed for students identified as having a Mild
Intellectual Disability (MID). For example, >5000 black students were identified as compared to approximately
2500 White students. In general, students with some type of Intellectual Disability made up 8.9% of the total
SWD population and <1% of the total student enrollment. Poverty has increased for the Black Subgroup;
unfortunately, these variables directly impact school readiness and acquisition of skills. Consequently, schools
with high poverty may struggle to provide appropriate supplemental services and supports for all students thus
complicating appropriate eligibility determination for students with a MID.
The preliminary demographic data review was critical for stakeholders because there was a hypothesis that
SWD could demonstrate improved outcomes with the appropriate supports and high expectations. Based on
perception data, often teachers, leaders, and communities are misinformed about the true nature of various
disability categories. While the Intellectual Disability category is defined as students having “significant sub
average intellectual functioning,” there was an overgeneralization that all students with disabilities had a
significant sub-average intellectual functioning. Stakeholders shared that the State should consider TA
opportunities to help LEAs and communities better understand “adverse educational impact” and specially
designed instruction (SDI). At the same time, Georgia believes that students with Intellectual Disabilities can
and must experience improved outcomes too. Currently, the State has robust technical assistance and resources
to support students with severe Intellectual Disabilities; however, additional assistance may be needed for
students with MID.
With this understanding, stakeholders requested performance data disaggregated by disability categories to
determine who the underperforming SWD were in the State of Georgia. Stakeholders reviewed FFY 2013
Performance 1 Scores (Not Meeting Standard) of 12th grade students by disability categories on accountability
assessments. The top three disability categories with non-proficient scores were students with Specific Learning
Disabilities (SLD), Other Health Impaired (OHI), and Emotional/Behavioral Disorders (EBD). The distribution

P a g e 8
of disability categories had comparable similarities with Georgia’s special education enrollment since SLD and
OHI were the highest enrollment categories.
Graph 1. FFY 2013 Performance 1 Scores by Disability Categories
Stakeholders requested additional data to determine how pervasive this pattern was for other grade levels.
When considering similar data for 3rd Grade Students, stakeholders observed a similar pattern in which SLD
and OHI had the highest percent (Not Meeting Standard); however, Speech/Language Impairment (SLI)
represented the 3rd largest catchment. Why might these disability categories demonstrate such challenges with
access to the curriculum? Perhaps in addition to the concerns with general curriculum, were these students
receiving specially designed instruction? More often, students identified as SLD, OHI and SLI comprised a
large percent of the students who received instruction in the general education class greater than 80% of the
day.
Graph 2. FFY 2013 Performance 1 Scores by Disability Categories

P a g e 9
During Phase II, the SSIP State Leadership Team invited external stakeholders to obtain additional information
specific to specially designed instruction.
Table 2. Stakeholder Feedback about Special Designed Instruction
Stakeholder Feedback Questions Summary of Findings
Was there a consistent expectation
for specially designed instruction?
Based on prior technical assistance, local districts had access to
general guidance that supported a compliant explanation of special
designed instruction. Georgia previously revised its General
Supervision System and included this explanation in that guidance;
yet, local districts required additional supports for implementation at
the teacher and student levels.
What kinds of training/resources
supported access to specially
designed instruction at the local
level?
Most of the resources supported a general framework for inclusion
and specially designed instruction but lacked specific references for
teacher-level implementation.
Are students with disabilities who
receive instruction in the general
education environment less likely
or more like to access effective
specially designed instruction?
GLRS Regional Teams provide targeted supports for inclusion and
co-teaching and shared qualitative feedback with the State.
Specially designed instruction demonstrated consistent challenges in
the general education environment and other restrictive
environments. Interestingly enough, school teams that demonstrated
highly effective co-teaching parity and other practices still required
additional supports with specially designed instruction.
How does this information correlate
with the large percent of students
with disabilities who receive
instruction in the general education
setting?
Stakeholders concluded that much of the co-teaching training and
resources focused on adult variables such as scheduling and parity.
A hypothesis was formed that an increased emphasis on student
needs and specially designed instruction would be a logical next
step.
Stakeholders reviewed data from Georgia’s Formal Complaint Process to determine the most prevalent trends
during FFY 2012 and FFY 2013. Considering the disability categories that demonstrated the greatest challenge
with access to the curriculum, the Committee believed that these trends could help Georgia determine the
negative impact of noncompliant practices. During FFY 2013, GaDOE made forty-eight findings across twenty-
one LEAs. In summary, the most prevalent findings were about the development, review, and implementation
of the IEP. The FFY 2012 Formal Complaint data demonstrated a similar trend but included the provision of
Free Appropriate Public Education (FAPE). Georgia’s Formal Complaint Findings can be reviewed in Table 3
below. Stakeholders expressed concerns about the critical impact of these noncompliant practices on improved
outcomes for students and suggested targeted technical assistance be included in the SSIP.
During Phase II, stakeholders revisited this information that validated local districts would benefit from
additional resources and training specific to IEP development and implementation. The primary cause of this
problem was the need for more supports on specially designed instruction. Local IEP teams required appropriate
training to improve development and implementation of IEPs that appropriately addressed specially designed
instruction.
Also, the State is piloting Georgia’s IEP Team Meeting Facilitation in four school districts. IEP Team Meeting
Facilitation is an optional process, not required by the IDEA that state educational agencies (SEA) or school

P a g e 1 0
districts may provide to parents and schools. A facilitated IEP Team meeting is the same as any other IEP Team
meeting, except that a facilitator joins the meeting.
Table 3. Georgia’s Formal Complaint Findings
FFY 2013 Formal Complaint
Findings
Number of
Findings FFY 2012 Formal Complaint Findings
Number of
Findings
Implementation of the IEP 13 Implementation of the IEP 11
Development, review, and revision of
the IEP 9
Development, review, and revision of
the IEP 8
Evaluations and Reevaluations 7 Provision of a FAPE 4
IEP Team 4 Personnel, Facilities, & Caseloads 4
Procedural Safeguards Notice 3 Independent Educational Evaluation 3
Provision of a FAPE 2 Confidentiality 3
Child Find 2 Evaluations and Reevaluations 3
Prior notice by the public agency 1 Dispute Resolution 2
Confidentiality 1 IEP Team 2
Placements 1 Discipline Procedures 2
Discipline Procedures 1 Personnel Qualifications 1
Parent Participation 1 Determination of Eligibility 1
Enforceability of mediation agreement 1 Related Services 1
Personnel Qualifications 1 Implementation of the BIP 1
Amendment of records at parent’s
request 1 Least Restrictive Environment 1
Parent Participation 1
Placements 1
The next critical step was to review demographic data to support who graduated with a general education
diploma, and what percent of students dropped out of school. Considering Georgia's Four-Year Adjusted
Graduation Cohort, the "All Students" group consistently improved overtime. While the SWD group made
progress, the rate was not aggressive enough to significantly impact the performance gap in this area. During
FFY 2013, 5,027 SWD graduated with a general education diploma, and 1,777 SWD graduated with a special
education diploma-to include 1,108 males and 669 females. Males comprised almost twice the special education
enrollment as compared to females. While the Black subgroup represented 55.9% of the Students with
Disabilities who received a special education diploma, the Black subgroup represented 56.7% of the total
enrollment that received a Certificate of Attendance. Black students with disabilities and without disabilities did
not experience school completion with a general education diploma at a similar rate as the White subgroup.

P a g e 1 1
Table 4. Four Year Adjusted Cohort Graduation Rate Gap
FFY 2013 FFY 2012 FFY 2011 FFY 2010
All Students 72.5% 71.50% 69.73% 67.50%
Students with Disabilities 36.5% 35% 35.18% 29.80%
Gap 36.0 36.5% 34.55% 37.70%
The dropout rate decreased for both groups; however, the gap between "All Students" and SWD remained the
same for FFY 2011 and 2012. FFY 2013, Georgia’s 9–12 dropout count for SWD was 3,579; however, the 7-12
dropout count for SWD was 3,944, which was a difference of 365 SWD. FFY 2013, Georgia’s 9–12 dropout
count for the “All Students” group was 19,561; however, the 7–12 dropout count was 21,986, which was a
difference of 2,425 students. Over the course of four years, the “All Student” cumulative difference was 9,462
students. Why might so many students have dropped out during middle school years, and how has this barrier
impacted positive outcomes for students?
Table 5. Dropout Gap
FFY 2013 FFY 2012 FY 2011 FFY 2010
All Students 3.7% 3.6% 3.8% 3.7%
Students with Disabilities 5.9% 6.0% 6.2% 5.8%
Gap 2.2 2.4% 2.4% 2.1%
Georgia’s FFY 2013 Retention Data showed 56,406 (total student enrollment) were retained with at least
33,119 students being retained in Grades 9 – 12. Males comprised 57.66% of retained students while Black
students comprised 45.4%. Although there were notable negative trends for SWD, stakeholders noted that
Georgia’s Least Restrictive Environment data were 65% of SWD (Ages 6-21) receiving instruction in the
regular education environment >80% of the day. Many SWD received instruction inside the regular classroom;
yet, the general education environment did not have the presupposed positive impact on achievement. Was it the
reality that receiving access to the general curriculum in the Least Restrictive Environment did not really benefit
students? Or was the inclusive strategy being implemented with fidelity?
Stakeholders reviewed data for general education students who received interventions and supports-as
demonstrated by Student Support Team (SST) data. During FFY 2013, a minimum of 48,636 students received
Tier 3 (SST) supports at some point during the school year as represented in data submitted by a sampling of
schools. In Georgia, the Tier 3 level represents individualized supports for at-risk students in which a formal
team of educators, family and practitioners utilize the problem solving model to develop a targeted plan. The
SST convenes on a regular basis, monitors progress and ensures that at-risk students benefit from evidence-
based interventions and strategies. The distribution of racial/ethnic groups was commensurate with the state’s
total enrollment reflecting White Students (39%), Black Students (41%) and Hispanic Students (16%) as the
highest enrolled. Males composed 60% of students who received SST; this trend aligned similarly with
retention data and SWD enrollment.
GaDOE collected perception data via surveys and informal interviews. The perception data represented
stakeholders’ personal beliefs, feelings and actions and provided evidence to support concerns with
implementation of tiered supports and interventions. LEAs did not always have a systematic infrastructure to
meet the needs of administrators, teachers and students who required additional supports. The perception data
were further supported by Georgia’s review of LEAs to identify Disproportionality. During FFY 2012 and FFY

P a g e 1 2
2013, the State identified 38 districts as having Disproportionality (Identification, Placement, and Discipline)
that was the result of noncompliant policies, procedures, and practices. These noncompliant practices were
directly related to insufficient or inappropriate pre-referral interventions and supports for students. In general,
LEAs have barriers in providing access to the general curriculum for all students. Even when some students
require additional supplemental supports and/or interventions, LEAs demonstrate inconsistent practices to
enable access to prereferral interventions. As a consequence, some students might be referred to special
education without the appropriate benefits of interventions and supports. These capacity issues impacted
instruction and supports for all students.
How does this data relate to teacher effectiveness? Stakeholders requested state data for pilot implementation of
the Teacher Keys for Effectiveness System to determine if the sampling state data would support current
strengths and weaknesses. Georgia Statute requires that at least 50% of teachers’ and leaders’ evaluations
include at least 50% student growth. The desired level of performance is Level III, and Level IV exceeds this
expectation. Based on the FFY 2013 Teacher Assessment of Performance Standards (TAPs) data, as supported
by administrators’ observation, Differentiated Instruction and Academically Challenging Environment
represented the lowest observed areas. How might the areas of low performance impact classroom instruction?
Stakeholders noted that rigorous Tier 1 instruction is essential to the success of SWD demonstrating school
readiness and school completion.
During FFY 2013, 97.9% of the teachers in Georgia’s Race to the Top Schools received either a Level III or
Level IV on the TAPs Evaluation Instrument. However, the same cohort of teachers demonstrated a slightly
different distribution for Teacher Effectiveness Measure (TEM) scores that included Student Growth Measure
because 72% of the teachers scored either a Level III or Level IV. Realizing the importance of teacher
effectiveness on student outcomes, all students were not demonstrating anticipated growth based on Georgia’s
Growth Model. This data supported that teachers would require technical assistance to provide supplemental
supports and rigorous Tier 1 instruction for all students.
Brief Descriptors for Lowest Performance Areas:
Differentiated Instruction (e.g., provides remediation, enrichment and acceleration to further student
understanding; uses flexible grouping strategies; diagnostic, formative, and summative assessment;
demonstrates high learning expectations for all students)
Academically Challenging Environment (e.g., maximizes instructional time, communicates high, but
reasonable expectations for students learning, encourages students to explore new ideas, provides
academic rigor and pushes students to achieve goals)
Based on Georgia’s Preschool Outcomes data (young children with disabilities), stakeholders noted student
growth and/or progress as an area of improvement: Social Emotional Skills, Acquisition of knowledge and
Skills, and Taking Appropriate Action to Meet Needs. Out of the three outcome areas, Acquisition of
Knowledge and Skills demonstrated the lowest performance for Summary Statement 2: The percent of children
who were functioning within age expectations in each outcome by the time they exited the program. While
81% of the preschool children who entered the program below age expectations made substantial increase, only
36.7% of those students exited the preschool program within age expectations. Significant Developmental
Delay (SDD) represents the fourth largest catchment (12%) for Georgia’s special education enrollment. Many
of these students, with the appropriate supports, can make substantial progress and achieve skills that are
commensurate with age-appropriate peers.

P a g e 1 3
Table 6. FFY 2013 Preschool Outcomes Data
Based on graduation and dropout trends, the stakeholders asked questions about the relationship among
attendance, behavior, and course completion/competency for "All Students" and SWD. It was obvious that
school completion was an area of concern for SWD; yet, stakeholders needed additional data to support barriers
that would ultimately help Georgia to explain why this was happening. The attendance gap showed that the
"All Students" group had a higher attendance rate than the SWD group in both catchments. In addition, SWD
demonstrated more absences in the "More than 15 days absent" catchment possibly due to increased disciplinary
removals-especially for black males with disabilities.
Table 7. Attendance Gap
FFY
2013
FFY
2012
FFY
2011
FFY
2010
All Students
6 to 15 Days Absent 31.1% 35.5% 31.20% 34.30%
More than 15 Days Absent 8.2% 9.6% 8.30% 8.80%
Students with Disabilities
6 to 15 Days Absent 33.6% 37.20% 33.80% 35.50%
More than 15 Days Absent 12.1% 13.90% 12.30% 12.70%
Overall, the total disciplinary removals for SWDs decreased from 159,592 in FFY 2007 to 102,727 in FFY
2012; however, the disciplinary removals decreased at a disproportionate rate for Black SWD. After reviewing
data for attendance and behavior, stakeholders considered possible correlations with achievement outcomes.
The State examined performance outcome trends for Grades 3, 5, and 8 over a three-year period to identify
areas of concern for reading and mathematics. In general, the "All Students" and SWD group performed
significantly higher on the State's reading assessment than the mathematics assessment. The largest reading gap
between the two groups was 9% for Grades 3 and 5; however, the largest mathematics gap was 23% for Grades
3 and 5.
Summary Statements
Social
Emotional
Skills
Acquiring
and Using
Knowledge
and Skills
Taking
Appropriate
Action to Meet
Needs Summary Statement 1: Of those children who entered the
program below age expectations in each outcome, the
percent who substantially increased their rate of growth
by the time they exited the program. 78.4% 81.0% 77.4%
Summary Statement 2: The percent of children who were
functioning within age expectations in each outcome by
the time they exited the program. 61.4% 36.7% 71.5%

P a g e 1 4
During Phase II, the Department reviewed state data for the first implementation of the Georgia Milestone
Assessment System (GMAS). The percent of all students and students with disabilities scoring proficient
drastically declined for both reading and math. The GMAS was more rigorous than the previous assessments.
Table 8. Math and Reading/Language Arts Proficiency Percentages for All Students
Percent of children
with IEPs scoring
Proficient for Math
Percent of children
with IEPs scoring
Proficient for
Reading
Elementary/Middle 38.6% 38.2%
High School 33.2% 36.1%
Table 9. Math and Reading Proficiency Percentages for Students with Disabilities
Percent of children
with IEPs scoring
Proficient for Math
Percent of children
with IEPs scoring
Proficient for
Reading
Elementary/Middle 15.42% 16.77%
High School 11.07 12.28%
Stakeholders suggested a review of Least Restrictive Environment (LRE) data in relationship to performance
outcomes. Approximately, 65% of SWD were receiving instruction in the general education setting greater than
80% of the day for both reading and mathematics. Students with Mild Intellectual Disabilities demonstrated the
greatest reading and mathematics performance gap as compared to the "All Students" group. This disability
category received less instruction in the general education setting.
Stakeholders considered perception data such as a SSIP Parent Survey to assess parent perceptions for general
curriculum, school climate, and student progress relative to the provision of special education services. A
common thread throughout the survey data was the degree by which the schools engaged and communicated
with families. The Department partnered with the Parent Training Information (PTI) Center of Georgia to
administer the survey and report the data. To ensure proper access to the survey, there was collaboration with
the Title One Family Engagement Specialist, Georgia's Parent Teacher Association and LEAs. 1,329 families
responded to the survey; however, only 1,067 surveys identified themselves as families of children with
disabilities. These families represented the following age groups: (1) 3-5 years old, 7.2%; (2) 6-10 years old,
35.1%; (3) 11-14 years old, 33.8%; (4) 15-18 years old, 23.9% and (5) 18-22 years old, 7.0%. In general, most
surveyed areas obtained an approval rate (Strongly Agree or Agree) of at least 80% of the surveyed families.
Interestingly enough, the two surveyed areas that did not meet this criterion were specific to progress and
expectations for their students. The climate indicator demonstrated a disapproval rating of 15%. This posed
concerns for stakeholders but spurred additional conversations around the effectiveness of school climate.
In addition to the SSIP Parent Survey, the State administered a SSIP Student Survey. The State administered
surveys to five hundred seventy high school students with disabilities who were identified in need of additional
strategies and/or interventions. Of the five hundred seventy SWD, four hundred fifty-two students identified
themselves as having a disability. The survey was divided into three sections that had strong correlations with
graduation: Instruction, Instructional Accommodations, and School Climate. Four hundred four students

P a g e 1 5
stated either "Strongly Agree" or "Agree" that they were on track for graduation. This question was cross
tabulated to other survey questions to analyze inconsistent responses or possible survey errors. Of the four
hundred four students that believed they were on track for graduation, a small number, twenty-nine students,
stated they were not receiving instruction in the general education setting and shared negative feedback about
access to appropriate accommodations provided by teachers. Thirteen out of the four hundred four students
were not clear of their progress toward graduation. Thirty of these students believed they were on track for
graduation, yet, did not believe that the adults showed a belief that they could graduate. In general, the State
found that students consistently responded to the survey questions. The biggest discrepancy was that fifty-four
of the four hundred four students communicated that the school discipline policy was not fair. Stakeholders
believed this data supported other concerns with school climate.
The perception data from families and students demonstrated consistently positive trends; however, the
qualitative feedback did not always align with the quantitative data reviewed by stakeholders. Families and
students communicated positive feedback despite the barriers and challenges to positive outcomes for students.
The stakeholders determined that the State must consider strategies to clearly describe graduation readiness and
create consistent transparency for students and families. Perhaps families’ criteria for success and progress
toward graduation differed from the state-level perspective. There would be a definite need to provide technical
assistance for families and communities to address perceptions around school climate for SWD.
During Phase II, GaDOE collaborated with the Georgia Parent Training Information Center to develop school
readiness and completion brochures that could inform families at the elementary, middle and high school levels.
These brochures are currently being translated into other languages.
Georgia Health and Safety Survey provided stakeholders with perception data to support school climate for
students with and without disabilities. 22.99% of students ranging from 6th through 12th grades (134,948 out of
587,043) answered "yes" they thought about dropping out of school. In addition to this question, surveyed
participants were asked to identify the most likely reason for dropping out of school (e.g., bored, family reasons,
being bullied, etc.), if this was a personal option. Interestingly, of the possible responses for dropping out,
"bored" had the highest count! The stakeholders shared concerns about the large number of students that
selected "Other" as a dropout reason, as well. The surveyed students provided perception data whether they
liked school and felt successful at school. 75.71% responded either "strongly agree" or "somewhat agree" that
they liked school, and 86.83% felt successful at school.
Next, stakeholders asked questions about the preparedness of students beyond high school. Based on FFY 2013,
57.18% (39,028/68,260) of the "All Students" group passed the End of Pathway Assessment (EOPA) in which
35.46% (1454/4100) of the SWD subgroup passed the EOPA. Based on FFY 2010 data, 52.45% (2281/4349) of
the SWD that graduated from high school enrolled in a Postsecondary Institution.
Georgia’s Indicator 13 trend data improved overtime from 5.5% in FFY 2009 to 94.98% in FFY 2013, 94.98%.
Indicator 13 reports youth with IEPs aged 16 and above who had IEPs that included appropriate measurable
goals. The State has implemented numerous evidence-based practices to obtain the substantial gains: (1)
Participated in TA with National Secondary Transition Technical Assistance Center (NSTTAC), (2) Revised the
State’s method of data collection, and (3) Provided differentiated TA for LEAs. Students with disabilities are
accessing IEPs with measurable transition goals; however, these measurable transition goals have not
demonstrated a connection to improved school completion and positive postsecondary outcomes. Stakeholders
recommended that the work of the SSIP could bridge this gap and shift the focus from compliance to outcomes.
Georgia’s broad data analyses created credible explanations to support the myriad of concerns and issues across
grade levels and content areas, which ultimately impacted school completion. It reinforced a need to
troubleshoot acquisition of skills and the environment in which those skills were accessed since poor School

P a g e 1 6
Climate was a recurring theme. The next logical step was to pare down these statewide issues and clearly
identify the root causes for the problems. As a result, Stakeholders completed a focused review of data: (1)
Longitudinal data for the FFY 2013 Graduating Cohort and (2) Broad Data Variables for a Targeted Group of
LEAs in the State. By this point, the State required the support of stakeholders to answer the following
question: What were the barriers that negatively impacted improved graduation rates for SWD? Stakeholders
identified the salient data trends for the cohort and determined how pervasive those barriers were for other
cohorts of students. Ultimately, these barriers would assist Georgia in developing a theory of action and
outlining coherent improvement strategies.
Longitudinal data were reviewed for the FFY 2013 Graduation Cohort that extended back to its 3rd Grade Year.
During FFY 2004, as Georgia’s 3rd grade students, there were performance gaps (Meeting and Exceeding the
Standard) for both reading and mathematics between the “All Students” Group and SWD subgroup. Overall, all
students performed better in reading as compared to math. By 5th grade, there was approximately a twenty plus
percentage point gap for both reading and math. By 9th grade, the performance gap widened to approximately
36 percentage points for both academic areas. During 10th grade year, the SWD dropout rate almost doubled
that for All Students.
Table 10. FFY 2013 Graduation Cohort Longitudinal Performance (Meets and Exceeds)
3rd
FFY
2004
4th
FFY
2005
5th
FFY 2006
6th
FFY
2007
7th
FFY
2008
8th
FFY
2009
9th
FFY 2010
American
Literature and
Math I
Reading All
Students
92 81 86 92 89 96 82
Reading
SWD
82 61 64 69 84 81 46
Math All
Students
90 80 88 69 63 83 61
Math SWD 74 52 63 35 51 48 24
This focused analysis of data for a targeted cohort was critical to help Stakeholders confirm barriers highlighted
in the broad analysis of data. This Cohort demonstrated proficiency gaps early during the beginning of the
PreK-12 Pipeline. “Does Georgia have a comprehensive Pre-K-12 pipeline, or maybe this was part of the
issue?” Essentially, the FFY 2013 SWD Cohort started as early as 3rd Grade underperforming the All Students
Group. What appeared to be a SWD issue eventually manifested as a concern for all students. Stakeholders
made a critical connection between the gap noted for young children upon exiting preschool and the gap
demonstrated in Table 10. Generally, Students with Disabilities are underperforming their peers upon exiting
the preschool program. Low Achievement for SWD demonstrated a microcosm of concerns with
underperformance for All Students.

P a g e 1 7
Based on the data, Stakeholders identified the following barriers as having a negative impact on positive
outcomes for SWD:
1) Access to the general curriculum for All Students;
2) Access to a positive school climate for All Students; and
3) Access to Specially Designed Instruction (SDI) for SWD.
Georgia’s SWD would have improved outcomes, if these barriers across the P-12 pipeline were addressed at the
state, regional and local levels. Unfortunately, there are multiple areas of opportunity that Stakeholders could
have suggested, but all roads seem to lead to graduation rate for SWDs. The belief was that the entire P-12
pipeline posed one or more concerns. While data could have guided stakeholders to address reading, math,
preschool outcomes, postsecondary outcomes or graduation, a statewide focus solely on a subject area, gender,
racial group or disability category could worsen the problem and create additional silos. Also with concerns
about instruction and school climate, graduation would create a more feasible priority since school climate is
essential to the entire P-12 Pipeline. Stakeholders believed that graduation outcomes were not only an area of
need but would enable the State to select comprehensive, coherent strategies to target other areas of need.
Georgia’s State Personnel Development Grant (SPDG), GraduateFIRST, has improved capacity for local
schools to implement evidence-based practices to support at-risk students.
During Phase II, Georgia State Leadership Team invited other relevant stakeholders to discuss specific barriers
that impeded student access to the general curriculum. Based on the feedback, stakeholders noted that
inconsistent expectations for curriculum at the state level directly impacted implementation of effective
practices at the local level. As a result of this feedback, the Division for Curriculum and Instruction has
provided leadership, using representation from other divisions, to clearly outline general guidance to support
district and school leaders with the development and implementation of local curricula.
Considering the State’s capacity to provide Intensive Technical Assistance (TA), what targeted group of LEAs
would benefit through the systematic implementation of Student Success? Georgia already has a number of
strategies around improving graduation outcomes for students; therefore, the SSIP could align with many of
these efforts such as GraduateFIRST. While Stakeholders anticipated some strategies having universal
implications for all LEAs, there was some limitation for intensive supports due to limited personnel. The State
identified eighty-two LEAs based on the following variables.
Variable 1: LEAs that had 1 or more Participating GraduateFIRST School in Georgia’s State Personnel
Development Grant
Variable 2: LEAs that had 1 or more Schools with Accountability Designations for Graduation Rate
(Priority, Focus, or Alert)
Variable 3: LEAs that had a graduation rate for SWD approximately < 30%
The State also considered the number of schools in the LEA with Accountability Designations for other areas
and any determinations for Disproportionality within the past three years. During a Committee meeting,
Stakeholders reviewed anonymous data sets for the eighty-two LEAs clustered within their GLRS regions.
Stakeholders were asked to consider the LEAs within a GLRS region and prioritize three LEAs based on the
following: (1) Size Group, (2) Capacity Efforts, and (3) Need. As a result of this activity, fifty LEAs were
selected for intensive technical assistance; however, two GLRS regions had fewer than three LEAs to choose
from. The fifty LEAs had a 3-21 SWD enrollment that represented approximately 46% of the State’s total SWD
enrollment. Changing outcomes for these LEAs would definitely improve the State data.

P a g e 1 8
Analysis of the 50 Districts
24 LEAs had GraduateFIRST being implemented across 51 schools.
19 LEAs had 29 Priority, Focus or Alert schools for Graduation Rate and 94 additional Priority, Focus
and Alert schools for other accountability areas.
7 of the 50 LEAs did not have enough students for a SWD subgroup for Graduation Rate.
42 of the 50 LEAs that had a SWD subgroup did not meet the ESEA Waiver SWD Graduation Target.
1 LEA met the SWD Subgroup Graduation target.
24 LEAs had a Disproportionality Determination (Identification, Placement and/or Discipline) within
the past three years.
4 LEAs met the criteria for all variables.
Stakeholders’ focused data analyses were helpful to target LEAs but also to identify strong correlational
variables that impact low graduation rates. While a low graduation rate was only one variable, all LEAs with a
size group underperformed the target-except one LEA. The other helpful observation obtained through this
focused analysis was that LEAs demonstrated similarly low performance for varied reasons. This reality would
further inform Georgia’s selection of coherent improvement strategies. The Stakeholders helped Georgia to
clearly define graduation as an area of priority. Perhaps the best way to build or strengthen a P-12 Pipeline is to
create common mission and vision such as with school completion. In FFY 2004, did Georgia’s 3rd grade
teachers make a critical connection between student learning and school completion in FFY 2013? Stakeholders
believed that this focus area would allow greater flexibility for individual LEAs to address reading, math,
School Climate, as appropriate.
Stakeholders hypothesized that district effectiveness was most critical to the improvement of school and teacher
effectiveness. Effective schools improve outcomes for students. Considering this theory, stakeholders reviewed
focused data for the LEAs that had a Priority, Focus, or Alert school based on the Graduation Rate. Of the
LEAs, 97% of the LEAs demonstrated systemic performance issues and had been identified in FFY 2004 with a
performance gap of >25% between SWD and Non SWD subgroups for reading and/or math. Many of these
LEAs were identified in the bottom quartile of their size group for SWD performance on reading and/or
math. The Committee believed that this observation supported the reality that LEA capacity is critical to
address this problem. Stakeholders suggested that the State analyze its current capacity efforts to support LEAs
with low achievement and/or proficiency gaps.

P a g e 1 9
Analysis of State Infrastructure to Support Improvement and Build Capacity
The GaDOE engaged stakeholders in a broad state infrastructure analyses relative to the graduation outcomes
for SWDs. What was Georgia's current capacity to support improved graduation outcomes for SWD at the state,
regional, LEA and school levels? Georgia has a comprehensive approach to clearly communicate standards and
expectations at the LEA level and school levels with the use of District Keys, School Keys, Class Keys, and
Teacher/Leader Keys. The Division for School Improvement's District Effectiveness Process is a capacity
building initiative but only implemented in four LEAs identified as having School Improvement Grants (SIG).
Priority Schools are awarded SIGs based on a competitive application process, which must include LEA
commitment. The Division for Special Education collaborated with the Division for School Improvement to
support these four LEAs. During Phase II, the Division for School and Division Effectiveness provided District
Effectiveness Specialists for all districts identified as having at least one priority school. Of the fifty districts
targeted for SSIP, Division for Special Education and School Improvement mutually support thirty plus districts
and developed joint Memorandum of Agreements.
While Georgia has numerous collaborative opportunities at the state level, the strongest networks for capacity
building are through the use of Regional Educational Service Agencies (RESA) and the Georgia Learning
Resource System (GLRS). There are also local school improvement specialists that provide TA for individual
schools to support school improvement planning process and increase student achievement. The Division has
worked diligently during Phase II to strengthen these partnerships.
During July 2014, the State solicited feedback from Stakeholders concerning Georgia’s infrastructure via paper
and online surveys. Questions supported an analysis of Georgia’s governance, fiscal, quality standards,
professional development, data, technical assistance, and accountability/monitoring. Below you will find
several of the questions and responses.
What initiatives do you know about that could be leveraged to improve graduation rates for students with
disabilities? Here are a sampling of the identified initiatives: (1) Governor’s Office Campaign Get Georgia
Reading Campaign; (2) Math Endorsement for teachers; (3) State Personnel Development Grant; (4) Math
Science Partnership Grant; (5) CEEDAR Grant; (6) Network of Transforming Teacher Education Programs
(NTEP); (7) Teacher and Principal Induction Program; (8) Quality Rating Improvement System (birth to 5); (9)
Flexible Learning Program (Title One); (10) Title One Funds provided to schools for students; (11) CTAE
Career Pathways; (12) RT3 Initiatives; (13) Formative Instructional Practices (FIP) for teachers; (14) Summer
Curriculum Academies; (15) Teacher Resource Link (SLDS); (16) Striving Reader B-12; (17) School
Improvement Grant (SIG); (18) Dual Enrollment; and (19) Early Intervention and Remedial Education
Programs.
A description of how the State analyzed the capacity of its current infrastructure to support improvement and
build capacity in LEAs to implement, scale up, and sustain the use of Evidence-Based Practices to improve results
for children with disabilities. State systems that make up its infrastructure include, at a minimum: governance,
fiscal, quality standards, professional development, data, technical assistance, and accountability/monitoring. The
description must include current strengths of the systems, the extent the systems are coordinated, and areas for
improvement of functioning within and across the systems. The State must also identify current State-level
improvement plans and initiatives, including special and general education improvement plans and initiatives, and
describe the extent that these initiatives are aligned, and how they are, or could be, integrated with, the SSIP.
Finally, the State should identify representatives (e.g., offices, agencies, positions, individuals, and other
stakeholders) that were involved in developing Phase I of the SSIP and that will be involved in developing and
implementing Phase II of the SSIP.

P a g e 2 0
Are you aware of any rules, policies, procedures and practices that are negatively impacting graduation rates for
students? If so, what are they, and what actions should be taken to address them?
1. Response to Intervention (RTI) not being implemented with fidelity
2. Coordination of Technical Assistance
3. Opportunity Gaps for Students
4. Board policy about graduation
5. Practices around grading and reporting
6. Access to Parent Resources
7. Class size rule
8. Low expectations and faulty perceptions
9. Georgia’s Special Needs Scholarship
10. Local School Code of Conducts/Lack of positive behavioral interventions and supports
11. State Rule for Promotion
12. Local promotion policies
13. Policies around attendance and tardies
14. Grading Policies
15. Undergraduate Coursework and Training
16. Fidelity of Individualized Education Program (IEP) Team
What system does the State have in place for developing implementation capacity at the state, regional, district,
and school levels?
1. District Effectiveness Personnel and Resources (e.g., Georgia School Standards, Districts Keys, GAPSS,
District Effectiveness Team, School Effectiveness Team, etc.)
2. Special Education Parent Mentor Program
3. Parent to Parent of Georgia
4. RESA
5. GLRS
6. Special Education District Liaisons and Collaborative Communities (Review of data for ABCs)
7. Special Education Active Engagement Process
How can the state leverage its system of professional development and technical assistance in order to improve
graduation rates for all students including students with disabilities?
1. Align resources and technical assistance among federal programs 2. Form stronger partnerships with Institutions of Higher Education (IHEs) 3. Improve communication with local districts and regions about state priorities 4. Identify schools and LEAs with effective practices to share with others
While considering how the state could leverage its system of professional development and technical assistance
in order to improve graduation rates for SWDs, stakeholders expressed concerns with alignment and wanted
more in-depth information about specific initiatives. Stakeholders were asked to select state and regional
initiatives that could be leveraged to improve graduation outcomes for SWD. The State identified thirty-six state
or regional initiatives that had a direct or indirect impact on the graduation rate for SWD, as reported by the
project and initiative leaders responsible for these activities. Many of these initiatives were included in the
aforementioned list for state and regional initiatives. The initiatives targeted various grade bands: (a)
Elementary School 45.45% (b) Middle School 48.48% and (c) High School 51.51%. The activities spanned all

P a g e 2 1
three levels; yet, there was little vertical articulation among the three levels. In most instances, the initiatives
were exclusively implemented in one of the three levels with little attention to school feeder patterns.
Eleven out of thirty-six initiatives (30%) were identified as having some type of LEA engagement.
o Four of the eleven initiatives engaged a large number (56-200) of LEAs throughout the state.
o Seven of the eleven initiatives represented LEA capacity building work among twenty or fewer
districts.
Approximately 14.7% of the state or regional initiatives were identified as compliance related activities. Those
activities were directly supported by federal regulations and requirements. 52% of the activities were reported
as having a financial responsibility between three to five, with five being the highest.
Each Project Leader was asked to rate how well the activity directly correlated to improving graduation rates on
a scale from one to five (one being the lowest correlation and five being the highest correlation). 58% reported
successful outcomes. Each educational leader was asked to describe specific measures and evidence used to
determine student level impact in which only 16% demonstrated direct correlation to the SIMR and outcomes.
In general, Georgia currently provides a number of opportunities to improve graduation outcomes for students
that were not regulatory activities. Those activities were implemented at all levels and provided preventative
strategies for young children too. Unfortunately, there was little alignment with LEA capacity efforts and
missed opportunities for seamless technical assistance to ensure appropriate coaching supports. During Phase II,
stakeholders have continued to address these concerns in Georgia’s SSIP.
Stakeholders discussed possible rules, policies, procedures and practices that were negatively impacting the
graduation rates for SWD. Based on the feedback, several options were identified. Georgia has provided TA
and supports for Response to Intervention (RTI) implementation for the local levels. In addition to the state
level resources, local RESAs have supported RTI efforts for local LEAs and schools. Consequently, some LEAs
have what is currently identified as "opportunity gaps" in which access to robust learning opportunities may not
be a standard for all students.
There were several policies that support positive outcomes for children such as Georgia's Graduation Rule,
Alternate Course Sequence, and Individualized Graduation Plan requirement for all students. Policies around
Georgia's Special Needs Scholarship and Compulsory Attendance Law may be negatively impacting
performance in this area. Perhaps the greatest strengths of Georgia's infrastructure are the RESA and GLRS,
yet, there must be seamless alignment between the state and regions. Although numerous activities are currently
being implemented, additional authentic engagement is needed among critical stakeholders. Majority of these
activities were focused either at the school, teacher or student levels. Stakeholders noted that Georgia must
improve systems change processes to obtain better outcomes, which can be accomplished through the SSIP.
In general, Georgia’s infrastructure and capacity to support change at the LEA level was a definite area of
improvement. Overall the accountability and monitoring components were in place and indirectly impacted
positive graduation outcomes for students; however, more connectivity was needed to create an authentic
Results-driven Accountability system. While Georgia’s state infrastructure shifted to more of an inclusive,
collaborative model, there was limited technical assistance to support LEAs to replicate this work. This too
would be an area in need of improvement for Georgia.

P a g e 2 2
State-identified Measurable Result(s) for Children with Disabilities
During FFY 2013, 39.46% Students with Disabilities (ages 14 and older) graduated with a general education
diploma as measured by the Annual Graduation Event Rate for fifty Local Educational Agencies (LEAs) that
were identified to receive intensive technical assistance through the SSIP Coherent Improvement Strategies.
By FFY 2018, Georgia will meet a rigorous target of 65% (Annual Graduation Event Rate), which has been
revised based on an increased graduation rate during FFY 2014. Stakeholders suggested that the State reset
targets to show rigorous expectations but also realistic expectations for improving state data overtime.
Description
FFY 2013, 44.80% of all students with disabilities exited with a general education diploma (Annual Graduation
Event Rate), and 39.46% of students with disabilities in the fifty LEAs exited with a general education diploma.
FFY 2014, the State significantly increased the Annual Event Graduation Rate to 64.1% for all students with
disabilities and 59.35% for students with disabilities in the fifty LEAs. Georgia’s SIMR aligns to Indicator 1
(Graduation Rate for SWD) but reflects an alternative calculation and subset of the state’s data. The fifty LEAs
represent approximately 46% of Georgia's special education enrollment and will support the State in meeting
rigorous graduation rate targets for the SWD subgroup and the “All Students” group.
Table 11. Four-Year Adjusted Cohort Graduation Rate
FFY 2013 FFY 2014
All Students 72.5% 78.5%
Students with Disabilities 36.5% 54.3%
The FFY 2014 4-Year Adjusted Cohort Graduation Rate for Students with Disabilities increased by 17.8
percentage points (54.3%). The 4-Year Adjusted Cohort Graduation Rate for All Students increased by 6
percentage points, (78.5%).
A description of the result(s) the State intends to achieve through the implementation of the SSIP. The State-identified result(s)
must be aligned to an SPP/APR indicator or a component of an SPP/APR indicator. The State-identified result(s) must be
clearly based on the Data and State Infrastructure Analyses and must be a child-level outcome in contrast to a process outcome.
A statement of the result(s) the State intends to achieve through the implementation of the SSIP. The State-identified result(s)
must be aligned to an SPP/APR indicator or a component of an SPP/APR indicator.
Annual Graduation Event Rate
((# of SWD (Age 14 and above) enrolled during a specified school year who exited school by receiving a high school diploma)
Divided by
(# of SWD (Age 14 and above) enrolled during a specified school year who exited school by receiving a high school diploma,
a certificate/special education diploma, and dropping out))
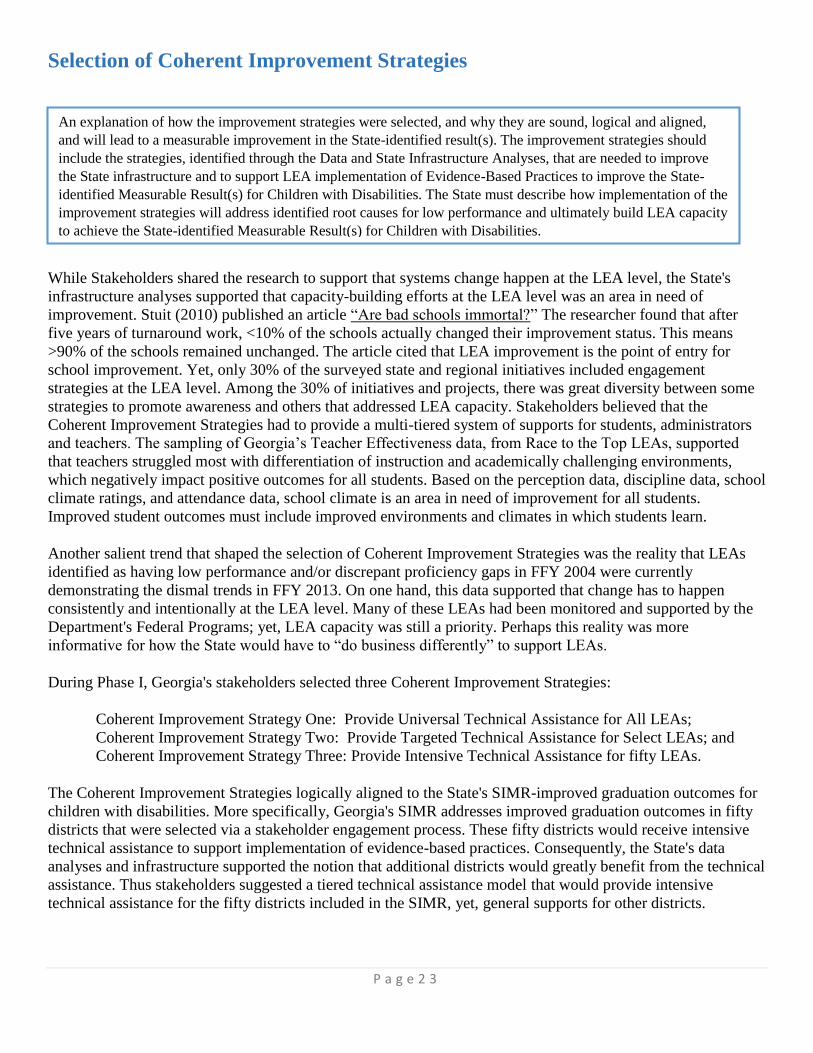
P a g e 2 3
Selection of Coherent Improvement Strategies
While Stakeholders shared the research to support that systems change happen at the LEA level, the State's
infrastructure analyses supported that capacity-building efforts at the LEA level was an area in need of
improvement. Stuit (2010) published an article “Are bad schools immortal?” The researcher found that after
five years of turnaround work, <10% of the schools actually changed their improvement status. This means
>90% of the schools remained unchanged. The article cited that LEA improvement is the point of entry for
school improvement. Yet, only 30% of the surveyed state and regional initiatives included engagement
strategies at the LEA level. Among the 30% of initiatives and projects, there was great diversity between some
strategies to promote awareness and others that addressed LEA capacity. Stakeholders believed that the
Coherent Improvement Strategies had to provide a multi-tiered system of supports for students, administrators
and teachers. The sampling of Georgia’s Teacher Effectiveness data, from Race to the Top LEAs, supported
that teachers struggled most with differentiation of instruction and academically challenging environments,
which negatively impact positive outcomes for all students. Based on the perception data, discipline data, school
climate ratings, and attendance data, school climate is an area in need of improvement for all students.
Improved student outcomes must include improved environments and climates in which students learn.
Another salient trend that shaped the selection of Coherent Improvement Strategies was the reality that LEAs
identified as having low performance and/or discrepant proficiency gaps in FFY 2004 were currently
demonstrating the dismal trends in FFY 2013. On one hand, this data supported that change has to happen
consistently and intentionally at the LEA level. Many of these LEAs had been monitored and supported by the
Department's Federal Programs; yet, LEA capacity was still a priority. Perhaps this reality was more
informative for how the State would have to “do business differently” to support LEAs.
During Phase I, Georgia's stakeholders selected three Coherent Improvement Strategies:
Coherent Improvement Strategy One: Provide Universal Technical Assistance for All LEAs;
Coherent Improvement Strategy Two: Provide Targeted Technical Assistance for Select LEAs; and
Coherent Improvement Strategy Three: Provide Intensive Technical Assistance for fifty LEAs.
The Coherent Improvement Strategies logically aligned to the State's SIMR-improved graduation outcomes for
children with disabilities. More specifically, Georgia's SIMR addresses improved graduation outcomes in fifty
districts that were selected via a stakeholder engagement process. These fifty districts would receive intensive
technical assistance to support implementation of evidence-based practices. Consequently, the State's data
analyses and infrastructure supported the notion that additional districts would greatly benefit from the technical
assistance. Thus stakeholders suggested a tiered technical assistance model that would provide intensive
technical assistance for the fifty districts included in the SIMR, yet, general supports for other districts.
An explanation of how the improvement strategies were selected, and why they are sound, logical and aligned,
and will lead to a measurable improvement in the State-identified result(s). The improvement strategies should
include the strategies, identified through the Data and State Infrastructure Analyses, that are needed to improve
the State infrastructure and to support LEA implementation of Evidence-Based Practices to improve the State-
identified Measurable Result(s) for Children with Disabilities. The State must describe how implementation of the
improvement strategies will address identified root causes for low performance and ultimately build LEA capacity
to achieve the State-identified Measurable Result(s) for Children with Disabilities.

P a g e 2 4
Phase II, Georgia's stakeholders suggested a restructuring of the Coherent Improvement Strategies based on
implementation progress data during Phase I. The Coherent Improvement Strategies were relevant but required
flexibility to address the changing scope of the work as identified through actual implementation. Stakeholders
identified gaps in Georgia’s infrastructure during Phase I but did not anticipate the pervasive nature of the
problem. The universal technical assistance for all LEAs (Previous Coherent Improvement Strategy One)
represented an activity that would support the seamless alignment and general capacity efforts for all special
education directors. Perhaps the gentle shift from Phase I to Phase II provided a deeper awareness for
stakeholders that this activity supported overall infrastructure development-not a broad Coherent Improvement
Strategy in and of itself. What specific adult practices would the technical assistance change and improve?
Stakeholders identified a need to increase capacity for local districts to execute comprehensive district
improvement planning that support local implementation of evidence-based practices. The previous Coherent
Improvement Strategy supported an alignment and integration of initiatives and plans at the state, regional,
district, and school levels.
Coherent Improvement Strategy Two provide a critical placeholder to support a select group of districts with
increased supports but perhaps with less duration and intensity. During Phase I, stakeholders strongly forecasted
that disproportionality could be a logical variable used to target these districts; however, additional
consideration was needed. During FFY 2015, Georgia identified sixty-three districts as having either significant
disproportionality (Identification, Discipline and Placement) or significant discrepancy (Disciplinary
Removals). Forty-six of the sixty-three districts were identified as having over-identification for children with
disabilities. Many districts required technical assistance to provide effective instruction and appropriate
interventions for students. Stakeholders agreed that disproportionality should be the priority to target districts
considering the previous Coherent Improvement Strategy Two. This choice would support Georgia in
integrating and aligning disproportionality into the work of improved outcomes for students.
Stakeholders considered strategies to integrate the review for disproportionality and planning processes into the
overall SSIP process. Georgia directed the GLRS Regional Teams to support local districts with the review of
their improvement plans for disproportionality. As a result, stakeholders agreed to morph the Coherent
Improvement Strategy into an activity that would support the alignment and integration of initiatives and plans
at the state, regional, district and school levels. Georgia restructured the technical assistance provided for LEAs
in this area and trained the local GLRS Regional Teams (Regional Implementation Teams) to support and
sustain the disproportionality work.
Coherent Improvement Strategy Three provide intensive technical assistance for fifty LEAs. The State initially
outlined that the capacity building efforts would primarily take place during FFY 2015 and support a transition
from district to school level implementation of evidence-based practices. However, the systems change process
of building state, regional and district capacity moved at much slower rate than intended. While some district
level capacity efforts took place during this year, local teams will continue to support the transition during FFY
2016. GLRS Regional Teams are improving the state capacity to support local implementation of evidence-
based practices, align improvement plans, and reduce redundant and duplicative technical assistance. Currently,
the GLRS Regional Teams provide universal, targeted, and intensive technical assistance. The State has
committed the GaDOE District Liaisons to participate on regional teams and improve capacity.
Stakeholders suggested to keep the emphasis on the fifty districts receiving intensive technical assistance as a
standalone Coherent Improvement Strategy but tweak the wording to make critical connections with student
outcomes. Georgia will provide intensive technical assistance for the fifty districts to change what adult
practices? How will that change of practice support selection and implementation of evidence-based practices?
How will those evidence-based practices benefit students and ultimately improve school completion? Based on
this logic, the previous Coherent Improvement Strategy Three morphed into the following strategy: Support
district infrastructure and implementation of evidence-based practices in fifty districts identified to receive

P a g e 2 5
intensive technical assistance to improve effective instruction, engaging school climate and transition.
Additional information about evidence-based practices can be found in Phase II (Support for EIS programs and
providers implementation of Evidence-Based Practices).
Stakeholders advised the State to revise Georgia’s Coherent Improvement Strategies, which are listed below.
Coherent Improvement Strategy Number One: Improve State and Regional Infrastructure to better
support districts to implement and scale up evidence-based practices that will improve graduation rates
for all students-including SWD
a. Align and integrate initiatives and plans at the state, regional, district, and school levels to reduce
duplication and leverage resources
Universal Expectations for Student Success Process and Collaborative Communities: Georgia committed
to aligning and integrating initiatives at all levels because stakeholders clearly identified inconsistent
expectations, redundant improvement plans and isolated resources as areas of opportunities. FFY 2014, the
Division for Special Education launched its integrated improvement planning process and provided technical
assistance for all districts during the annual technical assistance meeting. In the past, more focus had been
placed on the submission of compliant plans rather than comprehensive improvement plans that improved
student outcomes. During Phase I, Georgia aligned with the GLRS Regional Teams as a catalyst to provide the
universal technical assistance that would increase district capacity in the processes listed below. Each
component is supported by research and comprises a comprehensive framework to help the district address its
own adaptive challenges-low school completion rates and high dropout rates. All roads lead to component six
(strategies, interventions and next steps); ultimately, the district must be able to identify and implement
evidence-based practices with fidelity.
Georgia implements a Consolidated LEA Improvement Planning process in which all federal programs
collaborate and submit annual plans. State leadership, across all federal programs, noted similar challenges in
supporting local districts to develop improvement plans and implement evidence-based practices that resulted in
improved student outcomes. The Division prioritized integrating special education improvement plans, such as
disproportionality, during Phases I and II but will require one improvement plan for all federal programs by
Phase III.
Student Success Expectations for All Districts
1. Documentation of Internal and External Stakeholder Engagement across Programs/Divisions (August
31, 2015 and ongoing);
2. Explanation of current capacity, infrastructure, and resources (August 31, 2015 and ongoing);
3. Strength and opportunities of local General Supervision (August 31, 2015 and ongoing);
4. Identification of strengths and weakness, as supported by data (February 29, 2016 and ongoing);
5. Identification of barriers (February 29, 2016 and ongoing); and
6. Strategies, interventions and next steps
(Short-Term Next Steps by February 29, 2016 and Long-term Next Steps by July 31, 2016).
GLRS Regional Teams, also referred to as Regional Implementation Teams, meet monthly with special
education directors within each region for technical assistance. GaDOE plans in collaboration with the teams to
identify appropriate topics and develop consistent content and resources. During FFY 2015, the GLRS aligned
the topics and resources with the six components of the broad Student Success framework and shared the
content via an electronic platform. Georgia established benchmarks to support district implementation of the
components and submission of evidence that would document the process. The SSIP Evaluator worked with the

P a g e 2 6
Department to develop a Student Success Process Planning Rubric that local districts could use to ensure
consistent implementation. The rubric is also used to identify next steps for districts based on progress. Local
districts submit the Student Success Process Plan, via the Consolidated LEA Improvement Plan (CLIP), with
the IDEA budget for approval from the Department. Note: This activity aligns with the initial Coherent
Improvement Strategy One submitted in Phase I pertaining to universal technical assistance for all districts.
Integration of Disproportionality in the Student Success Process: The Student Success Process addresses
disproportionality through the General Supervision questions; however, this integration consolidated the
planning and review processes. The State expanded the role of GLRS Regional Teams to support districts
identified as having disproportionality. The Regional Team assumes the following roles:
o Review policies, procedures and practices;
o Support development, implementation and review of Coordinated Early Intervening Services (CEIS);
and
o Monitor timely correction of noncompliance that caused the disproportionality.
By design, the Regional Implementation Team provides technical assistance to support universal practices
expected for all districts; therefore, the additional roles made logical sense and connected the work. Also, the
State noted a correlation between districts with systemic issues for disproportionality and school
completion. Note: This activity aligns with the initial Coherent Improvement Strategy Two submitted in Phase
I pertaining to targeted technical assistance for select districts. Stakeholders believed that disproportionality
should be the variable by which Georgia selects LEAs for targeted supports. Georgia has hosted several Equity
Summits to provide technical assistance for district leadership teams, as well.
Federal Programs Conference: During Phase II, Georgia will implement its first Federal Programs
Conference in FFY 2015 bringing together Title I, Title III, Homeless, Title II, Special Education, Migrant
Education, and Special Education leaders from local LEAs. These members will attend as a comprehensive
district leadership team. The Federal Programs Conference represents a progressive attempt to align the work
and support LEAs in a comprehensive manner. In addition to the Conference, Federal Programs are developing
a comprehensive needs assessment that LEAs can use to inform a consolidated planning process that meets the
needs of all students.
b. Establish, maintain, evaluate, and update cascading team management and implementation structures
and communication protocols/feedback loops at state, regional, district and school levels
State Management and Implementation Structure: In order to enhance the implementation of Student Success
and realize the desired outcome of improving graduation rates for SWD, the GaDOE has designed a state
management and implementation structure that includes cascading support teams from the GaDOE, to regional
technical assistance agencies, to districts, and ultimately to schools. This cascading team structure provides a
strong foundation for the delivery of a seamless system of technical assistance designed to build the capacity of
district leadership to support school leadership in improving teaching and learning.
The cascading team structures employed in Student Success also provide a mechanism through established
communication protocols and feedback loops for sharing information about implementation barriers and
successes from schools, to districts, to regional technical assistance agencies, to the GaDOE. This information is
used to make adjustments in the work, which are filtered through the cascading teams to districts and schools.
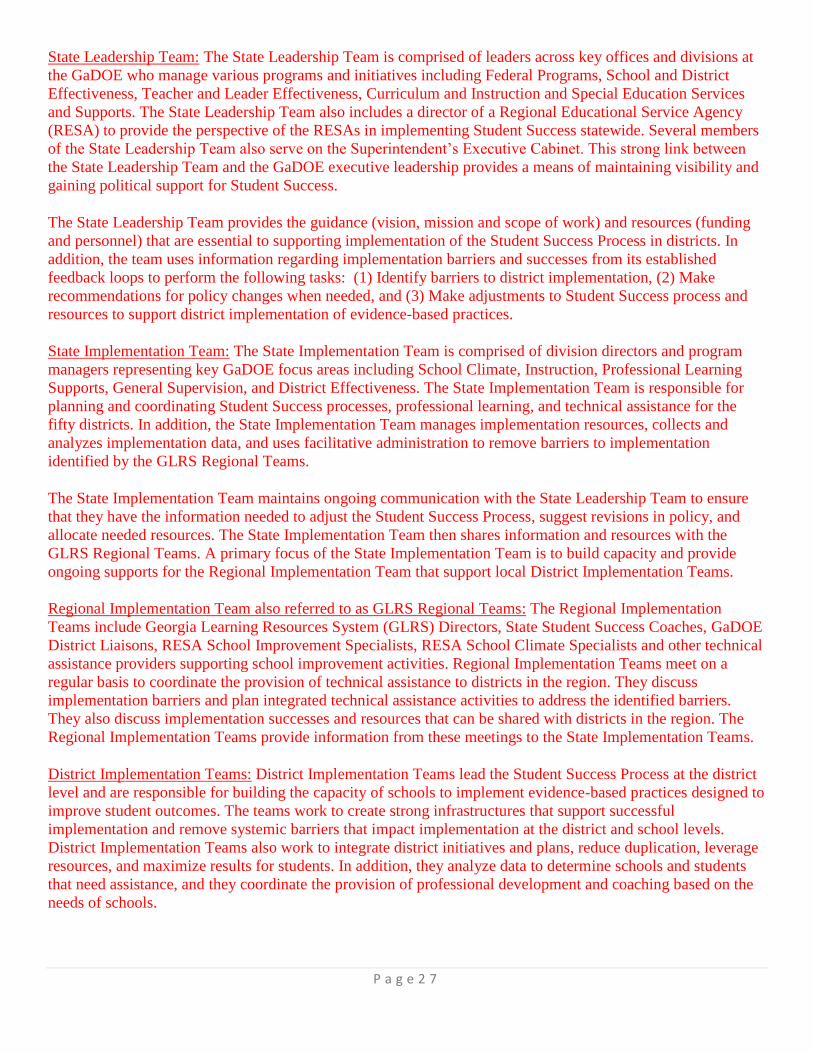
P a g e 2 7
State Leadership Team: The State Leadership Team is comprised of leaders across key offices and divisions at
the GaDOE who manage various programs and initiatives including Federal Programs, School and District
Effectiveness, Teacher and Leader Effectiveness, Curriculum and Instruction and Special Education Services
and Supports. The State Leadership Team also includes a director of a Regional Educational Service Agency
(RESA) to provide the perspective of the RESAs in implementing Student Success statewide. Several members
of the State Leadership Team also serve on the Superintendent’s Executive Cabinet. This strong link between
the State Leadership Team and the GaDOE executive leadership provides a means of maintaining visibility and
gaining political support for Student Success.
The State Leadership Team provides the guidance (vision, mission and scope of work) and resources (funding
and personnel) that are essential to supporting implementation of the Student Success Process in districts. In
addition, the team uses information regarding implementation barriers and successes from its established
feedback loops to perform the following tasks: (1) Identify barriers to district implementation, (2) Make
recommendations for policy changes when needed, and (3) Make adjustments to Student Success process and
resources to support district implementation of evidence-based practices.
State Implementation Team: The State Implementation Team is comprised of division directors and program
managers representing key GaDOE focus areas including School Climate, Instruction, Professional Learning
Supports, General Supervision, and District Effectiveness. The State Implementation Team is responsible for
planning and coordinating Student Success processes, professional learning, and technical assistance for the
fifty districts. In addition, the State Implementation Team manages implementation resources, collects and
analyzes implementation data, and uses facilitative administration to remove barriers to implementation
identified by the GLRS Regional Teams.
The State Implementation Team maintains ongoing communication with the State Leadership Team to ensure
that they have the information needed to adjust the Student Success Process, suggest revisions in policy, and
allocate needed resources. The State Implementation Team then shares information and resources with the
GLRS Regional Teams. A primary focus of the State Implementation Team is to build capacity and provide
ongoing supports for the Regional Implementation Team that support local District Implementation Teams.
Regional Implementation Team also referred to as GLRS Regional Teams: The Regional Implementation
Teams include Georgia Learning Resources System (GLRS) Directors, State Student Success Coaches, GaDOE
District Liaisons, RESA School Improvement Specialists, RESA School Climate Specialists and other technical
assistance providers supporting school improvement activities. Regional Implementation Teams meet on a
regular basis to coordinate the provision of technical assistance to districts in the region. They discuss
implementation barriers and plan integrated technical assistance activities to address the identified barriers.
They also discuss implementation successes and resources that can be shared with districts in the region. The
Regional Implementation Teams provide information from these meetings to the State Implementation Teams.
District Implementation Teams: District Implementation Teams lead the Student Success Process at the district
level and are responsible for building the capacity of schools to implement evidence-based practices designed to
improve student outcomes. The teams work to create strong infrastructures that support successful
implementation and remove systemic barriers that impact implementation at the district and school levels.
District Implementation Teams also work to integrate district initiatives and plans, reduce duplication, leverage
resources, and maximize results for students. In addition, they analyze data to determine schools and students
that need assistance, and they coordinate the provision of professional development and coaching based on the
needs of schools.

P a g e 2 8
The membership of District Implementation Teams varies based on a number of factors including district size
and infrastructure. In some districts, the District Leadership Teams, which are comprised of the Superintendent
and other key administrators/leaders from Human Resources, Finance, Data, Curriculum, and Special
Education, directly guide the Student Success Process in the districts. In other districts, separate District
Implementation Teams are established to focus on the work under the leadership of the District Leadership
Team. These teams may include members from district leadership, as well as, other staff actively involved in
designing and implementing Student Success activities in the districts. Regardless of the team structure utilized,
it is essential that District Implementation Teams be comprised of staff from special education and general
education. If District Implementation Teams are established to work under the direction of the District
Leadership Teams, at least one member of the District Implementation Teams should also serve on the
Leadership Team to support communication.
District Implementation Teams provide information to the Regional Implementation Teams on implementation
barriers and successes, and they inform the Regional Implementation Team of technical assistance needs. The
District Implementation Teams the provide information and resources to the Building Implementation Teams.
Each district committed to a person to lead this work in the district (District Student Success Coach). The RIT
works diligently to build capacity for the District Leadership Team, to include the District Student Success
Coach. The collaboration represents the true opportunity to build capacity at the district level that can be
supported at the local level. It is important to note that the District Coach facilitates the local implementation of
evidence-based practices at the school level, along with building leadership; the RIT supports implementation
of this work.
School Implementation Teams: The School Implementation Teams are responsible for establishing processes in
the school to support the implementation of evidence-based practices designed to improve outcomes for
students. School Implementation Teams meet on a regular basis to analyze/review data to identify needs and
problem-solve solutions. Teams support the implementation of universal, targeted, and intensive practices to
support the needs of diverse learners. Team members coordinate professional learning and coaching within the
school and ensure that evidence-based practices are implemented with fidelity.
School Implementation Teams include principals, assistant principals, teachers, and other individuals as
determined appropriate by the school leadership. School Implementation Teams should include members that
represent the diverse populations (e.g. general education, special education, Title I, parents, community
members, students, etc.) within the school. School Implementation Teams share information about
implementation barriers and successes with the District Leadership Team.
Communication Protocols and Feedback Loops: The GaDOE has developed clearly defined processes,
protocols, and feedback loops to eliminate gaps in communication between various levels of the state’s system
(e.g. SEA, regional technical assistance agencies, districts, and schools). The cascading team structure,
described in the previous section, provides the conduit for communication and well-defined feedback loops to
support the sharing of information from one level of the system to another. For example, information about
barriers to implementation in schools and districts is shared with regional technical assistance providers who
assist them in addressing these barriers. Systemic issues that cannot be addressed at the regional levels are then
referred to the next highest level, the State Implementation Team. This team problem-solves issues for systemic
barriers and shares possible solutions with regional technical assistance providers supporting the district and
school teams. The State Implementation Team then shares information about systemic barriers to
implementation with the State Leadership Team who further works to resolve the barriers. In some instance, this
involves changes in state systems or policies. These changes are then communicated back down the cascading
team structures to local schools.

P a g e 2 9
Georgia has created a “Practice-Policy Communication Cycle” (State Implementation and Scaling-up of
Evidence-Based Practices Center) where information from practice is shared “up” the system and information
regarding changes in policy and resources is shared “down” the system. In addition to the vertical sharing of
information described above, processes have been established to promote horizontal communication. For
example, Regional Implementation Teams meet on a regular basis to discuss implementation status, problem-
solve difficult issues, and share resources. Opportunities have also been provided for district teams to share their
experiences in implementing Student Success improvement activities. During FFY 2015, almost four-hundred
team members attended two statewide Partnering for Student Success meetings where they had opportunities to
network with each other and participate in facilitated discussions about implementation barriers and successes.
The GaDOE has developed sample agendas for district, regional and state meetings in order to promote
structured times for team members to address implementation barriers and successes and to identify resources
and supports needed. These sample agendas provide a diagram that illustrates the level/team with which this
information should be shared. For example, district teams share with regional teams, and regional teams share
with state teams. In addition, online surveys have been created to allow for electronic submission of the
information via the feedback loops.
During the current year, the GaDOE has used information gathered through the feedback loops to make
adjustments in the Student Success process and timelines. Information about barriers experienced in districts
have also been used to inform the development and distribution of resources to support districts in
implementing the process.
c. Provide professional learning and technical assistance to state and regional technical assistance
providers to increase their capacity to support districts and schools in implementing evidence-based
practices
During Phase I, Georgia obtained feedback that the GLRS Regional Teams required technical assistance to
improve infrastructure and capacity for district implementation. The State included activities to build capacity
and ensure fidelity; however, additional supports were needed. As a result of this adjustment, the timeline for
transitioning the work to the district level was delayed.
Ongoing Professional Development for TA Providers: The technical assistance providers include at a
minimum, the GLRS, GaDOE District Liaison, and State Student Success Coach. The GaDOE District Liaison
is a Department staff who is paired with the GLRS to support the technical assistance for districts within that
region. The State Student Success Coach is a hired in each GLRS region to specifically support implementation
of the Student Success work for local districts identified as receiving intensive technical assistance. Georgia's
State Personnel Development Grant hired coaches who were selected to support the Student Success. The SSIP
evaluator worked closely with the Department to collect ongoing progress monitoring data that will support job
embedded learning for the TA providers. Each month, the TA providers receive ongoing technical assistance.
The State identified personnel as the Regional Implementation Team Coordinator to provide the general
supports and ensure fidelity of implementation across the regions. Implementation scales were developed to
guide local observations of teams leading the work and provide explicit feedback that would improve practices.
School and District Effectiveness Regional Meetings: During FFY 2015, the Division for School and District
Effectiveness executed a new plan to develop and provide professional development to local districts. Georgia
has been divided into six super regions that include multiple GLRS regions in each section. The six super
regions host a quarterly meeting of state and regional technical assistance providers to analyze data and develop
a comprehensive professional development plan for the region. The GLRS Regional Teams participate in these
meetings to ensure alignment among GaDOE divisions and the Student Success Process.

P a g e 3 0
Coherent Improvement Strategy Number Two: Improve district infrastructure and implementation of
evidence-based practices in fifty districts identified to receive intensive technical assistance to improve effective
instruction, engaging school climate, and transition
All districts received universal technical assistance to support the Student Success Process; however, only the
fifty districts received direct supports to assist the district with selection and implementation of evidence-based
practices. Georgia designed its SSIP to address a broad framework that would support local districts in the
selection and implementation of evidence-based practices. During data analyses and infrastructure development,
stakeholders noted that districts required additional supports to select and implement evidence-based practices.
Selection of evidence-based practices posed an issue because districts lacked capacity to align the work in a
comprehensive improvement plan that would support outcomes for all students. More importantly, the
improvement plans were not always based on data and clearly identified barriers that impeded student success.
Stakeholders noted that the implementation of a general framework delayed the intended progression of
supporting students with the appropriate practices. However, the components of Student Success create an
environment by which evidence-based practices can benefit students and improve outcomes.
During Phase I, Georgia identified three barriers that impeded school completion for all children-including
children with disabilities.
1. Access to the general curriculum;
2. Access to a positive school climate; and
3. Access to specially designed instruction.
The three barriers align with the framework suggested in the article "Addressing Dropout Related Factors at the
Local Level.” Districts will use the Student Success Process to guide the selection and implementation of
specific evidence-based practices, which will benefit targeted students at the school level. During Phase II, the
fifty districts prioritized infrastructure development at the district level and considered the following: (a)
universal evidence-based practices that are expected for all schools in the district, (b) targeted evidence-based
practices that are suggested for Select schools and (c) intensive supports (EBPs) for individual students in at
least one high school. The State believed that districts should pilot the work of supporting evidence-based
practices in a targeted school for targeted students. Based on local analyses, districts needed additional time to
adequately explore specific evidence-based practices for individual students because the universal and targeted
expectations were not always effective. The State believes that this process of supports will increase the scope
of the work and build long-term scalability.
At the school level, the district supports the Student Success components to include stakeholder engagement,
data analysis, barrier identification and action planning. Each school must commit to providing evidence-based
practices directly related to effective instruction, engaging climate and/or transition. The National Dropout
Prevention Center has a wealth of resources to support this selection. Currently, the State does not have one
specific evidence-based practice that all districts will implement. During Phase III, the Department will be able
to clearly identify targeted evidence-based practices across the fifty districts. If appropriate, the State will
consider necessary resources to support implementation of specific evidence-based practices as supported by
local district feedback and plans.

P a g e 3 1
Theory of Action
Optional Description
Stakeholders were critical in developing the Theory of Action and newly developed Logic Model. Improved
outcomes for SWD start with effective leaders at the LEA level. Leadership must be able to engage the
appropriate stakeholders to solve their own adaptive challenges and develop a differentiated plan to support
school-level change. Realizing that this change in adult practices must take place with multiple opportunities to
practice the new behavior with ongoing coaching and feedback, Regional Implementation Teams (RITs) are
critical partners.
GaDOE will collaborate with regional systems to provide a seamless support system for LEAs and schools.
Unfortunately, change will not happen if state and regional resources become the work; therefore, there must be
relevant opportunities to support LEAs as they address their own systemic issues and concerns through a
common systemic process. At the school level, appropriate interventions and supports decrease student risk
factors and improve school completion rate for students. Overall, leaders will become more proactive, and
classroom instruction will reflect rigor for all students.
Georgia has not revised the Theory of Action but created critical alignments among the Theory of Action,
Overarching Themes, Coherent Improvement Strategies, and the new Logic Model. The State strengthened this
area based on feedback during Phase I and believe that the new Logic Model creates a methodical flow of
activities to transition the work across all levels.
A graphic illustration that shows the rationale of how implementing the coherent set of improvement strategies
selected will increase the State’s capacity to lead meaningful change in LEAs, and achieve improvement in the
State-identified Measurable Result(s) for Children with Disabilities.

P a g e 3 2
Phase II: Infrastructure Development
During the infrastructure analysis completed for the Phase I submission of the SSIP, the GaDOE and its internal
and external stakeholders analyzed the State’s infrastructure and identified areas that would need to be
improved in order to support LEAs in implementing and scaling up evidence-based practices to improve
graduation rates for SWD. Based on this analysis, the GaDOE and its stakeholders have identified a robust set
of infrastructure improvement activities that are designed to improve the Department’s ability to support
districts in implementing the coherent improvement strategies and activities in a sustainable manner. These
activities will be developed over the life of the SSIP and adjusted as needed based on implementation process
and outcome data. More importantly, the State prioritized infrastructure development and supports as a high
priority of this work and identified this area as an explicit Coherent Improvement Strategy during Phase II.
The improvement strategies are listed below and are included in the Georgia SSIP Logic Model and
Implementation Plan located in Appendix A of this document.
In the following table, information is provided to support the need for each of the above improvement
activities by infrastructure area (e.g. governance, quality standards, fiscal, data. monitoring and
accountability, professional learning, and technical assistance). In addition, the improvement need directly
aligns with the impact of the implementation of the improvement activities on State’s ability to support
districts.
Infrastructure Area Relevant Improvement Strategies
Governance Develop, disseminate, and update Student Success Process, expectations, and related
resources
Align and integrate initiatives and plans at the state, regional, district, and school levels
to reduce duplication and leverage resources
Establish, maintain, evaluate, and update cascading team management and
implementation structures and communication protocols and feedback loops at state,
regional, district, and school levels
Data Develop, disseminate, and update Student Success Process, expectations, and related
resources
Fiscal Provide capacity-building grants to districts to support implementation of EBPs
Accountability and
Monitoring
Align and integrate initiatives and plans at the state and regional levels to reduce
duplication and leverage resources
Professional
Learning and
Technical
Assistance
Provide professional learning and technical assistance to state and regional technical
assistance providers to increase their capacity to support districts in implementing
evidence-based practices
Provide a seamless system of universal, targeted, and intensive technical assistance
(including professional development) to districts to build capacity of district and school
leaders to support teaching and learning
(a) Specify improvements that will be made to the State infrastructure to better support LEAs to
implement and scale up EBPs to improve results for children with disabilities.
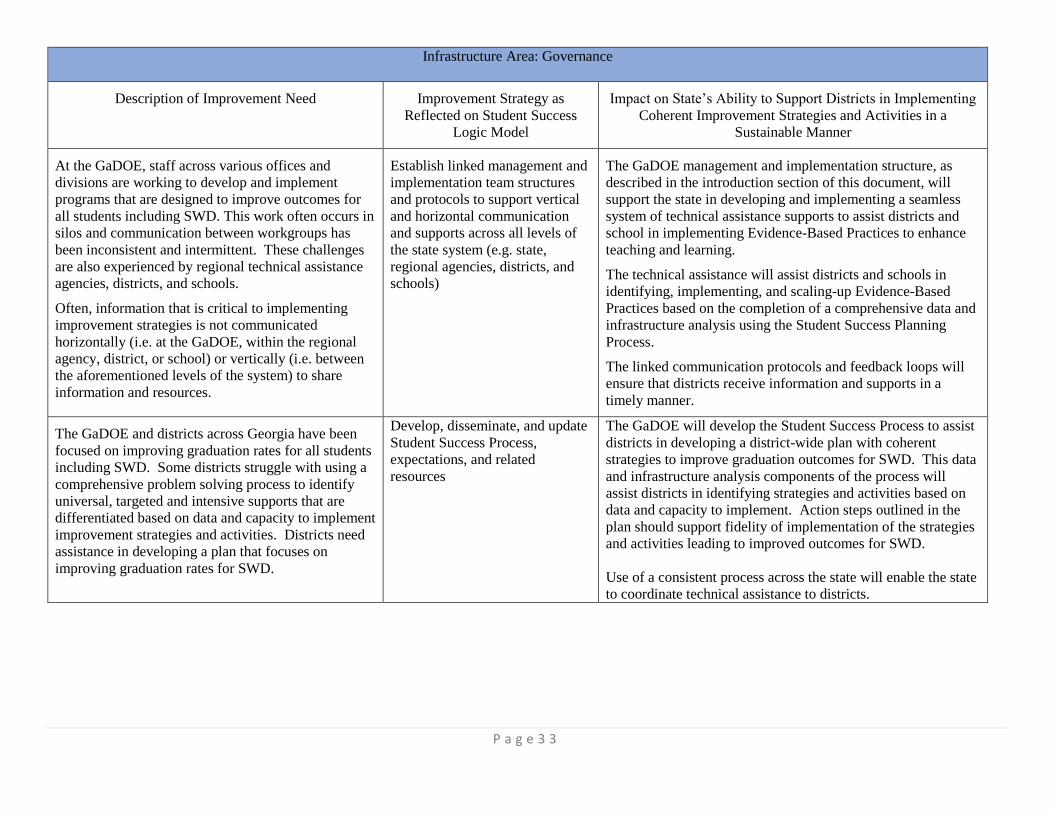
P a g e 3 3
Infrastructure Area: Governance
Description of Improvement Need Improvement Strategy as
Reflected on Student Success
Logic Model
Impact on State’s Ability to Support Districts in Implementing
Coherent Improvement Strategies and Activities in a
Sustainable Manner
At the GaDOE, staff across various offices and
divisions are working to develop and implement
programs that are designed to improve outcomes for
all students including SWD. This work often occurs in
silos and communication between workgroups has
been inconsistent and intermittent. These challenges
are also experienced by regional technical assistance
agencies, districts, and schools.
Often, information that is critical to implementing
improvement strategies is not communicated
horizontally (i.e. at the GaDOE, within the regional
agency, district, or school) or vertically (i.e. between
the aforementioned levels of the system) to share
information and resources.
Establish linked management and
implementation team structures
and protocols to support vertical
and horizontal communication
and supports across all levels of
the state system (e.g. state,
regional agencies, districts, and
schools)
The GaDOE management and implementation structure, as
described in the introduction section of this document, will
support the state in developing and implementing a seamless
system of technical assistance supports to assist districts and
school in implementing Evidence-Based Practices to enhance
teaching and learning.
The technical assistance will assist districts and schools in
identifying, implementing, and scaling-up Evidence-Based
Practices based on the completion of a comprehensive data and
infrastructure analysis using the Student Success Planning
Process.
The linked communication protocols and feedback loops will
ensure that districts receive information and supports in a
timely manner.
The GaDOE and districts across Georgia have been
focused on improving graduation rates for all students
including SWD. Some districts struggle with using a
comprehensive problem solving process to identify
universal, targeted and intensive supports that are
differentiated based on data and capacity to implement
improvement strategies and activities. Districts need
assistance in developing a plan that focuses on
improving graduation rates for SWD.
Develop, disseminate, and update
Student Success Process,
expectations, and related
resources
The GaDOE will develop the Student Success Process to assist
districts in developing a district-wide plan with coherent
strategies to improve graduation outcomes for SWD. This data
and infrastructure analysis components of the process will
assist districts in identifying strategies and activities based on
data and capacity to implement. Action steps outlined in the
plan should support fidelity of implementation of the strategies
and activities leading to improved outcomes for SWD.
Use of a consistent process across the state will enable the state
to coordinate technical assistance to districts.

P a g e 3 4
Infrastructure Area: Governance
Description of Improvement Need Improvement Strategy as
Reflected on Student Success
Logic Model
Impact on State’s Ability to Support Districts in Implementing
Coherent Improvement Strategies and Activities in a
Sustainable Manner
The GaDOE has established rigorous academic
standards, the Georgia Standards of Excellence, for
ALL students and has numerous resources have been
developed to support the implementation of the
standards. Access to the general education curriculum
and effective instruction was identified as a primary
causal factor to low graduation rates in Phase I of the
SSIP.
The GaDOE has also identified District and School
Performance Standards and utilized these standards as
a basis for its School and District Effectiveness
improvement initiatives. Special education leadership
is not consistently involved in implementing and
evaluating these standards at the school or district
levels. As a result, improvement initiatives within a
district have not traditionally been aligned leading to
duplication of resources and negatively impacted
outcomes.
Moreover, districts and school improvement plans that
are based on these standards are not aligned. Multiple
plans are submitted to the GaDOE leading to lack of
coordination and integration of improvement
initiatives.
Align and integrate initiatives and
plans at the state, regional, district
and school levels to reduce
duplication and leverage
resources
Alignment and integration of initiatives and plans based on
quality standards will reduce duplication, leverage resources,
and maximize results for students with disabilities. At the
GaDOE, this alignment and integration will ensure that
multiple offices and divisions have a common focus and
aligned activities to support districts and schools.
When districts and schools are creating integrated plans and
technical assistance providers are working in a coordinated
manner to align the provided supports, it is likely that districts
and schools will be more effective implementing coherent
improvement strategies and activities in a sustainable manner.

P a g e 3 5
Infrastructure Area: Fiscal
Description of Improvement Need Improvement Strategy as
Reflected on Student Success
Logic Model
Impact on State’s Ability to Support Districts in Implementing
Coherent Improvement Strategies and Activities in a
Sustainable Manner
The GADOE requires districts to submit budgets
through the LEA Consolidated Application Website
which supports districts in leveraging resources across
programs to ensure that all children have an
opportunity to meet state academic achievement
standards. In addition, consolidating the planning and
program requirements across all programs
participating in the LEA Consolidated Application
process eliminates the need for districts to submit
multiple plans, thus making the application process
more efficient for applicants.
The State appropriate 1 billion dollars in funding
across programs. However, districts can benefit from
additional capacity building grants to support the
implementation of intensive improvement initiatives.
For example, districts have reported difficulty in
securing funding for district coaches to support the
implementation of Evidence-Based Practices with
fidelity.
In an effort to align and integrate plans and initiatives,
LEAs required to provide Coordinated Early
Intervening Services (CEIS) must integrate
improvement planning with the comprehensive
Student Success Process to maximize use of funds.
The GaDOE allocates and distributes funds to support
local GLRS, which provide direct TA for the SSIP
process.
Provide capacity-building grants
to intensive districts to fund
coaching supports and implement
evidence-based practices
The GaDOE does not have the capacity to provide coaching
supports directly to schools and districts. Fidelity of
implementation and subsequent outcomes will be greatly
supported by district coaches who can support school leaders
and teachers in selecting, implementing, and evaluating the
impact of Evidence-Based Practices.

P a g e 3 6
Infrastructure Area: Data
Description of Improvement Need Improvement Strategy as
Reflected on Student Success
Logic Model
Impact on State’s Ability to Support Districts in Implementing
Coherent Improvement Strategies and Activities in a
Sustainable Manner
As described in Phase I of the SSIP, Georgia has a
robust data collection, analysis, and reporting system.
Districts and schools are engaged in analyzing data to
support identification and implementation of
improvement strategies and activities.
Although the state has designed and implemented a
State Longitudinal Data System and reporting system,
districts and schools need supports for analyzing and
using data to inform instruction for students
Tools and templates are needed to assist district and
school personnel in identifying multiple data sources
for analysis and identifying gaps in performance
among subgroups that will support the identification
of low performing schools and students in need of
additional supports.
Develop, disseminate, and update
Student Success Process,
expectations, and related
resources
If districts use multiple data sources and a common process and
associated resources for analyzing data, the GaDOE can
develop statewide professional learning and technical
assistance to support districts.
Districts will benefit from data analysis resources to assist them
in identifying low performing schools and students and in
determining the causal factors associated with this low
performance.
The GaDOE will develop a data toolkit and companion
resources to support districts in this effort. Use of the toolkit
and resources will lead to appropriate identification of target
schools and students and the identification of appropriate
improvement strategies to improve outcomes including
graduation rate.

P a g e 3 7
Infrastructure Area: Monitoring and Accountability
Description of Improvement Need Improvement Strategy as
Reflected on Student Success
Logic Model
Impact on State’s Ability to Support Districts in Implementing
Coherent Improvement Strategies and Activities in a
Sustainable Manner
The Division for Special Education Services and
Supports has been working to streamline monitoring
and accountability activities in its commitment to
implement a system of results-focused monitoring.
Despite the efforts that have been made in this area,
there are some monitoring activities that have
remained “siloed”. For example, monitoring for
significant disproportionality has been conducted in
isolation and districts were required to develop
Coordinated Early Intervening Services (CEIS) Plans
and Corrective Action Plans (CAPS), if needed.
Many of the causal factors identified in the Significant
Disproportionality Self-Assessment are the same as
those that are being identified by district personnel as
they are completing the data and infrastructure
analyses for Student Success. Under the current
monitoring and accountability system, districts would
have to develop separate plans for Student Success
and CEIS. This is not efficient and leads to
duplication of resources.
Align and integrate initiatives and
plans at the state, regional,
district, and school levels to
reduce duplication and leverage
resources
Alignment and integration of monitoring activities at the
GaDOE will enable the Department to leverage the expertise
and resources across units within special education. For
example, when monitoring for Significant Disproportionality,
staff within the Monitoring unit were responsible for the
compliance and program improvement components. Staff from
other units such as Positive Behavioral Interventions and
Supports (PBIS) and Curriculum were not engaged in this
monitoring or follow-up support. Discipline and insufficient
access to effective instruction are two causal factors in districts
being identified with significant disproportionality; yet, some
staff were not involved in this work.
Within districts, alignment and integration of the SSIP will
reduce duplicate processes such as conducting a comprehensive
data analysis and submitting duplicate plans- Student Success
and CEIS.

P a g e 3 8
Infrastructure Area: Professional Learning and Technical Assistance
Description of Improvement Need Improvement Strategy as
Reflected on Student Success
Logic Model
Impact on State’s Ability to Support Districts in Implementing
Coherent Improvement Strategies and Activities in a
Sustainable Manner
The GaDOE and its regional technical assistance
agencies including Regional Education Service
Agencies (RESAs) and Georgia Learning Resource
System (GLRS) Centers) provide professional
learning and technical assistance to district personnel
on a variety of topics. These regional technical
assistance partners serve as the technical assistance
and professional learning boots on the ground for the
GaDOE. Each center employs staff with knowledge
and skills needed to support district general and
special education personnel.
During the development of Phase I and Phase II
components of the SSIP, the state identified a
continuing need to build the capacity of regional
technical assistance providers for additional
professional learning and technical assistance to
support access to the general education curriculum for
ALL students to include UDL; access to a positive
school climate for ALL students; and access to
Specially Designed Instruction for SWD. These
regional providers would then be responsible for
providing professional learning and coaching to
district personnel.
The GaDOE does not have the personnel needed to
provide all of the professional learning and technical
assistance to address these issues.
Provide professional learning and
technical assistance to state and
regional technical assistance
providers to increase their
capacity to support districts in
implementing evidence-based
practices
Provide a seamless system of
universal, targeted, and intensive
technical assistance (including
professional learning) to districts
to build capacity of district and
school leaders to support teaching
and learning
The GaDOE will leverage its regional technical assistance
agencies including Regional Education Service Agencies
(RESAs), Georgia Learning Resource System (GLRS), PBIS
State Coordinators, and Regional School Climate Specialists to
provide high quality professional learning and technical
assistance including coaching to district personnel. Without
this support, it would not be possible to achieve the changes in
adult practice in district administrators that are needed to
improve outcomes for SWD.

P a g e 3 9
Alignment of Improvement Plans and Initiatives
During Phase I of the SSIP submission, the GaDOE with input from internal and external stakeholders
completed a comprehensive analysis of improvement plans across general and special education in order to
identify duplication and gaps. This analysis revealed varying degrees of alignment and integration. The
following chart provides a listing of the current plans and initiatives that impact students with disabilities
Name of Current Improvement
Plan or Initiative
General
Education
Special
Education Alignment to Improvement Strategy
State Systemic Improvement Plan X X The State has identified increased graduation rate for
students with disabilities as the SIMR.
Georgia’s State Transition Plan X The State Transition Plan supports district-level
implementation of evidence-based practices specific
transition for college and career readiness. Transition
practices are included in the midterm outcomes collected
in Georgia’s SSIP.
Georgia Department of Education
Strategic Plan
X X The SSIP is included in the Department’s Strategic Plan
and identified as a measurable outcome.
Goal #1: Increase the percentage of high school
graduates who are college and/or career ready – the SSIP
is identified in the State Strategic Plan as a measurable
outcome under this goal.
Get Georgia Reading Campaign X This Campaign supports district, school and community
implementation of evidence-based practices specific to
reading/literacy instruction for young children. These
resources will support implementation of core instruction
and interventions/supports.
Every Student Succeeds Act
(ESSA)
X X The SSIP work supports local districts in improving data
and student outcomes as measured through the
accountability plan.
Georgia Department of Education
Literacy Plan
X X Georgia Literacy Plan supports district, school and
community implementation of evidence-based practices
specific to reading/literacy instruction. These resources
will support implementation of core instruction and
interventions/supports.
Project AWARE X X Georgia received the Now Is The Time – Project Aware
Grant from the Substance Abuse and Mental Health
Services Administration (SAMHSA). This grant is
providing the Department resources to develop and
establish protocols in collaboration with three local
schools districts designed to create a sustainable process
for providing mental health services to student in schools
through a partnership with community providers. This
process has the potential to provide a framework to
ensure every student in need receives the behavioral and
1(b) Identify the steps the State will take to further align and leverage current improvement plans and
initiatives in the State, including general and special education, which impact children with disabilities.

P a g e 4 0
Name of Current Improvement
Plan or Initiative
General
Education
Special
Education Alignment to Improvement Strategy
/or mental health support needed to reduce drop outs and
move additional SWD to a diploma.
Georgia State Personnel
Development Grant
X X The SPDG leveraged resources focused on improving
graduation outcomes for all students-including
SWD. Webpage: SPDG
CEEDAR Grant X CEEDAR stands for “Collaboration for Effective
Educator Development, Accountability and Reform.”
CEEDAR helps Institutions of Higher Education reform
their teacher and leader preparation programs, revise
licensure standards to align with reforms, refine
personnel evaluation systems, and realign policy
structures and professional learning systems.
Georgia’s CEEDAR team has addressed the issues of
alignment of teacher preparation programs and new
certification requirements in an effort to improve the
teacher workforce available to support the SSIP.
CEEDAR-GA Project Webpage Link
Equity X X The state equity plan submission has been realigned to
include the review of data including the graduation rate
gap between subgroups and the all student
rate. Additionally, the review of additional data elements
at the school level are designed to bring attention to the
placement of staff in low performing schools. Georgia’s
Equity Webpage Link
School and District Effectiveness X X Partnership with School and District Effectiveness has
been a critical partnership as the State moves to align
initiatives in the LEAs. 30 of the 50 intensive districts
also are working with the School and District
effectiveness initiatives. Georgia’s School and District
Effectiveness Webpage Link
Positive Behavioral Interventions
and Supports (PBIS)
X X The State’s PBIS plan supports implementation of EBPs
specific to improving positive school climate and
provision of behavioral/social emotions supports for
students. Georgia’s PBIS Webpage Link
The following specific steps have been taken to foster further alignment of these plans and initiatives:
1) Georgia established a State Collaborative Meeting that includes diverse Department Leadership to meet biweekly
and discuss progress of implementation in local school districts. Through this collaborative process, Federal
Programs aligned resources to provide a comprehensive conference for local districts.
2) Division for Special Education and Division for School and District Effectiveness engage in ongoing planning
and implementation to support targeted districts with improvement efforts.
3) The GaDOE Executive Cabinet membership was adjusted to include varied leaders across the Department and
encourage alignment of plans and initiatives.
4) The Executive Leadership provided technical assistance for all personnel and staff on the new strategic plan and
discussed various opportunities to align the work.
5) The Department is exploring steps to align the work and support a multi-tiered system of supports for local
districts.
P a g e 4 1
It is expected that the steps taken to create alignment of improvement plans and initiatives across general and special
education (as described above), will have a positive impact on all students-including children with disabilities. Many of
these initiatives support local implementation in common districts; therefore, the alignment will maximize resources and
reduce redundant planning.
The SSIP State Leadership Team takes responsibility for implementing the changes to Georgia’s infrastructure,
resources, expected outcomes and timelines for completing improving efforts. Georgia’s Leadership Team
includes representation from Special Education, Curriculum and Instruction, School Improvement, School and
District Effectiveness, Teacher and Leader Effectiveness, and RESA. The SSIP Evaluator worked diligently to
assist Georgia in developing critical feedback loops that provide the Leadership Team with the appropriate
information necessary for program improvements. The State identified a SSIP State Coordinator who supports
the Leadership Team with these tasks.
During Phase II, the GaDOE extended the invitation to the Dr. Dean Fixsen, at the State Implementation &
Scaling-up Evidence-based Practices (SISEP), to support Georgia by administering the State Capacity
Assessment for Scaling up Evidence-Based Practices. The SSIP State Leadership Team, along with additional
critical leaders across the Department, completed the review. Georgia’s findings indicated the following: (a)
54% for State Investment, (b) 50% for State Alignment, and (c) 38% for Commitment to Regional
Implementation Capacity. Georgia’s total score was 48%, which indicated significant progress in a relatively
short period of time. The State Capacity Assessment empowered the Department with critical data to support
required next steps for this work.
Create a commitment of shared leadership for the SSIP at the state level and commit the necessary
personnel and/or resources
Provide necessary structure, supports and training for Regional Implementation Teams
Structure supports and accountability systems to encourage and strengthen the alignment of this work at
each level
During Phase II, Georgia identified additional resources necessary to implement the infrastructure changes. In
addition to the current State Coordinator for SSIP, Georgia is considering pairing the special education
personnel with a representative from general education. Perhaps the most efficient way to support children with
disabilities in a diverse manner would be to show collaborative leadership for the initiative across the
Department. If approved, the intended timeline for implementation will be the 2016-17 school year. The paired
leadership will foster deeper collaboration between special education and school improvement.
The Department will continue to engage internal and external stakeholders throughout the development and
implementation of these changes. Stakeholders will convene, either in person or through technology, at least
quarterly and offer the state ongoing feedback. The SSIP State Leadership Team will convene biweekly and use
the newly revised logic model to message the roles and responsibilities of this group.
(c) Identify who will be in charge of implementing the changes to infrastructure, resources needed,
expected outcomes, and timelines for completing improvement efforts.
(d) Specify how the State will involve multiple offices within the State educational agency (SEA), as
well as other State agencies and stakeholders in the improvement of its infrastructure.

P a g e 4 2
Phase II: Support for LEA Implementation of Evidence-Based Practices
The primary role of the State SSIP State Coordinator is to guide the development and implementation process at
the state level. The primary role of the SSIP Regional Coordinator is to guide development and implementation
at the regional level and ensure fidelity of implementation among the GLRS Regional Teams-also referred to as
the Regional Implementation Teams. The Regional Coordinator has provided leadership and support for
Georgia State Personnel Development Grant (SPDG) and receives ongoing training and credentials in this area.
How will the State support LEAs during the implementation of evidence-based practices? As stated earlier,
LEAs struggled to identify appropriate evidence-based practices and implement those practices with fidelity.
The Coherent Improvement Strategies support the district in both selection and implementation of evidence-
based practices, as appropriate. Georgia’s SSIP does not specifically identify one evidence-based practice that
all fifty LEAs will implement with targeted students. Instead, the plan provides a supportive framework by
which LEAs can appropriately select evidence-based practices that are aligned with the intended outcome and
implement those practices with fidelity.
During Phase II, the Division for District Effectiveness required all districts with identified priority and/or focus
schools to complete a self-assessment that aligned with the Georgia District Performance Standards.
Approximately thirty of the district teams that completed the self-assessment received intensive technical
assistance among the identified fifty districts. The evidence supported that many of these districts rated local
implementation as “limited development” in several indicators that directly impact student supports. The self-
assessment findings align with Georgia’s decision to prioritize infrastructure development and selection of
evidence-based practices prior to implementation.
Use a collaborative, data-driven planning process at the district and school levels for improving student
learning
Use protocols and processes for problem solving, decision-making, and removing barriers
Guide and supports schools in the selection and implementation of effective strategies, programs, and
interventions to improve student learning
Use processes to monitor and provide timely guidance, support, and feedback to individual schools as
they implement improvement plans
Assess the impact of professional learning on staff practices and student learning and make adjustments
Engage and support all schools in systematic processes for curriculum design to align instruction and
assessments with the required standards
February 29, 2016, the fifty LEAs submitted evidence to support implementation of the Student Success
Process after a comprehensive review of data and identification of barriers. LEAs used many of the resources,
such as the data toolkit, to support the robust analysis across federal and state programs. Each district was asked
to identify short-term next steps critical to support the district in clearly identifying universal, targeted and
(a) Specify how the State will support LEAs in implementing the Evidence-Based Practices that will
result in changes in LEA, school, and provider practices to achieve the SIMR(s) for children with
disabilities.
(b) Identify steps and specific activities needed to implement the coherent improvement strategies.
Include communication strategies, stakeholder involvement; how identified barriers will be addressed;
and who will be in charge of implementing. Include how the activities will be implemented with
fidelity; the resources that will be used to implement them; and timelines for completion.

P a g e 4 3
intensive supports for schools and students. The RITs supported districts in completing this analysis and
outlining the next steps. The next update is July 31, 2016 in which the fifty districts will submit a plan to
support specific evidence-based practices at the school level. RITs will use various resources to help districts
select evidence-based practices that would address the local barriers and support the State’s SIMR. The
National Dropout Prevention Center identified specific practices aligned with increasing school completion and
discussed the size effect of each practice. A Meta-Analysis, of twelve strategies, concluded an overall effect
size of .15, and the twelve strategies are shown below.
1) Behavioral Intervention, Career Development/Job Training, Family Engagement, and Literacy
Development demonstrated a larger effect size than the overall effect on dropout thus improving school
completion.
2) Academic Support, Health and Wellness, Life Skills development, and Mentoring demonstrated a
commensurate effect size.
3) Afterschool, School/Classroom Environment, Service-Learning, and Work-Based Learning demonstrate
a smaller effect size than the overall effect size.
RITs will receive ongoing training and supports to use the National Dropout Prevention Center research to
guide local districts in selecting a specific evidence-based practice. In general, these practices can be organized
by infrastructure, instruction, or climate. As the district identifies barriers to student success, the RITs will share
specific research and resources that empower the District Implementation Teams to explore appropriate
evidence-based practices. The research, supporting effect size, can provide critical information as District
Implementation Teams select effective practices that will result in the greatest improvement of student
outcomes.
During Phase I, numerous districts discussed concerns with engaging school climates and explored possible
options to support evidence-based practices in this area. Several of the fifty districts currently implement
district-wide PBIS but could benefit from additional supports in this area. As an example, a local district might
conclude that integrating behavioral interventions and mentoring supports for targeted students will improve
school completion. The State will guide LEA selection and implementation, as well as, offer appropriate
supports to do this work. Stakeholders have suggested that the Department should allocate resources to support
LEAs in implementation, when available. Districts may opt to utilize Check and Connect, specific literacy
practices and interventions, or effective transition planning as a few examples. The RITs would guide the
district in clearly identifying the evidence-based practices and creating critical connections with the data
analysis and local infrastructure. Another critical aspect of the work creates a fidelity of implementation that
ensures evidence-based practices are implemented as designed. During Phase III, Georgia will be able to update
this section and clearly define the specific evidence-based practices implemented across the fifty districts and
how the Department continues to support this implementation. RITs will facilitate the review of literature to
include well-vetted resources such as The National Dropout Prevention Research in which many of these
practices are currently available on the GA SPDG website.
The State Director of Special Education and the SSIP State Coordinator created a seamless system of feedback
and communication to support this work. As needed, the State Director provides consistent communication
across the RITs and local districts to share clear expectations. The SSIP Webpage provides timely updates and
access to resources for stakeholders, RITs and local districts. The Quarterly Leadership Launch Webinars, for
the Fifty Districts, created a viable strategy to inform local leadership and shore up the foundation of this work.

P a g e 4 4
During FFY 2015, Georgia will engage in ongoing planning meetings to consider additional resources needed
for implementation and adjust timelines based potential developments during Phase III. By this juncture, local
districts will have identified barriers that negatively impact school completion in the district and indicated the
connections among those barriers to the state-identified barriers. March – June 2016, Regional Implementation
Teams will continue to provide technical assistance for these fifty districts to ensure the barriers are supported
by data and aligned with specific evidence-based practices currently being explored by the local districts. The
RITs will use the Implementation Science Hexagon to assist local District Implementation Teams to explore
readiness and ultimately select, implement, sustain, and scale up the evidence-based practices.
Based on a preliminary review of district plans, most leadership teams indicated barriers across access to the
general curriculum, access to specially designed instruction, and access to engaging school climate. In addition
to specific practices, district leadership identified several concerns with infrastructure and supports for leaders
and teachers that must be addressed through this process. In some instances, the identification of barriers was
clear, logical and aligned with the analysis of data. In other cases, district leadership identified strategies to
eradicate the barriers but neglected to clearly identify those barriers. In other examples, identified barriers were
critical symptoms but not necessarily the root causes of the problem.
The RITs will use the Student Success Process Planning Rubric to provide feedback for the fifty districts and
consultation to the leadership teams to strengthen the improvement process, as needed. During a technical
assistance for RITs, the SSIP Evaluator and Regional Coordinator will provide professional development in this
area to ensure fidelity and consistent messaging. The initial review provided the State Leadership Team with
ample information to outline a general plan for implementation of evidence-based practices related to climate,
instruction, and infrastructure among the fifty districts.
The State will involve multiple offices within the SEA (and other State agencies) to support LEAs in scaling up
and sustaining the implementation of the evidence-based practices once they have been implemented with
fidelity. The SSIP State Coordinator will work with the Regional Coordinator to visually map implementation
of the practices among the fifty districts. This information will be communicated with other divisions and will
increase opportunities to align the work and scale up the practices. LEAs are required to select one high school
during the initial phase to ensure fidelity of implementation will not be compromised. Overtime, the RITs will
support the fifty districts in developing plans to sustain and scale up the evidence-based practices across the
districts. The Department will seek opportunities to support local implementation and invite additional districts
to benefit from these practices, as well.

P a g e 4 5
Phase II: Evaluation Alignment with Theory of Action and Other Components
Evaluation Type and Resources:
The GaDOE has used an external evaluator to support the development of the evaluation plan. This evaluator
has worked closely with the Student Success Leadership and Implementation Teams and with stakeholders in
identifying evaluation questions and associated measurements. The evaluation services, which are estimated to
be about .25 FTE for FFY 2015, are procured through a contract with the GaDOE and supported with IDEA
funds. The current level of funding is sufficient to support evaluation activities required for the SSIP. The
GaDOE will review the contract for evaluation services on an annual basis and will make adjustments as needed
based on the scope of the evaluation.
The Department is also working to build internal state capacity to support the SSIP evaluation. The external
evaluator will be working with the Student Success Leadership Team to identify evaluation activities that can be
completed internally and to ensure alignment with external evaluation activities.
Identification of Inputs, Outputs, and Outcomes:
The GaDOE with input from stakeholders has developed a Student Success Logic Model that is aligned with the
Theory of Action and clearly articulates and connects the inputs, outputs, and short and long term outcomes for
the SSIP. A copy of the logic model is included in Appendix B of this document. A summary of the logic
model is included below:
The inputs represent the investments and resources that support the implementation of the SSIP and include:
• Partnerships with internal and external stakeholders
• GaDOE personnel across offices and divisions
• Regional technical assistances agencies and providers (e.g. RESA, GLRS)
• GaDOE standards, frameworks, toolkits, and other resources
• Comprehensive data system to support decision making at all levels of the state system
• IDEA funding to support SSIP development and implementation
• Alignment with Georgia State Personnel Development Grant
• Alignment with Project Aware (embedded in the Statewide PBIS Plan)
• Alignment with Statewide PBIS
• Alignment with the CEEDAR Grant
The outputs below represent the broad infrastructure strategies that are addressed in the Student Success
Evaluation Plan included in Appendix A. In addition, detailed activities for each of the strategies is included in
the Student Success Improvement Plan located in Appendix A.
Coherent Improvement Strategy One: Improve State and Regional Infrastructures to better support districts to
implement and scale up EBPs that will improve graduation rates for all students-including SWD.
3(a) Specify how the evaluation is aligned to the theory of action and other components of the SSIP and
the extent to which it includes short-term and long-term objectives to measure implementation of the
SSIP. Specify its impact on achieving measurable improvement in SIMR(s) for children and youth with
disabilities.

P a g e 4 6
• Align and integrate initiatives and plans at the state, regional, district, and school levels to reduce
duplication and leverage resources
• Establish, maintain, evaluate, and update cascading team management and implementation structures
and communication protocols/feedback loops at state, regional, district and school levels
• Provide professional learning and technical assistance to state and regional technical assistance
providers to increase their capacity to support districts and schools in implementing Evidence-Based
Practices
Coherent Improvement Strategy Two: Improve district infrastructure and implementation of EBPs in fifty
districts identified to receive intensive technical assistance to improve effective instruction, engaging school
climate, and transition. Applies only to the 50 districts selected to receive intensive technical assistance.
Short-term, mid-term, and long-term outcomes were also identified and represent changes in outcomes that are
expected to occur based on implementation of the improvement strategies listed above.
Short-term Outcomes represent changes in capacity at each level of the state system:
Improve state and regional capacity (e.g. knowledge/skills, organizational structures, and resources) to
support districts in implementing Evidence-Based Practices
Improve practitioner (district and school) knowledge of data-based decision making and selection and
use of Evidence-Based Practices.
Improve district and school infrastructure to support educators in implementing Evidence-Based
Practices to support teaching and learning
Increase engagement of stakeholders in planning, implementing, and monitoring improvement initiatives
Mid-term Outcomes represent changes in practices related to teaching and learning and include some student
level outcomes in key areas related to barriers identified in Phase I Data Analysis (e.g. access to general
curriculum, access to specially designed instruction, and access to positive school climate) and of factors
contributing to low graduation rates.
Improve implementation of evidence-based practices to support teaching and learning to ensure access
to the curriculum for all students
Improve school climate including student attendance, engagement, and behavior
Improve student achievement
Improve transition practices and outcomes
The long-term outcome represents Georgia’s State-identified Measurable Result which is “Increase percentage
of students with disabilities exiting high-school with a general education diploma”.
Alignment with Other Components:
The Student Success Evaluation Plan is clearly aligned to the theory of action identified in Phase I of the SSIP
and to other components of the SSIP. Georgia’s theory of action is that building the capacity of district
leadership to support school leadership will result in improvements in teaching and learning and will ultimately
lead to students achieving better outcomes and graduating from high school with a general education diploma.
Based on the above theory of action, it became apparent that in order to improve teaching and learning, it would
be necessary to improve the state and regional infrastructure to increase their ability to support districts in the
selection, implementation and scaling-up of Evidence-Based Practices (Coherent Improvement Strategy One).
In addition, in order to improve graduation rates and meet the SIMR, some targeted districts would need more

P a g e 4 7
intensive supports to assist them in implementing Evidence-Based Practices to improve effective instruction,
engaging social climate, and transition.
Within this theory of action and the two improvement strategies listed above, several strands emerged related to
improving infrastructure and building capacity. These were,
Alignment and integration of plans, initiatives, and resources at all levels of the state system
Communication in and between all levels of the system
Professional learning and technical assistance to build capacity of technical assistance providers and
district/school personnel in the selection and implementation of evidence based practices
Development of the theory of action led to broad evaluation questions which tested the theory of action for the
SSIP. These questions included:
What types of resources and investments can we leverage to support the implementation of Student
Success? (Inputs)
What types of strategies and activities will we need to implement to address the strands from the theory
of action and achieve to the desired outcomes? (Outputs)
What are the short- and medium-term outcomes that will lead us to our State-identified Measurable
Result (i.e. long-term outcome) of improving graduation rates of students with disabilities?
On-going discussions related to these broad questions based on the theory of action led to the development of
the Student Success Logic Model which includes a visual description of the inputs and outputs that were needed
to achieve the desired short and mid-term outcomes leading to the long-term outcome of improving graduation
rates. The logic model was reviewed with stakeholders and changes were made based on their input. The logic
model is included in Appendix A (page three).
Following the development of the logic model, the State Leadership and Implementation Teams worked to
develop a comprehensive improvement plan that will guide implementation through FFY 2018. This plan,
which is referred to as the Student Success Implementation plan, is included in Appendix A of the SSIP Phase II
and is based on the two improvement strategies designed to improve infrastructure and support practice that are
needed to achieve the outcomes on the logic model leading to the SIMR. For each improvement strategy, the
following components are included:
Level of state system being addressed (e.g. state, regional, district)
Specific activities/steps needed to implement the strategies
Responsible Individuals or Groups
Timelines for completing the activities
Resources needed to implement the activities
Next, the GaDOE Leadership and Implementation Teams and its stakeholders developed an evaluation plan
based on the strategies, activities, and timelines established in the Student Success Improvement Plan. The
evaluation plan includes:
Evaluation questions specific to each of the improvement strategies. (e.g., Has collaboration of GaDOE
staff increased as a result of Student Success Implementation? Was the evidence-based practice
implemented with fidelity by regional, district, and school teams)
Performance indicators which provide information on whether or not the activities for each of the
improvement strategies were implemented and accomplished as intended and outcomes were achieved

P a g e 4 8
(e.g. Percentage of Student Success processes, expectations, and resources that were completed within
proposed timelines, Percentage of teachers implementing evidence-based practices with fidelity, etc.)
Data Collection Methods and Sources that reveal what measurements will be used and methods for
collecting the data
Responsible Individuals or Groups which identifies the persons or groups of persons responsible for
collecting and analyzing the data
Timelines for completing data collection and analysis activities
The Student Success Implementation and Leadership Teams with input from stakeholders have worked
diligently to ensure that strong connections exist and are evident between the theory of action, the logic model,
and the improvement and evaluation plans.
Stakeholder Involvement
Recruitment of Stakeholders:
The GaDOE worked extensively during Phase I of the SSIP to recruit a diverse group of stakeholders to support
the development and implementation of the SSIP. Internal stakeholders included staff from the Division for
Special Education Services and Supports and partners from key offices including the Division for School
Improvement, Title I, Division for Curriculum and Instruction, Division for Teacher and Leader Effectiveness,
Divisions for Accountability and Assessment, Career, Technical and Agricultural Education (CTAE), and
Division of Data Collections. External stakeholders included individuals representing Colleges and
Universities, regional technical assistance agencies including Georgia Learning Resources System and Regional
Educational Service Agencies, the Georgia Parent Training and Information Center, the Georgia Vocational
Rehabilitation Agency, Babies Can’t Wait: Part C, the Governor’s Office of Student Achievement, and the
Georgia Department of Early Care and Learning. Special education directors, parent mentors, and members of
the State Advisory Panel for Special Education also served as stakeholders for the SSIP. Many of these
stakeholder groups were represented on the Student Success Stakeholder Committee that was convened during
the development of Phase I SSIP components and maintained to support Phase II development and
implementation.
In November 2015, the Student Success Stakeholder Committee met to provide input into the development of
the SSIP implementation and evaluation plans. In regards to the SSIP evaluation, the Committee helped
formulate evaluation questions and performance indicators.
The Student Success Stakeholder Committee discussed strategies for disseminating information about SSIP
implementation and outcomes to stakeholders in Georgia. Based on this discussion, the following strategies
have been targeted to share this implementation and outcome information:
Student Success webpage at http://www.gadoe.org/Curriculum-Instruction-and-Assessment/Special-
Education-Services/Pages/SSIP-.aspx to provide information about Student Success activities outcomes
to the public and all stakeholders. URL for the website will be shared with all stakeholder groups.
Agenda item on Division for Special Education Services and Supports staff meetings. Also include in
reports from Special Education during Executive Cabinet and State Board of Education Meetings
3(b) Specify how the evaluation includes stakeholders and how information from the evaluation will be
disseminated to stakeholders.

P a g e 4 9
Agenda items on Student Success Leadership and Implementation teams to share information with
internal stakeholders. Members of these teams will share with their respective offices and divisions.
Agenda item as placeholder for discussion on the State Advisory Panel for Special Education meetings.
Many stakeholder groups included above are represented on the State Advisory Panel.
Agenda items on various meetings for special education directors, RESA directors, and GLRS directors
including face-to-face and virtual meetings.
Updates and resources shared with Parent to Parent, Georgia’s Parent Training and Information Center
for dissemination to parents across Georgia.
Update reports provided to parent mentors funded by the GaDOE for dissemination to parents in local
school districts.
Following the November 2015 meeting, a subgroup of the Student Success Stakeholder Committee was formed
to specifically support the further development of the SSIP evaluation plan. This subgroup was referred to as the
Stakeholder Evaluation Workgroup, and it was comprised of external and internal stakeholders from the larger
Student Success Stakeholder Committee. The workgroup members provided input regarding revisions to the
Student Success Logic Model and evaluation questions. They also assisted in identifying measures and data
sources for the improvement activities associated with each of the coherent improvement strategies and for the
outcomes.
Development of Evaluation Questions:
The Student Success Stakeholder Committee discussed the improvement strategies and evaluation plan during
its November 2015 meeting. In regards to the evaluation plan, the committee helped formulate evaluation
questions and identified performance indicators based on the theory of action and logic model.
In the early spring, the Stakeholder Evaluation Workgroup reviewed the evaluation questions and performance
indicators that had been developed previously. They helped to identify additional questions and performance
indicators and were actively engaged in identifying data collection methods and timelines.
Continued Engagement of Stakeholders:
The GaDOE will continue to engage stakeholders from all groups referenced above in providing input into the
evaluation process and results. The entire committee and the evaluation workgroup will continue to be involved
in implementing the evaluation plan and reviewing process and outcome data. As stated previously information
about Student Success will be shared in all stakeholder meetings and feedback will be solicited on both the
process and outcomes.
The Student Success Leadership and Implementation Teams, with support from the external evaluator, will lead
the work in making adjustments to the evaluation plan and in disseminating information about implementation
process and outcomes.
Methods Used to Collect and Analyze Data
Evaluation data are collected on the implementation of the activities (process) and on the short, mid, and long
term outcomes identified by the GaDOE and its stakeholders. Both quantitative and qualitative data analysis
methods will be utilized. The Student Success Evaluation Plan, which is included in Appendix A, provides in-
3(c) Specify the methods that the State will use to collect and analyze data to evaluate implementation and
outcomes of the SSIP and the progress toward achieving intended improvements in the SIMR(s).

P a g e 5 0
depth information on the methods used to collect and analyze implementation and outcome data. Timelines and
targets are also provided.
Measurement Changes in Infrastructure and Alignment:
Improving the State’s infrastructure and alignment is a primary focus of Georgia’s SSIP. In fact, Coherent
Improvement Strategy One, is directed toward improving the State’s infrastructure to support districts in
implementing Evidence-Based Practices that will improve graduation rates. Based on the strands in the theory
of action, which form the basis of the activities for Strategy One, the State will be specifically working on:
Alignment and integration of plans, initiatives, and resources at all levels of the state system
Communication in and between all levels of the system
Professional learning and technical assistance to build capacity of technical assistance providers and
district/school personnel in the selection and implementation of evidence based practices
The above strands will be addressed at each of the levels of Georgia’s cascading management and
implementation structures (e.g. state, regional, district and school levels). The primary measure of changes in
state infrastructure will be the State Capacity Assessment (SCA) developed by the National Implementation
Research Network (NIRN) and the State Implementation and Scaling-up of Evidence-Based Practices Center
(SISEP). This assessment provides the State Leadership Team with a measure of state capacity (e.g. systems,
activities, and resources) to implement Evidence-Based Practices in three key areas: investment in
implementation and scaling, system alignment, and regional implementation team functioning. The SCA was
administered in January 2016 to establish baseline and will be repeated annually in the fall and spring of each
year to measure progress.
In Georgia, Regional Educational Service Agencies (RESAs) and Georgia Learning Resources System (GLRS)
serve as regional technical assistance agencies and they have a key role in supporting districts in improving
infrastructure and implementing Evidence-Based Practices. For the SSIP, GLRS Regional Teams have been
formed to support the implementation of Student Success in intensive districts, and Collaborative Communities,
which are operated by the GLRS Centers, support all districts in addressing implementation barriers and
successes. The State will use the Regional Capacity Assessment (RCA) developed by NIRN and SISEP to
measure changes in regional infrastructure and capacity. The RCA will be used to assist Georgia technical
assistance agencies in their efforts to facilitate district-level implementation of Evidence-Based Practices. The
RCAs will be administered annually, in the fall and winter with the initial administration in fall 2016.
Coherent Improvement Strategy Two focuses on improving district infrastructure and implementation of
Evidence-Based Practices in districts to improve effective instruction, engaging school climate and transition.
The District Capacity Assessment (DCA) developed by NIRN and SISEP will be used to measure changes in
district infrastructure and capacity to support schools in implementing evidence-based interventions that benefit
students. The DCA will be administered in targeted districts annually (fall and spring) beginning in the 2016 –
2017 school year. Student Success Plans submitted to the GaDOE each year will also be used as a means of
assessing infrastructure and capacity. The plans are rated by GLRS Regional Teams using a rubric, and
recommendations for district technical assistance are made based on the team review of the plan.
In addition to the assessments mentioned above, the GaDOE has developed measures to assess improvements in
infrastructure and capacity as well as alignment of initiatives at multiple levels of the State’s system. These are
included and based on the activities developed for each of the strands of the theory of action:
Alignment- Key Initiative and Plan Inventories which are completed at state and district levels to
measure changes in alignment and integration of major improvement initiatives and plans.
Cascading Team Structure and Communication- Evaluation of communication protocols and feedback
loops established across multiple levels of the State system

P a g e 5 1
Professional Learning and Technical Assistance- The Observation Checklist for High Quality
Professional Development will be used to ensure that professional development provided by state and
regional technical assistance providers is of high quality and is evidence-based. Coaching observations
will be conducted for each State Student Success Coach, and Coaching Effectiveness Surveys will be
completed by district personnel to assess the effectiveness of coaching supports.
Each of the measures included in Georgia’s evaluation plan are designed to measures changes over time. This
includes improvements in infrastructure. This Please refer to the Evaluation Plan in Appendix A for a complete
listing of evaluation methods, data sources, and timelines.
Criteria for Successful Implementation:
The GaDOE with input from stakeholders has developed a variety of measures to assess successful
implementation and to measure changes over time. These include implementation scales which assess fidelity
of implementation of the Student Success Process at multiple levels of the State system. The Regional Team
Implementation Scales is a fidelity measure that assesses the degree to which regional teams implement
meetings and technical assistance activities as intended. The District Implementation Scales measures the
degree to which districts implement the Student Success Process at the district level as intended, and the School
Implementation Scales measures fidelity of implementation at the school level.
As districts begin to support schools in implementing evidence- based practices for students, specific fidelity
measures will be developed for these practices to ensure fidelity of implementation. Fidelity measures,
methods, and timelines will be identified.
Data Collection System:
The State Leadership and Implementation Teams with input from the external evaluator and stakeholders have
developed a comprehensive data collection, analysis, and reporting system that includes both implementation
process (i.e. fidelity) data and data for short-, mid-, and long-term outcomes. Performance indicators, data
collection methods, persons responsible and timelines are included for each of the improvement strategies in the
Student Success Evaluation Plan which is included in Appendix B of this document.
For each improvement strategy, practice profiles have been developed for each of the improvement activities
linked to the strategies, and they are subsequently reviewed with relevant groups and individuals. These profiles
include the essential components of the activity and provide clear descriptions of what the process looks like.
The practice profiles form the basis of the associated implementation fidelity rubrics. For example, a practice
profile was developed for the GLRS Regional Team Meetings which have a critical role in the cascading system
of professional development and technical assistance. The profile was reviewed with GLRS Regional Teams in
November 2015. An on-line survey was used to collect data on the fidelity of implementation of each of the
essential components on the GLRS Team Meeting Fidelity Rubric. In addition, GLRS Directors send a copy of
the meeting agenda and discussion notes to the external evaluator. The teams’ responses in the on-line survey
are then compared to the agendas and discussion notes to verify information provided in the survey. These data
are reviewed on a regular basis and are used to inform adjustments that need to be made in the GLRS Regional
Team Meeting structure and/or function.
Please refer to the Student Success Evaluation Plan included in Appendix A to review fidelity measures for
each of the activities.
In Georgia’s SSIP, outcome data are collected to assess outcomes identified in the logic model and to assess
progress toward the SIMR. For example, several of the short-term outcomes related to improvements in state,
regional and district, and school capacities as measured by the State, Regional, and District Capacity

P a g e 5 2
Assessments developed by NIRN and SISEP are used to measure changes in capacity at each of the levels.
Classroom Learning Walks are used to assess improvements in the implementation of Evidence-Based Practices
and School Climate Ratings are used to measure improvements in school climate including attendance,
engagement, and behavior. Both of these mid-term outcomes contribute to Georgia’s SIMR of improving
graduation rates for students with disabilities, which is measured by the annual graduation rate calculation.
Please refer to the Student Success Evaluation Plan included in Appendix A to review outcome measures,
methods, and timelines.
Data are reviewed on a monthly bases by the State Leadership Team and adjustments are made as needed based
on the data analysis and review.
Selection of Target Students for Evaluation:
For Coherent Improvement Strategy Two, the GaDOE has targeted fifty districts to receive intensive support
from the GaDOE and its regional technical assistance providers. The initial focus of implementation will be on
improving infrastructure and capacity at the district level. Subsequently, each of these districts will be required
to select a target school to initially implement the Student Success Process. Within each of these schools,
approximately 50 students who are at risk of academic failure and not graduating from high will be identified
based on data. The school will then implement an evidence-based practice with these students, and the school
will collect and report data to the district and state on their progress. It is expected that each of the districts
receiving intensive technical assistance will have targeted a high school by the end of the 2015-2016 school
year. In future years, the district will scale-up the Student Success including implementation of Evidence-
Based Practices to other schools and students.
Use of Evaluation Data
Data Review and Adjustments in Implementation:
The State Leadership and Implementation Teams review process and outcome data on a regular basis, at least
once monthly. Data are collected as outlined in the Student Success Evaluation Plan included in Appendix A.
Data are still being collected for some of the performance indicators, and these data will be reviewed as soon as
they are available.
In addition to the performance indicator data outlined in the evaluation, pulse checks are conducted via an on-
line survey application to gather implementation information on an as needed basis. Since September 2015,
pulse checks have been conducted each month to support initial implementation of Student Success. These data
are also reviewed by the State Leadership and Implementation Teams.
Performance indicator and pulse check data are used by the State Leadership and Implementation Teams to
make adjustments in implementation and in the improvement strategies. For example, initial implementation
data revealed that many districts were experiencing challenges in conducting the comprehensive data analyses
required to identify low performing schools and students and to identify Evidence-Based Practices to addresses
the areas of low performance. Very quickly, the GaDOE developed a Data Toolkit to support the districts in the
deep data analysis.
3(d) Specify how the State will use the evaluation data to examine the effectiveness of the implementation, assess
the progress toward achieving intended improvements, and make modifications to the SSIP as necessary.

P a g e 5 3
Information and data from the feedback loops are also used to inform practice at all levels of the state system.
For example, GLRS Regional Teams utilize facilitative administrative strategies to remove barriers to
implementation reported by district teams. When the barriers cannot be resolved by the regional teams or when
they represent systemic issues, they are reported to the State Implementation Team to be addressed.
Utilizing data from multiple sources (e.g. performance indicator data, pulse check data and data from the
feedback loops) allows the State Leadership and Implementation Teams to regularly examine the effectiveness
of implementation and assess the progress toward achieving intended improvements. Data will also be used to
make modifications to the SSIP as necessary.
Evaluation of the Effectiveness of Technical Assistance and Professional Development:
The delivery of high quality professional development and technical assistance is critical to achieving outcomes
included in the Student Success Logic Model. In fact, two improvement strategies address the provision of
professional development and technical assistance. They are as follows:
Provide professional learning and technical assistance to state and regional technical assistance
providers to increase their capacity to support districts in implementing Evidence-Based Practices
Improving district infrastructure and implementation of Evidence-Based Practices in districts to improve
effective instruction, engaging school climate and transition. (Key components of improving district
infrastructure inlcude professional learning and technical assistance.)
In order to assess the effectiveness of professional assistance and technical assistance, performance indicators
were developed to measure both the fidelity of delivery as well as the outcomes of professional development
and technical assistance. For example, the GaDOE uses the Observation Checklist for High Quality
Professional Development to ensure that high quality, evidence-based professional development is delivered to
technical assistance providers and practitioners. Coaching Observation Checklists are completed for each State
Success Coach to ensure that effective coaching strategies and used. Professional Development Post-event
Evaluation Forms are used to collect data on the quality, relevance, and usefulness of professional development.
Refer to the Student Success Evaluation Plan available in Appendix A for a listing of the performance
indicators and evaluation methods.
The State Leadership Team reviews data on the delivery and effectiveness of technical assistance and
professional development on a regular basis. When data indicate that technical assistance and professional
development are not being delivered as intended or achieving the desired outcomes, the team makes
adjustments in the delivery to ensure that the desired outcomes are achieved.
Modifications to the SSIP:
The Student Success Leadership and Implementation Teams regularly review data from multiple sources to
determine adjustments in implementation and to make modifications to the SSIP as needed. The complexity of
the Student Success data collection system enables the teams to quickly access data and make changes as
appropriate. This form of rapid cycle problem solving allows issues to be addressed quickly, adjustments made
as needed, and information flowed “down” the system using the established feedback loop.
When significant modifications are recommended by the State Leadership and Implementation Teams,
stakeholders are informed of the changes. When time permits, stakeholders are engaged in decision making
regarding the proposed changes.

P a g e 5 4
Phase II: Technical Assistance and Support
The Georgia Department of Education (GaDOE) has encountered a number of opportunities and areas of
growth through the SSIP process. Georgia’s SSIP supports infrastructure development, selection of evidence-
based practices and implementation of those practices with fidelity. Unfortunately, Georgia does not have
allocated personnel committed to Response to Intervention and/or Multi-tiered System of Supports. While
relevant resources have been developed and shared with districts, there are limited to no opportunities to move
beyond awareness activities. The State believes this realization proves why Georgia’s SSIP process had a
staggered implementation during the initial phases. Essentially, Georgia is building capacity and infrastructure,
at the state level, to support LEA implementation of RTI-like practices at the local level. The current structure
offers limited support for this type of work to execute systematically and seamlessly across the Department.
The State Leadership will utilize retreat opportunities to clearly delineate appropriate supports and potential
providers of these supports. In some instances, the Department is exploring intradepartmental and
interdepartmental options to bring these critical resources and services to Regional Implementation Teams,
District Implementation Teams, and School Implementation Teams. During Phase III, Georgia will update its
SSIP narrative to reflect specific progress for technical assistance and support.
Describe the support the State needs to develop and implement an effective SSIP. Areas to consider include:
Infrastructure development; Support for LEA implementation of EBPs; Evaluation; and Stakeholder involvement
in Phase I.

Page 55
Appendix A
Georgia SSIP Implementation and Evaluation Plan
April 1, 2016

Page 56
The implementation and evaluation plans that are included in this document are based on the Student Success Logic Model included on page four.
Implementation of the two identified coherent improvement strategies and associated activities are addressed in Section C. Evaluation measures for
the strategies and activities (process) as well as outcomes are addressed in Section D.
A. Coherent Improvement Strategies:
1. Improve state and regional infrastructure to better support districts to implement and scale up EBPs that will improve graduation rates for all
students-including SWD.
a. Align and integrate initiatives and plans at the state, regional, and district, and school levels to reduce duplication and leverage resources
b. Establish, maintain, evaluate, and update cascading team management and implementation structures and communication
protocols/feedback loops at state, regional, district and school levels
c. Provide professional learning and technical assistance to state and regional technical assistance providers to increase their capacity to
support districts and schools in implementing evidence-based practices
2. Improve district infrastructure and implementation of EBPs in targeted districts to improve effective instruction, engaging school climate, and
transition
B. Outcomes
The GaDOE, with input from internal and external stakeholders has identified short, mid, and long-term outcomes. They are as follows:
Short-term Outcomes:
Improve state and regional capacity to support districts in implementing evidence-based practices
Improve district capacity to support schools in implementing evidence-based practices to support teaching and learning
Improve school capacity to support staff in implementing evidence-based practices to support teaching and learning
Increase engagement of stakeholders in planning, implementing, and monitoring improvement initiatives at state, regional, district and
school levels
Mid-term Outcomes
Improve implementation of evidence-based practices to support teaching and learning for all students
Improve school climate including student attendance, engagement, and behavior
Improve student achievement
Improve transition practices and outcomes
Long-term Outcome
Increase percentage of students with disabilities exiting high-school with a general education diploma

Page 57

Page 58
C. Improvement Plan I=Initiated, C+ Continuing, E= Ended
Strategy One: Improve state and regional infrastructure to better support districts to implement and scale up evidence-based practices that will improve graduation
rates for all students including students with disabilities.
Activities to Meet Outcomes
(Strategy 1)
Level
Steps to Implement
Activities
Responsible
Individuals or
Groups
Timeline
Resources Needed
Sta
te
Reg
ion
al
Lo
cal
FF
Y 2
01
4
(201
4-2
015
)
FF
Y 2
01
5
(201
5-2
016
)
FF
Y 2
01
6
(201
6-2
017
)
FF
Y 2
01
7
(201
7-2
018
)
FF
Y 2
01
8
(201
8-2
019
)
1.a.
Align and integrate initiatives and
plans at the state, regional, district,
and school levels to reduce
duplication and leverage resources
X
Integrate Student Success
plans with state
improvement plans
State Leadership
and
Implementation
Teams
I C C C
Staff Time, Data Support
Develop common self-
assessment for use across
all federal programs
State Leadership
and
Implementation
Teams
I C E
Staff Time, Data Support
Align and integrate
special education
monitoring procedures
and processes
State Leadership
and
Implementation
Teams I C E
Staff Time, Data Support
Align and integrate plans
for significant
disproportionality and
Coordinated Early
Intervening Services with
the Student Success
Process
State Leadership
and
Implementation
Teams I E
Staff Time, Data Support
Align all projects funded
with IDEA Discretionary
dollars with the Student
Success Process
State Leadership
and
Implementation
Teams I C E
Staff Time, Data
Support, Fiscal Support

Page 59
Activities to Meet Outcomes
(Strategy 1)
Level
Steps to Implement
Activities
Responsible
Individuals or
Groups
Timeline
Resources Needed
Sta
te
Reg
ion
al
Lo
ca
l
FF
Y 2
014
(2014-2
015)
FF
Y 2
015
(2015-2
016)
FF
Y 2
016
(2016-2
017)
FF
Y 2
017
(2017-2
018)
FF
Y 2
018
(2018-2
019)
1.a. (Continued)
Align and integrate initiatives and
plans at the state, regional, district,
and school levels to reduce
duplication and leverage resources
X
Coordinate statewide
meetings to provide
information on
implementation of the
Student Success Process
State Leadership
and
Implementation
Teams
I C C C
Staff Time, Funding for
Facilities and Travel
Develop and disseminate
District Expectations
Document
State Leadership
and
Implementation
Teams
I C C C C
Staff Time, Data Support
Develop and disseminate
Student Success Process
Planning Guide,
Template, and Rubric
State Leadership
and
Implementation
Teams
I C C C C
Staff Time, Data Support
Develop and disseminate
Data Toolkit and related
data analysis resources
State Leadership
and
Implementation
Teams
I C C C C
Staff Time, Data Support
X
X X
Review and provide
feedback on District
Student Success Plans
State Leadership
and
Implementation
Teams, GLRS
I C C C
Staff Time, Data Support
Recruit and hire State
Success Coaches
State Leadership
and
Implementation
Teams, GLRS
I C C C C
Staff Time, Funding for
Facilities and Travel
Align regional technical
assistance plans
State Leadership
and
Implementation
Teams, School
and District
Effectiveness,
RESA, GLRS
I C C
Staff Time, Data Support

Page 60
Activities to Meet Outcomes
(Strategy 1)
Level
Steps to Implement
Activities
Responsible
Individuals or
Groups
Timeline
Resources Needed
Sta
te
Reg
ion
al
Lo
cal
FF
Y 2
01
4
(201
4-2
015
)
FF
Y 2
01
5
(201
5-2
016
)
FF
Y 2
01
6
(201
6-2
017
)
FF
Y 2
01
7
(201
7-2
018
)
FF
Y 2
01
8
(201
8-2
019
)
1.a. (Continued)
Align and integrate initiatives and
plans at the state, regional, district,
and school levels to reduce
duplication and leverage resources
X X X
Support districts in the
development of district
teams to guide the
Student Success Process
State Leadership
and
Implementation
Teams, School
and District
Effectiveness,
RESA, GLRS
I C C C
Staff Time, Data Support
X X X
Support districts in the
development of school
teams to guide the
Student Success Process
State Leadership
and
Implementation
Teams, School
and District
Effectiveness,
RESA, GLRS
I C C
Staff Time, Data Support

Page 61
Activities to Meet Outcomes
(Strategy 1)
Level
Steps to Implement
Activities
Responsible
Individuals or
Groups
Timeline
Resources Needed
Sta
te
Reg
ion
al
Lo
cal
FF
Y 2
01
4
(201
4-2
015
)
FF
Y 2
01
5
(201
5-2
016
)
FF
Y 2
01
6
(201
6-2
017
)
FF
Y 2
01
7
(201
7-2
018
)
FF
Y 2
01
8
(201
8-2
019
)
1.b.
Establish, maintain, evaluate, and
update cascading team
management and implementation
structures and communication
protocols at state, regional, and
district levels
X
Establish Leadership and
Implementation Teams at
GaDOE
DOE Leadership I,E
Staff Time, Data
Support, Commitment
from Executive Cabinet
X X
Coordinate monthly,
regional Collaborative
Community Meetings in
each GLRS Region to
assist districts in
addressing
implementation barriers
and celebrating
implementation
successes
State Leadership
and
Implementation
Teams, GLRS
I C C C C
Staff Time, Data
Support, Commitment of
District Personnel
X X
Collaborate with GLRS
and RESA to establish
and maintain GLRS
Regional Teams to
support districts
State Leadership
and
Implementation
Teams, School
and District
Effectiveness,
RESA, GLRS
I C C C
Staff Time, Funding for
Facilities and Travel
X X X
Establish communication
protocols and defined
feedback loops among
all levels of the state
system (state, regional,
district, school)
State Leadership
and
Implementation
Teams
I C C C
Staff Time, Data
Support,
X
Develop online surveys
and other reporting
structures for sharing
information via the
feedback loops
State Leadership
and
Implementation
Teams
I C C C
Staff Time, Data
Support,
X X X
Collect, analyze, and use
information from
feedback loops to adjust
team structures as
needed to support
effective implementation
State Leadership
and
Implementation
Teams
I C C C
Staff Time, Data
Support,

Page 62
Activities to Meet Outcomes
(Strategy 1)
Level
Steps to Implement
Activities
Responsible
Individuals or
Groups
Timeline
Resources Needed
Sta
te
Reg
ion
al
Lo
cal
FF
Y 2
01
4
(20
14
-
20
15)
FF
Y 2
01
5
(20
15
-
20
16)
FF
Y 2
01
6
(20
16
-
20
17)
FF
Y 2
01
7
(20
17
-
20
18)
FF
Y 2
01
8
(20
18
-
20
19)
1.c.
Provide professional learning and
coaching to state and regional
technical assistance providers to
increase their capacity to support
districts in implementing evidence-
based practices
X X
Conduct on-going
professional learning for
State Student Success
coaches, GaDOE District
Liaisons and GLRS
Directors on the Student
Success Process
State
Implementation
Team
I C C C C
Staff Time, Funding for
Facilities and Travel
Provide on-going
professional learning and
follow-up coaching to
State Student Success
Coaches in systems
coaching
State
Implementation
Team I C C C
Staff Time, Funding for
Facilities and Travel
Provide professional
learning and coaching on
implementation science
principles and
application
State
Implementation
Team I C C C C
Staff Time, Funding for
Facilities and Travel
Provide professional
learning and follow-up
coaching to State
Success Coaches,
GaDOE District Liaisons
and GLRS Directors in
the selection and use of
evidence-based practices
designed to improve
graduation rates
State
Implementation
Team
I C C C
Staff Time, Funding for
Facilities and Travel
Collect and analyze data
on professional learning
and coaching
State
Implementation
Team
I C C C C Staff Time and Data
Support
Use data to make
adjustments in
professional learning and
coaching
State
Implementation
Team I C C C C
Staff Time and Data
Support

Page 63
Coherent Improvement Strategy Two: Improve district infrastructure and implementation of evidence-based practices in fifty districts identified to receive
intensive technical assistance to improve effective instruction, engaging school climate, and transition. I=Initiated, C+ Continuing, E= Ended
Activities to Meet Outcomes
(Strategy 2)
Level
Steps to Implement
Activities
Responsible
Individuals or
Groups
Timeline
Resources Needed
Sta
te
Reg
ion
al
Lo
cal
FF
Y 2
01
4
(201
4-2
015
)
FF
Y 2
01
5
(201
5-2
016
)
FF
Y 2
01
6
(201
6-2
017
)
FF
Y 2
01
7
(201
7-2
018
)
FF
Y 2
01
8
(201
8-2
019
)
Provide professional learning and
follow-up coaching to district and
school personnel to support
implementation of the Student
Success Process (including
implementation of evidence-based
practices)
X X X
Identify districts based
on state data and notify
of selection
State Leadership
Team and
Stakeholders
I C,E Staff Time and Data
Support
Conduct webinars
(Leadership Launches)
for intensive district
teams to provide
information on of the
Student Success Process
Student Success
State
Coordinator and
Implementation
Team
I C C C
Staff Time and Data
Support
Funding for webinar
technology
Conduct statewide
meetings for district
teams to address issues
in implementing the
Student Success Process
Student Success
State
Coordinator and
Implementation
Team
I C C C
Staff Time and Funding
for Facilities and travel
Provide technical
assistance including
coaching to district
personnel in completing
and updating the Student
Success Process Plan
using provided resources
GLRS Regional
Team (GaDOE
District Liaisons,
State Success
Coach, and
GLRS)
I C C C
Staff Time, Funding for
Travel and Coaches’
Salaries
Provide technical
assistance including
coaching to support
infrastructure changes
needed to support
infrastructure changes
needed to support
implementation
GLRS Regional
Team (GaDOE
District Liaisons,
State Success
Coach, and
GLRS)
I C C C
Staff Time, Funding for
Travel and Coaches’
Salaries
Assist in selection of
district coach
GLRS Regional
Team (GaDOE
District Liaisons,
State Success
Coach, and
GLRS)
I C C C
Staff Time, Funding for
Travel and Coaches’
Salaries

Page 64
Activities to Meet Outcomes
(Strategy 1)
Level
Steps to Implement
Activities
Responsible
Individuals or
Groups
Timeline
Resources Needed
Sta
te
Reg
ion
al
Lo
cal
FF
Y 2
01
4
(20
14
-
20
15)
FF
Y 2
01
5
(20
15
-
20
16)
FF
Y 2
01
6
(20
16
-
20
17)
FF
Y 2
01
7
(20
17
-
20
18)
FF
Y 2
01
8
(20
18
-
20
19)
Provide professional learning and
follow-up coaching to district and
school personnel to support
implementation of the Student
Success Process (including
implementation of evidence-based
practices)
X X X
Assist in selection of
target school(s)
GLRS Regional
Team (GaDOE
District Liaisons,
State Success
Coach, and
GLRS)
I C C C
Staff Time, Funding for
Travel and Coaches’
Salaries
Provide professional
learning and coaching to
district teams to support
selection,
implementation, and
evaluation of evidence-
based practices
State
Implementation
Team
I C C
Staff Time, Funding for
Travel and Coaches’
Salaries
Collection of data to
monitor progress and
outcomes
State
Implementation
Team, GLRS
Regional Team,
District Team,
and External
Evaluator
I C C C
Staff Time and Data
Support
Partner with district
personnel to complete
learning walks
GLRS Regional
Team and
District Team
I C C C
Staff Time, Funding for
Travel and Coaches’
Salaries
Support districts in
scaling up Student
Success to other schools
based on data
GLRS Regional
Team (GaDOE
District Liaisons,
State Success
Coach, and
GLRS)
I C
Staff Time, Funding for
Travel and Coaches’
Salaries
Collect and analyze data State
Implementation
Team, GLRS
Regional Team,
District Team,
and External
Evaluator
I C C C
Staff Time and Data
Support

Page 65
D. Evaluation
Improvement Strategy Implementation
Strategy One- Improve State and Regional Infrastructures to better support districts to implement and scale up EBPs that will improve graduation rates
for all students-including SWD.
Activity 1.a.: Align and integrate initiatives and plans at the state, regional, district and school levels to reduce duplication and leverage resources
Evaluation Questions
Performance Indicators Data Collection
Methods
Responsible
Individuals or
Groups Timeline
Timelines/Targets
FF
Y 2
014
(2014
-2015)
FF
Y 2
015
(2015
-2016)
FF
Y 2
016
(2016
-2017)
FF
Y 2
017
(2017
-2018)
FF
Y 2
018
(2018
-2019)
Are the State Systemic Improvement
Plan (Student Success) and identified
strategies and activities aligned with
other graduation improvement activities
and plans from other GaDOE offices and
divisions to reduce duplication and
leverage resources to improve graduation
rates?
Percentage of Student Success
strategies and activities aligned with
graduation improvement activities and
plans from other GaDOE offices and
divisions to reduce duplication and
leverage resources to improve
graduation rates
GaDOE Key
Initiative and Plan
Inventory
Student Success
Leadership Team
and External
Evaluator I
75% I
80%
C
85%
C
85%
C
90%
Does the state have a common self-
assessment that is used across all federal
programs?
Percentage of all offices and divisions
and offices in federally-funded
programs using a common self-
assessment
Common Federal
Self-Assessment
Cross Division
Workgroup
I
80%
C
85%
C
85%
C
90%
Are special education results-focused
monitoring procedures and processes
aligned with the Student Success
Process, when appropriate?
Percentage of special education results-
focused monitoring procedures and
processes aligned with the Student
Success Process
GaDOE Key
Initiative and Plan
Inventory
Student Success
Implementation
Team, Program
Manager for
Monitoring
I
80%
C
85%
C
90%
Are CEIS plans integrated in the
district’s Student Success Plans?
Percentage of districts submitting CEIS
plans with CEIS plans integrated in
Student Success Plans
Student Success
Plan database
Student Success
Implementation
Team, Program
Manager for
Monitoring
I
80%
C
85%
C
90%
C
95%
Are IDEA discretionary funded projects
supporting implementation of Student
Success?
Percentage of IDEA discretionary
funded projects supporting
implementation of Student Success
GaDOE Key
Initiative and Plan
Inventory
Student Success
Leadership Team
and External
Evaluator
I C C C
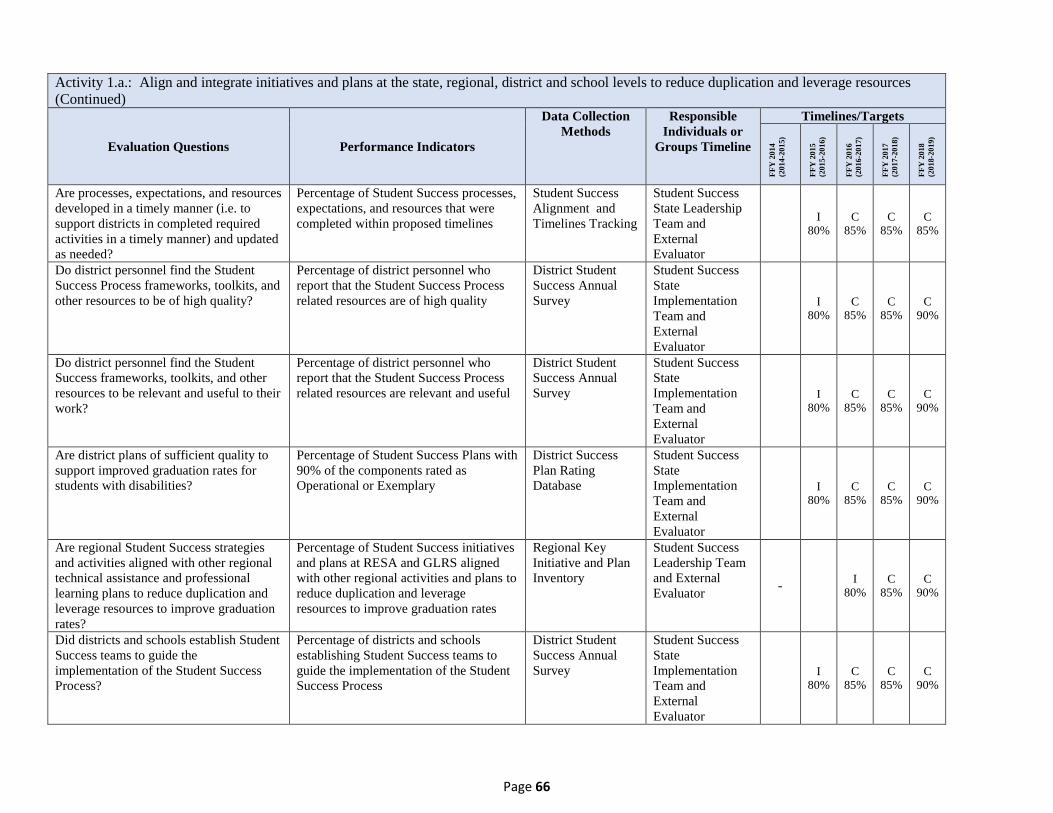
Page 66
Activity 1.a.: Align and integrate initiatives and plans at the state, regional, district and school levels to reduce duplication and leverage resources
(Continued)
Evaluation Questions Performance Indicators
Data Collection
Methods
Responsible
Individuals or
Groups Timeline
Timelines/Targets
FF
Y 2
014
(2014
-2015)
FF
Y 2
015
(2015
-2016)
FF
Y 2
016
(2016
-2017)
FF
Y 2
017
(2017
-2018)
FF
Y 2
018
(2018
-2019)
Are processes, expectations, and resources
developed in a timely manner (i.e. to
support districts in completed required
activities in a timely manner) and updated
as needed?
Percentage of Student Success processes,
expectations, and resources that were
completed within proposed timelines
Student Success
Alignment and
Timelines Tracking
Student Success
State Leadership
Team and
External
Evaluator
I
80%
C
85%
C
85%
C
85%
Do district personnel find the Student
Success Process frameworks, toolkits, and
other resources to be of high quality?
Percentage of district personnel who
report that the Student Success Process
related resources are of high quality
District Student
Success Annual
Survey
Student Success
State
Implementation
Team and
External
Evaluator
I
80%
C
85%
C
85%
C
90%
Do district personnel find the Student
Success frameworks, toolkits, and other
resources to be relevant and useful to their
work?
Percentage of district personnel who
report that the Student Success Process
related resources are relevant and useful
District Student
Success Annual
Survey
Student Success
State
Implementation
Team and
External
Evaluator
I
80%
C
85%
C
85%
C
90%
Are district plans of sufficient quality to
support improved graduation rates for
students with disabilities?
Percentage of Student Success Plans with
90% of the components rated as
Operational or Exemplary
District Success
Plan Rating
Database
Student Success
State
Implementation
Team and
External
Evaluator
I
80%
C
85%
C
85%
C
90%
Are regional Student Success strategies
and activities aligned with other regional
technical assistance and professional
learning plans to reduce duplication and
leverage resources to improve graduation
rates?
Percentage of Student Success initiatives
and plans at RESA and GLRS aligned
with other regional activities and plans to
reduce duplication and leverage
resources to improve graduation rates
Regional Key
Initiative and Plan
Inventory
Student Success
Leadership Team
and External
Evaluator -
I
80%
C
85%
C
90%
Did districts and schools establish Student
Success teams to guide the
implementation of the Student Success
Process?
Percentage of districts and schools
establishing Student Success teams to
guide the implementation of the Student
Success Process
District Student
Success Annual
Survey
Student Success
State
Implementation
Team and
External
Evaluator
I
80%
C
85%
C
85%
C
90%
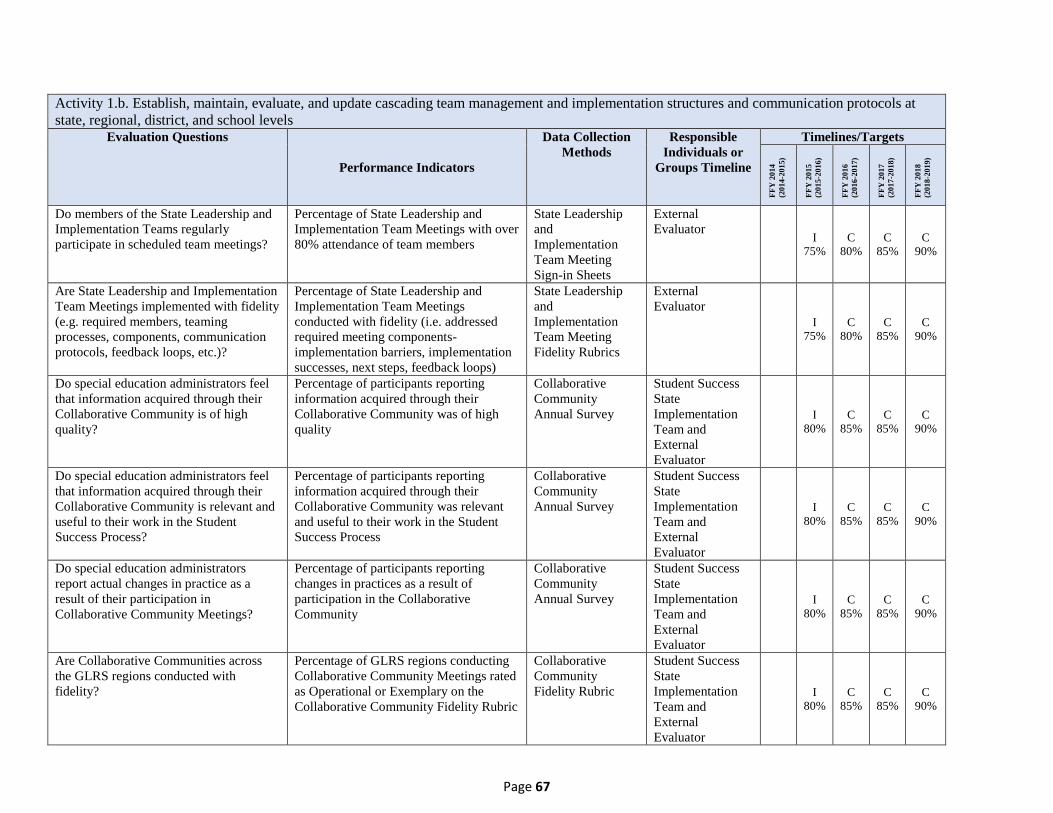
Page 67
Activity 1.b. Establish, maintain, evaluate, and update cascading team management and implementation structures and communication protocols at
state, regional, district, and school levels Evaluation Questions
Performance Indicators
Data Collection
Methods
Responsible
Individuals or
Groups Timeline
Timelines/Targets
FF
Y 2
014
(2014
-2015)
FF
Y 2
015
(2015
-2016)
FF
Y 2
016
(2016
-2017)
FF
Y 2
017
(2017
-2018)
FF
Y 2
018
(2018
-2019)
Do members of the State Leadership and
Implementation Teams regularly
participate in scheduled team meetings?
Percentage of State Leadership and
Implementation Team Meetings with over
80% attendance of team members
State Leadership
and
Implementation
Team Meeting
Sign-in Sheets
External
Evaluator
I
75%
C
80%
C
85%
C
90%
Are State Leadership and Implementation
Team Meetings implemented with fidelity
(e.g. required members, teaming
processes, components, communication
protocols, feedback loops, etc.)?
Percentage of State Leadership and
Implementation Team Meetings
conducted with fidelity (i.e. addressed
required meeting components-
implementation barriers, implementation
successes, next steps, feedback loops)
State Leadership
and
Implementation
Team Meeting
Fidelity Rubrics
External
Evaluator
I
75%
C
80%
C
85%
C
90%
Do special education administrators feel
that information acquired through their
Collaborative Community is of high
quality?
Percentage of participants reporting
information acquired through their
Collaborative Community was of high
quality
Collaborative
Community
Annual Survey
Student Success
State
Implementation
Team and
External
Evaluator
I
80%
C
85%
C
85%
C
90%
Do special education administrators feel
that information acquired through their
Collaborative Community is relevant and
useful to their work in the Student
Success Process?
Percentage of participants reporting
information acquired through their
Collaborative Community was relevant
and useful to their work in the Student
Success Process
Collaborative
Community
Annual Survey
Student Success
State
Implementation
Team and
External
Evaluator
I
80%
C
85%
C
85%
C
90%
Do special education administrators
report actual changes in practice as a
result of their participation in
Collaborative Community Meetings?
Percentage of participants reporting
changes in practices as a result of
participation in the Collaborative
Community
Collaborative
Community
Annual Survey
Student Success
State
Implementation
Team and
External
Evaluator
I
80%
C
85%
C
85%
C
90%
Are Collaborative Communities across
the GLRS regions conducted with
fidelity?
Percentage of GLRS regions conducting
Collaborative Community Meetings rated
as Operational or Exemplary on the
Collaborative Community Fidelity Rubric
Collaborative
Community
Fidelity Rubric
Student Success
State
Implementation
Team and
External
Evaluator
I
80%
C
85%
C
85%
C
90%

Page 68
Activity 1.b. Establish, maintain, evaluate, and update cascading team management and implementation structures and communication protocols at
state, regional, district, and school levels (Continued) Evaluation Questions
Performance Indicators
Data Collection
Methods
Responsible
Individuals or
Groups Timeline
Timelines/Targets
FF
Y 2
014
(2014
-2015)
FF
Y 2
015
(2015
-2016)
FF
Y 2
016
(2016
-2017)
FF
Y 2
017
(2017
-2018)
FF
Y 2
018
(2018
-2019)
Do core team members (e.g. GLRS, State
Success Coach, and School Improvement
Specialists) regularly attend scheduled
GLRS Regional Team Meetings?
Percentage of GLRS Regional Team
Meetings with core team members in
attendance
GLRS Regional
Team Meeting
Sign-in Sheets
State
Implementation
Team and
External
Evaluator
I
75%
C
80%
C
85%
C
90%
Are GLRS Regional Teams implemented
with fidelity (e.g. required members,
teaming processes, components, feedback
loops, etc.)?
Percentage of GLRS Regional Teams
with an average rating of Operational or
Exemplary on the GLRS Regional Team
Meeting Fidelity Rubric
GLRS Regional
Team Meeting
Fidelity Rubric
State
Implementation
Team and
External
Evaluator
I
75%
C
80%
C
85%
C
90%
Are District Teams implemented with
fidelity (e.g. required members, teaming
processes, components, feedback loops,
etc.)?
Percentage of District Teams with an
average rating of Operational or
Exemplary on the District Team Meeting
Fidelity Rubric
District Team
Meeting Fidelity
Rubric
State
Implementation
Team and
External
Evaluator
I
75%
C
80%
C
85%
C
90%
Are School Teams implemented with
fidelity (e.g. required members, teaming
processes, components, feedback loops,
etc.)?
Percentage of School Teams with an
average rating of Operational or
Exemplary on the School Team Meeting
Fidelity Rubric
School Team
Meeting Fidelity
Rubric
State
Implementation
Team and
External
Evaluator
I
75%
C
80%
C
85%

Page 69
Activity 1.c. Provide professional learning and technical assistance to state and regional technical assistance providers to increase their capacity to
support districts and schools in implementing evidence-based practices Evaluation Questions
Performance Indicators
Data Collection
Methods
Responsible
Individuals or
Groups Timeline
Timelines/Targets
FF
Y 2
014
(2014
-2015)
FF
Y 2
015
(2015
-2016)
FF
Y 2
016
(2016
-2017)
FF
Y 2
017
(2017
-2018)
FF
Y 2
018
(2018
-2019)
Do professional development activities
provided to regional technical assistance
providers include essential elements of
high quality professional development?
Percentage of the essential elements of
Observation Checklist for High Quality
Professional Development were included
in the delivery of professional
development activities provided to
regional technical assistance providers
Observation
Checklist for High
Quality
Professional
Development
State
Implementation
Team and
External
Evaluator
I
75%
C
80%
C
85%
C
90%
Do the regional technical assistance
providers find the professional learning
and technical assistance to be of high
quality?
Percentage of regional technical
assistance providers reporting
professional learning and technical
assistance to be of high quality
Student Success
Post Event Survey
State
Implementation
Team and
External
Evaluator
I
80%
C
85%
C
85%
C
90%
Do the regional technical assistance
providers find the professional learning
and technical assistance to be relevant to
their work?
Percentage of regional technical
assistance providers reporting
professional learning and technical
assistance is relevant to their work
Student Success
Post Event Survey
State
Implementation
Team and
External
Evaluator
I
80%
C
85%
C
85%
C
90%
Do the regional technical assistance
providers find the professional learning
and technical assistance to be useful in
their work?
Percentage of regional technical
assistance providers reporting
professional learning and technical
assistance is useful in their work
Student Success
Post Event Survey
State
Implementation
Team and
External
Evaluator
I
80%
C
85%
C
85%
C
90%
Do regional technical assistance providers
report that they actually used information
gained through professional learning and
technical assistance in working with
district and school teams?
Percentage of regional technical
assistance providers reporting that they
have used information acquired in
professional learning and in working with
district and school teams
Student Success
Three Month
Follow-up Survey
State
Implementation
Team and
External
Evaluator
I
80%
C
85%
C
85%
C
90%

Page 70
Strategy Two- Improve district infrastructure and implementation of evidence-based practices in fifty districts identified to receive intensive technical
assistance to improve effective instruction, engaging school climate, and transition - Applies to 50 districts receiving intensive technical assistance
Evaluation Questions
Performance Indicators
Data Collection
Methods
Responsible
Individuals or
Groups Timeline
Timelines/Targets
FF
Y 2
014
(2014
-2015)
FF
Y 2
015
(2015
-2016)
FF
Y 2
016
(2016
-2017)
FF
Y 2
017
(2017
-2018)
FF
Y 2
018
(2018
-2019)
Do personnel participate in statewide
meetings (webinars and face-to-face) to
support implementation of Student
Success?
Percentage of personnel participating in
statewide meetings (webinars and face-to-
face) to support implementation of
Student Success
Statewide Meetings
Sign-in Sheets and
Database
Student Success
Implementation
Team and
External
Evaluator
I C C C C
Do personnel find the meeting content
and delivery to be of high quality?
Percentage of personnel reporting the
meeting content and delivery to be of
high quality
Student Success
Post Event Survey
State
Implementation
Team and
External
Evaluator
I
80%
C
85%
C
85%
C
90%
Do personnel find the meeting content
and delivery to be relevant to their work?
Percentage of personnel reporting the
meeting content and delivery to be
relevant to their work
Student Success
Post Event Survey
State
Implementation
Team and
External
Evaluator
I 80%
C 85%
C 85%
C
90%
Do personnel find the meeting content
and delivery to be useful in their work?
Percentage of personnel reporting the
meeting content and delivery to be useful
in their work
Student Success
Post Event Survey
State
Implementation
Team and
External
Evaluator
I
80%
C
85%
C
85%
C
90%
Do personnel report that they actually
used information gained from statewide
meetings in implementing the Student
Success Process?
Percentage of personnel reporting that
they actually used information gained
from statewide meetings in implementing
the Student Success Process
Student Success
Three Month
Follow-up Survey
State
Implementation
Team and
External
Evaluator
I 80%
C 85%
C 85%
C
90%
Do personnel report that technical
assistance including coaching was
effective in supporting implementation of
the Student Success Process?
Percentage of personnel reporting
technical assistance including coaching
was effective in supporting
implementation of the Student Success
Process
Student Success
Coaching
Effectiveness
Survey
State
Implementation
Team and
External
Evaluator
I
80%
C
85%
C
90%

Page 71
Strategy Two- Improve district infrastructure and implementation of evidence-based practices in fifty districts identified to receive intensive technical
assistance to improve effective instruction, engaging school climate, and transition (Continued) -Applies to 50 districts receiving intensive technical assistance
Evaluation Questions
Performance Indicators
Data Collection
Methods
Responsible
Individuals or
Groups Timeline
Timelines/Targets
FF
Y 2
014
(2014
-2015)
FF
Y 2
015
(2015
-2016)
FF
Y 2
016
(2016
-2017)
FF
Y 2
017
(2017
-2018)
FF
Y 2
018
(2018
-2019)
Are district Student Success improvement
strategies and activities integrated in
district improvement plans to reduce
duplication and leverage resources to
improve graduation rates?
90% of districts with Student Success
improvement strategies and activities
integrated in district improvement plans
to reduce duplication and leverage
resources to improve graduation rate
District
Improvement Plan
Analysis for
Intensive Districts
Student Success
Implementation
Team and
External
Evaluator
I
80% C
85% C
85% I
90%
Are school Student Success improvement
strategies and activities integrated in
school improvement plans to reduce
duplication and leverage resources to
improve graduation rates?
90% of school s with Student Success
improvement strategies and activities
integrated in school improvement plans to
reduce duplication and leverage resources
to improve graduation rate
School
Improvement Plan
for Intensive
Districts
Student Success
Implementation
Team and
External
Evaluator
I
80%
C
85%
C
90%

Page 72
Evaluation of Improvement Strategy Outcomes
Short-term
Outcomes Evaluation Questions Performance Indicators
Data Collection
Methods
Responsible
Individuals or
Groups Timeline
Timelines
(Projected
Initiation and
Completion
Dates) and
Targets
Improve state and
regional capacity
(e.g.
knowledge/skills,
organizational
structures, and
resources) to
support districts in
implementing
evidence-based
practices
Has collaboration among
GaDOE staff increased as a
result of Student Success
Implementation?
Percentage of GaDOE staff from key
GaDOE divisions and offices
reporting high levels of collaboration
with staff from other offices and
divisions in implementing activities
designed to improve graduation rates
Student Success
Collaboration Survey
Student Success
Leadership Team
and External
Evaluator
Annually, Spring
Beginning Spring
2016
Targets:
FFY 16: 86%
FFY 17: 88%
FFY 18: 90%
Has collaboration among RESA
and GLRS staff increased as a
result of Student Success
Implementation?
Percentage of RESA and GLRS staff
reporting high levels of collaboration
in implementing activities designed
to improve graduation rates
Student Success
Collaboration Survey
Student Success
Leadership Team
and External
Evaluator
Annually, Spring
Beginning Spring
2016
Targets:
FFY 16: 86%
FFY 17: 88%
FFY 18: 90%
Has the GaDOE demonstrated
improvements in its capacity to
support districts in the
implementation of evidence-
based practices?
Total percentage score of items on
Assessment of State Capacity for
Scaling-up Evidence-based Practices
Assessment of State
Capacity for Scaling-
up Evidence-based
Practices (NIRN)
Student Success
Leadership Team
and External
Evaluator
Annually, Fall and
Spring
Baseline Spring
2016: 48%
Targets:
FFY 16: 55%
FFY 17: 65%
FFY 18: 75%
Have RESA and GLRS
demonstrated improvements in
their capacity to support districts
in the implementation of
evidence-based practices?
Total percentage score of items on
Regional Capacity Assessment
Regional Capacity
Assessment (NIRN)
Student Success
Leadership Team
and External
Evaluator
Annually, Fall and
Spring
Beginning Fall
2016
Targets
FFY 16: 70%
FFY 17: 80%
FFY 18: 90%

Page 73
Short-term
Outcomes Evaluation Questions Performance Indicators
Data Collection
Methods
Responsible
Individuals or
Groups Timeline
Timelines
(Projected
Initiation and
Completion
Dates) and
Targets
Improve
practitioner
(district and
school)
knowledge of
data-based
decision making
and selection and
use of evidence-
based practices.
Applies to 50
districts
receiving
intensive
technical
assistance
Does professional development
result in increased knowledge of
data-based decision making and
selection and use of evidence-
based practices?
Percentage of the participants
demonstrating an increase in
knowledge from to pre- to post-tests
Pre- and Post-
Professional
Development
Measures
State
Implementation
Team and External
Evaluator
End of each
professional
development
opportunity
Targets
FFY 15: 75%
FFY 16: 80%
FFY 17: 85%
FFY 18: 90%
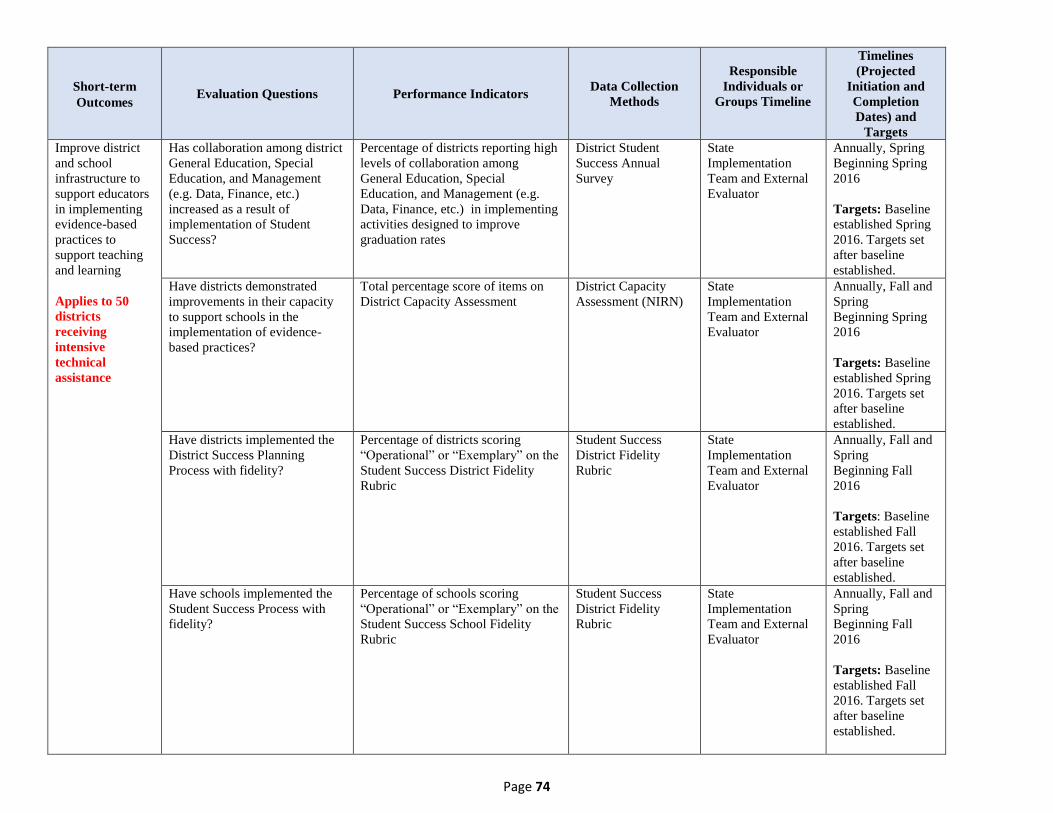
Page 74
Short-term
Outcomes Evaluation Questions Performance Indicators
Data Collection
Methods
Responsible
Individuals or
Groups Timeline
Timelines
(Projected
Initiation and
Completion
Dates) and
Targets
Improve district
and school
infrastructure to
support educators
in implementing
evidence-based
practices to
support teaching
and learning
Applies to 50
districts
receiving
intensive
technical
assistance
Has collaboration among district
General Education, Special
Education, and Management
(e.g. Data, Finance, etc.)
increased as a result of
implementation of Student
Success?
Percentage of districts reporting high
levels of collaboration among
General Education, Special
Education, and Management (e.g.
Data, Finance, etc.) in implementing
activities designed to improve
graduation rates
District Student
Success Annual
Survey
State
Implementation
Team and External
Evaluator
Annually, Spring
Beginning Spring
2016
Targets: Baseline
established Spring
2016. Targets set
after baseline
established.
Have districts demonstrated
improvements in their capacity
to support schools in the
implementation of evidence-
based practices?
Total percentage score of items on
District Capacity Assessment
District Capacity
Assessment (NIRN)
State
Implementation
Team and External
Evaluator
Annually, Fall and
Spring
Beginning Spring
2016
Targets: Baseline
established Spring
2016. Targets set
after baseline
established.
Have districts implemented the
District Success Planning
Process with fidelity?
Percentage of districts scoring
“Operational” or “Exemplary” on the
Student Success District Fidelity
Rubric
Student Success
District Fidelity
Rubric
State
Implementation
Team and External
Evaluator
Annually, Fall and
Spring
Beginning Fall
2016
Targets: Baseline
established Fall
2016. Targets set
after baseline
established.
Have schools implemented the
Student Success Process with
fidelity?
Percentage of schools scoring
“Operational” or “Exemplary” on the
Student Success School Fidelity
Rubric
Student Success
District Fidelity
Rubric
State
Implementation
Team and External
Evaluator
Annually, Fall and
Spring
Beginning Fall
2016
Targets: Baseline
established Fall
2016. Targets set
after baseline
established.

Page 75
Short-term
Outcomes Evaluation Questions Performance Indicators
Data Collection
Methods
Responsible
Individuals or
Groups Timeline
Timelines
(Projected
Initiation and
Completion
Dates) and
Targets
Increase
engagement of
stakeholders in
planning,
implementing,
and monitoring
improvement
initiatives
Applies to 50
districts
receiving
intensive
technical
assistance
Have the districts increased
stakeholder engagement in
planning, implementing, and
monitoring improvement
initiatives?
Percentage of districts with
stakeholders reporting engagement at
collaborative or transforming levels
in planning, implementing, and
monitoring improvement initiatives
Leading by
Convening
Engagement Rubrics
State
Implementation
Team and External
Evaluator
Annually
Beginning Fall
2016
Target: Baseline
established Fall
2016. Targets set
after baseline
established.

Page 76
Mid-term
Outcomes Evaluation Questions Performance Indicators
Data Collection
Methods
Responsible
Individuals or
Groups Timeline
Timelines
(Projected
Initiation and
Completion
Dates) and
Targets
Improve
implementation of
evidence-based
practices to support
teaching and
learning such as
effective instruction
Applies to 50
districts receiving
intensive technical
assistance
Are teachers in targeted schools
implementing evidence-based
practices to support teaching
and learning to ensure access to
the curriculum for all students?
Percentage of teachers in targeted
scoring Level III or IV on Academic
Rigor and Differentiation
Components of TKES
Teacher Keys
Effectiveness
Evaluation System
Teacher and Leader
Effectiveness,
Implementation
Team and External
Evaluator
Annually,
Beginning Fall
2016
Targets: Baseline
established Fall
2016. Targets set
after baseline
established.
Percentage of teachers in targeted
schools implementing evidence-
based practices with fidelity
Classroom Learning
Walks
District Personnel,
State
Implementation
Team and External
Evaluator
Annually, Fall and
Spring Beginning
Fall 2016
Targets: Baseline
established Fall
2016. Targets set
after baseline
established.
Improve school
climate including
student attendance,
engagement, and
behavior
Applies to 50
districts receiving
intensive technical
assistance
Is school climate improving in
targeted schools?
Percentage of targeted schools
scoring a 4 or 5 on the STAR
School Climate Rating
STAR School
Climate Rating
School Climate
Staff, State
Implementation
Team, and External
Evaluator
Annually
Beginning Spring
2016
Targets: Baseline
established Spring
2016. Targets set
after baseline
established.
Are targeted students in
targeted schools demonstrating
less absenteeism?
Percentage of targeted students with
less than six days absent
Targeted Student
Data Report
State
Implementation
Team, and External
Evaluator
Annually, Spring
Beginning Spring
2016
Targets: Baseline
established Spring
2016. Targets set
after baseline
established.
Do targeted students in targeted
schools have less than five days
in ISS/OSS?
Percentage of targeted students with
less than five days in ISS/OSS
Targeted Student
Data Report
State
Implementation
Team, and External
Evaluator
Annually, Spring
Beginning Spring
2016
Targets: Baseline
established Spring
2016. Targets set
after baseline
established.

Page 77
Mid-term Outcome Evaluation Questions Performance Indicators Data Collection
Methods
Responsible
Individuals or
Groups Timeline
Timelines
(Projected
Initiation and
Completion
Dates) and
Targets
Improve student
achievement
(Baseline for
participating schools
established Spring
2016. Targets will be
established based on
baseline.)
Applies to 50
districts receiving
intensive technical
assistance
Are students in targeted schools
improving academically as
measured by statewide
assessments?
Percentage of students scoring
developing or above on the Georgia
Milestones Assessment System
Georgia Milestones
Assessment System
Office of
Assessment and
Accountability
Annually, Spring
Beginning Spring
2016
Target: Baseline
for participating
districts from
Spring 2016.
Targets will be
established based
on baseline once
data becomes
available.
Are students in targeted schools
improving academically as
measured by statewide
assessments?
Percentage of students scoring
Typical to High Growth
Student Growth
Profile Calculations
Office of
Assessment and
Accountability
Annually, Spring
Beginning Spring
2016
Targets: Baseline
established Spring
2016. Targets set
after baseline
established.
Do targeted students in targeted
schools demonstrate improved
course completion?
Percentage of targeted students in
targeted schools with one or less
course failure per semester
Targeted Student
Data Report
State
Implementation
Team, and External
Evaluator
Annually, Spring
Beginning Spring
2016
Targets: Baseline
established Spring
2016. Targets set
after baseline
established.

Page 78
Mid-term Outcome Evaluation Questions Performance Indicators Data Collection
Methods
Responsible
Individuals or
Groups Timeline
Timelines
(Projected
Initiation and
Completion
Dates) and
Targets
Improve transition
practices and
outcomes
Applies to 50
districts receiving
intensive technical
assistance
Are targeted districts
implementing quality transition
practices?
Percentage of targeted districts
obtaining an overall domain score of
2.0 or higher on the Quality
Indicators of Exemplary Transition
Programs Needs Assessment (QI)
Quality Indicators of
Exemplary
Transition Programs
Needs Assessment
(QI)
Program Manager
and Specialist for
Secondary
Transition
Annually, Spring
Beginning Spring
2016
Targets: Baseline
established Spring
2016. Targets set
after baseline
established.
.
Are targeted districts
implementing compliant
transition practices?
Percentage of targeted intensive
districts with 100% compliance
Secondary Transition
Data Checklist
Program Manager
and Specialist for
Secondary
Transition
Annually, Spring
Beginning Spring
2016
Target: 100% for
each year through
FFY 2018

Page 79
Long-term
Outcome Evaluation Questions Performance Indicators
Data Collection
Methods
Responsible
Individuals or
Groups Timeline
Timelines
(Projected
Initiation and
Completion
Dates)
Increase percentage
of students with
disabilities exiting
high school with a
general education
diploma
Applies to 50
districts receiving
intensive technical
assistance
Are graduation rates improving
for students with disabilities in
targeted districts?
Percentage of students with
disabilities in intensive Student
Success districts graduating with a
general education diploma
Annual Event
Graduation Rate
Accountability and
Assessment Office
Part B Data
Manager
Annually, Spring
Summer beginning
2016
Targets:
FFY 14: 41.00%
FFY 15: 59.00%
FFY 16: 61.00%
FFY 17: 63.00%
FFY 18: 65.00%