issn: 2546-0625 sr may...vi notes farmgate price-- concluded viii refers to the price received by...
TRANSCRIPT

ISSN: 2546-0625

REPUBLIC OF THE PHILIPPINES
PRESIDENT RODRIGO ROA DUTERTE
REPUBLIC OF THE PHILIPPINES
PHILIPPINE STATISTICS AUHORITY
LISA GRACE S. BERSALES, Ph.D. Undersecretary
National Statistician and Civil Registrar General
Copyright © 2018 by Philippine Statistics Authority PSA CVEA Building, East Avenue, Diliman,
Quezon City, Philippines
ii
FOREWORD
This Chicken Situation Report presents the industry situation in terms of
inventory by type of chicken; volume of production; number of birds dressed
in poultry dressing plants; and monthly average farmgate wholesale and
retail prices which are released by the Philippine Statistics Authority (PSA).
Meanwhile, live Day Old Chick (DOC) and chicken meat imports are released
by the Bureau of Animal Industry – National Veterinary Quarantine Services
(BAI – NVQS).
The Livestock and Poultry Statistics Division (LPSD) of the PSA
disseminates the Chicken Situation Report annually, every May, covering the
previous year (January to December) as the reference period. The report is
intended to serve as a ready reference for our various clients and
stakeholders in the agriculture sector.
The PSA would appreciate comments and suggestions from our data users
and readers for further improvement of this report.
LISA GRACE S. BERSALES Ph.D. Undersecretary
National Statistician and Civil Registrar General
Quezon City, Philippines May 2018
iii
CHICKEN SITUATION REPORT

CHICKEN SITUATION REPORT
iv

TABLE OF CONTENTS
Page Foreword iii Table of Contents v Technical Notes vii Standard Symbols, Unit of Measure and Acronyms ix Highlights 1 Inventory 2 Distribution of Inventory by Region 3 Volume of Production 4 Value of Production 5 Chicken Production by Region 6 Chicken Egg Production by Region 7 Imports of Day-Old Chicks 8 Imports of Chicken Meat 9 Broiler Meat Prices 10 Chicken Egg Prices 11 TABLE
1 Inventory of Chicken by Type, Philippines: as of January 1, 2016-2018p 2 2 Volume of Chicken and Chicken Egg Production by Quarter, Philippines: 2015-2017
4
3 Value of Chicken and Chicken Egg Production at Current Prices, Philippines: 2015-2017
5
4 Value of Chicken and Chicken Egg Production at Constant 2000 Prices, Philippines: 2015-2017
5
5 Volume of Chicken Production by Region, Philippines: 2015-2017 6 6 Volume of Layer and Native Chicken Egg Production by Region, Philippines: 2016-2017
7
7 Volume of Imported Day-Old Chick Breeders by Quarter, Philippines: 2015-2017 8 8 Volume and Value of Imported Chicken Meat by Quarter, Philippines: 2015-2017 9 9 Inventory of Chicken by Type and Region, Philippines: 2016-2018 13 10 Volume of Chicken Production by Quarter and Region, Philippines: 2016-2017 16 11 Volume of Chicken Egg Production by Quarter and Region, Philippines: 2016-2017
17
12 Annual Volume of Chicken Production by Province: 2015-2017 18 13 Annual Volume of Chicken Egg Production by Province: 2015-2017 21 14 Monthly Average Farmgate Prices of Broiler Chicken, Philippines: 2015-2017 24 15 Monthly Average Wholesale Prices of Broiler Chicken, Metro Manila: 2015-2017 24 16 Monthly Average Retail Prices of Broiler Chicken, Metro Manila: 2015-2017 25 17 Monthly Average Farmgate Prices of Chicken Egg, Philippines: 2015-2017 26 18 Monthly Average Wholesale Prices of Chicken Egg, Metro Manila: 2015-2017 26
Continued
CHICKEN SITUATION REPORT
v
CHICKEN SITUATION REPORT

CONTENTS--Concluded
Page 19 Monthly Average Retail Prices of Chicken Egg, Metro Manila: 2015-2017 27 20 Number of Chickens Dressed in Poultry Dressing Plants by Quarter and Region: 2016-2017
28
FIGURE
1 Changes In Chicken Inventory by Type, Philippines: as of January 1, 2016-2018 1 2 Changes In Chicken and Chicken Egg Production, Philippines: 2015-2017 1 3 Changes In Chicken and Chicken Egg Average Farmgate Prices, Philippines: 2015-2017
1
4 Percentage Distribution of Chicken Inventory by Type, Philippines: as of January 1, 2018
2
5 Pecentage Distribution of Broiler Chicken Inventory by Region, Philippines: as of January 1, 2018
3
6 Percentage Distribution of Layer Inventory by Region, Philippines: as of January 1, 2018
3
7 Distribution of Native/Improved Chicken Inventory by Region, Philippines: as of January 1, 2018
3
8 Monthly Average Farmgate Prices of Broiler Chicken, Philippines: 2015-2017 10 9 Monthly Average Wholesale Prices of Broiler Chicken, Metro Manila: 2015-2017 10 10 Monthly Average Retail Prices of Fully Dressed Broiler Chicken, Metro Manila: 2015-2017
10
11 Monthly Average Farmgate Prices of Chicken Egg, Philippines: 2015-2017 11 12 Monthly Average Wholesale Prices of Chicken Egg, Metro Manila: 2015-2017 11 13 Monthly Average Retail Prices of Chicken Egg, Metro Manila: 2015-2017 11 14 Thematic Map of Total Chicken Inventory: as of January 1, 2017 29 15 Thematic Map of Native/Improved Chicken Inventory: as of January 1, 2017 30 16 Thematic Map of Broiler Chicken Inventory: as of January 1, 2017 31 17 Thematic Map of Layer Chicken Inventory: as of January 1, 2017 32 18 Thematic Map of Chicken Production: January – December 2017 33 19 Thematic Map of Chicken Egg Production: January – December 2017 34
vi vi
CHICKEN SITUATION REPORT

TECHNICAL NOTES
The data in this report is collected by the Philippine Statistics Authority (PSA) through
the two (2) major surveys, namely:
1. Backyard Livestock and Poultry Survey (BLPS) which covers one (1) of the four (4) replicate samples of the Palay and Corn Production Survey (PCPS). It consists of 15, 032 sample households in 1,079 sample barangays nationwide; and,
2. Commercial Livestock and Poultry Survey (CLPS) covering about 554 sample layer farms and 898 broiler commercial farms and contract growers as of January 2017.
Both surveys are conducted semi-annually simultaneously every quarter in all provinces.
Another survey that supplements the data requirements of the livestock and poultry sub-
sector is the Compilation of Data from Slaughterhouses and Poultry Dressing Plants
(CDSPDP). This covers around 1,387 Accredited (AAA and AA) and Locally Registered
Meat Establishments (LRMEs) nationwide and is undertaken in coordination with the
National Meat Inspection Service (NMIS).
Concepts and Definitions
Backyard Farm refers to any farm or household whether farming or non-farming
raising at least one bird of animals and does not qualify as a commercial farm.
Commercial Farm refers to any broiler or layer farm which satisfied at least one
of the following conditions:
500 layers, or 1, 000 broilers
100 layers and 100 broilers if raised in combination
Continued
vii
CHICKEN SITUATION REPORT

NOTES -- Concluded
viii
Farmgate Price refers to the price received by farmers, livestock and poultry raisers for the sale of their produce at the first point of sale net of freight.
Imports refer to the number of day-old chicks and meat products originating from foreign country. The data on imported day-old chicks was gathered from the Bureau of Animal Industry – National Veterinary Quarantine Services (BAI-NVQS). Meanwhile, meat importation data came from the Trade Statistics Division (TSD) of PSA.
Inventory refers to the actual number of chicken in birds present in the farm as of a specific reference date.
Beginning Inventory is the number of animals present in the farm as of the beginning of the reference period i.e for January to March the beginning inventory is as of January 1.
Ending Inventory is the number of remaining stocks present in the farm as of the ending of the reference period i.e for January to March, the remaining inventory is as of April 1.
Locally Registered Meat Establishment (LRME) are slaughterhouses, meat processing plants, Poultry Dressing Plants, meat cutting plants and cold storages that are allowed to operate by the city/municipal government but are not accredited by the NMIS.
Poultry Dressing Plants (PDP) are premises that are approved and registered by the controlling authority in which poultry are dressed for human consumption.
Retail Price are the prices at which retailers sell their goods or commodities to consumers in the marketplace.
Supply and Disposition refers to a framework that explains the population dynamics of animals in the farm including hatched live, deaths and losses, number of animals dressed in the farm/household and sold live for dressing which serves as supporting information or indicators to the volume of production estimates.
Value of Production refers to the value of the animal with reference to its farmgate price. It is derived by multiplying the volume of production by its farmgate price.
Volume of Production refers to the volume of locally-raised animals disposed for dressing which include animals shipped-out for dressing. This is expressed in thousand metric tons, liveweight.
Wholesale Price refers to the price of unprocessed agricultural commodities which are traded in major local/provincial market centers. In this report, it highlights the wholesale price in Metro Manila because it is considered to be a demand area.
viii
CHICKEN SITUATION REPORT
CHICKEN SITUATION REPORT
Standard Symbols, Unit of Measure and Acronyms
used in this report
-- Data not available
- Nil
p Preliminary
r Revised
M Million
Kg Kilogram
MT Metric ton
PhP Philippine Peso
US$ US dollar
C.I.F Cost, Insurance and Freight
NIR Negros Island Region
CAR Cordillera Administrative Region
ARMM Autonomous Region in Muslim Mindanao
MIMAROPA Occidental Mindoro, Oriental Mindoro, Marinduque, Romblon, Palawan
CALABARZON Cavite, Laguna, Batangas, Rizal, Quezon
SOCCSKSARGEN South Cotabato, Cotabato City, Sultan Kudarat, Sarangani, General Santos City
ix
CHICKEN SITUATION REPORT
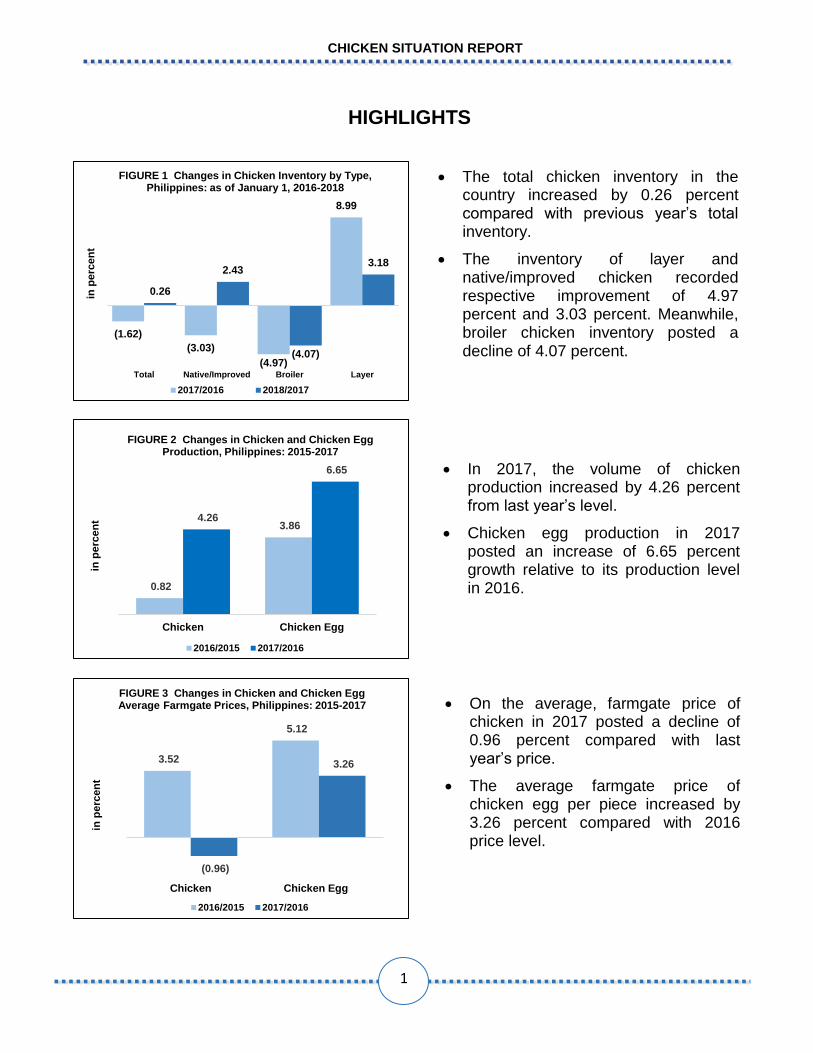
In 2017, the volume of chicken production increased by 4.26 percent from last year’s level.
Chicken egg production in 2017 posted an increase of 6.65 percent growth relative to its production level in 2016.
HIGHLIGHTS
HIGHLIGHTS
On the average, farmgate price of chicken in 2017 posted a decline of 0.96 percent compared with last year’s price.
The average farmgate price of chicken egg per piece increased by 3.26 percent compared with 2016 price level.
0.82
3.86 4.26
6.65
Chicken Chicken Egg
in p
erc
en
t
FIGURE 2 Changes in Chicken and Chicken Egg Production, Philippines: 2015-2017
2016/2015 2017/2016
3.52
5.12
(0.96)
3.26
Chicken Chicken Eggs
in p
erc
en
t
FIGURE 3 Changes in Chicken and Chicken Egg Average Farmgate Prices, Philippines: 2015-2017
2016/2015 2017/2016
(1.62)
(3.03)
(4.97)
8.99
0.26
2.43
(4.07)
3.18
Total Native/Improved Broiler Layer
in p
erc
en
t
FIGURE 1 Changes in Chicken Inventory by Type, Philippines: as of January 1, 2016-2018
2017/2016 2018/2017
The total chicken inventory in the country increased by 0.26 percent compared with previous year’s total inventory.
The inventory of layer and native/improved chicken recorded respective improvement of 4.97 percent and 3.03 percent. Meanwhile, broiler chicken inventory posted a decline of 4.07 percent.
1
CHICKEN SITUATION REPORT

INVENTORY
TABLE 1 Inventory of Chicken by Type, Philippines: as of January 1, 2016-2018 (million birds)
INVENTORY
Table 1. Inventory of Chicken by Type, Philippines, as of January 1, 2015-2017P
(in million birds)
*Foreign Strain resulting from importation of GP and PS DOC breeders
P- Preliminary *Foreign Strain resulting from importation of GP and PS DOC breeders
Broiler 34%
Layer 20%
Native/ Improved
46%
FIGURE 4 Distribution of Chicken Inventory by Type, Philippines: as of
January 1, 2018
Bird Type 2016 2017r 2018p Percent Change
17/16 18/17
CHICKEN 178.77 175.32 175.77 (1.94) 0.26 Broiler* 65.71 62.44 59.90 (4.97) (4.07)
Layer* 32.23 34.47 35.57 6.97 3.18 Laying Flock (5 months and above)
26.21 28.55 28.98 8.92 1.52
Growing Flock (5 months and below)
4.71 5.00 5.34 6.23 6.73
Day-Old Layer (1-7 days)
1.31 0.93 1.25 (29.24) 34.96
Native/Improved 80.85 78.40 80.30 (3.03) 2.43
As of January 1, 2018, layer chicken inventory shared 20 percent of the total chicken inventory.
Laying flock inventory as of January 1, 2018 went up by 1.52 percent relative to its 2017 level.
Native/Improved chicken stocks recorded an expansion of 2.43 percent in 2017. Of the three (3) chicken types, native/improved chicken shared the highest at 80.30 million birds or 46 percent of the total chicken stocks.
The total chicken inventory as of January 1, 2018 was estimated at 175.77 million birds, or 0.26 percent growth compared with previous year’s stocks. Layer and native/improved chicken inventory increased by 3.18percent and 2.43 percent, respectively. On the other hand, inventory of broiler chicken declined by 4.07 percent.
2
CHICKEN SITUATION REPORT
DISTRIBUTION OF CHICKEN INVENTORY BY REGION
DISTRIBUTION OF INVENTORY BY REGION
-
0.01
0.26
0.60
0.77
1.49
1.96
4.34
4.84
6.53
6.65
7.37
9.86
11.79
17.24
26.27
ARMM
CAR
MIMAROPA
CARAGA
Eastern Visayas
Cagayan Valley
Zamboanga Peninsula
SOCCSKSARGEN
Davao Region
Ilocos Region
Central Visayas
Bicol Region
Western Visayas
Northern Mindanao
CALABARZON
Central Luzon
FIGURE 5 Percentage Distribution of Broiler Inventory by Region, Philippines: as of January 1,
2018
(in percent)
1.87 1.99 2.03 2.15
3.32 4.97 5.37 5.60 5.81
6.57 6.74
8.07 9.26 9.72
10.62 15.92
CARAGA
CAR
Eastern Visayas
ARMM
CALABARZON
MIMAROPA
Zamboanga Peninsula
SOCCSKSARGEN
Cagayan Valley
Ilocos Region
Bicol Region
Central Luzon
Davao Region
Central Visayas
Northern Mindanao
Western Visayas
FIGURE 7 Percentage Distribution of Native/Improved Chicken Inventory by Region,
Philippines: as of January 1, 2018
(in percent)
0.00
0.38
0.51
0.76
1.05
1.63
1.70
1.75
2.31
3.71
4.16
5.30
8.80
10.62
20.40
36.91
ARMM
CAR
MIMAROPA
CARAGA
Eastern Visayas
Zamboanga Peninsula
Bicol Region
Cagayan Valley
Ilocos Region
Davao Region
Western Visayas
SOCCSKSARGEN
Central Visayas
Northern Mindanao
Central Luzon
CALABARZON
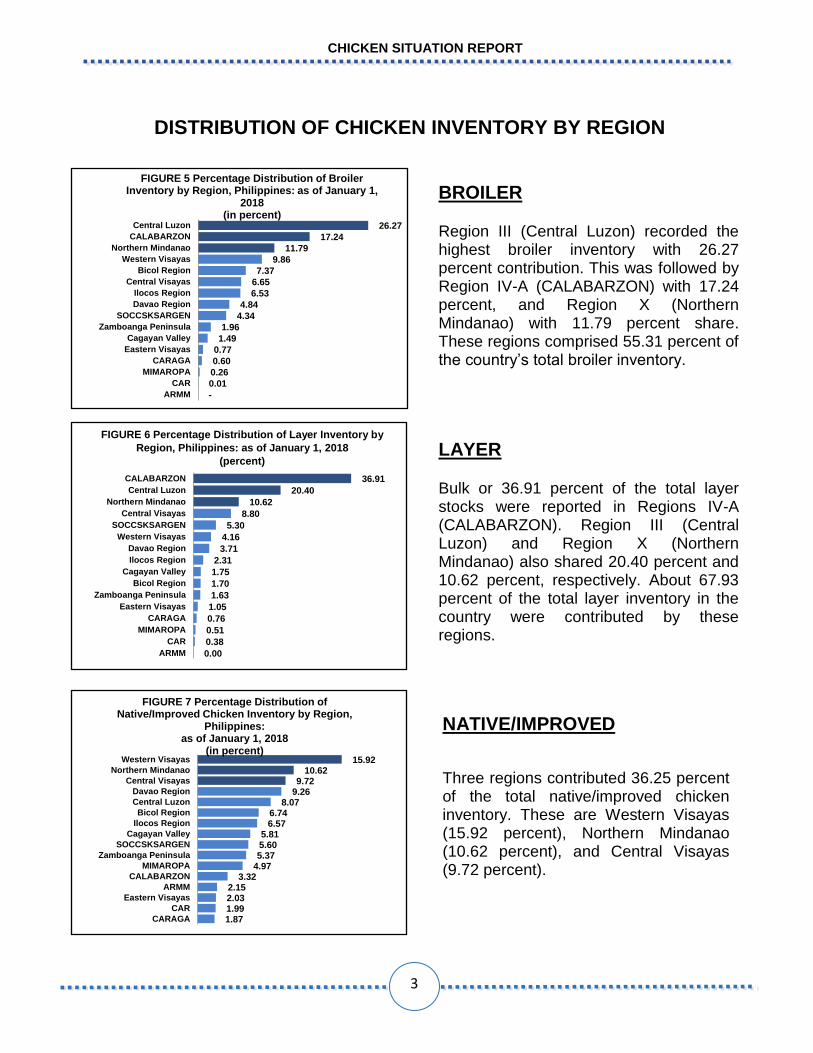
BROILER
Region III (Central Luzon) recorded the highest broiler inventory with 26.27 percent contribution. This was followed by Region IV-A (CALABARZON) with 17.24 percent, and Region X (Northern Mindanao) with 11.79 percent share. These regions comprised 55.31 percent of the country’s total broiler inventory.
LAYER
Bulk or 36.91 percent of the total layer stocks were reported in Regions IV-A (CALABARZON). Region III (Central Luzon) and Region X (Northern Mindanao) also shared 20.40 percent and 10.62 percent, respectively. About 67.93 percent of the total layer inventory in the country were contributed by these regions.
NATIVE/IMPROVED
Three regions contributed 36.25 percent of the total native/improved chicken inventory. These are Western Visayas (15.92 percent), Northern Mindanao (10.62 percent), and Central Visayas (9.72 percent).
FIGURE 6 Percentage Distribution of Layer Inventory by
Region, Philippines: as of January 1, 2018
(percent)
3
CHICKEN SITUATION REPORT
VOLUME OF PRODUCTION
TABLE 2 Volume of Chicken and Chicken Egg Production by Quarter, Philippines: 2015-2017
(metric ton)
(M.T. Liveweight)
VOLUME AND VALUE OF PRODUCTION
Table 4. Volume of Production by Quarter, Philippines, January-December 2014-2016
(metric ton liveweight)
(M.T. Liveweight)
Item 2015 2016 2017 Percent Change
16/15 17/16
CHICKEN 1,660,813 1,674,505 1,745,888 0.82 4.26 Jan - Mar 414,179 412,991 419,303 (0.29) 1.53 Apr - Jun 404,934 404,831 442,567 (0.03) 9.32 Jul - Sept 393,523 400,951 411,057 1.89 2.52 Oct-Dec 448,177 455,732 472,962 1.69 3.78 CHICKEN EGGS 444,550 461,719 492,405 3.86 6.65 Jan - Mar 111,824 117,842 121,535 5.38 3.13 Apr - Jun 107,848 114,701 121,453 6.35 5.89 Jul - Sept 107,631 112,967 121,627 4.96 7.67 Oct - Dec 117,247 116,209 127,791 (0.89) 9.97
CHICKEN SITUATION REPORT
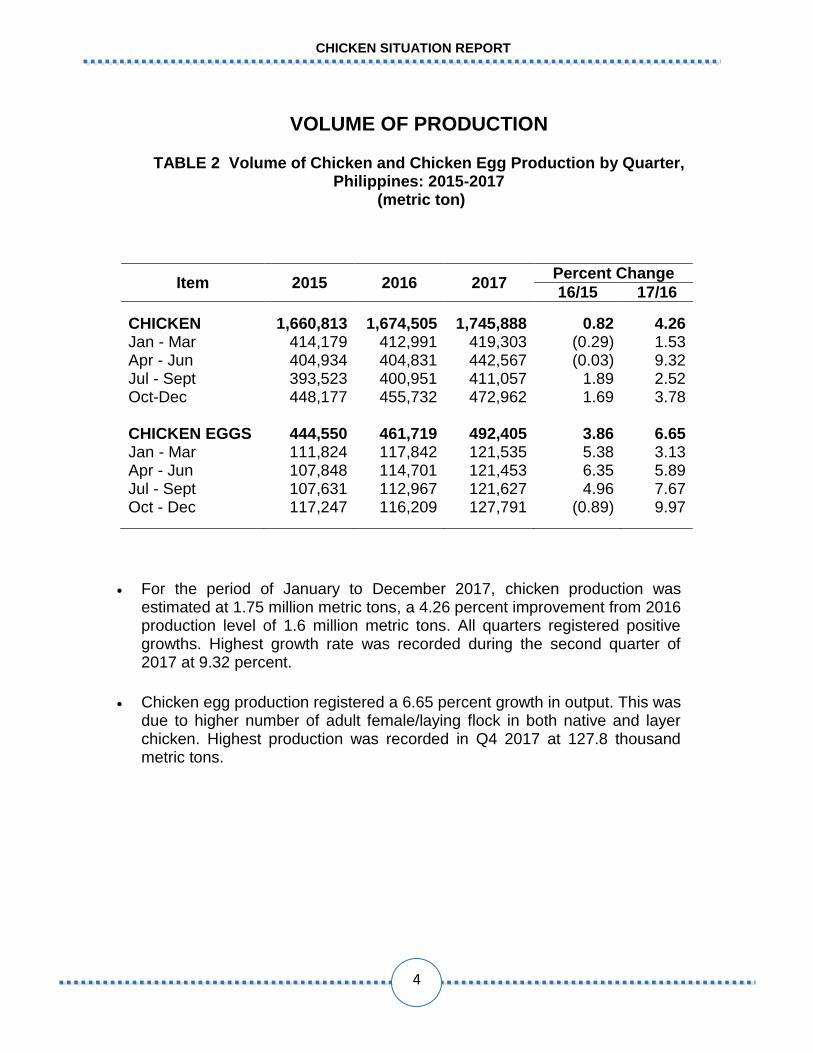
For the period of January to December 2017, chicken production was
estimated at 1.75 million metric tons, a 4.26 percent improvement from 2016 production level of 1.6 million metric tons. All quarters registered positive growths. Highest growth rate was recorded during the second quarter of 2017 at 9.32 percent.
Chicken egg production registered a 6.65 percent growth in output. This was due to higher number of adult female/laying flock in both native and layer chicken. Highest production was recorded in Q4 2017 at 127.8 thousand metric tons.
4
VALUE OF PRODUCTION
TABLE 3 Value of Chicken and Chicken Egg Production at Current Prices, Philippines: 2015-2017
(million pesos)
(M.T. Liveweight)
TABLE 4 Value of Chicken and Chicken Egg Production at Constant 2000 Prices, Philippines: 2015-2017
(million pesos)
Item 2015 2016 2017 Percent Change
16/15 17/16
Chicken 145,935.90 149,801.22 156,604.05 2.65 4.54 Chicken Egg 42,694.87 46,222.69 50,875.46 8.26 10.07
Item 2015 2016 2017 Percent Change
16/15 17/16
Chicken 93,790.64 94,563.70 98,594.90 0.82 4.26 Chicken Egg 24,328.88 25,268.31 26,947.71 3.86 6.65
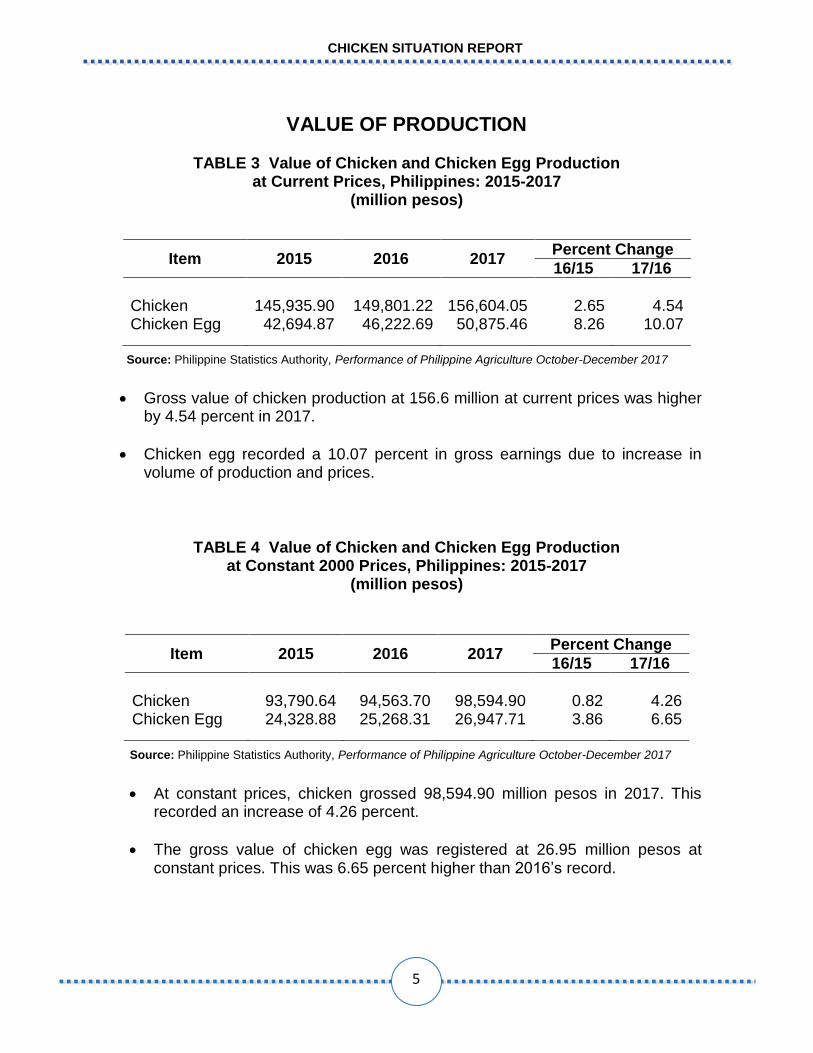
Gross value of chicken production at 156.6 million at current prices was higher by 4.54 percent in 2017.
Chicken egg recorded a 10.07 percent in gross earnings due to increase in volume of production and prices.
At constant prices, chicken grossed 98,594.90 million pesos in 2017. This recorded an increase of 4.26 percent.
The gross value of chicken egg was registered at 26.95 million pesos at constant prices. This was 6.65 percent higher than 2016’s record.
Source: Philippine Statistics Authority, Performance of Philippine Agriculture October-December 2017
Source: Philippine Statistics Authority, Performance of Philippine Agriculture October-December 2017
5
CHICKEN SITUATION REPORT

CHICKEN PRODUCTION BY REGION
TABLE 5 Volume of Chicken Production by Region, Philippines: 2015-2017 (metric ton, liveweight)
CHICKEN PRODUCTION BY REGION
Table 6. Volume of Chicken Production, by Quarter and Annual, by Region, Philippines, 2015-2016
(in metric tons, liveweight)
Region 2015 2016 2017 Percent Change
16/15 17/16
PHILIPPINES 1,660,813 1,674,505 1,745,888 0.82 4.26 CAR 7,736 7,602 7,925 (1.74) 4.24
Ilocos Region 82,829 78,760 78,079 (4.91) (0.86) Cagayan Valley 59,319 60,644 58,777 2.23 (3.08) Central Luzon 609,509 590,993 624,686 (3.04) 5.70 CALABARZON 321,670 328,430 328,646 2.10 0.07 MIMAROPA 10,643 10,301 10,154 (3.21) (1.42) Bicol Region 40,042 42,241 43,967 5.49 4.09 Western Visayas 89,910 95,835 103,818 6.59 8.33 Central Visayas 97,616 99,743 104,845 2.18 5.12 Eastern Visayas 28,347 36,294 49,319 28.03 35.89 Zamboanga Peninsula 27,826 30,204 31,986 8.55 5.90 Northern Mindanao 146,029 152,801 159,086 4.64 4.11 Davao Region 73,582 72,007 71,758 (2.14) (0.35) SOCCSKSARGEN 47,142 49,844 53,403 5.73 7.14 Caraga 13,253 13,864 14,591 4.61 5.24 ARMM 5,359 4,943 4,848 (7.75) (1.93)
The total chicken production went up by 4.26 percent in 2017. This was a recovery from a slower growth of 0.82 percent in 2016.
Eleven (11) regions posted increases in production ranging from 0.07 percent (CALABARZON) to 35.89 percent (Eastern Visayas).
Central Luzon was the country’s top chicken producer with 35.78 percent share in the total chicken production followed by CALABARZON with 18.82 percent share and Northern Mindanao with 9.11 percent share contribution. These regions accounted for 63.72 percent of the total chicken production in the country.
6
CHICKEN SITUATION REPORT

CHICKEN EGG PRODUCTION BY REGION
TABLE 6 Volume of Layer and Native Chicken Egg Production by Region, Philippines: 2016-2017
(metric ton)
CHICKEN EGG PRODUCTION BY REGION
Table 7. Volume of Chicken Egg Production of Layer and Native Chicken, by Region, Philippines, January–December 2015-2016
(in metric tons)
Region Layer Native/Improved Total Egg Production
2016 2017 Percent Change
2016 2017 Percent Change
2016 2017 Percent Change
PHILIPPINES 381,247 409,506 7.41 80,473 82,900 3.02 461,719 492,406 6.65 CAR 1,773 1,720 (2.96) 1,731 1,677 (3.14) 3,504 3,397 (3.05) Ilocos Region 9,149 10,978 19.99 4,932 5,287 7.21 14,080 16,265 15.52 Cagayan Valley 7,550 8,047 6.58 4,755 4,940 3.88 12,306 12,987 5.54 Central Luzon 86,028 95,186 10.65 7,536 6,973 (7.47) 93,564 102,159 9.19 CALABARZON 137,418 142,196 3.48 2,857 2,821 (1.25) 140,276 145,017 3.38 MIMAROPA 1,201 1,287 7.19 4,200 4,343 3.41 5,401 5,631 4.25 Bicol Region 8,405 7,123 (15.26) 4,976 5,667 13.89 13,381 12,790 (4.42) Western Visayas
18,282 17,277 (5.50) 13,489 13,678 1.40 31,771 30,955 (2.57)
Central Visayas
38,679 40,501 4.71 7,625 8,067 5.79 46,304 48,568 4.89 Eastern Visayas 1,546 2,155 39.42 963 960 (0.36) 2,509 3,114 24.15 Zamboanga Peninsula 6,305 6,946 10.17 4,750 5,535 16.51 11,055 12,481 12.89 Northern Mindanao 36,536 39,100 7.02 6,549 6,613 0.99 43,084 45,713 6.10 Davao Region 17,162 17,579 2.43 8,333 8,828 5.93 25,495 26,407 3.58 SOCCSKSARGEN 7,809 15,907 103.70 3,052 2,881 (5.58) 10,861 18,789 73.00 Caraga 3,402 3,500 2.87 1,355 1,334 (1.59) 4,757 4,834 1.60 ARMM 2 3 77.31 3,370 3,296 (2.18) 3,371 3,299 (2.14)
CHICKEN SITUATION REPORT
In 2017, the chicken egg production was registered at 492,406 metric tons. This went up by 6.65 percent compared with 2016 level. Egg production from layer chicken increased by 7.41 percent and contributed 83.16 percent share of the total chicken egg production. Moreover, egg produced by native/improved chicken also went up by 3.02 percent and accounted for 16.84 percent share of the total chicken egg production.
Twelve (12) regions posted increases in egg production. SOCCSKSARGEN has the highest increase in production with 73.0 percent growth in 2017.
Major chicken egg producing regions were CALABARZON, Central Luzon, Central Visayas and Northern Mindanao. These regions collectively contributed about 69.34 percent of the total chicken egg production.
7

IMPORTS OF DAY-OLD CHICKS
TABLE 7 Volume of Imported Day-Old Chick Breeders by Quarter, Philippines: 2015-2017
(number of birds)
IMPORTS
Table 2.Volume of Imported Day-Old Chick Breeder, by Quarter, Philippines, 2014-2016
(in birds)
Item 2015 2016 2017 Percent Change
16/15 17/16
TOTAL DOC 5,661,159 5,765,989 8,983,910 1.85 55.81
BROILER 5,302,350 5,277,127 8,413,550 (0.48) 59.43
Grand Parent Stock (GPS) 503,832 491,920 607,313 (2.36) 23.46 Jan - Mar 112,486 81,270 101,914 (27.75) 25.40 Apr - Jun 99,402 193,551 231,682 94.72 19.70 Jul - Sept 185,352 111,889 112,577 (39.63) 0.61 Oct - Dec 106,592 105,210 161,140 (1.30) 53.16 Parent Stock (PS) 1,677,152 1,843,849 2,732,246 9.94 48.18 Jan - Mar 647,528 496,449 752,166 (23.33) 51.51 Apr - Jun 184,104 233,751 646,037 26.97 176.38 Jul - Sept 376,357 677,452 799,873 80.00 18.07 Oct - Dec 469,163 436,197 534,170 (7.03) 22.46 Parent Stock Hatching Egg (PS-HE)
2,762,557 2,452,496 4,503,631 (11.22) 83.63
Jan - Mar 800,640 560,784 1,468,926 (29.96) 161.94 Apr - Jun 463,597 367,300 898,200 (20.77) 144.54 Jul - Sept 498,240 629,376 990,405 26.32 57.36 Oct - Dec 1,000,080 895,036 1,146,100 (10.50) 28.05 LAYER Parent Stock (PS) 358,809 488,862 570,360 36.25 16.67 Jan - Mar 34,890 136,115 137,213 290.13 0.81 Apr - Jun 156,136 121,730 117,822 (22.04) (3.21) Jul - Sept 66,460 100,022 99,628 50.50 (0.39) Oct - Dec 101,323 130,995 215,697 29.28 64.66
Source: BAI-National Veterinary Quarantine Services
Total Day- Old Chicks (DOCs) imports was 8.98 million bird or 55.81 percent higher than the 2016 level.
Importation of DOC broiler breeders increased all throughout the year. Highest importation of broiler GPS was noted during the last quarter of 2017 at 53.16 percent. For broiler PS, significant increase in importation was recorded during the second quarter, while for hatching egg, bulk of the importation was during the first and second quarters of 2017.
The importation of DOC Layer Parent Stock was recorded at 570, 360 birds in 2017. This was 16.67 percent higher than the previous year’s level.
CHICKEN SITUATION REPORT
8

IMPORTS OF CHICKEN MEAT
TABLE 8 Volume and Value of Imported Chicken Meat by Quarter, Philippines: 2015-2017 (metric ton and $US CIF)
CIF - Cost, Insurance and Freight Source: Trade Statistics Division, Philippine Statistics Authority
Item 2015 2016 2017 Percent Change
16/15 17/16
VOLUME 190,528.85 227,908.27 218,243.48 19.62 (4.24)
Jan - Mar 53,671.86 55,794.76 41,387.13 3.96 (25.82) Apr - Jun 43,537.06 59,107.37 37,059.71 35.76 (37.30)
Jul - Sept 42,647.04 54,003.36 86,747.04 26.63 60.63 Oct - Dec 50,672.90 59,002.79 53,049.61 16.44 (10.09) VALUE 179,323.74 214,682.06 205,873.97 19.72 (4.10) Jan - Mar 52,577.10 48,674.66 38,077.37 (7.42) (21.77) Apr - Jun 41,455.98 54,959.39 35,112.24 32.57 (36.11) Jul - Sept 39,432.09 52,412.57 81,394.03 32.92 55.29 Oct - Dec 45,858.57 58,635.44 51,290.33 27.86 (12.53)
Volume of imported chicken meat declined by 4.24 percent from 227,908.27 metric tons in 2016 to 218, 243.48 metric tons in 2017. Drop in the importation of chicken meat was noted during the first, second and fourth quarters of 2017. However, the third quarter importation grew by 60.63 percent compared to last year’s arrival.
Imports of chicken meat at US$ 205.9 contracted by 4.10 percent in 2017.
9
CHICKEN SITUATION REPORT

BROILER MEAT PRICES
0.0
20.0
40.0
60.0
80.0
100.0
120.0
140.0
Jan Feb Mar Apr May Jun Jul Aug Sept Oct Nov Dec
FIGURE 9 Monthly Average Wholesale Prices of Broiler Chicken, Metro Manila: 2015-2017
2015 2016 2017
Source: Department of Agriculture – Agribusiness and Marketing Assistance Service
FARMGATE PRICES
The annual average farmgate price of broiler meat in 2017 was at PhP 81.46 per kilogram, liveweight. Farmgate price of broiler declined by 0.96 percent from PhP 82.25 per kilogram, liveweight.
Highest farmgate price was recorded in May at PhP 90.07 per kilogram, liveweight. While the lowest was in August at PhP 61.81 per kilogram, liveweight. (Table 14)
FARMGATE PRICES
The January-June average farmgate price of broiler meat in 2016 was at ₱86.31 per kilogram lwt. Farmgate price of broiler increased by 13.18 percent from the January–June 2015 price of ₱76.26 per kilogram lwt.
Highest farmgate price during the first half of the year was recorded in May at ₱87.79 per kilogram lwt. while the lowest was in March at ₱84.19 per kilogram lwt. (Table 8)
WHOLESALE PRICES The 2017 annual average wholesale price of broiler meat in Metro Manila was recorded at PhP 115.73 per kilogram. A price reduction of Php0.60 per kilogram from 2016 price level of Php116.33 per kilogram.
The highest wholesale price was observed at PhP 123.72 per kilogram during the month of December and the lowest price was in September at PhP 94.35 per kilogram. (Table 15)
WHOLESALE PRICES
The January-June 2016 average wholesale price of broiler meat in Metro Manila was at ₱97.35 per kilogram lwt. It was 5.67 percent higher than the January–June 2015 average wholesale price of ₱92.12 per kilogram lwt.
The highest wholesale price in January-June 2015 was observed during the month of May at ₱106.15 per kilogram lwt while the lowest price was noted in April at ₱86.98 per kilogram lwt.
RETAIL PRICES In Metro Manila, the average retail price of fully dressed broiler was 2.94 percent higher than the 2016 price record.
Better price was noted during the month of December at PhP 150.80 per kilogram. While lower price was quoted at PhP 126.47 pesos per kilogram in September. (Table 16)
0.0
20.0
40.0
60.0
80.0
100.0
120.0
140.0
Jan Feb Mar Apr May Jun Jul Aug Sept Oct Nov Dec
FIGURE 10 Monthly Average Reatail Prices of Fully Dressed Broiler Chicken, Metro Manila:
2015-2017
2014 2015 2016
0.0
20.0
40.0
60.0
80.0
100.0
Jan Feb Mar Apr May Jun Jul Aug Sept Oct Nov Dec
Figure 8. Monthly Average Farmgate Prices of Broiler Chicken, Philippines: 2015-2017
2015 2016 2017
10
CHICKEN SITUATION REPORT

CHICKEN EGG PRICES
0.0
1.0
2.0
3.0
4.0
5.0
Jan Feb Mar Apr May Jun Jul Aug Sept Oct Nov Dec
FIGURE 12 Monthly Average Wholesale Prices of Chicken Egg, Philippines: 2015-2017
2015 2016 2017
FARMGATE PRICES
The annual average farmgate price of chicken eggs was PhP 4.68 per piece, 3.26 percent higher from PhP 4.53 per piece in 2016.
The highest average monthly price was recorded in January at PhP 4.81 per piece and lowest price was in September at PhP 4.51 pesos per piece. (Table 17)
FARMGATE PRICES
The January-June 2016 average farmgate price of chicken eggs was ₱4.34 per piece which was higher by 0.27 percent from its average farmgate price in the first half of 2015.
The highest recorded average farmgate price in January-June 2016 was in January at ₱4.51 per piece while the lowest average farmgate price was in April at ₱4.23 per piece.
(Table 9)
WHOLESALE PRICES
Chicken egg average wholesale price in Metro Manila was PhP 4.18 per piece and it declined by 8.08 percent compared to the price level in 2016.
On the average, chicken egg price at wholesale was recorded most expensive in February at PhP 4.97 per piece while the lowest wholesale price was recorded in May at PhP 3.48 per piece. (Table 18)
RETAIL PRICES
The average retail price of chicken egg in Metro Manila was PhP 5.34 per piece in 2017. It increased by 4.71 percent from its price level in 2016.
Highest retail price quotation for chicken egg in 2017 was recorded in February with PhP 5.59 per piece and lowest price quotation was noted in September at PhP 5.11 per piece. (Table 19)
0.0
1.0
2.0
3.0
4.0
5.0
Jan Feb Mar Apr May Jun Jul Aug Sept Oct Nov Dec
FIGURE 11 Monthly Average Farmgate Prices of Chicken Egg, Philippines: 2015-2017
2015 2016 2017
0.0
1.0
2.0
3.0
4.0
5.0
6.0
Jan Feb Mar Apr May Jun Jul Aug Sept Oct Nov Dec
Figure 13. Monthly Average Retail Prices of Chicken Egg, Philippines: 2015-2017
2015 2016 2017
11
CHICKEN SITUATION REPORT

STATISTICAL TABLES

TABLE 9 Inventory of Chicken by Type, Quarter and Region, Philippines: 2017-2018p
(in birds)
REGION/TYPE 2017 2018
Jan 1 Apr 1 Jul 1 Oct 1 Jan 1P
Philippines
78,398,957 80,118,981 81,358,188 81,966,498 80,300,207
Native/Improved 34,473,562 34,575,006 35,655,917 35,536,203 35,568,632 Layers 62,444,399 64,351,752 64,033,466 64,289,751 59,902,901 Broilers 175,316,918 179,045,739 181,047,571 181,792,452 175,771,740 Total 78,398,957 80,118,981 81,358,188 81,966,498 80,300,207 CAR
Native/Improved 1,327,960 1,251,494 1,364,874 1,437,895 1,595,438 Layers 130,697 138,905 149,099 147,767 136,933 Broilers 11,888 122,500 326,300 41,664 3,143 Total 1,470,545 1,512,899 1,840,273 1,627,326 1,735,514 Ilocos Region
Native/Improved 4,670,743 4,910,203 5,043,546 5,237,055 5,272,758 Layers 789,921 799,190 801,985 780,171 823,178 Broilers 3,802,795 3,041,486 3,564,955 3,515,206 3,913,156 Total 9,263,459 8,750,879 9,410,486 9,532,432 10,009,092 Cagayan Valley
Native/Improved 4,339,011 4,438,027 4,563,418 4,405,847 4,665,802 Layers 656,043 645,086 724,930 662,347 623,953 Broilers 2,354,836 3,986,769 2,775,702 1,625,481 891,623 Total 7,349,890 9,069,882 8,064,050 6,693,675 6,181,378 Central Luzon
Native/Improved 6,784,902 6,404,051 5,859,845 5,902,203 6,482,140 Layers 7,570,899 7,606,635 8,424,421 7,845,608 7,256,756 Broilers 13,105,904 17,204,581 16,988,067 14,402,532 15,738,575 Total 27,461,705 31,215,267 31,272,333 28,150,343 29,477,471 CALABARZON
Native/Improved 2,882,358 2,796,584 3,242,270 3,224,723 2,662,820 Layers 12,614,124 12,407,455 12,543,461 12,332,210 13,127,864 Broilers 11,359,722 10,904,682 11,222,787 12,330,245 10,329,963 Total 26,856,204 26,108,721 27,008,518 27,887,178 26,120,647 MIMAROPA
Native/Improved 3,878,357 3,941,751 4,333,553 4,192,561 3,992,280 Layers 91,393 77,558 126,501 138,550 180,672 Broilers 175,969 150,643 128,236 148,251 156,529 Total 4,145,719 4,169,952 4,588,290 4,479,362 4,329,481
CHICKEN SITUATION REPORT
13
Continued
13

TABLE 9--Continued
REGION/TYPE 2017 2018
Jan 1 Apr 1 Jul 1 Oct 1 Jan 1P
Bicol Region
Native/Improved 4,807,924 5,037,926 5,073,670 5,522,612 5,415,456 Layers 614,673 564,877 543,746 562,328 602,972 Broilers 4,965,703 4,112,422 3,662,746 4,533,560 4,416,132 Total 10,388,300 9,715,225 9,280,162 10,618,500 10,434,560 Western Visayas
Native/Improved 12,868,734 12,972,232 12,843,406 12,923,388 12,781,654 Layers 1,572,420 1,489,911 1,464,963 1,480,073 1,478,677 Broilers 5,896,729 5,435,608 4,902,628 5,663,310 5,907,935 Total 20,337,883 19,897,751 19,210,997 20,066,771 20,168,266 Central Visayas
Native/Improved 7,235,885 7,791,616 7,736,141 7,779,903 7,803,283 Layers 2,873,533 2,917,137 3,045,730 3,114,760 3,131,672 Broilers 4,059,564 3,148,107 3,280,609 3,691,840 3,984,859 Total 14,168,982 13,856,860 14,062,480 14,586,503 14,919,814 Eastern Visayas
Native/Improved 1,680,061 2,067,074 1,667,292 1,789,478 1,628,108 Layers 330,566 354,266 342,643 374,853 373,914 Broilers 727,275 1,105,489 1,216,834 1,201,372 461,755 Total 2,737,902 3,526,829 3,226,769 3,365,703 2,463,777 Zamboanga Peninsula
Native/Improved 4,139,453 5,016,087 5,035,879 4,959,663 4,309,306 Layers 546,960 504,726 588,613 569,175 579,248 Broilers 1,195,620 1,096,850 2,058,742 936,721 1,175,980 Total 5,882,033 6,617,663 7,683,234 6,465,559 6,064,534 Northern Mindanao
Native/Improved 8,160,114 8,082,387 8,911,868 9,166,965 8,526,558 Layers 3,597,808 3,752,761 3,502,031 3,810,465 3,777,867 Broilers 8,436,868 7,761,293 8,626,089 9,362,841 7,062,083 Total 20,194,790 19,596,441 21,039,988 22,340,271 19,366,508 Davao Region
Native/Improved 7,654,403 7,059,815 7,434,592 7,454,356 7,436,424 Layers 1,515,012 1,500,046 1,546,225 1,529,250 1,319,996 Broilers 4,601,120 3,689,600 2,647,750 3,102,498 2,899,092 Total 13,770,535 12,249,461 11,628,567 12,086,104 11,655,512
CHICKEN SITUATION REPORT
14

TABLE 9--Concluded
REGION/TYPE 2017 2018
Jan 1 Apr 1 Jul 1 Oct 1 Jan 1P
SOCCSKSARGEN
Native/Improved 4,721,974 5,102,419 5,171,332 4,792,588 4,500,399 Layers 1,317,536 1,520,101 1,576,570 1,902,740 1,883,757 Broilers 1,424,022 2,348,994 2,293,641 3,390,712 2,601,138 Total 7,463,532 8,971,514 9,041,543 10,086,040 8,985,294 Caraga
Native/Improved 1,381,093 1,427,227 1,465,517 1,465,173 1,499,590 Layers 251,477 296,087 274,614 285,706 270,873 Broilers 326,384 242,728 338,380 343,518 360,938 Total 1,958,954 1,966,042 2,078,511 2,094,397 2,131,401 ARMM
Native/Improved 1,865,985 1,820,088 1,610,985 1,712,088 1,728,191 Layers 500 265 385 200 300 Broilers - - - - - Total 1,866,485 1,820,353 1,611,370 1,712,288 1,728,491
CHICKEN SITUATION REPORT
15
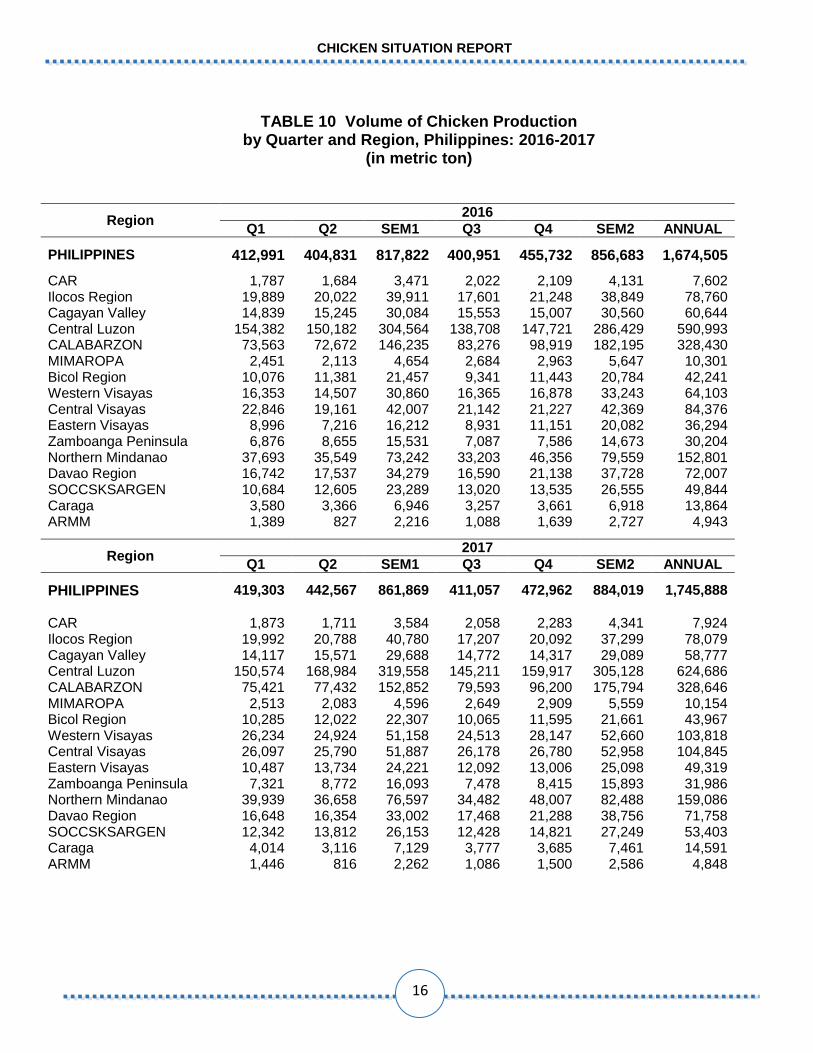
TABLE 10 Volume of Chicken Production by Quarter and Region, Philippines: 2016-2017
(in metric ton)
Region 2016
Q1 Q2 SEM1 Q3 Q4 SEM2 ANNUAL
PHILIPPINES 412,991 404,831 817,822 400,951 455,732 856,683 1,674,505
CAR 1,787 1,684 3,471 2,022 2,109 4,131 7,602 Ilocos Region 19,889 20,022 39,911 17,601 21,248 38,849 78,760 Cagayan Valley 14,839 15,245 30,084 15,553 15,007 30,560 60,644 Central Luzon 154,382 150,182 304,564 138,708 147,721 286,429 590,993 CALABARZON 73,563 72,672 146,235 83,276 98,919 182,195 328,430 MIMAROPA 2,451 2,113 4,654 2,684 2,963 5,647 10,301 Bicol Region 10,076 11,381 21,457 9,341 11,443 20,784 42,241 Western Visayas 16,353 14,507 30,860 16,365 16,878 33,243 64,103 Central Visayas 22,846 19,161 42,007 21,142 21,227 42,369 84,376 Eastern Visayas 8,996 7,216 16,212 8,931 11,151 20,082 36,294 Zamboanga Peninsula 6,876 8,655 15,531 7,087 7,586 14,673 30,204 Northern Mindanao 37,693 35,549 73,242 33,203 46,356 79,559 152,801 Davao Region 16,742 17,537 34,279 16,590 21,138 37,728 72,007 SOCCSKSARGEN 10,684 12,605 23,289 13,020 13,535 26,555 49,844 Caraga 3,580 3,366 6,946 3,257 3,661 6,918 13,864 ARMM 1,389 827 2,216 1,088 1,639 2,727 4,943
Region 2017
Q1 Q2 SEM1 Q3 Q4 SEM2 ANNUAL
PHILIPPINES 419,303 442,567 861,869 411,057 472,962 884,019 1,745,888 CAR 1,873 1,711 3,584 2,058 2,283 4,341 7,924 Ilocos Region 19,992 20,788 40,780 17,207 20,092 37,299 78,079 Cagayan Valley 14,117 15,571 29,688 14,772 14,317 29,089 58,777 Central Luzon 150,574 168,984 319,558 145,211 159,917 305,128 624,686 CALABARZON 75,421 77,432 152,852 79,593 96,200 175,794 328,646 MIMAROPA 2,513 2,083 4,596 2,649 2,909 5,559 10,154 Bicol Region 10,285 12,022 22,307 10,065 11,595 21,661 43,967 Western Visayas 26,234 24,924 51,158 24,513 28,147 52,660 103,818 Central Visayas 26,097 25,790 51,887 26,178 26,780 52,958 104,845 Eastern Visayas 10,487 13,734 24,221 12,092 13,006 25,098 49,319 Zamboanga Peninsula 7,321 8,772 16,093 7,478 8,415 15,893 31,986 Northern Mindanao 39,939 36,658 76,597 34,482 48,007 82,488 159,086 Davao Region 16,648 16,354 33,002 17,468 21,288 38,756 71,758 SOCCSKSARGEN 12,342 13,812 26,153 12,428 14,821 27,249 53,403 Caraga 4,014 3,116 7,129 3,777 3,685 7,461 14,591 ARMM 1,446 816 2,262 1,086 1,500 2,586 4,848
CHICKEN SITUATION REPORT
16

TABLE 11 Volume of Chicken Egg Production by Quarter and Region, Philippines: 2016-2017
(in metric ton)
Region 2016
Q1 Q2 SEM1 Q3 Q4 SEM2 ANNUAL
PHILIPPINES 117,842 114,700 232,542 112,968 116,209 229,177 461,719 CAR 854 890 1,744 794 967 1,761 3,505 Ilocos Region 3,964 3,279 7,243 3,274 3,564 6,838 14,081 Cagayan Valley 3,114 3,181 6,295 2,940 3,070 6,010 12,305 Central Luzon 25,098 22,311 47,409 22,932 23,223 46,155 93,564 CALABARZON 36,036 36,839 72,875 35,380 32,019 67,399 140,274 MIMAROPA 1,244 1,269 2,513 1,274 1,614 2,888 5,401 Bicol Region 3,494 3,279 6,773 3,371 3,237 6,608 13,381 Western Visayas 8,451 7,188 15,639 7,533 8,599 16,132 31,771 Central Visayas 11,978 11,044 23,022 11,586 11,696 23,282 46,304 Eastern Visayas 560 509 1,069 723 717 1,440 2,509 Zamboanga Peninsula 2,884 2,421 5,305 2,828 2,922 5,750 11,055 Northern Mindanao 9,831 12,033 21,864 8,236 12,984 21,220 43,084 Davao Region 6,294 6,118 12,412 6,517 6,566 13,083 25,495 SOCCSKSARGEN 2,127 2,279 4,406 3,489 2,966 6,455 10,861 Caraga 1,162 1,225 2,387 1,192 1,179 2,371 4,758 ARMM 751 835 1,586 899 886 1,785 3,371
Region 2017
Q1 Q2 SEM1 Q3 Q4 SEM2 ANNUAL
PHILIPPINES 121,535 121,453 242,988 121,627 127,791 249,418 492,406 CAR 737 854 1,591 874 932 1,806 3,397 Ilocos Region 3,743 3,532 7,275 4,322 4,668 8,990 16,265 Cagayan Valley 3,165 3,418 6,583 3,177 3,227 6,404 12,987 Central Luzon 27,133 23,330 50,463 25,148 26,548 51,696 102,159 CALABARZON 34,189 37,517 71,706 37,075 36,236 73,311 145,017 MIMAROPA 1,157 1,479 2,636 1,410 1,585 2,995 5,631 Bicol Region 3,405 3,247 6,652 3,127 3,011 6,138 12,790 Western Visayas 8,471 7,252 15,723 7,504 7,728 15,232 30,955 Central Visayas 12,329 11,536 23,865 12,254 12,449 24,703 48,568 Eastern Visayas 625 571 1,196 965 953 1,918 3,114 Zamboanga Peninsula 3,210 2,896 6,106 3,133 3,242 6,375 12,481 Northern Mindanao 10,512 12,283 22,795 9,437 13,481 22,918 45,713 Davao Region 6,784 6,727 13,511 6,249 6,647 12,896 26,407 SOCCSKSARGEN 4,321 4,718 9,039 4,829 4,921 9,750 18,789 Caraga 1,047 1,249 2,296 1,222 1,316 2,538 4,834 ARMM 707 844 1,551 901 847 1,748 3,299
CHICKEN SITUATION REPORT
Continued
17

TABLE 12 Annual Volume of Chicken Production by Province: 2015-2017 (metric ton)
Region/Province 2015 2016 2017 Percent Change
2016/2015 2017/2016
PHILIPPINES 1,660,813 1,674,505 1,745,888 0.82 4.26
CAR 7,736 7,602 7,924 (1.74) 4.24
Abra 609 578 631 (5.06) 9.13
Apayao 631 581 687 (8.00) 18.23
Benguet 1,335 1,111 1,069 (16.79) (3.76)
Ifugao 4,207 4,467 4,722 6.17 5.71
Kalinga 533 460 381 (13.77) (17.18)
Mountain Province 421 405 435 (3.73) 7.33
ILOCOS REGION 82,829 78,760 78,079 (4.91) (0.86)
Ilocos Norte 6,511 6,275 6,319 (3.64) 0.71
Ilocos Sur 6,073 6,128 5,813 0.91 (5.14)
La Union 12,437 11,940 11,779 (4.00) (1.35)
Pangasinan 57,808 54,418 54,169 (5.86) (0.46)
CAGAYAN VALLEY 59,319 60,644 58,777 2.23 (3.08)
Batanes 29 25 19 (13.50) (22.14)
Cagayan 15,442 13,484 11,953 (12.68) (11.35)
Isabela 34,710 37,373 36,731 7.67 (1.72)
Nueva Vizcaya 7,222 7,651 7,645 5.94 (0.08)
Quirino 1,917 2,111 2,429 10.13 15.07
CENTRAL LUZON 609,509 590,993 624,686 (3.04) 5.70
Aurora 968 770 659 (20.45) (14.46)
Bataan 74,644 62,196 56,589 (16.68) (9.01)
Bulacan 146,539 142,634 168,982 (2.66) 18.47
Nueva Ecija 120,685 116,088 107,137 (3.81) (7.71)
Pampanga 145,772 165,213 166,496 13.34 0.78
Tarlac 91,641 95,055 93,518 3.73 (1.62)
Zambales 29,261 9,038 31,305 (69.11) 246.38
CALABARZON 321,670 328,430 328,646 2.10 0.07
Batangas 92,835 102,612 107,779 10.53 5.04
Cavite 23,835 27,164 25,143 13.97 (7.44)
Laguna 41,144 44,860 47,668 9.03 6.26
Quezon 59,489 65,096 64,944 9.43 (0.23)
Rizal 104,367 88,698 83,111 (15.01) (6.30)
MIMAROPA 10,643 10,301 10,154 (3.21) (1.42)
Marinduque 467 437 439 (6.45) 0.49
Occidental Mindoro 1,454 1,425 1,413 (2.04) (0.82)
Oriental Mindoro 2,033 1,608 1,391 (20.95) (13.46)
Palawan 4,916 4,954 4,990 0.77 0.74
Romblon 1,772 1,878 1,921 5.98 2.29
Continued
18
CHICKEN SITUATION REPORT

TABLE 12--Continued
Region/Province 2015 2016 2017 Percent Change
2016/2015 2017/2016
BICOL REGION 40,042 42,241 43,967 5.49 4.09
Albay 8,791 8,825 7,063 0.39 (19.97)
Camarines Norte 3,142 2,406 2,592 (23.43) 7.72
Camarines Sur 17,872 20,570 23,803 15.09 15.72
Catanduanes 718 716 696 (0.29) (2.88)
Masbate 2,328 2,311 2,014 (0.74) (12.85)
Sorosogon 7,190 7,413 7,800 3.09 5.23
WESTERN VISAYAS 89,910 95,835 103,818 6.59 8.33
Aklan 3,958 5,629 8,648 42.22 53.63
Antique 3,622 3,462 3,422 (4.40) (1.15)
Capiz 10,443 10,345 9,865 (0.94) (4.64)
Guimaras 2,365 2,337 2,420 (1.22) 3.58
Iloilo 36,855 42,331 46,592 14.86 10.07
Negros Occidental 32,667 31,731 32,870 (2.86) 3.59
CENTRAL VISAYAS 97,616 99,743 104,845 2.18 5.12
Bohol 25,304 26,226 28,477 3.64 8.58
Cebu 56,058 57,306 60,967 2.23 6.39
Negros Oriental 15,407 15,367 14,414 (0.26) (6.20)
Siquijor 847 845 987 (0.28) 16.87
EASTERN VISAYAS 28,347 36,294 49,319 28.03 35.89
Biliran 475 409 459 (13.91) 12.12
Eastern Samar 467 450 445 (3.73) (1.06)
Leyte 22,390 29,957 41,037 33.80 36.98
Northern Samar 2,332 2,209 2,110 (5.28) (4.47)
Samar 1,563 1,976 3,858 26.42 95.24
Southern Leyte 1,120 1,293 1,411 15.46 9.15
ZAMBOANGA PENINSULA 27,826 30,204 31,986 8.55 5.90
Zamboanga del Norte 5,257 5,466 5,920 3.98 8.29
Zamboanga del Sur 5,085 6,888 8,531 35.46 23.84
Zamboanga Sibugay 2,104 2,224 2,138 5.72 (3.87)
Zamboanga City 15,379 15,624 15,397 1.59 (1.45)
NORTHERN MINDANAO 146,029 152,801 159,086 4.64 4.11
Bukidnon 48,949 53,424 56,707 9.14 6.14
Camiguin 620 698 754 12.43 8.04
Lanao del Norte 6,040 6,708 7,203 11.05 7.38
Misamis Occidental 15,189 14,702 15,489 (3.21) 5.35
Misamis Oriental 75,230 77,270 78,933 2.71 2.15
CHICKEN SITUATION REPORT
Continued
19
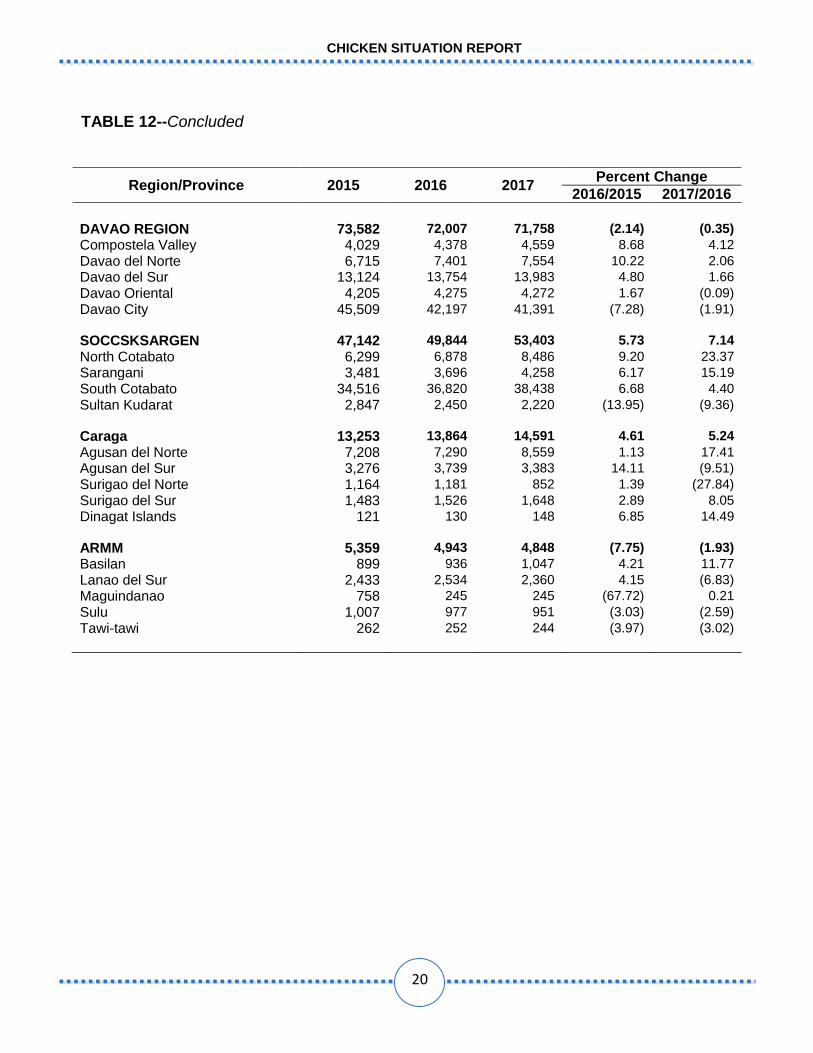
TABLE 12--Concluded
Region/Province 2015 2016 2017 Percent Change
2016/2015 2017/2016
DAVAO REGION 73,582 72,007 71,758 (2.14) (0.35)
Compostela Valley 4,029 4,378 4,559 8.68 4.12
Davao del Norte 6,715 7,401 7,554 10.22 2.06
Davao del Sur 13,124 13,754 13,983 4.80 1.66
Davao Oriental 4,205 4,275 4,272 1.67 (0.09)
Davao City 45,509 42,197 41,391 (7.28) (1.91)
SOCCSKSARGEN 47,142 49,844 53,403 5.73 7.14
North Cotabato 6,299 6,878 8,486 9.20 23.37
Sarangani 3,481 3,696 4,258 6.17 15.19
South Cotabato 34,516 36,820 38,438 6.68 4.40
Sultan Kudarat 2,847 2,450 2,220 (13.95) (9.36)
Caraga 13,253 13,864 14,591 4.61 5.24
Agusan del Norte 7,208 7,290 8,559 1.13 17.41
Agusan del Sur 3,276 3,739 3,383 14.11 (9.51)
Surigao del Norte 1,164 1,181 852 1.39 (27.84)
Surigao del Sur 1,483 1,526 1,648 2.89 8.05
Dinagat Islands 121 130 148 6.85 14.49
ARMM 5,359 4,943 4,848 (7.75) (1.93)
Basilan 899 936 1,047 4.21 11.77
Lanao del Sur 2,433 2,534 2,360 4.15 (6.83)
Maguindanao 758 245 245 (67.72) 0.21
Sulu 1,007 977 951 (3.03) (2.59)
Tawi-tawi 262 252 244 (3.97) (3.02)
20
CHICKEN SITUATION REPORT

TABLE 13 Annual Volume of Chicken Egg Production by Province: 2015-2017
(in metric ton)
Region/Province 2015 2016 2017 Percent Change
2016/2015 2017/2016
PHILIPPINES 444,550 461,719 492,406.0 3.86 6.65
CAR 3,606 3,505 3,397 (2.83) (3.06) Abra 378 350 371 (7.28) 5.91 Apayao 195 151 114 (22.56) (24.45) Benguet 961 730 719 (24.10) (1.47) Ifugao 1,290 1,545 1,477 19.75 (4.37) Kalinga 343 306 375 (10.67) 22.40 Mountain Province 439 422 341 (3.84) (19.25)
ILOCOS REGION 14,087 14,081 16,265 (0.05) 15.52 Ilocos Norte 5,006 5,430 6,901 8.47 27.10 Ilocos Sur 1,395 1,542 2,055 10.58 33.25 La Union 3,150 3,084 2,839 (2.09) (7.95) Pangasinan 4,538 4,025 4,471 (11.30) 11.07
CAGAYAN VALLEY 11,951 12,305 12,987 2.96 5.54 Batanes 50 41 65 (18.87) 59.75 Cagayan 2,890 2,926 3,116 1.26 6.48 Isabela 6,425 6,725 7,100 4.66 5.58 Nueva Vizcaya 1,188 1,042 1,072 (12.27) 2.87 Quirino 1,398 1,571 1,634 12.40 3.99
CENTRAL LUZON 91,125 93,564 102,159 2.68 9.19 Aurora 190 190 213 (0.03) 12.33 Bataan 2,948 2,079 2,467 (29.48) 18.65 Bulacan 31,503 29,191 31,742 (7.34) 8.74 Nueva Ecija 7,350 6,426 6,373 (12.57) (0.83) Pampanga 36,171 44,884 49,102 24.09 9.40 Tarlac 11,875 9,778 11,223 (17.66) 14.78 Zambales 1,089 1,016 1,040 (6.70) 2.33
CALABARZON 133,962 140,274 145,017 4.71 3.38 Batangas 100,840 106,256 108,854 5.37 2.45 Cavite 4,313 5,573 5,062 29.21 (9.17) Laguna 4,773 4,399 4,066 (7.83) (7.58) Quezon 5,409 4,935 5,697 (8.76) 15.44 Rizal 18,626 19,111 21,338 2.60 11.65
MIMAROPA 5,608 5,401 5,631 (3.69) 4.25 Marinduque 159 260 205 63.46 (21.25) Occidental Mindoro 1,146 1,057 907 (7.74) (14.19) Oriental Mindoro 1,384 1,157 1,175 (16.37) 1.50 Palawan 2,499 2,472 2,942 (1.10) 19.03 Romblon 420 455 402 8.30 (11.66)
Continued
21
21
CHICKEN SITUATION REPORT
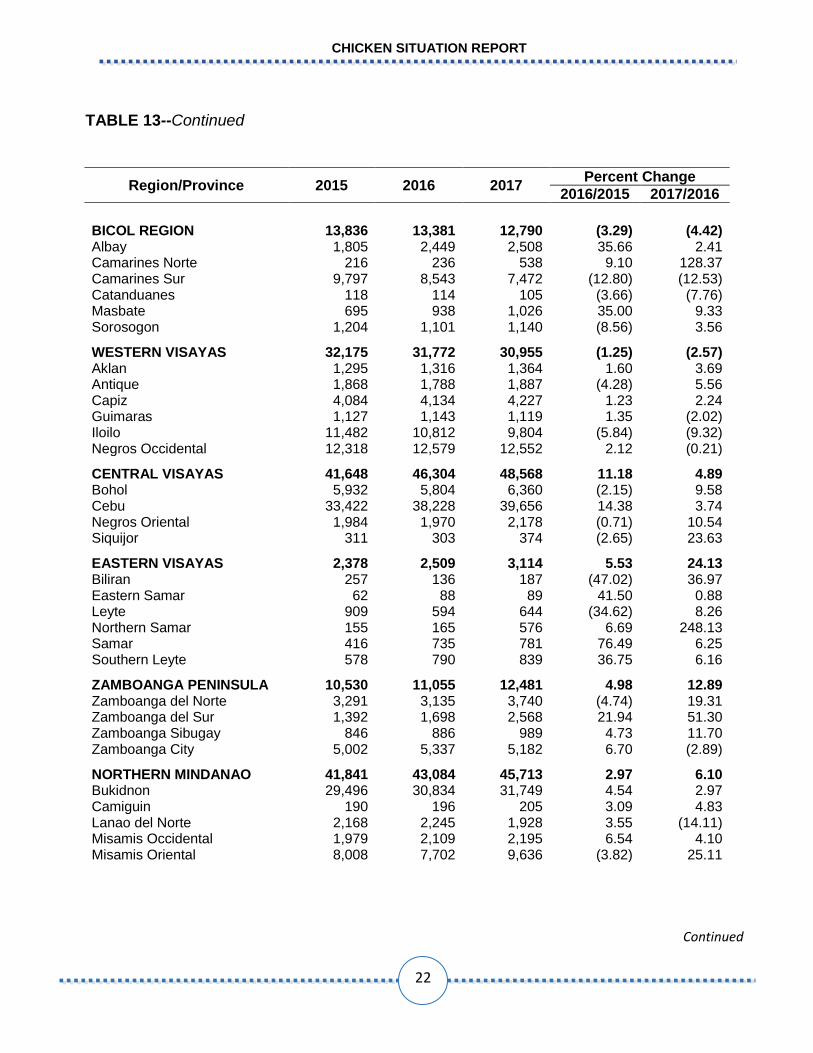
TABLE 13--Continued
Region/Province 2015 2016 2017 Percent Change
2016/2015 2017/2016
BICOL REGION 13,836 13,381 12,790 (3.29) (4.42) Albay 1,805 2,449 2,508 35.66 2.41 Camarines Norte 216 236 538 9.10 128.37 Camarines Sur 9,797 8,543 7,472 (12.80) (12.53) Catanduanes 118 114 105 (3.66) (7.76) Masbate 695 938 1,026 35.00 9.33 Sorosogon 1,204 1,101 1,140 (8.56) 3.56
WESTERN VISAYAS 32,175 31,772 30,955 (1.25) (2.57) Aklan 1,295 1,316 1,364 1.60 3.69 Antique 1,868 1,788 1,887 (4.28) 5.56 Capiz 4,084 4,134 4,227 1.23 2.24 Guimaras 1,127 1,143 1,119 1.35 (2.02) Iloilo 11,482 10,812 9,804 (5.84) (9.32) Negros Occidental 12,318 12,579 12,552 2.12 (0.21)
CENTRAL VISAYAS 41,648 46,304 48,568 11.18 4.89 Bohol 5,932 5,804 6,360 (2.15) 9.58 Cebu 33,422 38,228 39,656 14.38 3.74 Negros Oriental 1,984 1,970 2,178 (0.71) 10.54 Siquijor 311 303 374 (2.65) 23.63
EASTERN VISAYAS 2,378 2,509 3,114 5.53 24.13 Biliran 257 136 187 (47.02) 36.97 Eastern Samar 62 88 89 41.50 0.88 Leyte 909 594 644 (34.62) 8.26 Northern Samar 155 165 576 6.69 248.13 Samar 416 735 781 76.49 6.25 Southern Leyte 578 790 839 36.75 6.16
ZAMBOANGA PENINSULA 10,530 11,055 12,481 4.98 12.89 Zamboanga del Norte 3,291 3,135 3,740 (4.74) 19.31 Zamboanga del Sur 1,392 1,698 2,568 21.94 51.30 Zamboanga Sibugay 846 886 989 4.73 11.70 Zamboanga City 5,002 5,337 5,182 6.70 (2.89)
NORTHERN MINDANAO 41,841 43,084 45,713 2.97 6.10 Bukidnon 29,496 30,834 31,749 4.54 2.97 Camiguin 190 196 205 3.09 4.83 Lanao del Norte 2,168 2,245 1,928 3.55 (14.11) Misamis Occidental 1,979 2,109 2,195 6.54 4.10 Misamis Oriental 8,008 7,702 9,636 (3.82) 25.11
Continued
22
21
CHICKEN SITUATION REPORT

TABLE 13--Concluded
Region/Province 2015 2016 2017 Percent Change
2016/2015 2017/2016
DAVAO REGION 24,819 25,495 26,407 2.73 3.58 Compostela Valley 668 779 951 16.60 22.15 Davao del Norte 1,928 1,891 2,100 (1.90) 11.07 Davao del Sur 3,124 3,077 3,131 (1.52) 1.75 Davao Oriental 1,980 2,020 1,939 2.03 (4.04) Davao City 17,118 17,728 18,286 3.56 3.15
SOCCSKSARGEN 8,469 10,861 18,789 28.24 73.00 North Cotabato 2,643 2,646 3,403 0.11 28.60 Sarangani 258 290 282 12.13 (2.76) South Cotabato 4,105 6,911 14,276 68.37 106.56 Sultan Kudarat 1,463 1,013 828 (30.71) (18.33)
Caraga 4,815 4,758 4,834 (1.19) 1.60 Agusan del Norte 1,822 1,566 1,498 (14.04) (4.35) Agusan del Sur 1,929 2,165 2,150 12.20 (0.70) Surigao del Norte 503 499 483 (0.70) (3.35) Surigao del Sur 489 444 591 (9.26) 33.28 Dinagat Islands 72 84 112 16.52 33.71
ARMM 3,700 3,371 3,299 (8.89) (2.12) Basilan 604 607 643 0.44 5.93 Lanao del Sur 1,756 1,571 1,524 (10.52) (2.98) Maguindanao 211 110 115 (47.94) 5.04 Sulu 628 591 544 (5.90) (7.91) Tawi-tawi 501 492 472 (1.72) (3.95)
CHICKEN SITUATION REPORT
23
21

*Commercial
TABLE 14 Monthly Average Farmgate Prices of Broiler Chicken*, Philippines: 2015-2017
(peso per kilogram, liveweight)
BROILER MEAT PRICES
Table 8. Monthly Average Prices of Broiler Meat by Price Type, Philippines and Metro Manila, January – December 2014-2016
(peso per kilogram)
TABLE 15 Monthly Average Wholesale Prices of Broiler Chicken, Metro Manila: 2015-2017
(peso per kilogram)
BROILER MEAT PRICES
Table 8. Monthly Average Prices of Broiler Meat by Price Type, Philippines and Metro Manila, January – December 2014-2016
(peso per kilogram)
Source: Department of Agriculture – Agribusiness and Marketing Assistance Service
ITEM 2015 2016 2017 Percent Change
16/15 17/16
Annual Average 79.45 82.25 81.46 3.52 (0.96) January 79.46 86.39 81.61 8.72 (5.53) February 77.48 87.22 80.67 12.57 (7.51) March 69.96 84.19 86.22 20.34 2.41 April 73.45 86.49 87.77 17.75 1.48 May 76.49 87.79 90.07 14.77 2.60 June 80.72 85.80 81.26 6.29 (5.29) July 78.02 91.91 83.50 17.80 (9.15) August 85.14 80.07 61.81 (5.95) (22.81) September 83.40 75.12 63.18 (9.93) (15.89) October 84.37 73.80 86.13 (12.53) 16.71 November 81.23 71.84 85.29 (11.56) 18.72 December 85.31 76.40 90.01 (8.75) 17.81
ITEM 2015 2016 2017 Percent Change
16/15 17/16
Annual Average 109.13 116.33 115.73 6.59 (0.51) January 113.88 115.52 112.00 1.44 (3.04) February 108.25 123.56 118.00 14.14 (4.50) March 105.35 120.15 118.00 14.05 (1.79)
April 94.27 114.69 118.00 21.66 2.89 May 97.29 117.00 121.00 20.26 3.42 June 108.00 116.50 122.60 7.87 5.24 July 111.88 119.50 119.44 6.81 (0.05) August 113.06 120.00 109.34 6.14 (8.88) September 113.38 117.00 94.35 3.19 (19.36) October 116.28 112.00 113.81 (3.68) 1.62 November 111.57 110.00 118.52 (1.41) 7.75 December 116.36 110.00 123.72 (5.47) 12.47
24
21
CHICKEN SITUATION REPORT

TABLE 16 Monthly Average Retail Prices of Broiler Chicken, Metro Manila: 2015-2017
(peso per kilogram)
BROILER MEAT PRICES
Table 8. Monthly Average Prices of Broiler Meat by Price Type, Philippines and Metro Manila, January – December 2014-2016
(peso per kilogram)
ITEM 2015 2016 2017 Percent Change
16/15 17/16
Annual Average 132.58 137.24 141.27 3.51 2.94 January 135.51 135.96 136.40 0.33 0.32 February 133.58 138.17 144.40 3.44 4.51 March 128.16 137.59 142.35 7.36 3.46
April 124.28 134.63 146.40 8.33 8.74 May 128.46 141.75 145.63 10.35 2.74 June 132.17 140.83 142.49 6.55 1.18 July 135.77 138.71 143.24 2.17 3.27 August 135.47 138.62 131.62 2.33 (5.05) September 134.36 135.41 126.47 0.78 (6.60) October 134.47 134.73 141.19 0.19 4.79 November 133.52 135.85 144.53 1.75 6.39 December 135.20 135.04 150.80 (0.12) 11.67
CHICKEN SITUATION REPORT
25
21
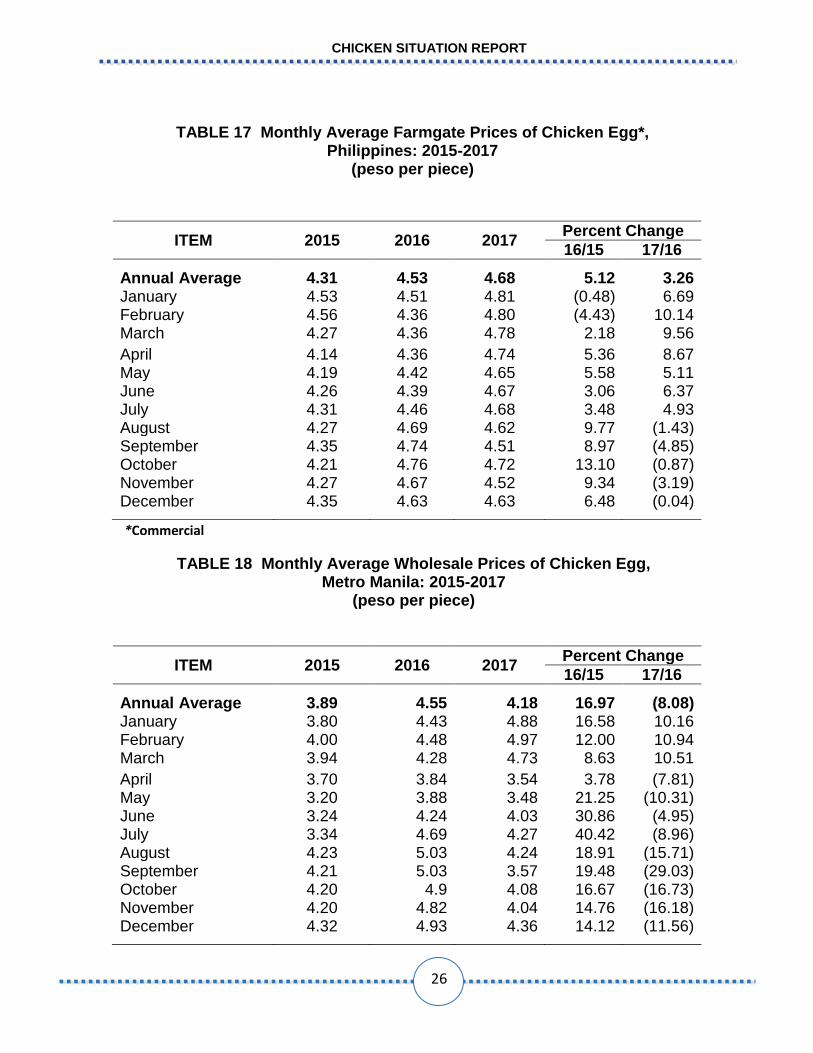
TABLE 17 Monthly Average Farmgate Prices of Chicken Egg*, Philippines: 2015-2017
(peso per piece)
BROILER MEAT PRICES
Table 8. Monthly Average Prices of Broiler Meat by Price Type, Philippines and Metro Manila, January – December 2014-2016
(peso per kilogram)
TABLE 18 Monthly Average Wholesale Prices of Chicken Egg, Metro Manila: 2015-2017
(peso per piece)
BROILER MEAT PRICES
Table 8. Monthly Average Prices of Broiler Meat by Price Type, Philippines and Metro Manila, January – December 2014-2016
(peso per kilogram)
*Commercial
ITEM 2015 2016 2017 Percent Change
16/15 17/16
Annual Average 4.31 4.53 4.68 5.12 3.26 January 4.53 4.51 4.81 (0.48) 6.69 February 4.56 4.36 4.80 (4.43) 10.14 March 4.27 4.36 4.78 2.18 9.56
April 4.14 4.36 4.74 5.36 8.67 May 4.19 4.42 4.65 5.58 5.11 June 4.26 4.39 4.67 3.06 6.37 July 4.31 4.46 4.68 3.48 4.93 August 4.27 4.69 4.62 9.77 (1.43) September 4.35 4.74 4.51 8.97 (4.85) October 4.21 4.76 4.72 13.10 (0.87) November 4.27 4.67 4.52 9.34 (3.19) December 4.35 4.63 4.63 6.48 (0.04)
ITEM 2015 2016 2017 Percent Change
16/15 17/16
Annual Average 3.89 4.55 4.18 16.97 (8.08) January 3.80 4.43 4.88 16.58 10.16 February 4.00 4.48 4.97 12.00 10.94 March 3.94 4.28 4.73 8.63 10.51
April 3.70 3.84 3.54 3.78 (7.81) May 3.20 3.88 3.48 21.25 (10.31) June 3.24 4.24 4.03 30.86 (4.95) July 3.34 4.69 4.27 40.42 (8.96) August 4.23 5.03 4.24 18.91 (15.71) September 4.21 5.03 3.57 19.48 (29.03) October 4.20 4.9 4.08 16.67 (16.73) November 4.20 4.82 4.04 14.76 (16.18) December 4.32 4.93 4.36 14.12 (11.56)
26
21
CHICKEN SITUATION REPORT

Source: Price Statistics Division, PSA
Source: PSA- Price Statistics Division
TABLE 19 Monthly Average Retail Prices of Chicken Egg, Metro Manila: 2015-2017
(peso per piece)
BROILER MEAT PRICES
Table 8. Monthly Average Prices of Broiler Meat by Price Type, Philippines and Metro Manila, January – December 2014-2016
(peso per kilogram)
ITEM 2015 2016 2017 Percent Change
16/15 17/16
Annual Average 5.23 5.10 5.34 2.11 0.19 January 5.44 5.25 5.58 (3.49) 6.29 February 5.32 5.12 5.59 (3.76) 9.18 March 5.18 5.11 5.58 (1.35) 9.20
April 5.16 5.02 5.38 (2.71) 7.17 May 5.15 5.02 5.27 (2.52) 4.98 June 5.13 5.07 5.32 (1.17) 4.93 July 5.15 5.08 5.31 (1.36) 4.53 August 5.22 5.48 5.32 4.98 (2.92) September 5.19 5.75 5.11 10.79 (11.13) October 5.24 5.68 5.16 8.40 (9.15) November 5.22 5.63 5.19 7.85 (7.82) December 5.26 5.59 5.27 6.27 (5.72)
27
21
CHICKEN SITUATION REPORT

TABLE 20 Number of Chicken Dressed in Poultry Dressing Plants by Quarter and Region: 2016-2017
(in birds)
CHICKEN DRESSED IN POULTRY DRESSING PLANTS BY REGION
Table 11. Number of Chicken Dressed in Poultry Dressing Plants, by Quarter, by Region, Philippines 2015-2016
(in birds)
Region 2016
Q1 Q2 SEM1 Q3 Q4 SEM2 ANNUAL
PHILIPPINES 137,951,709 133,299,039 271,250,748 148,028,232 148,886,320 296,914,552 568,165,300
CAR 14,174 15,024 29,198 12,758 13,971 26,729 55,927
Ilocos Region 6,706,752 6,799,443 13,506,195 8,079,627 7,545,964 15,625,591 29,131,786
Cagayan Valley 5,227,995 5,492,979 10,720,974 5,795,047 5,161,254 10,956,301 21,677,275
Central Luzon 38,533,956 35,723,474 74,257,430 40,639,459 37,636,494 78,275,953 152,533,383
CALABARZON 19,781,971 19,636,854 39,418,825 25,023,165 24,325,412 49,348,577 88,767,402
MIMAROPA 265,112 313,879 578,991 241,357 296,565 537,922 1,116,913
Bicol Region 7,360,765 7,750,490 15,111,255 8,737,013 8,457,541 17,194,554 32,305,809
Western Visayas1/ 5,588,545 5,406,353 10,994,898 5,958,068 6,529,259 12,487,327 23,482,225
Central Visayas2/ 12,544,688 10,144,211 22,688,899 10,970,732 12,408,563 23,379,295 46,068,194
Eastern Visayas 5,280,565 3,597,682 8,878,247 4,839,386 5,826,740 10,666,126 19,544,373
Zamboanga Peninsula 2,714,675 3,268,045 5,982,720 3,278,790 3,105,988 6,384,778 12,367,498
Northern Mindanao 15,428,437 15,495,679 30,924,116 14,808,843 16,189,913 30,998,756 61,922,872
Davao Region 8,635,561 8,091,268 16,726,829 8,191,958 9,325,842 17,517,800 34,244,629
SOCCSKSARGEN 4,942,467 6,361,231 11,303,698 6,190,494 6,732,022 12,922,516 24,226,214
Caraga 1,168,343 1,337,211 2,505,554 1,260,309 1,567,566 2,827,875 5,333,429
ARMM 65,445 64,400 129,845 7,630 7,950 15,580 145,425
Region 2017
Q1 Q2 SEM1 Q3 Q4 SEM2 ANNUAL
PHILIPPINES 143,705,638
163,029,348
306,734,986
163,757,795
160,427,638
324,185,433
630,920,419
CAR 13,603 15,995 29,598 10,530 13,859 24,389 53,987
Ilocos Region 6,950,118 8,738,179 15,688,297 7,753,576 7,434,352 15,187,928 30,876,225
Cagayan Valley 5,168,551 5,647,962 10,816,513 5,827,750 5,203,024 11,030,774 21,847,287
Central Luzon 39,603,187 49,122,071 88,725,258 50,584,494 46,184,998 96,769,492 185,494,750
CALABARZON 22,251,774 25,545,751 47,797,525 27,385,801 24,668,184 52,053,985 99,851,510
MIMAROPA 277,867 254,979 532,846 245,466 330,225 575,691 1,108,537
Bicol Region 6,400,217 8,316,552 14,716,769 7,903,976 7,647,954 15,551,930 30,268,699
Western Visayas1/ 9,402,734 9,742,208 19,144,942 9,016,297 12,110,842 21,127,139 40,272,081
Central Visayas2/ 12,540,552 12,417,427 24,957,979 13,691,815 13,592,755 27,284,570 52,242,549
Eastern Visayas 6,316,767 6,967,830 13,284,597 6,912,418 8,296,637 15,209,055 28,493,652
Zamboanga Peninsula 3,186,030 3,300,722 6,486,752 3,624,426 3,525,679 7,150,105 13,636,857
Northern Mindanao 15,855,099 16,475,642 32,330,741 14,908,729 15,682,733 30,591,462 62,922,203
Davao Region 8,288,818 8,934,805 17,223,623 8,876,073 7,392,149 16,268,222 33,491,845
SOCCSKSARGEN 5,916,275 6,060,250 11,976,525 5,508,241 6,859,484 12,367,725 24,344,250
Caraga 1,466,546 1,426,475 2,893,021 1,508,203 1,477,013 2,985,216 5,878,237
ARMM 67,500 62,500 130,000 - 7,750 7,750 137,750
28
21
CHICKEN SITUATION REPORT

FIGURE 14 Thematic Map of Total Chicken Inventory: as of January 1, 2017
CHICKEN DRESSED IN POULTRY DRESSING PLANTS BY REGION
Table 11. Number of Chicken Dressed in Poultry Dressing Plants, by Quarter, by Region, Philippines 2015-2016
(in birds)
29
21
CHICKEN SITUATION REPORT

FIGURE 15 Thematic Map of Native/Improved Chicken Inventory: as of January 1, 2017
CHICKEN DRESSED IN POULTRY DRESSING PLANTS BY REGION
Table 11. Number of Chicken Dressed in Poultry Dressing Plants, by Quarter, by Region, Philippines 2015-2016
(in birds)
30
CHICKEN SITUATION REPORT
30
21
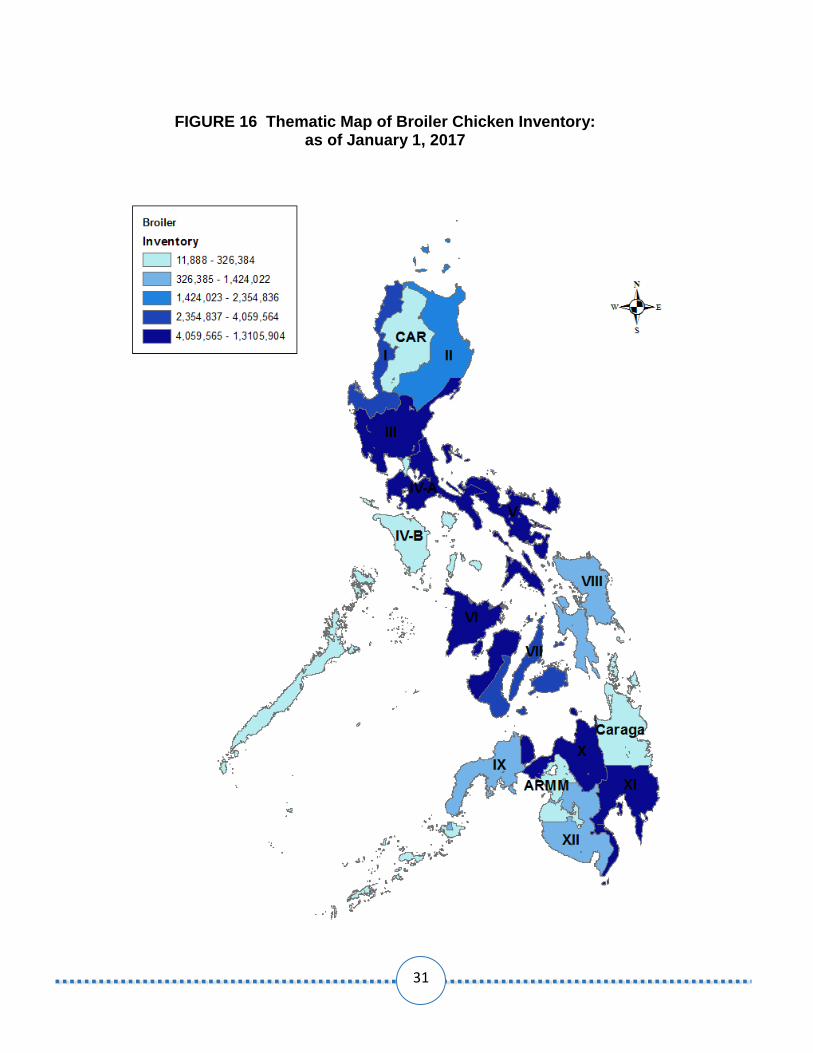
FIGURE 16 Thematic Map of Broiler Chicken Inventory: as of January 1, 2017
CHICKEN DRESSED IN POULTRY DRESSING PLANTS BY REGION
Table 11. Number of Chicken Dressed in Poultry Dressing Plants, by Quarter, by Region, Philippines 2015-2016
(in birds)
31
21

FIGURE 17 Thematic Map of Layer Chicken Inventory: as of January 1, 2017
CHICKEN DRESSED IN POULTRY DRESSING PLANTS BY REGION
Table 11. Number of Chicken Dressed in Poultry Dressing Plants, by Quarter, by Region, Philippines 2015-2016
(in birds)
32
21
CHICKEN SITUATION REPORT

FIGURE 18 Thematic Map of Chicken Production: January – December 2017
CHICKEN DRESSED IN POULTRY DRESSING PLANTS BY REGION
Table 11. Number of Chicken Dressed in Poultry Dressing Plants, by Quarter, by Region, Philippines 2015-2016
(in birds)
33
21
CHICKEN SITUATION REPORT
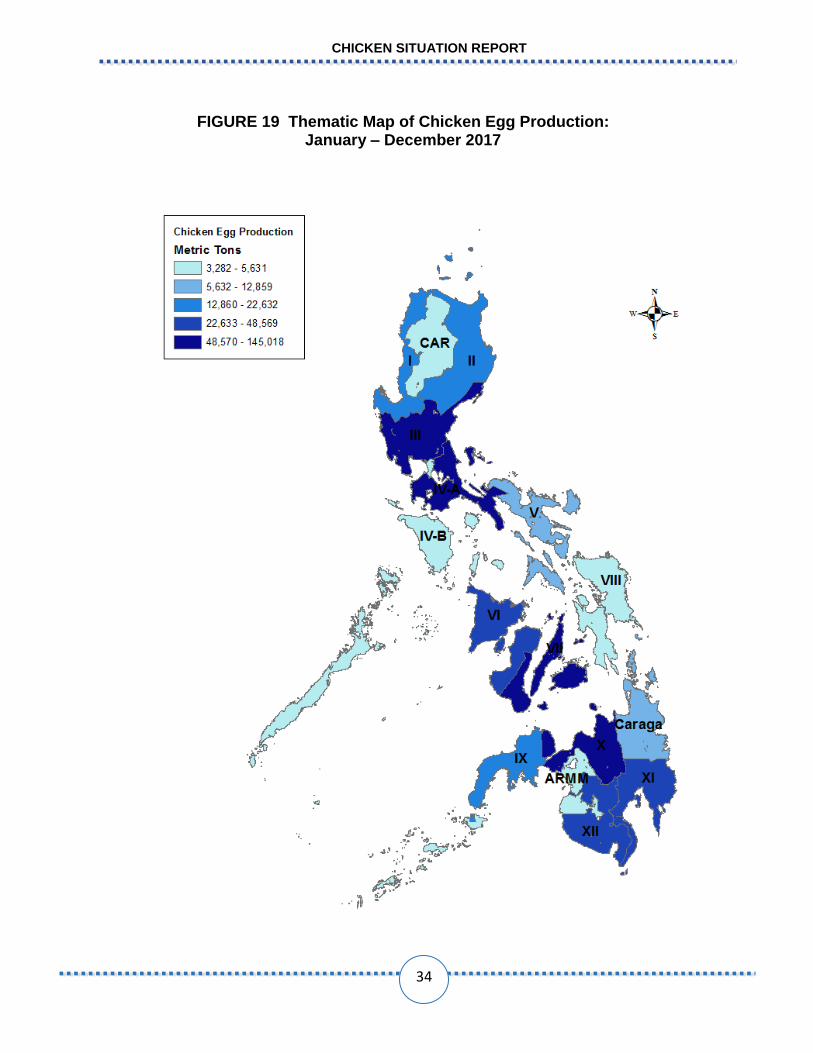
FIGURE 19 Thematic Map of Chicken Egg Production: January – December 2017
CHICKEN DRESSED IN POULTRY DRESSING PLANTS BY REGION
Table 11. Number of Chicken Dressed in Poultry Dressing Plants, by Quarter, by Region, Philippines 2015-2016
(in birds)
34
21
CHICKEN SITUATION REPORT

Photos: Broiler Chicken. Retrieved on May 9, 2016 from http://www.zamzammeats.com/product-category/chicken/?orderby=date. http://www.choosecagefree.org/sites/default/files/pdfs/hens3.jpg
Native Chicken with Chicks. Retrieved on May 9, 2016 from https://lolitationgson.wordpress.com /2010/01/15/integrity-report-3/
Broiler. Retrieved on May 9, 2016 from http://www.asiafarming.com/poultry-farming-information-guide/ Native Chicken. Retrieved on March 13, 2017 from http://fortune.com/2016/06/08/bill-gates-chicken-
farmer/Layer Farm. Retrieved on March 13, 2017 from http://agrifarming.in/poultry-layer-farming. Chicken eggs. Retrieved on March 13, 2017 from http://www.the-chicken-chick.com/2012/12/ Layer Farm 2. Retrieved on March 15, 2017 from http://www.filipinopoultry.com/Layer Farming in the
Philippines
PHILIPPINE STATISTICS AUTHORITY PSA CVEA Building, East Avenue,
Diliman, Quezon City www.psa.gov.ph; openstat.psa.gov.ph
email: [email protected] /PhilippineStatisticsAuthority /PSAgovph