farmgate milk price statement...farmgate milk price for the 2016 season this section sets out the...
TRANSCRIPT

FARMGATE MILK PRICE STATEMENT
FONTERRA FARMGATE MILK PRICE STATEMENT 2016FOR THE SEASON ENDED 31 MAY 2016

INTRODUCTION 1
FARMGATE MILK PRICE FOR THE 2016 SEASON 2
FARMGATE MILK PRICE REVENUE AND COSTS 3MILK SUPPLY, PRODUCTION AND SALES VOLUMES 4PRICES 5LACTOSE 6FARMGATE MILK PRICE CASH COSTS 6FARMGATE MILK PRICE CAPITAL COSTS 7CALCULATION OF BENCHMARK WEIGHTED AVERAGE COST OF CAPITAL (WACC) 8
FARMGATE MILK PRICE MANUAL CHANGES 9
CHANGES IN APPROACH TO THE CALCULATION 10
CUMULATIVE IMPACT OF CHANGES IN METHODOLOGY BETWEEN 2009 AND 2016 SEASONS 11APPROACH 11CHANGES IMPACTING ON NET REVENUE 11CHANGES IMPACTING ON CASH COSTS 12CHANGES IMPACTING ON CAPITAL COSTS 12
APPENDIX 1 13FARMGATE MILK PRICE OVERVIEW
APPENDIX 2 15PWC INDEPENDENT ASSURANCE REPORT
ATTACHMENT 1 17MILK SUPPLIED AND PRODUCTION VOLUMES
ATTACHMENT 2 18SALES VOLUMES
ATTACHMENT 3 19AVERAGE NUMBER OF MONTHS PRIOR TO SHIPMENT THAT PRICES WERE STRUCK
ATTACHMENT 4 21AVERAGE USD PRICES
ATTACHMENT 5 22AVERAGE USD:NZD CONVERSION AND SPOT RATES
GLOSSARY
INTRODUCTION
The primary purpose of this Statement is to help Fonterra farmer shareholders, unit holders in the Fonterra Shareholders’ Fund, and other interested parties better understand the Farmgate Milk Price.
This Farmgate Milk Price Statement sets out information about the Farmgate Milk Price and outlines the way that Fonterra Co-operative Group Limited (Fonterra) has calculated the Farmgate Milk Price for the milk season that ended on 31 May 2016 (2016 Season).
The appendices provide an overview of the Farmgate Milk Price and a report by Fonterra’s external auditors that confirms that the Farmgate Milk Price for the 2016 Season has been derived in accordance with the Principles, Methodologies and Detailed Rules in Fonterra’s Farmgate Milk Price Manual, dated 1 August 2015. Five attachments provide further detail for the past three seasons on the most significant factors that affect the Farmgate Milk Price. A glossary of the terms used completes the report1.
Fonterra has also released as an adjunct to this Statement an unaudited Microsoft Excel-based financial model that shows how the information set out in the Statement has been used to calculate the Farmgate Milk Price for the 2016 Season.
Numbers in this Statement have been rounded and, as a result, some tables may not exactly total or sum to 100 per cent2. The information on the Farmgate Milk Price presented in this Statement is based on data used within the Milk Price Model, not Fonterra’s actual data.
A Farmgate Milk Price Statement is made available each year with Fonterra’s annual results on www.fonterra.com.
1 Capitalised terms in this Statement are defined in the glossary.
2 Percentage changes shown in tables in this Statement have been calculated by reference to the underlying data, and may differ from percentage movements between the rounded data presented in the tables.
FONTERRA FARMGATE MILK PRICE STATEMENT 2016 1
FONTERRA FARMGATE MILK PRICE INTRODUCTION

FARMGATE MILK PRICEFOR THE 2016 SEASON
This section sets out the Farmgate Milk Price for the 2016 Season. It also describes the way the Farmgate Milk Price relates to Fonterra’s financial year ended 31 July 2016.The Manual sets out the methodology for determining the base amount to be paid by Fonterra for milk supplied to Fonterra in New Zealand in a season. Fonterra’s Milk Price Panel advises the Fonterra Board on matters concerning the Manual, including the calculation of the Farmgate Milk Price.
The Farmgate Milk Price is the total amount calculated under the Manual, and is NZD$6.101 billion for the 2016 Season. For convenience, the Manual also defines the ‘Farmgate Milk Price per kgMS’ as this total amount divided by Fonterra’s total New Zealand milk supply (1.566 billion kilograms of milk solids (kgMS)), or NZD$3.90 per kgMS.
The Farmgate Milk Price of NZD$6.101 billion is used for payments for New Zealand milk supplied in the 2016 season.
It includes payments for milk supplied by farmer shareholders, milk supplied on contract, and a portion of the premiums paid for Winter Milk.
The cost of New Zealand-sourced milk, as disclosed in Fonterra’s most recent financial statements, is NZD$6.205 billion. The NZD$104 million difference between this amount and the Farmgate Milk Price of NZD$6.101 billion primarily reflects the following three factors: first, the financial statements report the cost of milk acquired during the financial year comprising the 12-month period ending 31 July 2016. In contrast, the Farmgate Milk Price for the season is the cost of milk supplied in respect of the 12-month period ending 31 May 2016. Secondly, Approved Adjustments, such as some payments for Winter Milk, and premiums for Specialty Milk, are not funded from the Farmgate Milk Price3. Thirdly, differences between payments under the Guaranteed Milk Price scheme and the amount that would have been paid at the Farmgate Milk Price per kgMS are not funded from the Farmgate Milk Price.
FARMGATE MILK PRICE
$3.90/kgMS
3 A commodity manufacturer of milk powders is unlikely to pay premiums for Specialty Milk (such as organic milk) or to pay the level of premiums for Winter Milk that an integrated processor such as Fonterra would pay. Premiums for Specialty Milks and a portion of the premiums paid for Winter Milk are therefore not funded from the Farmgate Milk Price calculated under the Manual and are paid in addition to this amount. For the 2016 season, these Approved Adjustments amounted to NZD$23 million, compared to Winter Milk premiums of NZD$18 million which were funded from the Farmgate Milk Price of NZD$6.101 billion, reducing the average amount paid for milk supplied on standard terms by 1.1 cents per kgMS.
2 FONTERRA FARMGATE MILK PRICE STATEMENT 2016
FONTERRA FARMGATE MILK PRICE FOR THE 2016 SEASON

FARMGATE MILK PRICEREVENUE AND COSTS
The most significant factor that affects the Farmgate Milk Price from season to season is revenue.
Table 1 below summarises the Farmgate Milk Price for the milk supplied in the 2014, 2015 and 2016 Seasons. Both Table 1 and Figure 1 below show that changes in the Farmgate Milk Price over the past three seasons have been driven mainly by changes in commodity prices converted into NZD.
The first three subsections below describe the key factors that influence revenue.
Key determinants of the movements in average costs between the 2015 and the 2016 Seasons are explained in later subsections.
TABLE 1: FARMGATE MILK PRICE SUMMARY
SEASON2016
NZD $m2016
$/kgMS2015
NZD $m2015
$/kgMS2014
NZD $m2014
$/kgMS
2016/2015 % CHANGE
($/kgMS)
2015/2014 %CHANGE
($/kgMS)
Farmgate Milk Price Revenue 9,134 5.83 10,540 6.53 17,495 11.04 –10.7% –40.9%
Lactose (302) (0.19) (603) (0.37) (662) (0.42) –48.4% –10.6%
Net Revenue 8,832 5.64 9,937 6.16 16,834 10.62 –8.4% –42.1%
Farmgate Milk Price Cash Costs (1,815) (1.16) (1,889) (1.17) (1,819) (1.15) –1.0% 1.9%
Farmgate Milk Price Capital Costs4 (915) (0.58) (952) (0.59) (863) (0.54) –0.9% 8.3%
Total Costs (2,731) (1.74) (2,841) (1.76) (2,682) (1.69) –1.0% 4.0%
Farmgate Milk Price 6,101 3.90 7,096 4.40 14,151 8.93 –11.4% –50.8%
Million kgMS 1,566 1,614 1,584 –3.0% 1.9%
4 Includes depreciation, tax and capital charge.
FIGURE 1: CHANGES IN THE FARMGATE MILK PRICE: SEASONS 2014–2016
0.00
2.00
4.00
6.00
8.00
10.00
Adjusted Farmgate Milk Price
Milk Price adjustment
Farmgate Milk Price
Milk Price Capital Costs
Milk Price Cash Costs
Net Revenue
2015 Season 2014 Season
NZD $/kgMS
2016 Season
6.16 1.17
0.59
0.53
5.64 1.16
0.58
8.40
3.90
10.62 1.15
0.548.93
4.40
The Farmgate Milk Price Adjustment of 53 cents per kgMS in the 2014 Season to the Farmgate Milk Price calculated under the Manual was made in response to an unprecedented divergence in returns to the milk powder-based products included in the Farmgate Milk Price and other commodity products manufactured by Fonterra. With no adjustment, Fonterra would have incurred a loss, which could have put the Co-operative at risk of a loss of confidence of its stakeholders. Further explanation of the Farmgate Milk Price Adjustment is provided in the Farmgate Milk Price Statement for 2014.
FONTERRA FARMGATE MILK PRICE STATEMENT 2016 3
FONTERRA FARMGATE MILK PRICE REVENUE AND COSTS

MILK SUPPLY, PRODUCTION AND SALES VOLUMESFarmgate Milk Price Revenue varies according to the milk supplied during the season, product mix, sales volumes and prices in NZD. Farmgate Milk Price Revenue is the most significant driver of the Farmgate Milk Price.
Figure 2 shows the relationship between when milk is collected during a season (the blue line), the volume of products manufactured from that milk (the dark grey line) and when that product is shipped (the green line). The key points to note are as follows:
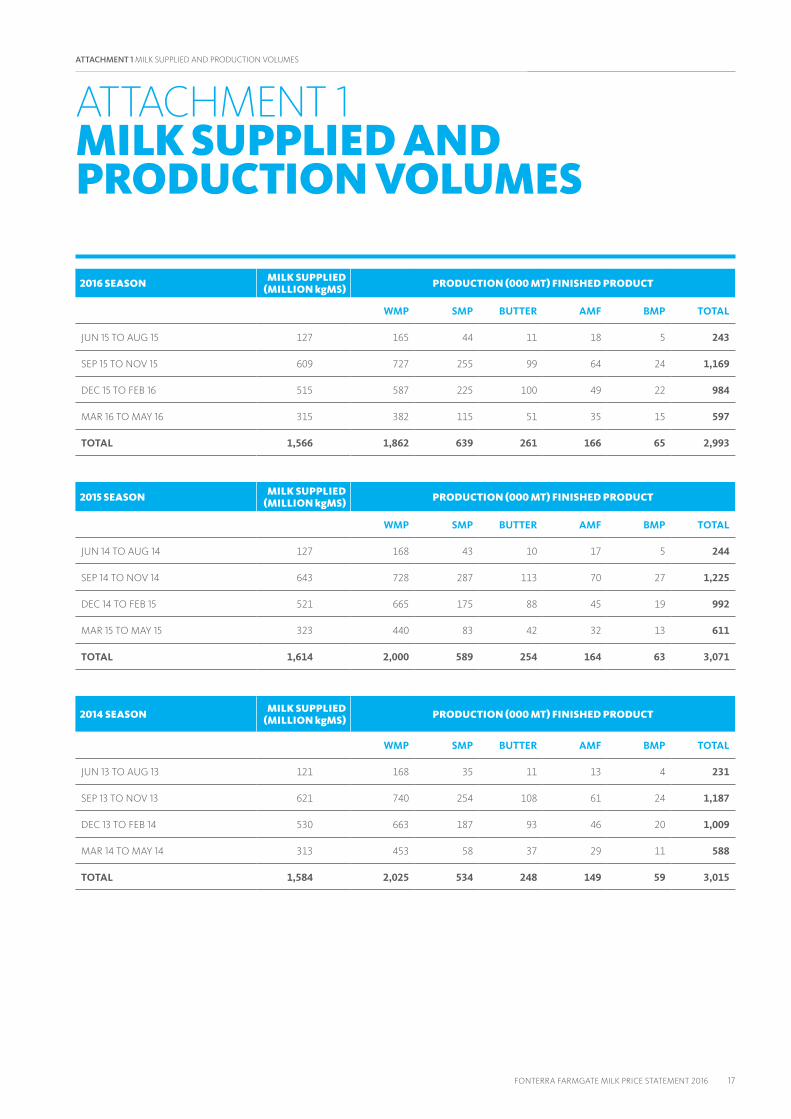
• Milk supplied during the 2016 Season comprised 1.566 billion kgMS. Attachment 1 provides information on milk supplied every quarter for each of the past three seasons.
• This amount of milk is assumed to be converted into Reference Commodity Products. The mix between the various products that goes into the Farmgate Milk Price is aligned to Fonterra’s actual mix between Whole Milk Powder (WMP) and Skim Milk Powder (SMP), and between butter and Anhydrous Milk Fat (AMF) (production of Buttermilk Powder (BMP) is a residual amount). Attachment 1 provides Farmgate Milk Price production by quarter for each Reference Commodity Product for the past three seasons.
• Sales volumes reflect the pattern of Fonterra’s actual shipments of Reference Commodity Products manufactured from milk supplied during the season. Figure 2 shows the lag between production and shipment as well as the fact that minimal milk is supplied in June and July. These factors mean that shipments of products manufactured from milk collected in a season (beginning 1 June) do not normally commence until August at the earliest. Shipments are normally complete by the end of October in the
following year, again as illustrated in Figure 3. Attachment 2 sets out sales volumes by quarter for each of the past three seasons.
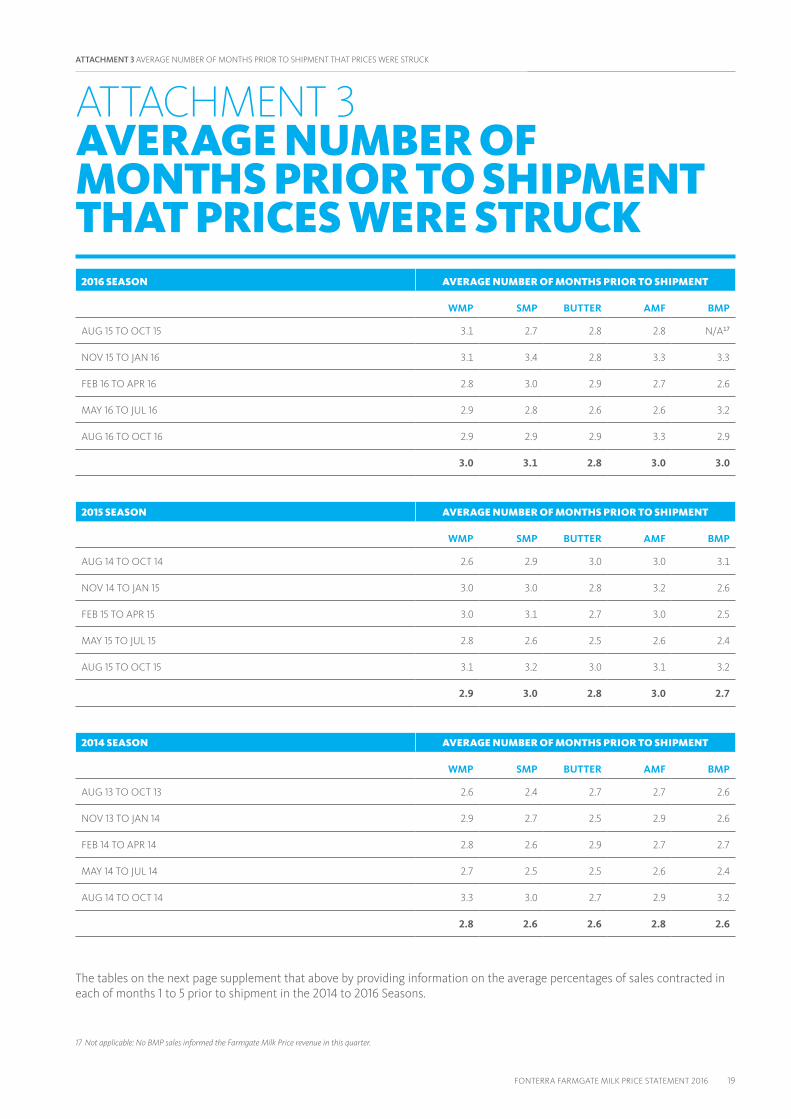
Revenues are recognised when sales are invoiced, at the time of shipment. Sales prices included in the Farmgate Milk Price are always set prior to the month of shipment, primarily via GDT events. Figure 3 shows the average lag between when prices are struck and when product is shipped.
This matches Fonterra’s actual average lag for product that is sold on terms that are typical for the sale of commodity products from New Zealand. To ensure that this is the case, contracts with more than five months between when a price is set and shipment occurs are not taken into account in determining shipment prices5.
Attachment 3 sets out the average number of months prior to shipment that prices were struck for each quarter
0
50
100
150
200
250
300
350
400
450
NOV-16OCT-16SEP-16AUG-16JUL-16JUN-16MAY-16APR-16MAR-16FEB-16JAN-16DEC-15NOV-15OCT-15SEP-15AUG-15JUL-15JUN-15
Sales Volume (MT)Production Volume (MT)Milk Supply (000’s kgMS)
JUN
15
JUL
15
AU
G 15
SEP
15
OC
T 15
NO
V 15
DEC
15
JAN
16
FEB
16
MA
R 16
APR
16
MAY
16
JUN
16
JUL
16
AU
G 16
SEP
16
OC
T 16
NO
V 16
(’000s)
FIGURE 3: LAG BETWEEN WHEN PRICES WERE STRUCK AND SHIPMENT
Cumulative Shipment VolumeCumulative Contracted Sales Volume
METRIC TONNES ‘000S
JUN
15
JUL
15
AU
G 15
SEP
15
OC
T 15
NO
V 15
DEC
15
JAN
16
FEB
16
MA
R 16
APR
16
MAY
16
JUN
16
JUL
16
AU
G 16
SEP
16
OC
T 16
NO
V 16
0
500
1,000
1,500
2,000
2,500
3,000
3,500
NOV-16OCT-16SEP-16AUG-16JUL-16JUN-16MAY-16APR-16MAR-16FEB-16JAN-16DEC-15NOV-15OCT-15SEP-15AUG-15JUL-15JUN-15
FIGURE 2: TIMING OF SUPPLY, PRODUCTION AND SALES VOLUMES
FARMGATE MILK PRICEREVENUE AND COSTSCONTINUED
5 For the 2016 Season, approximately 7 per cent of sales of Reference Commodity Product were sold under contracts with more than 5 months between the price being set and shipment occurring.
4 FONTERRA FARMGATE MILK PRICE STATEMENT 2016
FONTERRA FARMGATE MILK PRICE REVENUE AND COSTS

over the past three seasons. Attachment 3 also sets out the average percentage of sales contracted in each month prior to shipment in the past three seasons.
PRICESSince the 2012 Season, GDT has been the sole source of prices for WMP, SMP and AMF, and is a primary reference point for BMP and butter. Non-GDT contracts Fonterra enters into are also used to establish prices for butter and BMP.
Detailed rules in the Manual dictate which contracts can be taken into account. Contracts that are excluded, for example, include sales to Fonterra subsidiaries.
Attachment 1 highlights that WMP, SMP and AMF (2,667,000 MT) accounted for 89 per cent of the Farmgate Milk Price production of Reference Commodity Products (2,993,000 MT) in the 2016 Season.
The average shipment prices incorporate provisions for the lower prices received for ‘downgrade product’. These are products that do not meet manufacturing specifications, some of which may only be suitable for use as stock feed.
Table 2 above shows the weighted average USD contract prices of Reference Commodity Products for the past three seasons. It shows that prices for the Reference Commodity Products
decreased on average by 20.1 per cent between the 2015 Season and the 2016 Season, compared to a decrease of 42.4 per cent between the 2014 Season and the 2015 Season. Average USD prices per MT for each Reference Commodity Product by quarter for the past three seasons are set out in Attachment 4.
The Manual provides for the conversion of notional USD Farmgate Milk Price receipts to NZD for each month at the average rate at which Fonterra actually converts its USD-equivalent foreign currency receipts for the month, taking into account the costs and benefits of Fonterra’s hedging activities. Fonterra’s policy is to hedge 100 per cent of net recognised foreign currency trade receivables and payables. It also requires hedging of forecast cash receipts from sales for a period of up to 18 months within limits approved by Fonterra’s Board. Fonterra uses both forward foreign exchange contracts and currency options to hedge its foreign exchange risk.
Fonterra’s hedging policy is designed to provide certainty and to reduce the impact on the Farmgate Milk Price of volatility in the NZD, and results in the spot exchange rate at a particular point in time being reflected in the hedged conversion rate over the subsequent 18 months.
Table 3 shows that Fonterra’s hedging policy resulted in an average foreign exchange conversion rate for the 2016 Season of USD:NZD 0.7082 against an average spot rate of USD:NZD 0.6798. In contrast to the 2015 and 2016 Seasons, where Fonterra’s hedging activities resulted in an average decrease in the Farmgate Milk Price of 38 cents relative to translation at the spot exchange rate, Fonterra’s hedging activities in each season between 2011 and 2014 resulted in an average increase of 46 cents per kgMS. Attachment 5 on page 22 shows the average foreign exchange conversion rate (USD:NZD) for the Farmgate Milk Price Revenue for each quarter in the 2016 Season, based on Fonterra’s actual hedging contracts in place, compared to the weighted average spot rate that prevailed in the quarter. Attachment 5 also provides equivalent information by quarter for the 2014 and 2015 Seasons.
As at 31 July 2016, Fonterra had foreign exchange contracts in place in respect of approximately 70 per cent of the USD equivalent operating cash flow exposure expected to impact on the Farmgate Milk Price for the 2017 Season. If the balance was hedged based on a spot exchange rate of 0.70696, the average USD:NZD conversion rate would be 68 cents7.
2016 SEASON AVERAGE PRICES WERE LOWER THAN 2015 SEASON BY
20.1%
TABLE 2: WEIGHTED AVERAGE USD PRICE 2014 – 2016 SEASONS
WEIGHTED AVERAGE PRICE (USD) PER MT 2016 2015 20142016/2015
% CHANGE2015/2014
%CHANGE
WMP 2,111 2,639 4,824 –20.0% –45.3%
SMP 1,803 2,552 4,504 –29.4% –43.4%
Butter 2,830 3,027 3,920 –6.5% –22.8%
AMF 3,227 3,577 4,853 –9.8% –26.3%
BMP 1,723 2,657 4,752 –35.2% –44.1%
–20.1% –42.4%
6 The spot exchange rate at 9am on 29 July 2016, the last working day of Fonterra’s 2016 financial year.7 Fonterra uses currency options as well as forward exchange contracts to hedge its foreign currency receipts. Use of options means the average hedged conversion rate may vary with the spot exchange rate.
FONTERRA FARMGATE MILK PRICE STATEMENT 2016 5

LACTOSELactose is used as an ingredient in the manufacture of WMP, SMP and BMP to achieve a standard protein composition aligned to internationally recognised specifications. Most of the lactose content of milk powders is obtained from the milk supplied to Fonterra. However, a portion is purchased at international prices. Because the cost of purchased lactose depends on global prices and the exchange rate, it is presented in Table 1 and Figure 1 as a deduction from Farmgate Milk Price Revenue.
Table 4 provides the basis for the cost of purchased lactose in the 2016, 2015 and 2014 Seasons.
FARMGATE MILK PRICE CASH COSTSFarmgate Milk Price Cash Costs reflect:
• Fonterra’s actual supply chain and collection costs.
• Costs associated with modern plants with sufficient capacity to process all milk collected by Fonterra, located on more than 20 reference manufacturing sites (some of which contain multiple plants) with associated overhead costs. The costs of operating these plants are based on daily processing capacities that match Fonterra’s averages, and on operating parameters that reflect manufacturers’ specifications and Fonterra’s per-unit costs.
• Overhead and selling costs that are typical of a commodity-only business that sells product from New Zealand. Overhead costs are calculated by reference to Fonterra’s actual costs, but exclude costs that are attributable to the much broader scope of Fonterra’s business. Selling costs primarily reflect the cost of selling products through GDT with an offshore supporting network.
Table 5 and Figure 4 on page 7 summarise the major categories of cash costs and the sources of movements in each category between the 2015 and 2016 Seasons8.
The movements in costs are inclusive of the following:
• Milk supply decreased by 3 per cent in the 2016 Season compared to the 2015 Season. By itself, this resulted in fixed costs being spread across lower supply, increasing cash costs per kgMS by 2.4 cents. The reduction in milk supply resulted, however, in an overall decrease in variable cash costs of NZD$18 million.
• Costs increased by an average of 0.4 per cent, or 0.4 cents per kgMS, due to price movements.
• The NZD$71 million reduction in costs related to structual changes reflects:
– The F16 Overhead Reset, which resulted in a decrease in costs of approximately NZD$50 million, or 3.2 cents per kgMS. Included savings arising out of the Velocity9 transformation programme that could reasonably be expected to also be realised by the Farmgate Milk Price business
– A further NZD$21 million, or 1.3 cents per kgMS, attributable to the review of costs relating to repairs and maintenance, and to various categories of operating costs.
• The allowance for one-off costs of NZD$9 million, or 0.5 cents per kgMS, was in respect of an adjustment for a bad debt related to the sale of RCPs on GDT.
FARMGATE MILK PRICEREVENUE AND COSTSCONTINUED
8 Figure 4 shows total costs of NZD$1.170 per kgMS in the 2015 Season. The corresponding figure in the Farmgate Milk Price Statement for the 2015 Season showed costs of NZD$1.172 per kgMS. The 0.2 cents per kgMS difference reflects a change in approach to rounding.
9 Fonterra’s Velocity business transformation is aimed at achieving a significant and lasting performance improvement through new ways of working across the Co-operative’s global network.
TABLE 3: EFFECT OF HEDGING POLICY ON THE FARMGATE MILK PRICE FOR THE 2014 – 2016 SEASONS
2016 2015 2014
SEASON MILK PRICE SPOT MILK PRICE SPOT MILK PRICE SPOT
Average Conversion Rate (USD:NZD)
0.7082 0.6798 0.7882 0.7312 0.8086 0.8396
Farmgate Milk Price (NZD/kgMS)
3.90 4.13 4.40 4.92 8.93 8.51
Effect of Hedging (NZD/kgMS) –0.23 –0.52 0.42
TABLE 4: PURCHASED LACTOSE AND PRICE
SEASON 2016 2015 20142016/2015
% CHANGE2015/2014
%CHANGE
Purchased Lactose (000 Metric Tonnes) 350 346 331 1.2% 4.6%
Average Price (USD) per MT 640 1,406 1,605 – 54.5% –12.4%
Total Lactose Purchases (USD $m) 224 486 531 – 53.9% –8.4%
6 FONTERRA FARMGATE MILK PRICE STATEMENT 2016
FONTERRA FARMGATE MILK PRICE REVENUE AND COSTS

FARMGATE MILK PRICE CAPITAL COSTSThe Milk Price Model uses ‘standard’ plants to calculate both operating and plant-related capital costs. These plants have capacities that approximate Fonterra’s average daily capacities for each type of plant and reflect current technology of the type typically employed across the industry10.
The standard plants are smaller than Fonterra’s newest large manufacturing plants, such as the ED4 drier installed at Fonterra’s Edendale manufacturing site in Southland in 2009 and the DD2 drier installed at Fonterra’s Darfield Site in Canterbury in 2013, but are larger and more efficient than Fonterra’s older smaller plants.
The basis for deriving the benchmark depreciation, tax costs and capital charge is set out in detail in the Manual. In broad terms:
• The capital charge on fixed assets is designed to recover the full cost (through a depreciation charge) of the manufacturing and other assets required to manufacture Reference Commodity Products over the assets’ economic lives, and to generate a return at the benchmark Weighted Average Cost of Capital (WACC, see below) on the undepreciated balance each year.
• The capital charge is calculated in a manner that results in its aggregate amount growing each year approximately in line with milk supply and capital goods inflation, as long as the WACC does not change. This means that changes in the average age of the asset base do not result in material year-on-year movements in the capital charge, and therefore in the Farmgate Milk Price.
• The Farmgate Milk Price cost base also includes a provision for a capital charge on the monthly net working capital balances implied by the sale and manufacture of the Reference
Commodity Products, and by the phasing of Fonterra’s payments for milk to its suppliers. Each of these items varies somewhat between years, resulting in some annual variation in this element of the capital charge.
• The WACC used to determine the capital charge is specified on an after tax basis, so the Farmgate Milk Price cost base includes a separate provision for corporate tax. This amount is a relatively constant proportion of the WACC charges on fixed assets and net working capital each year.
10 The average daily processing capacity of the standard WMP and SMP plants installed prior to the 2013 Season is approximately 1.9 million litres. Incremental and replacement WMP and SMP plants incorporated in the asset base since the 2013 Season have an average daily processing capacity of approximately 2.5 million litres, equivalent to the plants installed by Fonterra at Darfield in 2011 and Pahiatua in 2015.
TABLE 5: SUMMARY OF MOVEMENTS IN CASH COSTS
NZD $ MILLION F15VOLUME
IMPACTCOST / PRICE MOVEMENTS
STRUCTURAL CHANGES ONE OFF F16
% CHANGE DUE TO COST
TOTAL % CHANGE
Sales Costs 126 (1) 10 (26) – 108 7.8% –13.9%
Variable manufacturing and supply chain costs
732 (17) (10) (17) – 687 –1.4% –6.1%
Fixed manufacturing (including repairs and maintenance)/site overheads and supply chain costs
404 4 13 (1) – 420 3.3% 4.1%
Collection costs 367 (5) (10) (4) – 349 –2.8% –5.0%
Other costs 261 – 4 (21) 9 252 1.5% –3.5%
Total Cash Costs 1,889 (18) 7 (71) 9 1,815 0.4% –3.9%
% movements –1.0% 0.4% –3.7% 0.5%
FIGURE 4: SOURCES OF MOVEMENTS IN AVERAGE CASH COSTS
0.70
0.75
0.80
0.85
0.90
0.95
1.00
1.05
1.10
1.15
1.20
F16One O�StructuralChanges
Cost/PriceMovements
F15Adjusted
VolumeImpact
F15
NZD $/kgMS
1.1701.194
1.1590.024
0.004 0.0050.045
FONTERRA FARMGATE MILK PRICE STATEMENT 2016 7

Table 6 shows the capital costs and the total book value of the Farmgate Milk Price fixed asset base and monthly average net working capital for the 2016, 2015 and 2014 Seasons.
Two matters are relevant to a comparison of capital costs between the 2016 and 2015 Seasons:
• In the 2016 Season, the WACC was 5.9 per cent, down from 6.1 per cent in 2015. By itself, this change resulted in a reduction of NZD$14 million in the capital charge on fixed assets, a reduction of NZD$3 million in the charge on net working capital, and a reduction of NZD$7 million in the tax charge, partially offset by an increase in depreciation expense of NZD$4 million. The fixed asset related reductions were more than offset by an increase in capital costs due to the effects of the underlying methodology, which is designed to result in an aggregate capital charge that increases approximately in line with inflation and milk supply, holding other things equal.
• NZD$44 million of the reduction in the WACC charge on net working capital between 2015 and 2016 is due to the reduction in average net working capital, which is primarily attributable to the later timing, on average, of payments for milk in 2016 relative to 2015.
CALCULATION OF BENCHMARK WEIGHTED AVERAGE COST OF CAPITAL (WACC)The WACC used to determine the Fixed Asset Capital Charges and the Net Working Capital Charge is calculated using the ‘simplified Brennan Lally’ methodology employed by the Commerce Commission11. The methodology applied through to the 2011 season provided for input parameters into the WACC to be updated every four years. Consequently, the WACC was held constant at 8.5 per cent between the 2009 and 2011 seasons, and reflected market interest rates as of mid-2008. From the 2012 season, the methodology was revised to be based on rolling five-year averages of market interest rates, including the five-year New Zealand government stock rate, resulting in a reduction in the WACC from 7.7 per cent for the 2012 season to 6.8 per cent for the 2014 season.
In the 2015 Season, the WACC methodology was changed to incorporate a ‘specific risk premium’ of 0.15 per cent and a reduction in the asset beta from 0.45 to 0.38, on the basis of a review by an independent expert, Associate Professor Alastair Marsden of the University of Auckland. At the request of the Commerce Commission Dr Marsden undertook further analysis in the 2016 Season, the result of which was to confirm his previous recommendation. The 2016 Season WACC was 5.9 per cent and the 2017 season WACC will be 5.6 per cent, both reflecting further reductions in five-year average government stock rates.
FARMGATE MILK PRICEREVENUE AND COSTSCONTINUED
TABLE 6: CAPITAL COSTS, BOOK VALUE OF FIXED ASSET BASE AND AVERAGE NET WORKING CAPITAL
NZD $ MILLION 2016 2015 2014
WACC rate % (post-tax) 5.9% 6.1% 6.8%
Depreciation 266 263 250
WACC Charge – fixed assets 407 393 436
WACC Charge – net working capital 73 120 26
Tax 169 176 151
Total capital costs 915 952 863
Total fixed assets (book value) 6,961 6,505 6,437
Average Net Working Capital 1,308 2,335 887
11 See, for example, www.comcom.govt.nz/cost-of-capital/
8 FONTERRA FARMGATE MILK PRICE STATEMENT 2016
FONTERRA FARMGATE MILK PRICE REVENUE AND COSTS

FARMGATE MILK PRICEMANUAL CHANGES
Since the Manual was introduced in the 2009 Season, various minor refinements have been made as practical issues were identified and addressed. Such refinements are to be expected given the importance to Fonterra of ensuring the Farmgate Milk Price approach is robust.Any modification to the Manual is required to be consistent with the Milk Price Principles which are set out in both the Manual and Fonterra’s constitution.The Manual itself also allows for adjustments to various parameters. An example of this is the Detailed Rule that allows for the addition of new Reference Commodity Products if certain conditions established in the Manual are met12. The Manual also provides for reviews of various aspects of the Manual to be carried out at least once every four years. These reviews can result in changes to the application of rules in the Manual or inputs into the Farmgate Milk Price. A review of overhead costs was undertaken in the 2015 and 2016 Seasons and the results were incorporated into the 2016 Farmgate Milk Price.
As noted in Appendix 1, the Commerce Commission’s final report on the 2015/16 Manual was released on 15 December 2015.
The Board approved a number of amendments to the Manual in July 2016, which will take effect from the 2017 season. The updated version of the Manual is available on www.fonterra.com. The following four of these amendments could be considered substantive, with the amendment to the definition of Qualifying Reference Sales expected to have a material effect on the Farmgate Milk Price for the 2017 Season:
• An amendment to Section 2.6 of Part A, which extends the existing commitment to disclose the impact of, and rationale for, material changes to the Farmgate Milk Price methodology for a season.
• The Part B rule relating to repairs and maintenance (R&M) has been further amended in response to comments by the Commerce Commission. The amendments to the R&M rule provide that a provision for maintenance department costs, rather than a more general provision for “costs that are largely fixed in nature…”, will be calculated separately from other R&M costs. The amended rule is consistent with the approach that has been taken to calculating the provision for R&M costs in the 2016 Farmgate Milk Price, and which will be applied in 2017.
• The Part B rule relating to the capacity of standard plants has been further amended in response to the Commission’s comments in regards to the determination of capacity of secondary plants (Butter, AMF and BMP). The amended provision for 2017 provides that standard plants specified in a four-yearly ‘review assessment year’ for secondary Reference Commodity Product should have an average daily processing capacity that is consistent with the capacity of plants currently available from equipment suppliers, and, where these fall in a range, erring toward the average capacity of the plants currently included in the Farmgate Milk Price Fixed Asset Base.
• An amendment to the definition of Qualifying Reference Sales in Part C of the Manual. The practical implication of this change is to align the approach used to determine prices for WMP, SMP and AMF to the approach currently used for Butter and BMP, by including sales undertaken off the GDT platform of similar specification product and sold on similar terms to GDT sales. The primary reason for making this change is that it has become increasingly clear in recent years that GDT sets the ‘base’ price for sales of RCPs, with sales undertaken off GDT mostly being transacted at higher prices. This change is anticipated to result in an increase in the Farmgate Milk Price for the 2017 Season that is estimated to be approximately 4–5 cents per kgMS.
12 Rule 3 in Part B of the Manual.
FONTERRA FARMGATE MILK PRICE STATEMENT 2016 9
FONTERRA FARMGATE MILK PRICE MANUAL CHANGES

CHANGES IN APPROACHTO THE CALCULATION
Fonterra included in the 2015 Manual an undertaking to disclose any changes to the application of the Manual that result in materially different values of any input into the Farmgate Milk Price calculation.
Two changes in approach to the application of the Manual have resulted in materially different values of inputs into the Farmgate Milk Price calculation for the 2016 Season:
• The approach to determining Fonterra’s actual ocean freight costs for the 2016 Season to has been revised to include a portion of the returns earned by Kotahi13 with respect to Fonterra’s freight volumes. Under this revised approach, a portion of the difference between the relevant Kotahi costs (including a return on Kotahi’s net assets) and the amounts charged to Fonterra are recognised as ocean freight recoveries in the Farmgate Milk Price calculation. This amendment resulted in a net increase in the Farmgate Milk Price of 3.0 cents per kgMS
• As part of the periodic ‘review year’ process, an extensive review was undertaken of the overhead cost base assumed in the model. This review involved an assessment of all overhead costs incurred by Fonterra in New Zealand to determine the costs that would be relevant to a New Zealand-based manufacturer of commodity products. The review also incorporated the impact of the Velocity transformation programme on the underlying overhead cost base within Fonterra. This review resulted in a net increase in the Farmgate Milk Price of 3.2 cents per kgMS.
13 Kotahi was created in 2012 as a joint venture ocean freight management company. The JV is with Silver Fern Farms (with Fonterra holding approximately a 90% ownership stake) and was formed to better leverage Ocean Freight Services and New Zealand Export Infrastructure.
10 FONTERRA FARMGATE MILK PRICE STATEMENT 2016
FONTERRA FARMGATE MILK PRICE CHANGES IN APPROACH

CUMULATIVE IMPACT OF CHANGES IN METHODOLOGY BETWEEN 2009 AND 2016 SEASONSChanges in matters under Fonterra’s control – the Manual and the calculation methodology – and the external environment have resulted in a significant ‘structural’ increase in the Farmgate Milk Price since its introduction in the 2009 Season. Indicatively, if the approaches used in 2009 to determine key inputs into the Farmgate Milk Price were still used today, the Farmgate Milk Price for the 2016 Season would have been only $3.54.
Since 2012 Fonterra has set out in the Farmgate Milk Price Statement the impact of significant changes in calculation methodology and to the Manual on the Farmgate Milk Price for that year. The cumulative impact on the 2016 Season Farmgate Milk Price of a number of significant changes made since the 2009 Season is approximately 17.5 cents per kgMS.
In addition, the significant reduction in market interest rates since 2008, which has resulted in a reduction in the WACC, coupled with the reduction in the company tax rate in 2012 to 28 per cent, has resulted in a further increase of approximately 18.4 cents per kgMS in the Farmgate Milk Price for 2016, relative to the inputs used in 2009.
APPROACHTo estimate the impact on the Farmgate Milk Price of various changes made over time to the calculation methodology, we populated the financial model used to calculate the Farmgate Milk Price for the 2016 Season with the values of key variables (adjusted where relevant for inflation) used to determine the Farmgate Milk Price for the 2009 Season. Key limitations of this approach include:
• The precise impact of a number of changes depends on a number of factors that vary across years, including commodity prices, the volume of milk collected and product mix. Consequently, the values reported below should be regarded as being indicative only.
• For inputs that are derived from Fonterra’s actual revenue or costs, the analysis does not capture the impact of any changes in Fonterra’s performance impacting on the value of those inputs.
• We have not attempted to estimate the 2016-equivalent values of all inputs into the 2009 Season Farmgate Milk Price14. The impact of extending the analysis to include these inputs could go in either direction.
• The analysis does not capture the impact of the growth in milk collected by Fonterra, from 1.281 billion kgMS in the 2009 Season to 1.566 billion kgMS in 201615.
CHANGES IMPACTING ON NET REVENUEThree categories of changes have resulted in increases in the amount of net revenue per kgMS, at a given level of commodity prices and FX:
• Improvements in assumed yields and losses, including lactose losses.
• A reduction in the percentage of product that is assumed to be ‘downgraded’ and sold at lower prices.
• The incorporation of margins between the cost to Fonterra and amounts charged customers for services such as ocean freight and minor variations in product composition relative to ‘base’ composition.
The net impact of these changes on the 2016 Farmgate Milk Price, relative to the corresponding 2009 values, is an increase of 10.8 cents per kgMS.
14 The focus is on changes considered significant, either due to the magnitude of the change or because the issue has been the subject of particular focus by the Commerce Commission in the course of its annual reviews under subpart 5A of DIRA, such as inputs into the WACC.
15 Indicatively, the increase in milk supply has resulted in a further increase in the Farmgate of Milk Price of approximately 7 – 8 cents per kgMS, due to fixed costs being spread across higher milk volumes. Equivalently, the 2016 Season Farmgate Milk Price would have been only around $3.46 - $3.47 if the calculation methodology, interest rates and milk supply been held at their 2009 Season values.
FONTERRA FARMGATE MILK PRICE STATEMENT 2016 11
FONTERRA FARMGATE MILK PRICE CUMULATIVE IMPACT OF CHANGES IN METHODOLOGY

CHANGES IMPACTING ON CASH COSTSChanges in the calculation methodology resulted in a net reduction of 4.7 cents in cash costs per kgMS, relative to the 2009 methodology. The most significant of these changes related to:
• A revised approach to setting sales costs in 2010, which implies a 4.7 cents per kgMS reduction in sales costs, relative to the previous approach, in 2016.
• Structural increases in repairs and maintenance costs (3.5 cents per kgMS) and energy costs (1.5 cents per kgMS), reflecting a change in maintenance policy and various revisions to energy usage assumptions.
• A net 5.0 cents per kgMS decrease in the allowances for various manufacturing costs, the lower labour costs associated with the manufacturing plants assumed to be installed from 2012 on, and this year’s reduction in overhead costs, as discussed above.
CHANGES IMPACTING ON CAPITAL COSTSThree key structural changes have been made to the approach taken to setting inputs into the calculation of capital costs:
• The reduction in 2015 in the asset beta from 0.45 to 0.38, partially offset by the introduction of a specific risk premium of 0.15, following an independent review by Dr Alastair Marsden, and the inclusion in 2013 of an allowance for debt issuance costs. The impact of these changes in 2016 is an increase of 1.3 cents per kgMS.
• The alignment, first undertaken in 2013, of key working capital assumptions to values actually achieved by Fonterra with respect to sales and purchases relevant to the Farmgate Milk Price. Relative to the assumptions employed in 2009, the current assumptions imply lower working capital cost of 1.9 cents per kgMS.
• Various increases in capital cost inputs, implying a net increase in capital costs of 1.2 cents per kgMS.
The net impact of these changes is a 2.0 cents per kgMS increase in the Farmgate Milk Price.
CUMULATIVE IMPACT OF CHANGES IN METHODOLOGY BETWEEN 2009 AND 2016 SEASONS CONTINUED
12 FONTERRA FARMGATE MILK PRICE STATEMENT 2016
FONTERRA FARMGATE MILK PRICE CUMULATIVE IMPACT OF CHANGES IN METHODOLOGY

APPENDIX 1FARMGATE MILK PRICE OVERVIEW
RATIONALE FOR FARMGATE MILK PRICEFonterra currently collects around 84 per cent of New Zealand’s milk production. Because Fonterra purchases such a large proportion of New Zealand’s total milk, there is no ‘market price’ for milk that is independent of the price paid by Fonterra. As a result, since its formation in 2001, Fonterra has calculated a Farmgate Milk Price that enables total returns to be allocated between payments for milk and returns on the capital invested by Fonterra farmer shareholders and more recently by unit holders in the Fonterra Shareholders’ Fund.
FARMGATE MILK PRICE METHODOLOGYSince the 2009 Season, the Farmgate Milk Price has been calculated in accordance with the Manual by:
• Determining the revenue that Fonterra would earn if the equivalent of all the milk Fonterra collects were converted into commodity specifications of WMP and SMP, and their by-products, which are butter, AMF and BMP. These products are referred to in the Manual as ‘Reference Commodity Products’. Prices primarily reflect USD prices achieved on the twice-monthly GlobalDairyTrade (GDT) trading events, converted to NZD using Fonterra’s actual average monthly foreign exchange conversion rate16.
• Deducting costs, including the cost of transporting raw milk to factories, and the cost of efficiently manufacturing Reference Commodity Products and then transporting them to the point of export from New Zealand, along with selling and administration expenses. These costs also include amounts for depreciation of fixed assets and an appropriate return on investment, including investment in working capital.
The balance comprises the Farmgate Milk Price. While this is an aggregate amount, it is usually referred to on the basis of a Farmgate Milk Price per kgMS.
RATIONALE FOR REFERENCE COMMODITY PRODUCTSManufacture of the Reference Commodity Products comprised approximately 73 per cent of Fonterra’s total New Zealand ingredients production in the 2016 Season.
Almost all additional milk collected over the past decade in New Zealand by Fonterra and its competitors has been used to make milk powders. Because returns from the sale of milk powders and their by-products represent the ‘marginal’ returns that would drive the price of milk in a competitive market in New Zealand, the Farmgate Milk Price is based on these products. Returns from non-powder commodities, such as cheese and casein, have largely been irrelevant in driving investment in the dairy industry over the past 10 years and are therefore not taken into account in determining the Farmgate Milk Price.
The Farmgate Milk Price approach does not include any returns earned by Fonterra from specialised ingredients and consumer branded products. These types of products earn premiums over the returns to standard commodity ingredients. It is therefore appropriate that these premiums are recognised in Fonterra’s earnings rather than in the Farmgate Milk Price.
FARMGATE MILK PRICE GOVERNANCEThe Fonterra Board sets the total amount to be paid by Fonterra for all milk supplied to it in New Zealand in each season. For the 2016 Season, this amount is made up of the Farmgate Milk Price and Approved Adjustments (e.g. premium payments for some Winter Milk and Specialty Milk such as organic milk).
Both Fonterra’s constitution and the Dairy Industry Restructuring Act (2001) (DIRA) require Fonterra to maintain the Manual, which sets out Fonterra’s policies and methodology for determining the Farmgate Milk Price. The Manual must reflect the Milk Price Principles set out in Fonterra’s constitution. The Farmgate Milk Price has been calculated in accordance with the Manual since the start of the 2009 Season.
The Fonterra Board has established a robust governance structure to oversee the setting of the Farmgate Milk Price, which comprises the elements illustrated in the diagram on page 14.
1 Milk Price PanelThe Milk Price Panel plays a key role in overseeing the integrity of the Farmgate Milk Price. It has five members. Two are Fonterra-appointed directors (one of whom is the Chair), one is a Fonterra farmer-elected director and two are appropriately qualified nominees of the Fonterra Shareholders’ Council. The current members of the Panel are: David Jackson (Chair) and Clinton Dines, who are appointed Fonterra directors; Michael Spaans, who is a farmer-elected Fonterra director; and Paddy Boyle and Bill Donaldson, who are nominees of the Council.
John Waller retired as a Fonterra Director and Milk Price Panel Chair on 31 August 2016.
The Panel oversees the governance of the Farmgate Milk Price and the Manual, including changes to the Manual and verification by independent external experts of key parameters (such as resource usage rates, product yields and fixed manufacturing costs).
16 For WMP, SMP and AMF, which comprised 87 per cent of revenue in the 2016 Farmgate Milk Price, all prices were sourced from GDT. For butter and BMP a mixture of GDT and non-GDT prices were used.
FONTERRA FARMGATE MILK PRICE STATEMENT 2016 13
APPENDIX 1 FARMGATE MILK PRICE OVERVIEW

The Panel is responsible for:
• overseeing the calculation of the Farmgate Milk Price and making a recommendation on it to the Fonterra Board
• providing recommendations to the Fonterra Board on changes to the Manual
• providing assurance to the Fonterra Board that the Farmgate Milk Price has been calculated each year in accordance with the Manual.
The Fonterra Board is responsible for the forecast of the annual Farmgate Milk Price.
2 Milk Price GroupThe Milk Price Group is a working group established by Fonterra. The Head of the Milk Price Group is independent of Fonterra’s management and reports directly to the Chair of the Milk Price Panel. The role of the Milk Price Group includes:
• ensuring that the Farmgate Milk Price is calculated in accordance with the Manual and making recommendations in respect of the Farmgate Milk Price to the Panel
• considering any proposed amendments to the Manual, including those the Milk Price Group itself considers are appropriate, and ensuring they are in accordance with the Milk Price Principles in Fonterra’s Constitution
• providing assurance to the Fonterra Board over the calculation of the forecast of the Farmgate Milk Price
• managing engagement with External Reviewers
• engaging with the Commerce Commission, including to ensure full disclosure of all material aspects of the Farmgate Milk Price derivation each year.
The functions of the Milk Price Group are contracted out to Ernst & Young and other technical experts who are not employees of Fonterra.
3 External ReviewersExternal reviewers provide expert advice on various inputs, as well as assurance over the accuracy of financial models. In addition they participate in reviews of key parameters of the Farmgate Milk Price at regular intervals (which can be up to four years).
4 External AuditorThe external auditor audits the Farmgate Milk Price each year and provides assurance that the Farmgate Milk Price has been determined in accordance with the Milk Price Principles, Methodologies and Detailed Rules of the Farmgate Milk Price Manual. Fonterra’s external auditor is PricewaterhouseCoopers.
5 Commerce Commission Milk Price Oversight
Subpart 5A of DIRA, which was passed into law in July 2012, gives the Commerce Commission an oversight role with respect to Fonterra’s Farmgate Milk Price. The purpose of Subpart 5A is to promote the setting of a Farmgate Milk Price that provides an incentive to Fonterra to operate efficiently, while providing for contestability in the market for the purchase of milk from farmers (section 150A). Each year, the Commission
is required to review and report on the extent to which the Manual and Fonterra’s actual Farmgate Milk Price are consistent with this purpose:
• The Commerce Commission’s final report on the Manual for the 2015/16 Season was released on 15 December 2015 and can be found at http://www.comcom.govt.nz/regulated-industries/dairy-industry/review-of-fonterra-s-farm-gate-milk-price-and-manual/statutory-review-of-milk-price-manual/201516-season/
• The final report on the F16 Farmgate Milk Price calculation was released on 15 September 2016 and can be found at www.comcom.govt.nz/ regulated-industries/dairy-industry/ review-of-fonterra-s-farm-gate-milk- price-and-manual/statutory-review-of- milk-price-calculation-2/review-of-milk- price-calculation-201516-season/
6 Internal AuditFonterra’s internal audit team provides assurance over the processes and controls relating to Fonterra data used in the calculation of the Farmgate Milk Price.
7 Fonterra Senior ManagersFonterra senior managers provide internal oversight of the calculation of the actual and forecast Farmgate Milk Price in accordance with the Manual and detailed models and procedures.
Source: Fonterra
EXTERNAL2
Milk PriceGroup
3External
Reviewers
4ExternalAuditor
INTERNAL7
Fonterra Senior Managers
6InternalAudit
5Commerce
Commission
BOARD MAKES DECISIONS ON THE RECOMMENDATIONS OF THE MILK PRICE PANEL
MILK PRICE PANEL1
2 x Appointed FonterraDirectors (one being Chair)
1 x Fonterra FarmerDirector
2 x Shareholder CouncilAppointees
+Farmgate Milk Price Manual
APPENDIX 1FARMGATE MILK PRICE OVERVIEW CONTINUED
14 FONTERRA FARMGATE MILK PRICE STATEMENT 2016
APPENDIX 1 FARMGATE MILK PRICE OVERVIEW

APPENDIX 2INDEPENDENT ASSURANCE REPORTTO THE DIRECTORS OF FONTERRA CO-OPERATIVE GROUP LIMITED
Scope We have audited the application of the Principles, Methodologies and Detailed Rules as defined in the Farmgate Milk Price Manual of 1 August 2015 (the Manual) by the Milk Price Group (MPG) in deriving the F16 Season’s Farmgate Milk Price of $3.90 (the Fonterra Farmgate Milk Price). We have confirmed the balances contained in the Fonterra Farmgate Milk Price Statement are correctly extracted from the calculation of the Fonterra Farmgate Milk Price.
Information other than our scope and the assurance report The Directors are responsible for the Fonterra Farmgate Milk Price Statement. Our opinion on the Fonterra Farmgate Milk Price Statement does not cover information other than the balances we confirm have been correctly extracted from the calculation of the Fonterra Farmgate Milk Price and we do not express any form of assurance conclusions on the other information.
In connection with our scope, our responsibility is to read the other information and, in doing so, consider whether the other information is materially inconsistent with the Fonterra Farmgate Milk Price Statement or our knowledge obtained in the audit, or otherwise appears to be materially misstated. If, based on the work we have performed on the other information that we obtained prior to the date of this assurance report, we conclude that there is a material misstatement of this other information, we are required to report that fact. We have nothing to report in this regard.
Milk Price Group’s Responsibilities The MPG are responsible for the calculation of the Fonterra Farmgate Milk Price based upon the Manual, ensuring the Fonterra Farmgate Milk Price has been derived in accordance with the Principles, Methodologies and Detailed Rules set out in the Manual. The MPG is also responsible for the preparation of the Fonterra Farmgate Milk Price Statement.
Our Independence and Quality ControlWe have complied with the independence and other ethical requirements of Professional and Ethical Standard 1 (Revised) issued by the New Zealand Auditing and Assurance Standards Board, which is founded on the fundamental principles of integrity, objectivity, professional competence and due care, confidentiality and professional behaviour.
The firm applies Professional and Ethical Standard 3 (Amended) and accordingly maintains a comprehensive system of quality control including documented policies and procedures regarding compliance with ethical requirements, professional standards, and applicable legal and regulatory requirements.
Independent Auditors’ Responsibilities We are responsible for expressing an independent opinion on whether the MPG has complied, in all material respects, with the Principles, Methodologies and Detailed Rules set out in the Manual in deriving the Fonterra Farmgate Milk Price, and that the balances, in all material respects, in the Fonterra Farmgate Milk Price Statement have been correctly extracted from those calculations, and reporting our opinion to you.
We conducted our independent assurance engagement in accordance with ISAE (NZ) 3000 Assurance engagements other than audits or reviews of historical financial information and SAE 3100 Compliance Engagements issued in New Zealand. Those standards require that we comply with ethical requirements and plan and perform our procedures to obtain reasonable assurance about whether, the MPG has complied, in all material respects, with Principles, Methodologies and Detailed Rules of the Manual in deriving the Fonterra Farmgate Milk Price, and that the balances, in all material respects, in the Fonterra Farmgate Milk Price Statement have been correctly extracted from those calculations.
Inherent LimitationsOur engagement includes examining, on a test basis, evidence relevant to the amounts used to derive the Fonterra Farmgate Milk Price and the balances in the Fonterra Farmgate Milk Price Statement. It also includes assessing the significant assumptions, estimates and judgements made by the MPG in the calculation of the Fonterra Farmgate Milk Price and ensuring the Principles, Methodologies and Detailed Rules applied are consistent with those set out in the Manual. Because of the inherent limitations, it is possible that fraud, error or non-compliance may occur and not be detected. As the procedures performed are undertaken on a test basis, our assurance engagement cannot be relied on to detect all instances where the Principles, Methodologies and Detailed Rules set out in the Manual have not been complied with. Our opinion expressed in this report has been formed on that basis.
FONTERRA FARMGATE MILK PRICE STATEMENT 2016 15
APPENDIX 2 INDEPENDENT ASSURANCE REPORT

Our firm carries out other services for the Fonterra Co-operative Group in relation to other advisory services and other assurance and attestation services. Partners and employees of our firm may deal with the Fonterra Co-operative Group on normal terms within the ordinary course of the trading activities of the Fonterra Co-operative Group. These matters have not impaired our independence as auditors of the Fonterra Farmgate Milk Price.
Independent Assurance Opinion In our opinion the MPG has complied, in all material respects, with the Principles, Methodologies and Detailed Rules in the Manual in deriving the F16 Season’s Fonterra Farmgate Milk Price of $3.90. We have confirmed the balances contained in this Fonterra Farmgate Milk Price Statement are correctly extracted, in all material respects, from the Fonterra Farmgate Milk Price calculation.
Restriction on Distribution or UseThis report is made solely to the Directors. Our report has been prepared at the request of the Directors and for no other purpose. To the fullest extent permitted by law we do not accept or assume responsibility to anyone other than Fonterra Co-Operative Group Limited for this report, or for the opinions we have formed.
PricewaterhouseCoopersAuckland 20 September 2016
APPENDIX 2INDEPENDENT ASSURANCE REPORTTO THE DIRECTORS OF FONTERRA CO-OPERATIVE GROUP LIMITED CONTINUED
16 FONTERRA FARMGATE MILK PRICE STATEMENT 2016
APPENDIX 2 INDEPENDENT ASSURANCE REPORT
ATTACHMENT 1MILK SUPPLIED AND PRODUCTION VOLUMES
2016 SEASON MILK SUPPLIED (MILLION kgMS) PRODUCTION (000 MT) FINISHED PRODUCT
WMP SMP BUTTER AMF BMP TOTAL
JUN 15 TO AUG 15 127 165 44 11 18 5 243
SEP 15 TO NOV 15 609 727 255 99 64 24 1,169
DEC 15 TO FEB 16 515 587 225 100 49 22 984
MAR 16 TO MAY 16 315 382 115 51 35 15 597
TOTAL 1,566 1,862 639 261 166 65 2,993
2015 SEASON MILK SUPPLIED (MILLION kgMS) PRODUCTION (000 MT) FINISHED PRODUCT
WMP SMP BUTTER AMF BMP TOTAL
JUN 14 TO AUG 14 127 168 43 10 17 5 244
SEP 14 TO NOV 14 643 728 287 113 70 27 1,225
DEC 14 TO FEB 15 521 665 175 88 45 19 992
MAR 15 TO MAY 15 323 440 83 42 32 13 611
TOTAL 1,614 2,000 589 254 164 63 3,071
2014 SEASON MILK SUPPLIED (MILLION kgMS) PRODUCTION (000 MT) FINISHED PRODUCT
WMP SMP BUTTER AMF BMP TOTAL
JUN 13 TO AUG 13 121 168 35 11 13 4 231
SEP 13 TO NOV 13 621 740 254 108 61 24 1,187
DEC 13 TO FEB 14 530 663 187 93 46 20 1,009
MAR 14 TO MAY 14 313 453 58 37 29 11 588
TOTAL 1,584 2,025 534 248 149 59 3,015
FONTERRA FARMGATE MILK PRICE STATEMENT 2016 17
ATTACHMENT 1 MILK SUPPLIED AND PRODUCTION VOLUMES

2016 SEASON SHIPMENTS (000 MT) OF FINISHED PRODUCT
WMP SMP BUTTER AMF BMP TOTAL SALES
AUG 15 TO OCT 15 195 31 14 16 0 255
NOV 15 TO JAN 16 712 281 94 71 25 1,184
FEB 16 TO APR 16 413 147 58 27 13 658
MAY 16 TO JUL 16 447 147 65 41 19 720
AUG 16 TO OCT 16 94 33 29 11 9 176
TOTAL 1,862 639 261 166 65 2,993
2015 SEASON SHIPMENTS (000 MT) OF FINISHED PRODUCT
WMP SMP BUTTER AMF BMP TOTAL SALES
AUG 14 TO OCT 14 253 35 24 20 5 337
NOV 14 TO JAN 15 671 208 83 48 15 1,025
FEB 15 TO APR 15 519 150 60 33 14 775
MAY 15 TO JUL 15 431 117 46 38 16 648
AUG 15 TO OCT 15 127 80 41 25 13 286
TOTAL 2,000 589 254 164 63 3,071
2014 SEASON SHIPMENTS (000 MT) OF FINISHED PRODUCT
WMP SMP BUTTER AMF BMP TOTAL SALES
AUG 13 TO OCT 13 309 66 5 14 8 402
NOV 13 TO JAN 14 676 169 86 40 15 986
FEB 14 TO APR 14 548 102 73 36 16 776
MAY 14 TO JUL 14 402 118 57 41 14 633
AUG 14 TO OCT 14 89 79 27 18 5 218
TOTAL 2,025 534 248 149 59 3,015
ATTACHMENT 2SALES VOLUMES
18 FONTERRA FARMGATE MILK PRICE STATEMENT 2016
ATTACHMENT 2 SALES VOLUMES
2016 SEASON AVERAGE NUMBER OF MONTHS PRIOR TO SHIPMENT
WMP SMP BUTTER AMF BMP
AUG 15 TO OCT 15 3.1 2.7 2.8 2.8 N/A17
NOV 15 TO JAN 16 3.1 3.4 2.8 3.3 3.3
FEB 16 TO APR 16 2.8 3.0 2.9 2.7 2.6
MAY 16 TO JUL 16 2.9 2.8 2.6 2.6 3.2
AUG 16 TO OCT 16 2.9 2.9 2.9 3.3 2.9
3.0 3.1 2.8 3.0 3.0
2015 SEASON AVERAGE NUMBER OF MONTHS PRIOR TO SHIPMENT
WMP SMP BUTTER AMF BMP
AUG 14 TO OCT 14 2.6 2.9 3.0 3.0 3.1
NOV 14 TO JAN 15 3.0 3.0 2.8 3.2 2.6
FEB 15 TO APR 15 3.0 3.1 2.7 3.0 2.5
MAY 15 TO JUL 15 2.8 2.6 2.5 2.6 2.4
AUG 15 TO OCT 15 3.1 3.2 3.0 3.1 3.2
2.9 3.0 2.8 3.0 2.7
2014 SEASON AVERAGE NUMBER OF MONTHS PRIOR TO SHIPMENT
WMP SMP BUTTER AMF BMP
AUG 13 TO OCT 13 2.6 2.4 2.7 2.7 2.6
NOV 13 TO JAN 14 2.9 2.7 2.5 2.9 2.6
FEB 14 TO APR 14 2.8 2.6 2.9 2.7 2.7
MAY 14 TO JUL 14 2.7 2.5 2.5 2.6 2.4
AUG 14 TO OCT 14 3.3 3.0 2.7 2.9 3.2
2.8 2.6 2.6 2.8 2.6
The tables on the next page supplement that above by providing information on the average percentages of sales contracted in each of months 1 to 5 prior to shipment in the 2014 to 2016 Seasons.
ATTACHMENT 3AVERAGE NUMBER OF MONTHS PRIOR TO SHIPMENT THAT PRICES WERE STRUCK
17 Not applicable: No BMP sales informed the Farmgate Milk Price revenue in this quarter.
FONTERRA FARMGATE MILK PRICE STATEMENT 2016 19
ATTACHMENT 3 AVERAGE NUMBER OF MONTHS PRIOR TO SHIPMENT THAT PRICES WERE STRUCK

2016 SEASON AVERAGE PERCENTAGE OF SALES CONTRACTED IN EACH OF MONTHS 1- 5 PRIOR TO SHIPMENT
WMP SMP BUTTER AMF BMP
1 8% 6% 7% 10% 7%
2 33% 29% 37% 33% 32%
3 28% 28% 32% 28% 24%
4 19% 24% 17% 19% 29%
5 13% 13% 6% 11% 8%
2015 SEASON AVERAGE PERCENTAGE OF SALES CONTRACTED IN EACH OF MONTHS 1- 5 PRIOR TO SHIPMENT
WMP SMP BUTTER AMF BMP
1 8% 6% 9% 7% 10%
2 33% 34% 33% 32% 41%
3 27% 31% 36% 31% 26%
4 20% 19% 18% 19% 20%
5 12% 10% 4% 11% 3%
2014 SEASON AVERAGE PERCENTAGE OF SALES CONTRACTED IN EACH OF MONTHS 1- 5 PRIOR TO SHIPMENT
WMP SMP BUTTER AMF BMP
1 6% 11% 6% 6% 10%
2 39% 42% 41% 39% 36%
3 31% 25% 34% 29% 34%
4 16% 14% 17% 18% 16%
5 9% 7% 2% 8% 4%
AVERAGE % OF SALES CONTRACTED IN EACH MONTH PRIOR TO SHIPMENT
ATTACHMENT 3CONTINUED
20 FONTERRA FARMGATE MILK PRICE STATEMENT 2016
ATTACHMENT 3 AVERAGE NUMBER OF MONTHS PRIOR TO SHIPMENT THAT PRICES WERE STRUCK

2016 SEASON USD PER MT OF FINISHED PRODUCT
SHIPMENT PERIOD WMP SMP BUTTER AMF BMP
AUG 15 TO OCT 15 1,957 1,480 2,467 2,732 N/A18
NOV 15 TO JAN 16 2,093 1,789 2,769 3,093 1,868
FEB 16 TO APR 16 2,239 1,950 3,000 3,654 1,732
MAY 16 TO JUL 16 2,065 1,765 2,832 3,331 1,567
AUG 16 TO OCT 16 2,221 1,732 2,853 3,374 1,632
2,111 1,803 2,830 3,227 1,723
2015 SEASON USD PER MT OF FINISHED PRODUCT
SHIPMENT PERIOD WMP SMP BUTTER AMF BMP
AUG 14 TO OCT 14 3,130 3,217 3,213 3,642 4,122
NOV 14 TO JAN 15 2,694 2,761 2,808 3,417 3,056
FEB 15 TO APR 15 2,423 2,487 3,217 3,922 2,713
MAY 15 TO JUL 15 2,593 2,482 3,338 3,781 2,351
AUG 15 TO OCT 15 2,419 1,938 2,733 3,072 1,919
2,639 2,552 3,027 3,577 2,657
2014 SEASON USD PER MT OF FINISHED PRODUCT
SHIPMENT PERIOD WMP SMP BUTTER AMF BMP
AUG 13 TO OCT 13 4,923 4,624 3,639 4,817 4,687
NOV 13 TO JAN 14 5,023 4,625 3,759 4,959 4,794
FEB 14 TO APR 14 4,950 4,938 3,985 5,417 5,050
MAY 14 TO JUL 14 4,434 4,363 4,283 4,654 4,595
AUG 14 TO OCT 14 3,949 3,792 3,530 3,961 4,231
4,824 4,504 3,920 4,853 4,752
ATTACHMENT 4AVERAGE USD PRICES
18 Not applicable: No BMP sales informed the Farmgate Milk Price revenue in this quarter.
FONTERRA FARMGATE MILK PRICE STATEMENT 2016 21
ATTACHMENT 4 AVERAGE USD PRICES

Note that the spot data is based on the weighted average conversion rate that would have been achieved if the revenue collected during the shipping period was converted at the average spot rate in the month of collection. Certain average spot exchange rate figures for the 2015 and 2014 Seasons differ from those disclosed in previous Farmgate Milk Price Statements, as forecast exchange rates have been replaced with actual exchange rates.
2016 SEASONFONTERRA'S AVERAGE
CONVERSION RATESPOT
EXCHANGE RATE
AUG 15 TO OCT 15 0.7359 0.6581
NOV 15 TO JAN 16 0.7231 0.6637
FEB 16 TO APR 16 0.7076 0.6803
MAY 16 TO JUL 16 0.6849 0.7078
AUG 16 TO OCT 16 0.6790 0.706919
REVENUE-WEIGHTED ANNUAL AVERAGE 0.7082 0.6798
2015 SEASONFONTERRA'S AVERAGE
CONVERSION RATESPOT
EXCHANGE RATE
AUG 14 TO OCT 14 0.8035 0.7848
NOV 14 TO JAN 15 0.7957 0.7628
FEB 15 TO APR 15 0.7943 0.7488
MAY 15 TO JUL 15 0.7706 0.6727
AUG 15 TO OCT 15 0.7625 0.6492
REVENUE-WEIGHTED ANNUAL AVERAGE 0.7882 0.7312
2014 SEASONFONTERRA'S AVERAGE
CONVERSION RATESPOT
EXCHANGE RATE
AUG 13 TO OCT 13 0.8083 0.8283
NOV 13 TO JAN 14 0.7997 0.8263
FEB 14 TO APR 14 0.8078 0.8580
MAY 14 TO JUL 14 0.8194 0.8595
AUG 14 TO OCT 14 0.8285 0.7998
REVENUE-WEIGHTED ANNUAL AVERAGE 0.8086 0.8396
ATTACHMENT 5AVERAGE USD:NZD CONVERSION AND SPOT RATES
19 The spot exchange rate for the period from August to October 2016 equals the spot rate at 9am on 29 July 2016, the last working day of Fonterra’s 2016 financial year.
22 FONTERRA FARMGATE MILK PRICE STATEMENT 2016
ATTACHMENT 5 AVERAGE USD:NZD CONVERSION AND SPOT RATES

In this Statement, unless the context otherwise requires, the following terms have the meanings set out next to them:
AMF means anhydrous milk fat.
Approved Adjustments means an amount approved by the Fonterra Board to be paid for milk in addition to, or to be subtracted from, the amount calculated under the Farmgate Milk Price Manual, but excludes the Milk Price Adjustment.
BMP means buttermilk powder.
Detailed Rules means the detailed rules for calculating the Farmgate Milk Price as set out in the Manual.
DIRA means the Dairy Industry Restructuring Act 2001, which authorised Fonterra’s formation and regulates its activities.
Farmgate Milk Price means Fonterra’s Farmgate Milk Price as determined under the Manual.
Farmgate Milk Price Capital Costs are defined in the Manual.
Farmgate Milk Price Cash Costs are defined in the Manual.
Farmgate Milk Price Manual or Manual means Fonterra’s Farmgate Milk Price Manual.
Financial year means Fonterra’s financial year, which runs from 1 August to the following 31 July.
Fonterra means Fonterra Co-operative Group Limited.
GlobalDairyTrade or GDT means the electronic auction platform that is used to sell commodity dairy products.
Independent Processors means entities which are independent of Fonterra and process raw milk.
kgMS means kilograms of milksolids.
Methodologies means the methodologies for calculating the Farmgate Milk Price as set out in the Manual.
Milk Price Model means the model used to calculate the Farmgate Milk Price set out in the Manual.
Milk Price Principles or Principles means the Milk Price Principles set out in Fonterra’s Constitution.
MT means metric tonnes.
NZD means New Zealand dollars.
Raw Milk Regulations means the Dairy Industry Restructuring (Raw Milk) Regulations 2001 or, where applicable, the Dairy Industry Restructuring (Raw Milk) Regulations 2012.
Reference Commodity Products means the commodity products used to calculate the Farmgate Milk Price, comprising WMP, SMP, BMP, AMF and butter.
Season means the 12-month period from 1 June to the following 31 May.
SMP means skim milk powder.
Specialty Milk means milk that has special properties such as organic milk.
USD means United States dollars.
Winter Milk means milk supplied by farmers in the months of May, June and July.
WMP means whole milk powder.
GLOSSARYGLOSSARY

Fonterra Co-operative Group Limited Private Bag 92032, Auckland 1142, New Zealand64 9 374 9000 (Phone) 64 9 374 9001 (Fax)Shareholder And Supplier Services Freephone 0800 65 65 68For global locations visit www.fonterra.com