is the uk life assurance market competitive? evidence from
TRANSCRIPT

ab cdIs the UK life assurance
market competitive?Evidence from companies’
charges
2003 Life Convention, 9-11 NovemberHilton Birmingham Metropole Hotel
Chris O’BrienCentre for Risk and Insurance Studies,Nottingham University Business School

Plan
Regulation and competitionThe nature of life assurance: customers
and competitionTheories: what might we expect?Results: PIA data 1995-99FSA comparative tables 2003

Regulation and competitionFSA’s role
• “The key purpose of the FSA’s regulatory regime is to correct market failure”
• Forthcoming FSA paper, “Harnessing Market Forces”
• Does the market work satisfactorily?
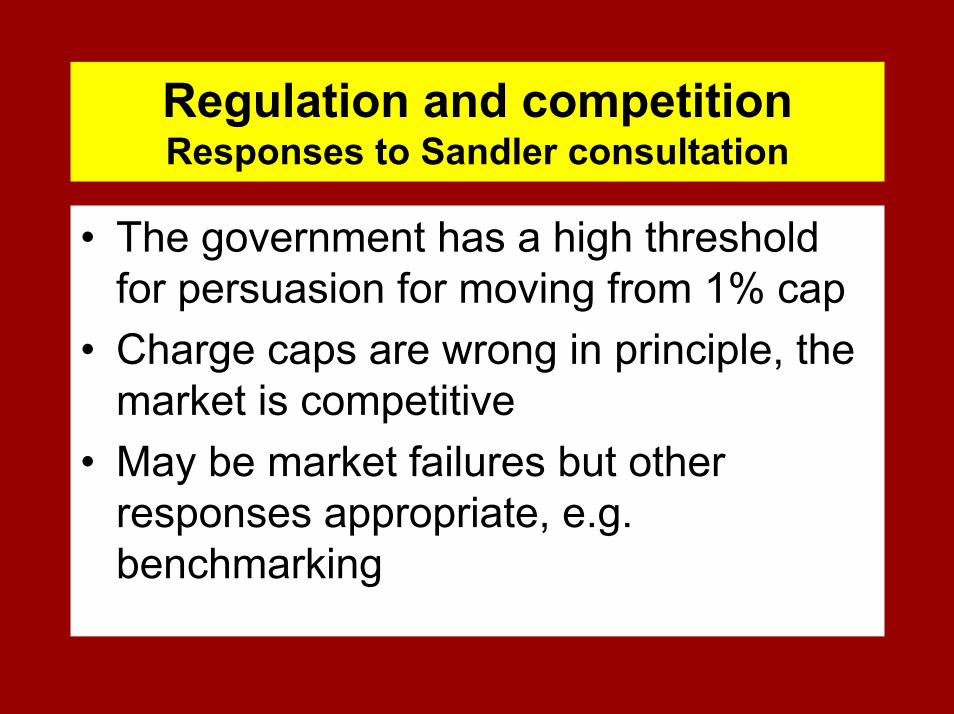
Regulation and competitionResponses to Sandler consultation
• The government has a high threshold for persuasion for moving from 1% cap
• Charge caps are wrong in principle, the market is competitive
• May be market failures but other responses appropriate, e.g. benchmarking

Customers and competitionSandler report: consumer weakness
• Products complex, hard to assess, including price & quality (& trade-off)
• Long-term nature, infrequent purchase • Opaque, inconsistent terminology• Product proliferation, differentiation
doesn’t reflect true differences• Low financial literacy

Other barriers to competition?
• With profits: advantage of existing firms with estate, 10% ppn non-competitive?
• Distribution channels• Regulation a deterrent to new entrants
– Solvency requirements– Conduct of business rules– Regulatory environment

Theories: over time
New entrants have low chargesExiters have high chargesMergers: low charge product chosen
economies of scale or elimination of inefficient activities
We shall also look at effect of distribution channel

Theories: cross-section data
Low charges associated with:Direct distributionLarge sizeMutualityBancassurerLow credit rating

PIA data 1995-99
RIY data for products (estimates, inconsistencies, eg post-merger)but a reasonable cost measure?
With profit endowments (10 yrs)Low cost mortgage endowments (25 yrs)Unit-linked personal pensions (25 yrs)Market coverage nearly complete?

Average chargesfor 3 products (unweighted)
1
1.5
2
2.5
3
3.5
4
1995 1996 1997 1998 1999
RIY
(%) EAP 10
LCEAP25ULPP25
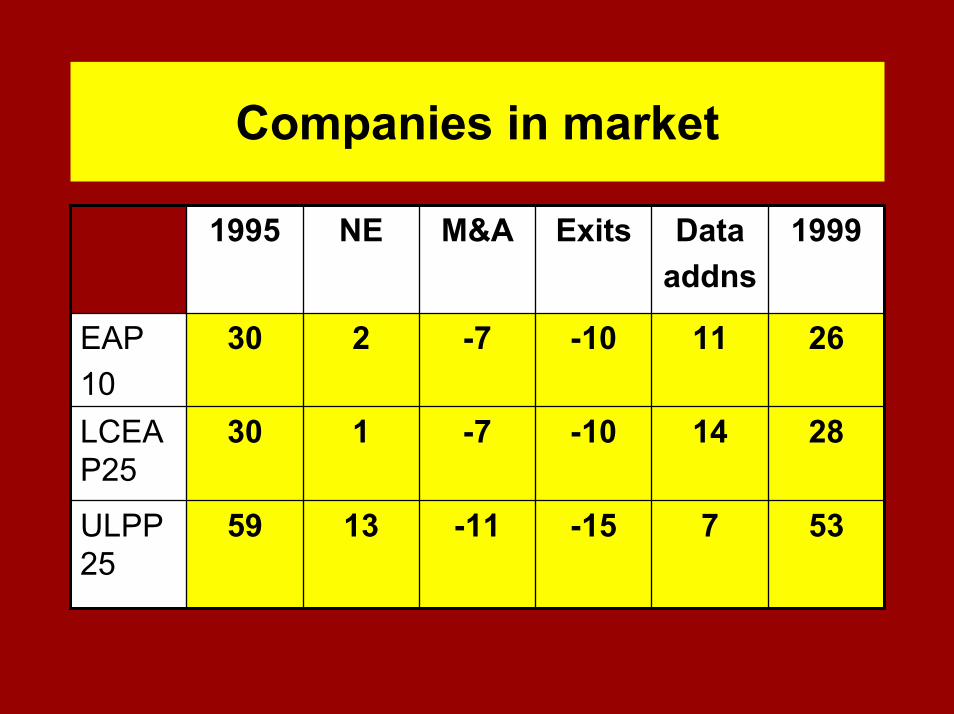
Companies in market
537-15-111359ULPP25
2814-10-7130LCEAP25
2611-10-7230EAP10
1999Dataaddns
ExitsM&ANE1995

Charges relative to average:EAP10: new entrants 95%, exiters 110%
0%20%40%60%80%
100%120%140%160%180%
New entrantsExiters

Charges relative to average:LCEAP25: new entrant 123%, exiters 116%
0%20%40%60%80%
100%120%140%160%180%200%
New entrantsExiters

Charges relative to average:ULPP25: new entrants 77%, exiters 112%
0%
20%
40%
60%
80%
100%
120%
140%
160%
New entrantsExiters

Charges pre- & post-merger:6 above line, 18 below diagonal
0
1
2
3
4
5
0 1 2 3 4 5Avge pre-merger RIY
Post
-mer
ger R
IY
EAP10LCAP25ULPP25Diagonal

Contributors to change in RIYEAP10
-0.2
-0.15
-0.1
-0.05
0
0.05
0.1
1996 1997 1998 1999
Chan
ge in
redu
ctio
n in
yie
ld (%
)
ExitsContinuersM&AsM&A consolNew entrantsData additions

Contributors to change in RIYLCEAP25
-0.2
-0.15
-0.1
-0.05
0
0.05
0.1
1996 1997 1998 1999
Chan
ge in
redu
ctio
n in
yie
ld (%
)
ExitsContinuersM&AsM&A consolNew entrantsData additions

Contributors to change in RIYULPP25
-0.2
-0.15
-0.1
-0.05
0
0.05
1996 1997 1998 1999
Chan
ge in
redu
ctio
n in
yie
ld (%
)
ExitsContinuersM&AsM&A consolNew entrantsData additions

Contributors to change in RIYTotal 1995-99
-0.4-0.35-0.3
-0.25-0.2
-0.15-0.1
-0.050
0.050.1
EAP10 LCEAP25 ULPP25
Chan
ge in
redu
ctio
n in
yie
ld (%
)
ExitsContinuersM&AsM&A consolNew entrantsData additions

Distribution channels
• What might differences in distribution channels be?
• IFA highest charges – CR/AR – Direct –No advice lowest (quality of service)
• Or the reverse (competitiveness)• Dispersion of charges: lowest for IFA
(most competitive)?

Average charges10-year with profit endowment
1
1.5
2
2.5
3
3.5
4
1995 1996 1997 1998 1999
RIY
(%) IFA
CRARDirect

Average charges25-year low cost with profit endowment
1
1.2
1.4
1.6
1.8
2
2.2
1995 1996 1997 1998 1999
RIY
(%) IFA
CRARDirect

Average charges25-year unit-linked personal pension
1
1.2
1.4
1.6
1.8
2
2.2
1995 1996 1997 1998 1999
RIY
(%) IFA
CRARDirect

Dispersion: standard deviation10-year with profit endowment
00.10.20.30.40.50.60.70.80.9
1
1995 1996 1997 1998 1999
RIY
(%) IFA
CRARDirect

Dispersion: standard deviation25-year low cost with profit endowment
00.10.20.30.40.50.60.70.80.9
1
1995 1996 1997 1998 1999
RIY
(%) IFA
CRARDirect

Dispersion: standard deviation25-year unit-linked personal pension
00.10.20.30.40.50.60.70.80.9
1
1995 1996 1997 1998 1999
RIY
(%)
IFACRARDirect

Cross-section analysis
Product data from FSA Comparative tables: charges vary with what?
Investment bonds £10000 SP57 UL, 44 WP bonds
Personal pensions £50 per month75 UL, 20 WP policies

US evidence onlong-term care pricing (JRI 1999)
Proprietary companies: lower pricesLarge companies; higher pricesNew entrants: higher pricesDistribution system: not significantLow solvency: higher prices (would
stronger insurers can charge premium for more security: how test this in UK?)

Investment bondsMultiple regression
Independent variable = charges over 10 years, as at end of period: £10000 SP
Variables = firm and product characteristics
R2 = .227 (13 variables, adjusted R2 = .111)
Significance of model = .034

Investment bonds: results
.124-Ln assets
. 091+Friendly society
.045+Proprietary
.089+Tied
.110-Direct
.057-With profits
SignificanceEffect on charges

Investment bondsInsignificant items
Min withdrawal (+), min balance (-), additional payments (-), no. of funds (-), no. of free switches (-)
Assumption of large investment amount by firms targeting more sophisticated customers
Bancassurer + (.402)

Personal pensions
Monthly premium £50R2 = .250 (11 variables, adjusted R2 =
.151)Significance of model = .009Direct significant (.026): negativeNo. of free switches (0.002): negative
i.e. high premium target market effect
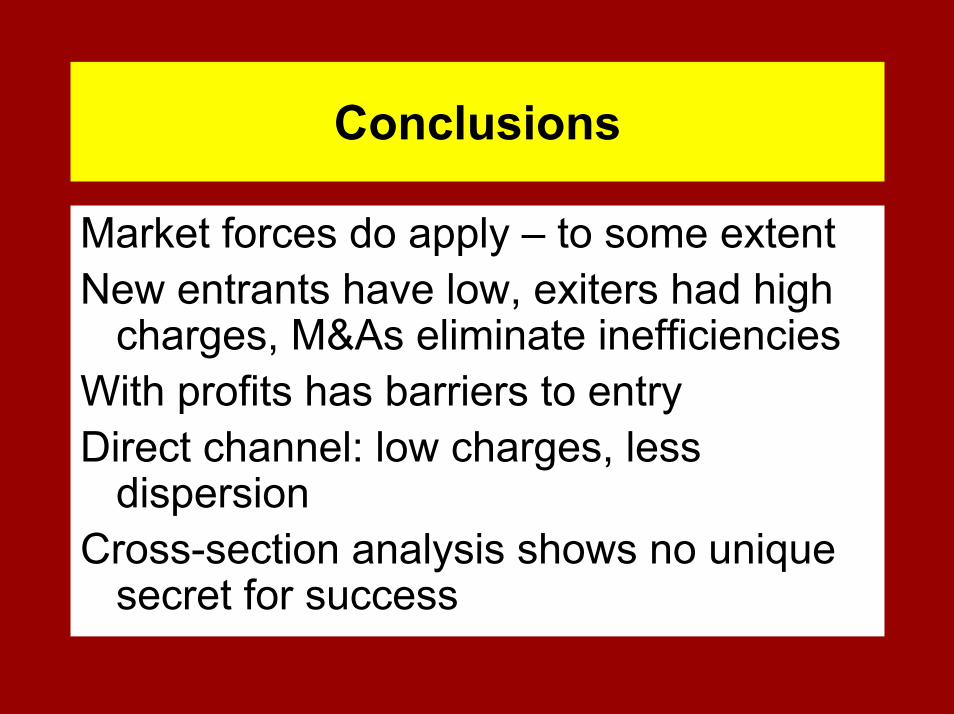
Conclusions
Market forces do apply – to some extentNew entrants have low, exiters had high
charges, M&As eliminate inefficienciesWith profits has barriers to entryDirect channel: low charges, less
dispersionCross-section analysis shows no unique
secret for success