barriers to entry and competitive behavior: evidence...
TRANSCRIPT
Barriers to Entry and Competitive Behavior: Evidence
from Reforms of Cable Franchising Regulations∗
Sutirtha Bagchi†
Jagadeesh Sivadasan‡
First draft: March 2011This draft: May 2013
Abstract
Between 2005 and 2008, 19 of the 50 states of the U.S. reformed the franchising process forcable television, significantly easing entry into local markets. Using a difference-in-differences ap-proach that exploits the staggered introduction of reforms, we find that prices for “Basic” servicedeclined systematically by about 5.5 to 6.8 percent following the reforms, but we find no statisti-cally significant effect on average price for the more popular “Expanded Basic” service. We alsofind that the reforms led to increased actual entry in reformed states, by about 11.6% relative tonon-reformed states. Our analysis shows that the decline in price for “Basic” service holds formarkets that did not experience actual entry, consistent with limit pricing by incumbents. Tocontrol for potential state-level shocks correlated with the reforms, we undertake a sample-splittest examining changes in local markets which faced a greater threat of entry (because they wereclose to a prominent second entrant); we find larger declines in prices, for both “Basic” and “Ex-panded Basic” services in these markets. Our results are consistent with limit pricing models thatpredict incumbents respond to increased threat of entry, and suggest that the reforms facilitatedentry and modestly benefitted consumers in reformed states.
Keywords: Price competition, Limit pricing, Signaling, Entry deterrence
JEL classification codes: L51 (Economics of Regulation); L43 (Legal Monopolies and Regula-tion or Deregulation); L82 (Industry Studies: Services-Entertainment; Media); L12 (Monopoly,Monopolization Strategies)
∗We thank Ying Fan and Jeremy Fox for detailed comments on an earlier draft. We also thank (without implicating)seminar participants at the University of Michigan, the Annual International Industrial Organization Conference, 2012,and the Midwest Economic Association Annual Conference, 2011, for comments on an earlier version of the paper. Allremaining errors are our own.†[email protected], University of Michigan‡[email protected], University of Michigan
1

1 Introduction
Watching TV is the predominant leisure activity in the U.S., accounting for about half
of leisure time on average for American adults (BLS 2012). Cable television plays a
very significant role in this activity, with a share of over 60% of U.S. households in 2010
(Nielsen 2011). For an industry with such a significant presence in households across
the nation, cable television continues to see little competition in many local markets,
despite federal reforms such as the Cable Act of 1992 and the Telecommunications Act
of 1996 that aimed specifically to enhance competition. In particular, based on a 2009
survey, the FCC documented effective competition (from either satellite TV (DBS) or
a second wireline operator) for only 31.65% of subscribers (FCC 2011, p. 18), implying
that 68.35% of subscribers did not have competitive offerings to choose from.
Policy measures to boost competition in the cable industry continue to be debated
at the state and federal levels. In this paper, we examine the impact of one such reform
– the deregulation of the franchising process for cable television, which was adopted in
nineteen states of the U.S. between 2005 and 2008. Prior to 2005, in all but four states,
prospective entrants to any local market (termed as “community”) had to negotiate with
local municipalities on a case-by-case basis. Because the local authorities often imposed
significant restrictions on the new entrants, the need to negotiate individually with local
municipalities posed a challenge to potential entrants, with the FCC concluding that
“local franchising process in many jurisdictions constitute an unreasonable barrier to
entry that impedes...cable competition” (FCC 2006).
Following deregulation, the reformed states have allowed for cable companies to receive
a single state-wide franchise for providing service to communities anywhere within the
state. By standardizing the terms and conditions that apply to both existing providers
and new entrants into this industry, the reforms effectively liberalized entry by reducing
the restrictions typically imposed on new entrants by local city councils (FCC 2006,
FCC 2007, Bolema 2008). The significance of the reforms is reflected in the intense
lobbying and legal efforts undertaken by incumbents to delay the reforms and by telecom
companies (‘Telcos’) in support of the reforms.1
While these reforms were the subject of strong debate and lobbying efforts, there has
been surprisingly little systematic evaluation of the effect of the reforms,2 and anecdotal
evidence on the effect of the reforms is mixed.3 In addition to being of direct policy
interest, studying these reforms provides a unique opportunity to examine the effects of
a reduction in barriers to entry on incumbent behavior. As pointed out by Goolsbee
1For anecdotal evidence on the lobbying efforts see news articles by e.g., Reardon 2005a, Haugsted 2006, Sura 2006,and Sher 2008.
2One exception is a study by Bohanon and Hicks (2010), who examine the effect of franchising reforms on numberof broadband connections using FCC data; they find an increase in broadband subscriptions following the reforms.
3Articles about specific states suggesting consumers benefitted include Spiwak 2006 (Texas), Schneider 2007 (Wis-consin) and Rogers 2008 (Michigan), while Kreucher 2008 (Michigan), and Barrett 2008 (Wisconsin) argue otherwise.
2

and Syverson (2008), the effect of an increased threat of entry has been a topic of in-
terest in the theoretical literature, but has been much less investigated empirically, as
it is difficult to find empirical instances where the threat of entry went up without nec-
essarily inducing entry itself. More broadly, the reforms provide a setting to study the
effect of competition on firm behavior; changes in regulatory barriers to entry helps over-
come the difficult challenge of finding exogenous sources of variation in the competitive
environment (Holmes and Schmitz, 2010).
Because deregulation was introduced across the nineteen states in a staggered man-
ner, we are able to adopt a standard difference-in-differences (DID) approach exploiting
differences in timing to control for common shocks (e.g., as in Card 1992). Using a rich
micro data set which includes data on prices of cable television in every local community
across the United States over a seven-year period from 2004 to 2010, we examine whether
the price of subscribing to the two primary service tiers – “Basic” and “Expanded Basic”
– declined in response to these reforms.4 Complementing this dataset with hand collected
data on entry by the two major Telcos, Verizon and AT&T, we also examine how entry
by cable operators and Telcos was affected by the reforms.
We find that prices for “Basic” service are lower by about 5.5 to 6.8% in DID terms
in states which have reformed their franchising process for cable television. We find no
effect on prices of the more popular “Expanded Basic” service tier. We confirm that
the DID effects were not impacted by pre-existing trends – the trends in prices for both
“Basic” and “Expanded Basic” service in the reformed states were not different from that
in the non-reformed states. We check and find these results robust to a range of robust-
ness checks. In particular, we find the results robust to including additional controls for
quality of channels offered (in addition to the control for number of channels), including
amortized costs of installation in the price, examining long differences, restricting anal-
ysis to a balanced panel of communities, using alternative fixed effects, including only
principal communities, and excluding some sub-sets of states. As a falsification test, we
check and find no effects using residential, commercial and industrial electricity prices.
Finally, we find that quantity (measured as number of subscribers) went up in response
to the price decline, though the estimated effects are noisy.
We then examine entry, and find evidence for significant additional entry in reformed
states, particularly by Telcos. While raw summary statistics suggest about 13.3% more
communities in reformed states experienced entry, controlling for demographic and mar-
ket characteristics in a linear propensity model, we find a DID excess entry rate between
7.95% and 13.8% in the reformed states.
Our findings carry implications for related theoretical literature. As we discuss in
4“Basic” cable service, also referred to as the basic service tier (“BST”), is the minimum level of cable televisionservice that must be taken by all cable television subscribers. The content of basic cable service varies among cablesystems but, pursuant to the Communications Act, must include all local television signals and public, educational, andgovernmental access channels and, at the discretion of the cable operator, may include other video services. ”ExpandedBasic” cable service, offers additional video channels on one or more service tiers (FCC 2009, p. 12).
3
Section 3, the theoretical predictions about the effect of a reduction in costs of entry
vary across models, as discussed in detail in Sutton (1991). E.g., in a model where
potential entrants expect Bertrand competition in the second stage after entry, they
would not enter and the incumbent would not change behavior, so long as sunk costs
of entry are greater than zero (which is likely the case in our context, as entry requires
considerable capital investment, even if the reforms reduce some costs associated with
negotiating local franchises). In other models (e.g. a model where the post entry behavior
is expected to be Cournot competition) there is indeed entry, and post-entry prices are
lower than under monopoly. The baseline results on price, and more importantly on
entry, suggest evidence against the Bertrand model and potentially in favor of the other
models.
In this context, an interesting question is whether we should expect any price declines
without actual entry occurring. The models in Sutton (1991), do not explicitly address
this question, but do predict declines only post-entry. Milgrom and Roberts (1982a)
show that in a world with perfect information, cutting prices prior to entry does not
deter entry, and hence such “limit pricing” behavior would not be a rational equilibrium.
However, in a world with asymmetric information (Milgrom and Roberts, 1982b) or with
switching costs (Klemperer, 1987), incumbents may lower prices before entry to signal
lower costs or to lock up consumers, and hence discourage entry.
We examine whether there is evidence for ex-ante price declines, by excluding com-
munities which experienced actual entry from the sample. We find that indeed there is
evidence for incumbents cutting price in response to just the enhanced threat of entry:
communities without entry have a greater price decline of 6.57% for “Basic” service, in
reformed states relative to non-reformed states.5
Building on this finding that it was the threat of entry that lead to price declines,
we devise a sample-split (triple difference) test that controls for potential state-level
correlated shocks. In particular, we examine communities in counties where a major
overbuilder is present.6 Incumbents here are likely to face a greater threat of entry, as
cable overbuilders are more inclined to enter into neighboring communities (RCN 2005
Annual Report, Seamans 2013). We find that there is indeed a greater DID decline in
price in communities close to a major overbuilder; this decline is about 10.6% and sta-
tistically significant for “Basic” service, and equally large (10.2%) but statistically less
significant for “Expanded Basic” service. Interestingly, we find very large and statis-
tically significant increases in number of subscribers for both “Basic” and “Expanded
5Interestingly, comparing communities where there was actual entry, we see no significant differences betweenreformed and non-reformed states. This is unsurprising as we expect no differences between reformed and non-reformedstates conditional on entry. In fact this result is reassuring, as it suggests omitted variables were not driving generalprice declines in reformed states.
6As discussed in FCC (2009, p. 15, footnote 97), the term “overbuild” describes the situation in which a secondcable operator enters a local market in direct competition with an incumbent cable operator. In these markets, thesecond operator, or “overbuilder,” lays wires in the same area as the incumbent, “overbuilding” the incumbent’s plant,thereby giving consumers a choice between cable service providers.
4

Basic” services consistent with the observed price cuts, in communities close to the ma-
jor overbuilder. To the extent that potential omitted shocks, due unobserved demand
(e.g., due to differential entry by Satellite TV ) or cost (e.g., due to local cost inflation
not captured by local income or wages included in baseline controls) shifters do not vary
across locations within a state, this sample-split result suggests that reforms did indeed
cause changes in incumbent behavior, consistent with the models that predict ex-ante
price responses (such as Milgrom and Roberts 1982b or Klemperer 1987).
Our study contributes to the small literature discussing the effect of cable franchising
deregulation (Spiwak 2006, Schneider 2007, Bohanon and Hicks 2010). To the best
of our knowledge, our study is the first to systematically examine the effects of cable
franchise deregulation on prices and entry using comprehensive national microdata, and
hence the first to document systematic declines in prices and increased entry in reformed
states. The cable industry provides an interesting setting for empirical work because there
are numerous geographically separated markets. Our work also relates to the broader
literature in Industrial Organization that has exploited this setting to examine various
aspects of the cable market including effect of vertical integration between programming
and distribution (Chipty 2001), welfare effects of bundling (Crawford 2008 and Crawford
and Yurukoglu 2012), and welfare effects of new products (Goolsbee and Petrin 2004).
In a related policy evaluation paper, Crawford (2000) examined the effects of the 1992
Cable Act, which was aimed at protecting consumers from price increases. Crawford
found that intended price declines failed to materialize and observed system responses
yielded no change in consumer welfare. In contrast, our results suggest some welfare
gains, albeit modest on average, for consumers of the “Basic” service tier.
Because we find ex-ante price responses by incumbents to the increased threat of
entry, this study also relates to the empirical literature on ex-ante reductions or limit
pricing. Although a number of studies have examined ex-post responses by incumbents
to entry (Yamawaki 2002, Simon 2005, McCann and Vroom 2010), relatively few have
examined ex-ante responses. In recent work, Goolsbee and Syverson (2008) find that
incumbents respond to the threat of entry by a low-cost competitor (Southwest) by
preemptively reducing prices. In work related to ours, Seamans (2013) examines limit
pricing behavior in cable TV markets. Seamans notes that limit pricing in the Milgrom
and Roberts (1982b) model hinges on the presence of asymmetric information; with
perfect information, ex-ante price reductions are not optimal. Using a novel measure
that captures variation in asymmetric information between incumbents and new entrants
across markets, he finds that limit pricing behavior is indeed more strongly prevalent in
markets with greater degree of asymmetric information. Our work differs in that we focus
on inter-temporal variations in barriers to entry introduced by reform of local franchising
regulations. In addition to testing for the presence of limit pricing, our objective is also
to undertake an evaluation of this important policy reform.
The paper proceeds in eight sections. Section 2 provides background on the industry,
5

regulations, and the state-level reforms that are the focus of this study. Section 3 lays out
the theoretical underpinnings for our empirical analysis, while Section 4 introduces the
data. Section 5 presents our analysis of the effect of reforms on prices. Section 6 examines
actual entry following the enactment of these reforms, and examines whether incumbents
responded to increased threat of entry. Section 7 presents the sample-split test examining
communities adjacent to major overbuilders. We discuss results and conclude in Section
8.
2 Industry Background, Regulatory Framework and Re-forms
2.1 Industry background
For studying the effect of changes in entry barriers, an attractive feature of cable TV mar-
kets is their localized nature, which allows for considerable variation in the competitive
settings across geographic markets. These local markets are defined by the “franchise”
boundary of the incumbent system; typically the boundary is the geographical boundary
of the city in which the incumbent system is based. This effectively segments the US
into thousands of non-overlapping geographic markets.
Historically, a single incumbent cable TV system served each local market. In their
2009 annual report, the Federal Communications Commission notes that: “Relatively
few consumers have a second wireline alternative, such as an overbuild cable system”
(FCC 2009, p. 5). An earlier FCC Report on Cable Industry Prices (FCC 2005) found
that cable television service was provided in 32,510 “non-competitive” communities while
there were only approximately 400 communities with competitive wire line “overbuilds”
(i.e., with more than one operator in the market) (Braunstein, 2006).
While in theory competition from Direct Broadcast Satellite (DBS) could have limited
the amount of pricing power enjoyed by cable TV incumbents, this appears not to have
been borne out in practice (for the period of our study). An assessment by the FCC
in 2009 noted that “... in the large number of communities in which there has been a
finding that the statutory test for effective competition has been met due to the presence
of DBS service, competition does not appear to be restraining price as it does in the
small number of communities with a second cable operator”.7,8
Traditionally, one reason proposed for why most markets remain monopolies (in terms
of wired cable service) is the potentially significant economies of scale in providing cable
7Source: http://www.fcc.gov/Daily Releases/Daily Business/2009/db0116/DA-09-53A1.txt. Accessed on01/12/2012
8Because barriers to DBS entry were related to geographical factors (Goolsbee and Petrin 2004), we do not expectentry rates to be correlated with reforms in a way that would bias our results. Nevertheless in Section 7 below, wediscuss a sample-split (triple difference) approach that could control for shocks correlated with the reforms such ashigher DBS entry into reformed states.
6

service and the large investments required for laying coaxial cable to the homes of con-
sumers. However, Owen and Greenhalgh (1986) argue that economies of scale are not so
large as to rule out the possibility that competition, either direct or potential, can serve
as a significant disciplinary force in the marketplace. More recently, Kelly and Ying find
that “average cost savings with respect to a monopoly were fairly small, ranging from
1.37% with a 10% market overlap to 5.05% with a complete overbuild” (Kelly and Ying,
2003, p. 962). Another significant factor contributing to the persistence of local monop-
olies has been local “franchising” regulations (FCC 2006, FCC 2009), which have acted
as a significant barrier to market entry. We discuss these local franchising regulations in
the next section.
2.2 Franchising regulation of cable service providers
Cable companies have been traditionally regulated at the local level. To obtain permission
from local government authorities to operate in a market, firms are required to agree to
a number of terms as part of a “franchise” agreement. Local governments use these
agreements to achieve multiple goals including raising revenue, providing access to cable
TV equitably in the community, and minimizing disruptions from laying of cable. In
particular, some of the key terms relate to:
• Franchise fees: Franchise fees to be paid annually typically amount to 5% of the
revenue received by cable companies. These can be important sources of revenue
for local governments.9
• Build-out provisions: The desire of local governments to provide access to consumers
everywhere within their service jurisdiction generally leads them to prescribe build-
out requirements where entrants are obligated under the franchise agreement to
cover the entire service area within a prescribed span of time.
• Public, Education, and Government (PEG) channels to be carried on the service.
• Service networks to government and educational buildings (I-Net).
• Local agency control over public rights-of-way permits: These terms aim to minimize
disruptions that would result from uncoordinated digging up of roads and walkways
by cable companies.
• Consumer protection through customer service standards and enforcement.
Per the FCC (FCC 2004 - 2005, FCC 2009), the local franchising process imposes signif-
icant barriers for potential wireline entrants. In his study, Hazlett (2007) concludes that
the local permitting process delays competitive entry, and depending on the nature of the
9A government committee report (Joint Study Committee, 1998) in Georgia documented that for the 525 govern-mental units studied, cable franchise fees represented an average of 6.66% of total tax revenues. The most recentestimate for franchise fees paid by cable operators is $3.2 billion per year, per the Cable & TelecommunicationsAssociation. (http://www.ncta.com/Statistics.aspx Accessed on 10/12/2012)
7

administrative process and the terms and conditions imposed on the potential entrant,
franchising may deter entry altogether.
Federal policy makers sought to outlaw anti-competitive build-out requirements and
prevent discriminatory pricing that limit competition, through the Telecommunications
Act of 1996. However, because municipal franchising agents were granted immunity
from damage awards, there is no effective remedy if regulators impose unreasonable
build-out requirements, or fail to enforce uniform pricing rules. An FCC (2007) report
found that the franchise process was being manipulated so that “new entrants eager to
provide video service are often delayed, and in some cases derailed, by the unreasonable
demands made by local franchising authorities.” This report reiterated the findings in
an earlier FCC (2006) order, where the Commission concluded that: “the operation of
the local franchising process in many jurisdictions constituted an unreasonable barrier
to entry...” The FCC (2006) order discusses several ways by which local franchising
authorities were unreasonably refusing to award competitive franchises. These include
drawn-out local negotiations with no time limits; unreasonable build-out requirements;
unreasonable requests for “in-kind” payments that attempt to subvert the five percent
cap on franchise fees; and unreasonable demands with respect to public, educational and
government access (or “PEG”) channels.
2.3 Reforms of cable franchising regulation
Given the reality of limited competition in the cable industry, there have been a number
of attempts at both the state and federal level to enhance competition (Spurgin 2008).10
These have often taken the form of limiting local government’s ability to regulate com-
petitive cable operators and allow for the possibility of issuing statewide or nationwide
cable franchises to companies interested in providing cable service, whether they be cable
companies or telephone companies.
Although no federal action for nationwide franchising has been taken to date, twenty
three states have reformed their franchising process to allow for statewide franchises. Such
laws pre-empt the need for new entrants to negotiate individual franchise agreements with
local municipal authorities, and give them the authorization to launch services anywhere
in the state following approval of the state-wide franchise application.
Table 1 shows the status of franchise reform in all 50 states, along with the year of
passage for all states that have reformed their franchising process. Four states, Alaska,
Hawaii, Rhode Island and Vermont, had state franchising laws in place prior to 2005;
nineteen states passed similar laws between 2005 and 2008.
For the states that have passed state-wide cable television/video franchise laws, Spur-
gin (2008) provides a general comparison of key provisions (see Table A1 in Appendix)
including variations in the franchise fees, requirements on provision of Public, Educa-
10This section draws from Spurgin (2008).
8

tional, and Government Access (PEG) channels, controls on Right of Way, and build-out
requirements by state. We supplemented Spurgin (2008) by a review of the legislative
bills; based on our review, we re-classified Virginia as “not reformed”, as the legislation
for the state did not include a provision for a single state-wide franchise. Also, we con-
firmed passage of the law for Louisiana, where the legislation was pending per Spurgin
(2008).
A number of states set up separate commissions specifically charged with overseeing
the new state franchises. Franchise fees for new service providers with a state-issued
franchise are set by most states to be equal to incumbent fees, with a maximum amount
typically being five percent of gross revenues. Build-out requirements under state fran-
chise laws are generally less stringent than under local franchise agreements. Very few
bills to date have included build-out provisions, and those that do are heavily qualified.11
Given that the critical provisions (relating to granting a state-wide franchise to the
applicant, equating of franchisee fees between entrants and incumbents, and relaxation of
build-out requirements) are similar across the different reformed states, in our analysis we
treat the reforms as a dichotomous variable. As noted before (in footnote 1), incumbent
cable companies lobbied strongly against franchising reforms, while telecom companies,
specifically Verizon and AT&T, worked to support these legislations.
As discussed earlier, there is little work systematically examining the effect of the
reforms on prices and entry across all reformed states. Bohanon and Hicks (2010) examine
the effect of franchising reforms on number of broadband connections using FCC data,
and they find an increase in broadband subscriptions following the reforms. Anecdotal
evidence on the effect of reforms in particular states has been mixed with some reports
of reduced prices after entry (e.g., Spiwak 2006 (Texas), Schneider 2007 (Wisconsin) and
Rogers 2008 (Michigan)), and other reports of no decline in prices (e.g., Kreucher 2008
(Michigan) and Barrett 2008 (Wisconsin)).
3 Theoretical Background
We view the enactment of reform that allows for the award of a single state-wide franchise
as reducing the barriers to entry in the market for cable TV services, by reducing the
exogenous, sunk costs associated with entering each local market.
In a large class of models, reduced (sunk) entry costs could lead to more entry in
equilibrium which then puts downward pressure due to post-entry competition (e.g.,
in the Cournot or Monopoly model in Chapter 2 of Sutton 1991). However, as Sutton
(1991) discusses in Chapter 2, this result hinges on assumptions about the nature of price
11Most state laws that provide for a state-wide franchising authority allow existing local franchise agreements toremain in effect until a new service provider with a state-issued franchise begins offering service in a community. Manystates allowing existing franchises the option to terminate the local franchise and replace it with a state franchise; somerestrict this option to when wireline competition is present.
9

competition in the post-entry stage. He shows for example that assuming homogenous
products and Bertrand competition in the second stage, a reduction in entry costs does
not necessarily attract new entry, as entrants anticipate price to equal marginal cost
post-entry in the second stage, and this completely deters entry. In fact in the Bertrand
model, changes in exogenous sunk entry costs have no effect on the pricing behavior of
the incumbent, as they charge the monopoly price as long as entry costs are non-zero.12
In contrast to the models in Sutton (1991), in the presence of asymmetric information
about incumbent’s costs (Milgrom and Roberts, 1982b) or switching costs (Klemperer
1987), the theoretical literature suggests incumbents may change pricing behavior in
response to an increased threat of entry, even before actual entry occurs, as a means to
try and deter entry.13 In Milgrom and Roberts (1982b), incumbents may lower prices to
signal lower costs; because lowering prices is a costly signal, it constitutes a credible signal
to potential entrants. It should be noted that, as Milgrom and Roberts (1982a) show,
cutting prices prior to actual entry is not a rational strategy to deter entry (or drive out
rivals) in a world of complete information (and no switching costs). Potential entrants
would realize that prices are being held artificially low in order to ward off entry but then
once entry does take place, it is sub-game perfect for the incumbent to accommodate
rather than to predate. In other words, as long as the established firm’s pre-entry price
does not affect post-entry demand or cost (and hence profit), limit pricing would not
influence the potential entrant’s decision to compete in the market. Thus the asymmetric
information assumption in Milgrom and Roberts (1982b) is crucial to get rational ex-ante
price cuts to deter entry. Asymmetric information could be relevant in our context due to
cross-industry differences between Telco entrants and cable incumbents, or participation
in industry R&D consortia (as discussed in Seamans 2013).14
Klemperer (1987) provides another justification for ex-ante price cuts – in his model
lower prices helps to “lock-in” more consumers, who are harder for the entrant to attract
because of switching costs. In our context, there may be switching costs for a few reasons.
One, it was not unusual for companies to offer one and even two-year contracts, with
an early termination fee. Two, even without early termination, switching could involve
upfront installation fees. Also, lack of experience with the new service provider may yield
a psychic switching cost due to potential concerns about service quality and customer
12Also with product-differentiation, different models yield different predictions about the equilibrium number offirms in the market after reduction in entry costs. In the Hopenhayn (1992) class of industry equilibrium models, theeffect of reduced sunk costs of entry on the mass of survivors is ambiguous (Balasubramanian and Sivadasan, 2009),but the cutoff productivity level increases and consequently, the equilibrium rate of entry (and exit) goes up.
13 The idea of ex-ante limit pricing goes back to Bain (1949), who suggested that there may be a positive relationshipbetween the initial price and the degree of entry - an incumbent firm may select lower than the profit maximizing pricein order to deter entry by competitors.
14Seamans (2013) argues that variation in membership in CableLabs, an industry R&D consortia restricted to cablecompanies, is an important source of asymmetric information, and exploits that in his study. We checked and foundthat all three of the biggest overbuilders, and nine of the top 10 overbuilders in our data are not members of CableLabs.In fact, per its website, CableLabs has a fairly exclusive membership list of just 28 cable companies in the U.S., whereasour data includes about 1,200 cable operators.
10

support. In both Milgrom and Roberts (1982b) and Klemperer (1987), reducing prices is
costly for the incumbent and so it follows that incumbents may be more likely to reduce
prices the stronger the threat of entry.
To summarize, the effect of reduction in entry barriers on actual entry as well as pricing
behavior of the incumbent is theoretically ambiguous with at least one model (Bertrand
competition model in Sutton 1991) suggesting possibility of no effect on prices or actual
entry. Other models suggest actual entry and consequent decline in prices (Cournot
competition model in Sutton 1991) while others predict price declines without actual
entry (Milgrom and Roberts 1982b, or Klemperer 1987). Given the varying predictions
across different models, the cable reforms provide an interesting context to empirically
investigate the effects of a reduction in entry barriers, specifically whether: (i) prices
were affected, (ii) whether actual entry occurred, and (iii) whether there was evidence
for ex-ante price reductions (as predicted by Milgrom and Roberts (1982b) or Klemperer
(1987)).
4 Data and Summary Statistics
The data on cable television service offerings comes from seven years (2004 - 2010) of
the Warren Publishing’s Television and Cable Factbook. The Factbook data is the main
source of cable TV system level characteristics used in most empirical studies of the
industry (e.g. Rubinovitz 1993; Goolsbee and Petrin 2004; Della Vigna and Kaplan
2007; Seamans, 2013).15 This rich data set includes information on monthly prices and
installation fees, the number of consumers subscribing to the various tiers of service and a
listing of the specific channels that are available on each tier of service for each individual
cable system. It also classifies each system as either “Operating” or “Overbuild” where
the latter term refers to a competing cable operator building a cable network system in
an area already serviced by an existing cable operator. Finally, it also provides us the
names of the communities which are served by each cable system.16
In addition to data regarding the service offerings, we obtain controls for demographic
variables that might affect either the demand for cable television service or the cost of
providing cable television service or the likelihood of market entry by a competing service
provider. We draw on Savage and Wirth (2005) to select relevant control variables; in
particular, the demographic controls include per capita income (and its square), popula-
15It is also used extensively by the FCC. Justifying the use of data from this source, an FCC report says: “Warrencollects its data directly from cable television operators or individual cable systems to create a large database of cableindustry information. Warren states that it is the only research entity that directly surveys every cable system at leastonce every year, providing the most complete source of cable data. In fact, the cable systems represented in Warren’sdatabase serve 96% of all subscribers nationwide.” (FCC 2009, p. 198).
16For example, the cable system in Kalamazoo, Michigan serves not just the city of Kalamazoo but also towns inthe adjoining area such as Alamo Township, Pavilion Township and Comstock Township. The Warren’s data includesthe names of the principal community (in this case, Kalamazoo) as also the names of adjoining communities served bythe cable system (in this case, Alamo Township, Pavilion Township, and Comstock Township).
11

tion density (and its square), local wage in the “Information” sector (NAICS code: 51)),
age profile of the population, and growth in number of housing units. Data on these
demographic variables is available at the county level. Additional information regarding
data sources is provided in the Data Appendix.
Table 2 and Table 3 present summary statistics. Table 2 gives a snapshot of the
number of communities served for each year splitting the sample into the three differ-
ent categories based on whether the state enacted franchising reforms, and when those
reforms were enacted. Generally the boundaries of a cable community correspond to
that of a municipality, though there may be multiple cable communities within a single
municipality and vice versa. As Table 2 indicates, there are approximately 30,000 cable
communities in the U.S. each year.17
Summary statistics at a similar level of disaggregation on price of “Basic” and “Ex-
panded Basic” tiers of service is presented in Table 3. As the fourth row of Table 3
suggests, the average price for “Basic” and “Expanded Basic” services stand at $18.98
and $42.02/month for the entire sample period, when averaged across all states. Also,
a simple difference in means shows that the increase in average price for “Basic” service
was 8% lower in the states that reformed between 2005 and 2008; these states move
from an average price 46 cents above, to an average price 26 cents below, that for the
non-reformed states. The average price for “Expanded Basic” service moves in tandem
in both the states that underwent reform between 2005 and 2008 and the non-reformed
states. These aggregate differences in means presage the results we find with more careful
regression estimates below.
To examine entry by Telcos, we also hand collected data on locations served by Verizon
and AT&T; this data is described in more detail in Section 6 below.
5 Effect of Franchising Reforms on Prices
5.1 Empirical methodology
The staggered introduction of the reforms across different states allows us to adopt a
difference-in-difference approach to estimating the effect of the franchising deregulation.
As is standard, we compare the difference in outcomes after and before the intervention for
communities affected by the deregulation (the “treated” group) to the same difference for
unaffected communities (the “control” group) (Bertrand, Duflo, and Mullainathan, 2004).
We look at the longest period possible from 2004 through 2010, based on availability of
data. However, this period is also convenient for us since 2004 corresponds to a date
when none of the states, barring four (Alaska, Hawaii, Rhode Island, and Vermont) had
17The number of communities in the Warren’s data change from year to year, with a broad trend of decline in thenumber of communities. Warren’s informed us that this was due to consolidation of communities. As part of ourrobustness checks (in section 5.4), we verify that baseline results hold for a balanced panel sub-sample of communitiespresent throughout the seven year sample period.
12

passed such state-wide legislation and by end-2008, an additional nineteen states had
reformed their franchising process giving us at least two years after the enactment of
reform to study its effects.
In order for us to make an apples-to-apples comparison across different tiers of service
(and as is standard, e.g. in FCC reports on the industry), we look at two tiers of service
individually - the first tier, “Basic” and the second tier, “Expanded Basic” - prices for
which are reported separately in the Warren’s data. Subscribers must purchase “Basic”
service in order to subscribe to “Expanded Basic” service or to any other tier, or to buy
premium programming such as HBO. To be clear, we define price of “Expanded Basic” as
the total price charged to consumers who subscribe to “Expanded Basic” service, so this
incorporates the price for the included “Basic” tier as well. In our data about 77 percent
of cable subscribers take both “Basic” and “Expanded Basic” services; the remaining 23
percent take “Basic” service only. Because these two tiers of service make up well over
two-thirds of the revenue derived from all tiers of TV programming (FCC 2006 p. 19,
FCC 2009 p. 23), we focus on just these tiers for our analysis.
We use the following standard difference-in-differences specification (see e.g., Angrist
and Pischke, 2009, Chapter 5), allowing for a different effect in the year of the reform:
pijst = α+ β1.R0st + β2.Rst + β3.Xit + β4.Yjt + fs + ft + εist (1)
where pijst is the log of price for community i in state s at time t for the service offered
by company j for a particular service tier. Price varies by service tier and is logged,
following other research on pricing (e.g., Yamawaki, 2002; Seamans, 2013). R0st is a
dummy for year-of-reform which is set to 1 if state s introduced reforms in year t. Rst is
a post-reform dummy which is set to 1 if state s had reformed in a year prior to year t.
fs and ft are state and year fixed effects.18 The most parsimonious specification includes
only these covariates in the analysis.
We then enrich our analysis by introducing more controls. We first introduce time-
varying demographic controls for community i at time t in Xit. These include variables
that can affect the prices of cable service either by altering the demand from consumers
(such as per capita income) or the costs to provide cable service (such as population
density) or by altering the likelihood of market entry by competitors in that community
(such as the growth rate of households) and local wage (for employees in the “Informa-
tion” industry (NAICS code: 51)) which controls for shifts in cost due to wage inflation
(Savage and Wirth, 2005). Thereafter, in Yjt, we also introduce variables corresponding
to the characteristics of the cable company providing service in that community, viz. the
number of subscribers it has at the national level, the share of subscribers it has at the
state level and, its vertical affiliation with a content service provider. These variables are
18State level fixed effects generally yielded more conservative estimates and we use this as the baseline specification.Results using alternative levels of fixed effects, such as county fixed effects, or community fixed effects are presentedin the robustness checks (See Section 5.4).
13

aimed at controlling for economies of scale, market power, and economies of scope in the
provision of cable TV service.
Finally, in our strictest specification, to control for changes in composition or quality
of service we introduce the log of number of channels offered on that tier of service as an
additional control variable. In particular, this control ensures that any observed change
in prices are not offset by changes in the number of channels included in the service.19
εist is the residual error term which accounts for all unobserved cost/demand shifters
affecting prices. The identification assumption in the DID approach is that shifts in the
unobserved variables is similar across states (so picked up by year effects) or fixed within
states (so picked up by state fixed effects). We explore robustness to introducing more
detailed fixed effects in Section 5.4 below.
Because the reforms are introduced at the state level, we cluster standard errors at
the state level to account for inter-temporal correlation in the error terms (Bertrand,
Duflo, and Mullainathan, 2004).20
5.2 Baseline Price Effects
Raw average price trends by reform status Figures 2a and 2b present the annual
average by reform status for the prices of “Basic” and “Expanded Basic” services over
the period 2004 - 2010 respectively. Figure 2a shows that “Basic” prices in states that
reformed between 2005 and 2008 shows a significantly flatter trend relative to the states
that did not reform, so that the relative price levels change from a premium in reformed
states (prior to the reform) to a discount (after the reform) relative to the non-reformed
states, consistent with the mean price changes documented in Table 3. Also consistent
with Table 3, Figure 2b shows no change in relative prices for ”Expanded Basic” service
from 2004 to 2010 between reformed and non-reformed states.21 The results from the
regression analysis discussed below allows us to control for a number of factors that could
impact the simple means plotted in Figures 2a and 2b.
Regression results Panel A of Table 4 presents the results from the regression runs
quantifying the effect of reform on the monthly price of “Basic Service” and Panel B of
Table 4 presents the same for “Expanded Basic”. In column (1), there are no controls
other than state and year fixed effects. Column (2) adds in the demographic controls,
namely personal per capita income (and its square), population density (and its square),
the rate of household growth, the fraction of the population aged between 5 and 18 (as
a control for the age structure of the population) and the local wage for NAICS code, 51
19We explore robustness to additional controls for quality of service in Section 5.4 below.20We also clustered in both the state and time dimensions for our preferred specifications, following Petersen (2009).
We found standard errors are smaller than what we obtain by clustering only at the state level. Given that, to beconservative, we report results clustering on just the cross-sectional (state) dimension.
21There is a somewhat surprising increase in prices in reformed states for one year in 2008, but this reverses in 2009,so by 2010 the prices are back at same levels.
14

(Information). All of these controls are available at the county level and are introduced
in log form. In addition, we also include two additional controls for the size of the average
cable system (measured in terms of number of subscribers per cable system in the state)
and the Designated Market Area (DMA) rank. DMA rank measures the strength of
the local television market and affects demand by proxying for alternative sources of
entertainment in the local system area (Crawford, 2000). Column (3) adds controls for
the market structure, viz. the total number of subscribers the company has nationally,
the share of state subscribers for the company providing service in that community and a
dummy that is set to 1 whenever the local company is vertically affiliated with a content
service provider. Finally column (4) adds controls for the quality of service, measured in
terms of the log of number of channels. For brevity, Table 4 (and all subsequent tables)
include only the coefficients of interest corresponding to price effects in the year of reform
and in the years following the enactment of reform for the states that reformed between
2005 and 2008. Full results with coefficients on the control variables are available on
request from the authors. The specifications used in Table 4 are used through the rest of
the paper for all regressions which involve prices of either “Basic” or “Expanded Basic”
service.
Depending on which specification is used, we see that the monthly price of “Basic”
service is lower by 5.5 to 6.8% in states which have reformed their franchising process as
compared to states which have not. Given that the average price of “Basic” service in
2010 is about $20/ month (see Table 3), the percentage decline translates to a drop of
$1.10 to $1.36 per month per subscriber or $13.20 to $16.32 per year per subscriber for
“Basic” service.
In contrast to the robust evidence for decline in price for “Basic” service, we do not
observe any statistically significant change in the price of “Expanded Basic” service in
any specification in Panel B of Table 4. In columns (1) and (2), the coefficient on the
post reform dummy is close to zero; in columns (3) and (4) after addition of demographic
controls and log number of channels, the estimated coefficient turns positive but is not
significant in any of the specifications.22
In the sections below, we check robustness of the finding of a post-reform decline in
price of “Basic” service to a number of different concerns.
22It could be noted in Table 4 that the number of observations for “Expanded Basic” prices is lower, reflectingavailability of data in the Warren’s database. We checked to see if sample differences were salient in explainingdifferent results for “Expanded Basic”, by estimating results for “Basic” service on the “Expanded Basic” sample. Wefound the results qualitatively similar, with coefficient magnitudes only slightly lower - a 4.8% decline in the column(4) specification compared to a 5.8% decline in the full sample. Thus differences in the sample do not appear to explainthe differences in results for “Expanded Basic”. Also, we checked and verified that the proportion of observations for“Expanded Basic” was very similar (66% and 63% respectively) for states that reformed between 2005 and 2008, andnon-reformed states.
15

5.3 Checking for pre-existing trends
A fundamental concern in any DID analysis is the possibility that the observed mean
effects are driven by differences in pre-existing trends. In particular, a declining trend in
prices for “Basic” service in those states that reformed their franchising process between
2005 and 2008 could lead to the observed mean decline documented in Table 4. We
address this concern in two ways.
First, in Table 5, we specifically examine the trend in price prior to the reforms. The
regressions include only observations prior to the reforms, and we include dummies for
two years and one year before the reform – all other pre-reform years are absorbed into
the constant. The results reveal that, once we add in demographic controls (column
(2)), there is no significant declining trend (as the coefficients on Reform year -1 and
Reform year -2 are both relatively small and statistically insignificant). Once we add
in additional controls for market structure and number of channels (column (4)), the
magnitude of the coefficients Reform Year -2 and Reform year -1 are both very small
and statistically insignificant. Thus relative to the period prior to two years before the
reform, the price in the two years just before the reforms is within 0.2% in Reform year
-2 and within 0.7% in reform year -1, which suggests no prior declining trend in prices
of “Basic” service.
We expand on this to estimate and plot coefficients on an index relative to year of
reform, as suggested in Angrist and Pischke (2009, Chapter 5). In particular, we estimate
the following regression:
pijst = α+5∑
k=−4λk.Rk
st + β3.Xit + β4.Yjt + fs + ft + εist (2)
where all the variables are as defined in (1), and index Rkst equals one if state s in year t is
k years from the reform for states that reformed between 2005 and 2008; for example, for
California which reformed in 2007, R−2st is equal to one for year 2005 and zero otherwise.23
In Figure 3, we plot the coefficients λk for k = −3 to k = +4, to observe trends before
and after the year of reform, conditioning on demographic controls, market structure
variables, and the number of channels. As the figure suggests, there were no marked pre-
existing trends prior to the enactment of these reforms; in fact the trend over the period
-3 to -1 remains remarkably flat. Figure 3 also shows there is beginning of a decline in
prices in the year of the reform, and then within 3 years of the passage of these reforms,
the price of “Basic” service is significantly less than their levels prior to the enactment
of the reforms and it continues to be lower subsequently.
To see if prior trends could explain the lack of results for “Expanded Basic” service
tier, we undertook the same test as in Table 5 for this tier. The results, presented in
23For the states that reformed prior to 2005 we set the index to 20 so that they are effectively excluded from therange of indices plotted in the figure.
16

Appendix Table A4, show that there were no differential trends in “Expanded Basic”
price in the pre-reform period in reformed states relative to non-reformed state. In fact,
the differential effects are very small, less than 1.6% across all the different specifications.
5.4 Decline in prices for “Basic” service: Robustness checks
In this section, we check robustness of the finding that prices declined for “Basic” service
to a number of alternative tests. Results for tests RC1 to RC7 are summarized in Table
6; results for the remaining tests are presented in Appendix tables.
RC1: Alternative controls for service quality The observed reduction in price is
economically meaningful only if it was not offset by reduction in the quality of the service
offering. In column (4) of Table 4, our specification includes the log of number of channels,
which controls for adjustments in terms of addition or deletion of channels. However,
cable operators could respond by dropping more popular channels and adding less popular
ones, so that the quality of offering declines while the total number of channels stays the
same (e.g., Crawford (2000) finds that cable operators changed composition of offerings
in response to the 1992 Cable Act). To address this concern, in rows 2, 3 and 4 of Table 6,
we include alternative measures to control for changes in composition of “Basic” service.
In row 2, we include log of the number of channels that are distributed nationally to
systems via satellite (also known as satellite channels), in row 3 we include log of the
number of channels that are within the top 10 most popular channels, and finally in
row 4 we include log of the number of channels that are within the top 20 most popular
channels.24 We find the baseline results to be robust; in fact in row 3 and 4, including
controls for the top 10 and top 20 channels yields stronger results, suggesting that the
composition changes in programming quality in reformed states may have reinforced,
rather than offset, the decline in prices.
RC2: Including Installation Charges The economic significance of the observed
decline in prices, particularly for new consumers switching into cable, could be affected
by concurrent changes to installation fees. To check whether changes to installation fee
offset the decline in monthly price, we look at the net price of receiving “Basic” service
in which we amortize the installation fees over a 12-month period and add that to the
monthly price. Results for net price of receiving service are presented in row 5 of Table
6. While the price drop reduces slightly, it remains statistically significant and ranges
from 4.6 to 5.6%. It appears that installation fees increased slightly in reformed states,
24Satellite channels include some of the most easily recognizable names in cable, such as MTV, CNN, and ESPN.The list of most popular channels is drawn from Crawford and Yurukoglu (2009) which in turn, is based on ratingsfrom Nielsen Media. For Nielsen Media, the ranking of channels is based on the national average cumulative ratingfor that channel during the fourth quarter of 2006; given that we have data from 2004 to 2010, this corresponds toroughly the mid-point of our sample period.
17

but note that because the average cable consumer is likely to have her installation for
a period that is longer than 12 months, amortizing installation fees over a 12-month
period is likely to understate the decline in prices brought about by the reforms in these
specifications.
RC3: Long Differences If there is some lag in the response to the reforms, or if
incumbents changed behavior prior to the reforms once passage of the law became more
certain, then the DID regressions could give smaller estimates than the true long-run
effects of the reforms. To get at the more long-run effects, we use a long difference ap-
proach (similar to Donohue and Levitt, 2001). In particular, we rerun baseline regressions
including only data for the starting and ending years of the sample, i.e. for 2004 and
2010. As expected (and consistent with the pattern in Figure 3), the estimates in row 6
of Table 6 are uniformly larger, ranging between 7.5 - 9.8% suggesting that the longer
run impact of these reforms may be larger than the about 6% estimate we find in our
baseline analysis.
RC4: Balanced panel The results thus far have been estimated on all available data.
Because of consolidation of cable systems over the years, there are fewer cable systems
in the later years of the sample, so that the panel in the baseline analysis is unbalanced.
To ensure results are not driven by compositional effects, we examine robustness to using
a balanced panel of communities that were present in all seven years of the data. The
estimates (in row 7 of Table 6) yield somewhat stronger results (a decline of about 7%
in column (4)) relative to the baseline.
RC5: Alternative fixed effects The baseline regression include state fixed effects in
every regression, as the effects of state-level reforms are identified off cross-state and time
variations, and hence the main omitted variables that concern us are state-level variables.
Nevertheless, we explore alternative specifications in which we introduce county fixed
effects (in row 8) or cable system fixed effects (identical to principal community fixed
effects, in row 9) or community level fixed effects (in row 10 of Table 6). Across all these
alternative specifications, we continue to see a drop in the price of “Basic” service by
approximately 6%.
RC6: Principal communities only The Warren’s data includes information on all
communities served by a cable head-end, with the location of the cable head-end desig-
nated as the principal community. Because in non-reformed states and in reformed states
prior to the reform the local franchising regulations operate at the community level, our
baseline analysis uses observations on all communities. In this robustness check, we
exclude all these communities that are served by the same cable system and limit our
analysis only to the principal communities where the cable head-ends are located. Even
18

though this causes our sample size to drop to about 20% of the original sample size, our
results hold with somewhat smaller magnitudes with this sub-sample as well (in row 11
of Table 6).
RC7: Alternative control groups In the baseline analysis, we have included the
four states which reformed prior to 2005 (Alaska, Hawaii, Rhode Island, and Vermont).
Although we allow the effects for these states to be different in the post reform period
in the baseline analysis, we explore the robustness of our results to excluding these four
states altogether (in row 12 of Table 6), and find the estimates similar to the baseline.
Further, in the baseline, the control group of non-reformed states includes the states
of Alabama, Utah, and Virginia which have laws on their books prohibiting municipal
electric utilities (MEUs) from cross-subsidizing their entry into the cable TV business.
As Seamans (2012) shows, incumbent cable systems located in such states are less likely
to upgrade equipment even though they may face entry from a municipal entrant because
the latter are legally prevented from cross-subsidizing entry into the cable TV business.
In order to preclude the results from being affected by these states, we exclude these
three states from the analysis (in row 13 of Table 6), and find that the results are largely
unchanged.
Finally, the control group of non-reformed states includes the states of Alabama,
Kentucky, Minnesota, New Hampshire, and Oklahoma which have “level playing field”
laws on their books. As Hazlett(2007) argues, these level playing field laws impose
far harsher costs on competitors than the incumbent and have the effect of forestalling
competitive entry into the local cable market. Because we expect the existence of such
laws on the books to impact the price of cable service in such states, we examine the
robustness of the results to the exclusion of these states from the control group (in row
14 of Table 6) and find the results to be similar to baseline.
RC8: Falsification test using Electricity prices It could be the case that the
price declines for “Basic” service is driven by relatively larger price declines in these
states due to other reasons, or because of increases in prices in the non-reformed states
(driven by say increases in income or changes in business climate in ways not captured
by our demographic controls). To address this concern, we conduct a falsification test
in which we consider the change in the average electricity prices paid by residential,
commercial, and industrial consumers over the same period of time from 2004 to 2010
across all 50 states. If other shocks were negatively impacting prices in reformed states,
or positively impacting prices in non-reformed states, then that should also be reflected
in the electricity prices paid by residential, commercial, and industrial consumers. As the
results in Appendix Table A2 show, we find no evidence for a relative decline for either
residential, commercial or industrial electricity prices. In fact, the coefficient on the Post
Reform dummy is positive, very small (less than 1%) and statistically indistinguishable
19

from zero in all the four specifications of this table.
RC9: Effect on number of subscribers In Appendix Table A3, we check if observed
price declines led to increases in the number of subscribers for “Basic” service. The results
suggest an increase in the number of consumers who subscribe to just the “Basic” tier
which is consistent with the observed price decline. However, the effect is not statistically
significant. There appears to be a greater magnitude of increase (7.4%) in column (3),
but this appears to be explained partially by changes to number of channels, as the
magnitude declines to 2.8% in column (4). Also, it appears that during the same time,
despite no evidence of a decline in price, there is a statistically insignificant increase in
subscribers to “Expanded Basic” service as well.
Robustness checks for price of “Expanded Basic” service To see if the finding
of a null effect on the price of “Expanded Basic” was robust, we also undertake all of
the checks RC1 to RC7 for “Expanded Basic”. Results are presented in Appendix Table
A5; we find the null effect result for “Expanded Basic” remarkably robust across all the
different checks.
6 Role of Entry
The stated objective of the reforms allowing for franchising at the state level was to
increase the incidence of competition in the localized cable television markets and bring
lower prices to consumers.25 However, as discussed in section 3, the theoretical effect
of lowering of entry barriers in this context is ambiguous, given that entry still required
significant upfront (sunk) investments, especially for the “last-mile” connections to resi-
dences (e.g., see Wagter (2010)). In particular, in a model with Bertrand price competi-
tion in the second stage (Sutton, 1991, Chapter 2), rational firms would not enter as long
as upfront costs are greater than zero, as they anticipate zero profits in the post-entry
stage. Thus, whether actual entry occurred is an interesting empirical question.
In this section we examine two questions. First, in Section 6.1, we examine whether
the reforms spurred greater entry, especially by Telcos, who lobbied for the passage of
the reforms in many states. (e.g., see news articles by Sher (2008) and Haugsted (2006)).
Second, in section 6.2, we examine whether observed baseline price results were driven
by post-entry price declines, or whether there is evidence for ex-ante price declines even
without entry (as predicted by Milgrom and Roberts (1982b) or Klemperer (1987)).
One hurdle to studying entry is that data for Telcos offering TV services is not included
in the Warren’s database. Therefore, data on these companies had to be hand-collected
25E.g., Governor Jon Corzine, the then Governor of New Jersey’s statement when signing the relevant bill stated:“The power of competition can improve quality and lower prices. Under the legislation signed today authorizing newcable franchises, New Jersey cable television customers will soon see the benefits of competition.” (U.S. Fed News,August 2006)
20

separately. We focused on the two major players – AT&T and Verizon – as these two
together accounted for over 90% of the marketshare of Telcos in the Cable TV market
2010 according to the Frost & Sullivan online database.26 There are two limitations
of this data. First, we are able to reliably assess the presence of AT&T and Verizon
only at the county level and not at the individual community level. Thus, to the extent
that some communities within a given county were not served by these Telcos, our data
overstates entry at the community level. However, because this measurement error is
unlikely to be correlated with reform status, we do not expect this to bias our estimates
of the effect of reforms on entry. Second, we were only able to obtain data on presence of
AT&T and Verizon in 2010. Because we know that TV service was launched by Verizon
in late 2005 (Reardon 2005b), and AT&T in early 2006 (Reardon 2006), we can bound
the entry dates as being between 2005 and 2010. In our analyses, we check robustness
to assuming alternative entry dates for these Telcos.
6.1 Reforms’ effect on entry
To find out whether the reforms lead to greater entry by cable companies or Telcos, in
Table 7a we examine the fraction of communities with either form of entry in 2004 and
2010. As the last column indicates, there was significantly more entry in the states that
reformed between 2005 and 2008 (39.1%) relative to the non-reformed states (25.8%).
Columns (7) and (8) show that bulk of the entry, as well as the source of the difference
between reformed and non-reformed states come from Telcos. Per column (7), there was
only modest new entry by cable operators (2.3% overall) between 2004 and 2010, and
the difference between recently reformed states and non-reformed states while positive
was only modest (2.4% versus 2.1%). Thus, consistent with the anecdotal evidence on
lobbying behavior of Telcos (e.g., Reardon 2005a, Haugsted 2006, Sura 2006, Sher 2008),
the reforms appear to have facilitated greater entry by Telcos in reformed states.
While these summary differences are strongly suggestive, differential entry rates could
be due to differences in trends for demographic or market structure characteristics. To
control for these factors, in Table 7b we examine a linear propensity model of entry by
either a cable overbuilder or by a Telco. As noted above, we do not have data on precisely
when either AT&T or Verizon entered a given market. In the absence of such information,
we assume in the baseline case that all of the Telco presence in 2010 occurred in 2008.
Subsequently, we also consider alternative scenarios assuming all entry occurred in 2006
(Alternative 1), 2007 (Alternative 2) or 2009 (Alternative 3). Across all scenarios, we
find significantly higher difference-in-differences entry rate in reformed states relative to
non-reformed states. The magnitude of the effect ranges from 7.95% (under alternative
3) to 13.8%(in alternative 2).
26Specifically, at the end of 2010 Verizon FiOS had 3.203 million customers, AT&T U-verse had 2.504 millioncustomers and all other Telcos combined had 0.611 million customers. That gives Verizon and AT&T a combinedmarket share in 2010 among Telcos of 90.3%.
21

Thus, based on the evidence in Tables 7a and 7b, we conclude that there was indeed
more entry in reformed states following the reforms.
6.2 Were “Basic” service price declines due to actual or increasedthreat of entry?
The results in Section 6.1 confirm that the reforms resulted in significantly greater amount
of entry in reformed states, with about 40% of communities experiencing entry by 2010
compared to 26.5% for the non-reformed states (Column (6) of Table 7a).
As discussed in Section 3, price declines following reductions in entry barriers could
arise in theory for two reasons. One, in the monopoly or Cournot models discussed in
Sutton (1991, Ch. 2), there would be price declines due to increased competition in
the post-entry stage. On the other hand, in models by Milgrom and Roberts (1982b)
or Klemperer (1987), the reduction in entry barriers could lead to ex-ante price cuts by
incumbents, as a means to deter entry (by signaling lower costs in the former model and
by locking in potential customers in the presence of switching costs in the latter).
As has been well documented, prices are indeed lower by 17% in communities which
have a competitive wireline overbuild (FCC 2009, p. 22), consistent with greater price
competition post-entry. In this context, it is interesting to examine whether our baseline
results of price decline for “Basic” service are driven by larger average prices declines
in reformed states caused by greater entry, or because of ex-ante price reductions by
incumbents in response to a greater threat of entry.
We address this question in Table 8. In columns (1) and (2), we drop all observations
on cable overbuilds; thus if these new entrants were particularly aggressive in terms of
price cuts, the exclusion of this sub-sample helps isolate the behavior of incumbent cable
operators.27 We find the results in columns (1) and (2) similar to the baseline results.
While this is not surprising given that cable overbuilds constitute only 3.5% of the sample
in 2010 (see Column (4) in Table 7a), nevertheless it suggests that incumbent pricing
behavior was indeed affected by the reforms.
We examine the more interesting question of whether there was price reduction by
incumbents prior to/without actual entry in Columns (3), (4), (5) and (6). In columns (3)
and (4), we exclude all communities that had more than one cable (i.e., wireline) service
provider. In columns (5) and (6) we exclude communities with more than one service
provider, whether those were cable (i.e., wireline) companies or either of the two major
Telcos.28 We find that effects are in fact stronger when we focus only on communities
without entry; the coefficient estimate suggests a decline of 6.57% in column (6) relative to
the baseline effect of 5.78% (in column (4) of Table 4). Note that we exclude communities
with entry from both reformed and non-reformed states; thus the results in columns (3)
27Note that our data do not include price observations for Telco entrants.28We exclude from the analysis all communities where there was a Telco entry by 2010.
22
to (6) suggest that incumbents in reformed states reduced prices more than incumbents
in non-reformed states following a decline in barriers to entry.
Finally in columns (7) and (8) we restrict the sample to communities that experienced
actual entry; the results here suggest greater price declines in reformed states, but the
magnitudes are smaller and statistically insignificant. This is as could be expected –
there is no reason to expect that the effect of actual entry would be different in the two
regimes. In fact, this result is reassuring, in the sense that if omitted shocks were causing
the strong declines in reformed states, we could have expected to see equal sized effects
even conditional on entry.
Overall, the evidence in Table 8 suggests strong ex-ante responses by incumbents for
“Basic” service, consistent with the models of Milgrom and Roberts (1982b) and Klem-
perer (1987), and contradicting the perfect information model of Milgrom and Roberts
(1982a).
7 Controlling for Correlated Shocks: A Sample-Split (Triple-Difference) Test
While the standard DID approach we use controls for state-level fixed omitted variables,
and while our tests in Section 5.3 suggest no bias from pre-existing trends, the DID
results could still be affected by unobserved time varying state level shocks correlated
with reform status. For example, if some unobserved demographic or market trend
impacted cable pricing and was different between the reformed and non-reformed states,
this could potentially bias our analysis.
One potential source of bias is entry by Direct Broadcast Service (“DBS”) providers.
While we do not have direct information on DBS providers (they are not covered in
the Warren’s data), other secondary sources suggest no differential trend in DBS entry
across states. As Crawford (2006) notes, by 2003, before the start of our sample in 2004,
DBS availability was pervasive and prices were generally similar across markets. The
Annual Reports of DISH Network Corporation and the DIRECTV Group confirms their
availability across the entire continental U.S. For example, the Annual Report for 2000
for DISH Network states that: “As of December 31, 2000, approximately 5.26 million
households subscribed to DISH Network programming services. We now have six DBS
satellites in orbit which enable us to offer over 500 video and audio channels, together
with data services and high definition and interactive TV services, to consumers across
the continental United States through the use of a small satellite dish.”(p. 1) Likewise
the 2001 Annual Report for DISH Network states that: “DIRECTV has launched six
high powered DBS satellites and has 46 DBS frequencies that are capable of full coverage
of the continental United States.”(p. 14) Given the pervasive availability of DBS over our
sample period, 2004 - 2010, we expect included time dummies to control for potential
effects of increased DBS penetration in our analysis, as we do not expect systematic
23

differences in the spread of DBS between reformed and non-reformed states.
Nevertheless, we cannot completely rule out incidental differences in trends of DBS
penetration across states, or differential trends in other relevant variables unobserved
by us. To try to address this concern, we consider exploiting within-state differences in
the strength of entry threats.29 The Milgrom-Roberts/Klemperer models would suggest
that costly entry deterrence strategies are more valuable in locations where the threat of
entry is the strongest, so that incumbent cable companies are more likely to respond by
cutting prices in such communities.
Specifically, we examine responses for incumbents operating in a county where one
of the largest overbuilders is already in operation. We expect the largest price drops
to occur in those communities that are geographically “close” to a community already
served by one of the top overbuilders. This approach rests on the intuitive assumption
that it is easiest for cable overbuilders to expand into geographically proximate locations
(Seamans 2013). Building off of an existing footprint allows the overbuilder to spread
the fixed costs of building a video delivery platform and take advantage of economies
of scale in customer service, maintenance, and repair. There is also anecdotal evidence
supporting this assumption. For example, in its 2005 Annual Report, RCN, one of the top
three overbuilders in the country, describes its strategy as: “RCN will continue to seek
opportunities to increase its network footprint within and adjacent to its existing market
clusters.” We can thus say that communities located near an aggressive overbuilder are
more likely to experience entry, and cable franchising deregulations that allow for a
state-wide franchise make such entry even more likely to occur.
To operationalize this idea of largest or aggressive overbuilders, we look at the top 10
companies with the highest number of subscribers belonging to overbuilt communities.
In classifying companies as overbuilders or not, we set a threshold that at least 30% of a
company’s subscribers must reside in overbuilt communities. The threshold is chosen in
order to exclude large incumbent service providers such as Comcast Communications Inc.
and Time Warner Cable for whom less than 3% of their subscribers reside in overbuilt
communities. The final list of companies including the top 10 overbuilders is comprised
of the following companies: WideOpenWest (WOW) LLC, RCN Corp., Knology Inc.,
Block Communications Inc., Armstrong Group of Companies, WaveDivision Holdings
LLC, Tacoma Public Utilities, Millennium Digital Media LLC, Broadstripe, and Qwest.
Of these, the first three and Armstrong Group of Companies belong to the list of top 25
cable companies in the U.S.. Cumulatively these top ten overbuilders account for 44% of
all subscribers who reside in overbuilt communities in our data.
We label any county where one of the top 10 overbuilders is in operation as “County
has a top 10 overbuilder”. Note that not all of the cable systems operated by these so-
called overbuilders are overbuilds; indeed in many cases, the cable systems run by these
29We note that our approach, though developed independently, is similar to that used in contemporaneous work bySeamans(2013).
24

companies are the only cable system in operation in a given community. However because
at least 30% of their subscribers reside in overbuilt communities, these companies are
likely to have a reputation within the industry as overbuilders whether or not a particular
cable system is an overbuild.
A pictorial representation of our approach towards analyzing heterogeneity of impact
across communities is provided in Appendix Figure A1. Our approach examines the sam-
ple of communities Y1 and Y2 in the reformed and non-reformed states before and after
reform, which yields a difference-in-differences (DID) estimate for communities neighbor-
ing a top 10 overbuilder (communities in counties of type A). If incumbents are indeed
responding to the greater threat of entry, we expect the DID estimate for this sample
to be greater than the DID effect for the sample of communities in counties of type B
where the threat of entry is lower.
The sample-split regression results for “Basic” service are presented in columns (1)
through (3) of Table 9 and those for “Expanded Basic” service are presented in columns
(4) through (6). To conserve space, the regression results for only the most complete
specification that includes controls for demographics, market structure, and the number
of channels are reported.
Comparing results in columns (1) and (2), we find that the magnitude of the price
decline is larger by about 11.85% in counties where a top 10 overbuilder is present. To
focus exclusively on incumbent responses to a threat of entry (rather than actual entry),
in Column (3) we exclude communities where there is an actual overbuild. This yields
lower estimates, but the decline is still about twice as large as for communities in counties
where a top 10 overbuilder is absent.
We repeat the analysis for “Expanded Basic” service in Columns (4) to (6). These
results also consistent with what we find for “Basic” service, again reaffirming the im-
portance of a higher threat of entry to the reaction by incumbents. While individual
estimates are not statistically significant, we find that there is a notable difference in the
magnitude and signs of the coefficients. In particular, there is a 9.2% decline in price (in
Column (5)) for high threat counties, while there is a 3.6% increase (in Column (4)) for
counties in which top 10 overbuilders are absent. Excluding those communities which
have actually experienced entry does not change the results significantly, as we find a
10.2% decline in this sample as well.
To the extent that within state shocks correlated with reforms do not vary across
counties with and without a top 10 overbuilder, these results confirm that there was
indeed a significant effect of the reform on incumbent pricing behavior. In particular,
because DBS entry is only limited by geographic factors such as terrain and elevation
(Goolsbee and Petrin 2004) that is unlikely to vary systematically between top 10 over-
builder counties and other counties, the results here suggest that incumbents responded
specifically to the greater threat of entry in reformed states.
As a check on the economic meaningfulness of these differential declines in price
25

for communities with specifically higher threat of entry, we also undertook a similar
sample-split test for number of consumers subscribing to the two tiers of service. Results
presented in Appendix Table A6 show substantial responses to the higher price declines
in high-threat counties. For “Basic” service, quantity responded by about 101 log points
(in column (3) of Table A6) to the 10.6% decline in prices (in Column (3) of Table 9).
Number of consumers subscribing to “Expanded Basic” also increased by 77 log points
(in column (6) of Table A6) to a 10.2% decline in prices (in Column (6) of Table 9).
Taken together, the results from Table 9 and Table A6 suggest that incumbents cut
prices significantly (and signed up more consumers) in counties where the threat of entry
was relatively higher, consistent with the reforms increasing the threat of entry, and
consistent with ex-ante price cutting predicted by models of the type in Milgrom and
Roberts (1982b) and Klemperer (1987).
8 Discussion of results and conclusion
We investigate the effect of state-level cable franchising reforms. We find difference-in-
differences decline in the price of “Basic” service of approximately 5.5 to 6.8% following
the reforms. We also find evidence for significantly more entry, particularly by telecom
companies, following the reforms. We find that DID price declines occurred even in
counties which did not experience entry. Further, we find that the magnitude of decline
in prices was highest in counties with a greater threat of entry (identified using presence
of a top 10 overbuilder in the county). The price reduction could be thought of as a
direct 5.5% to 6.8% gain in consumer surplus relative to expenditure for “Basic” only
customers; a simple back of the envelope estimation yields implied aggregate dollar gains
in consumer welfare for “Basic” only consumers of about $5.72 million per month.30
While the magnitude of the average effect of the reforms is modest, our findings
are noteworthy for a number of reasons. One, our robust finding of decline in price for
“Basic” service contrasts to the results in Crawford (2000), who finds no effect on price (or
consumer welfare through improved quality) of the federal Cable Act of 1992 (which had
the stated objective of controlling cable price increases). Thus, these state-level reforms
intended to reduce entry barriers appear to have been more effective in controlling prices
than the direct price regulation of the Cable Act of 1992. Two, the decline in price is
notably larger in communities facing a higher threat of entry (where the upfront sunk
costs for potential entrants is lower). This suggests that the impact of the reforms, which
reduced the hassle and costs associated with negotiating local franchises, may have been
moderated by the need for significant upfront sunk costs for entrants. Finally, we provide
30 Average monthly price for “Basic” service across all states for 2010 is $19.95 (from the summary statistics in Table3). The number of consumers who subscribe only to “Basic” service in 2010 in the nineteen states that have reformedis 4,959,681. Therefore, neglecting any change in the number of subscribers following the enactment of reform andusing the 5.78% price decline in column (4) of Table 4, the approximate aggregate welfare gain = ∆P ∗Q = (0.0578 *$19.95) * 4,959,681 = $5.72 million/ month.
26

evidence for the effect of a threat of entry on incumbent behavior, which as Goolsbee and
Syverson (2008) note has received much less attention in the empirical literature, relative
to theoretical and policy debate on the topic. Specifically, our findings are consistent with
models of limit pricing by incumbents (e.g., Milgrom and Roberts (1982b) and Klemperer
(1987)), and contrary to models that predict no change in incumbent behavior absent
actual entry (e.g., Milgrom and Roberts 1982a, or the Bertrand Competition model in
Sutton, 1991).
Our finding that there was no DID decline in the price of “Expanded Basic” service
on average is somewhat puzzling, especially given that subscription levels for this tier
is significantly higher than “Basic”.31 We offer two speculative explanations based on
alternative theories of ex-ante price reductions. One, as in the Milgrom and Roberts
(1982b) model, price reductions serve as signals of underlying marginal costs. It could be
the case that “Basic” cable prices provided a sufficiently credible signal of true costs for
incumbents, and so they only responded to the increased threat of entry following reforms
by cutting prices for the “Basic” tier. Two, it is possible that the goal of cutting prices was
to lock-in consumers as in Klemperer (1987). As discussed earlier, it is plausible that the
price declines were accompanied by fixed-term contracts with early termination penalties
discouraging customers from switching. Because customers of the cheaper “Basic” service
tier may be more likely to be price sensitive, they may also be the ones more likely to
switch if new entrants were to offer lower prices. Thus, it could be rational for incumbent
cable companies to offer lower prices for the product segment with more price sensitive
customers.32 Data limitations prevent us from further analysis that could have shed more
light on this finding. For example, information on contract terms could have allowed us
to explore whether incumbents tried to lock-in consumers using longer contract periods
and/or larger early termination fees.
Cable systems are among one of relatively few services where U.S. consumers have
very limited choices. Our finding that there is significantly more entry in the reformed
states suggests that local franchising process which vests authority in the local franchising
authorities does indeed play a role in limiting competition. Our results suggest that
adoption of the franchising deregulation could boost entry and improve welfare in the
remaining 27 states that are yet to adopt these reforms.
31On average across communities, “Basic” only consumers constitute about 23% of the subscriber base in our data.32Comparing results for “Basic” and “Expanded Basic” prices and quantities in Table 9 and Table A6 does provide
suggestive evidence that “Basic” service has more elastic demand. In particular, in column (3) of Table 9 a 10.6%decline in price yields a quantity response of 101 log points (in column (3) of Table A6), while for “Expanded Basic”in column (6) of Table 9, a similar price decline of 10.2% yields a lower 77 log points increase in quantity (in column(6) of Table A6).
27

References
[1] Angrist, Joshua D, and Jorn-Steffen Pischke, 2009. Mostly Harmless Econometrics,
Princeton University Press, Princeton.
[2] Bain, J., 1956. Barriers to New Competition, Harvard University Press, Cambridge.
[3] Balasubramanian, Natarajan and Jagadeesh Sivadasan, 2009. ”Capital Resalability,
Productivity Dispersion, and Market Structure,” The Review of Economics and
Statistics, 91(3), 547-557.
[4] Barrett, Rick, 2008. “Video Franchise Law no Boon to Consumer,” Milwaukee Jour-
nal Sentinel, http://www.jsonline.com/business/34126204.html
[5] Bertrand, M., E. Duflo and Mullainathan S., 2004.“How Much Should We Trust
Differences-in-Differences Estimates?” The Quarterly Journal of Economics, 119(1),
249-275.
[6] Braunstein, Yale M., 2008. “Expected Consumer Benefits from Wired Video Com-
petition in the City of San Francisco,” Working Paper.
[7] Bolema, Theodore, 2008. “Local, State and Federal Cable Franchise Regulation,”
Mackinac Center for Public Policy.
[8] Bohanon, Cecil and Michael J. Hicks, 2010. “Statewide Cable Franchising and
Broadband Connections,” Ball State Department of Economics Working Paper.
[9] Card, David, 1992. “Using Regional Variation to Measure the Effect of the Federal
Minimum Wage,” Industrial and Labor Relations Review. 46(1), 22-37.
[10] Cable TV Factbook, 2004 - 2010. Warren Communications. Washington, DC.
[11] Chipty, Tasneem, 2001. “Vertical Integration, Market Foreclosure, and Consumer
Welfare in the Cable Television Industry,” The American Economic Review 91(3),
428-453.
[12] Crawford, Gregory S., 2000, “The Impact of the 1992 Cable Act on Household
Demand and Welfare,” The RAND Journal of Economics, 31(3), 422-450.
[13] Crawford, Gregory S., 2008. “The discriminatory incentives to bundle in the cable
television industry,” Quantitative Marketing and Economics, 6(1), 41-78.
[14] Crawford, Gregory S. and Ali Yurukoglu, 2012. “The Welfare Effects of Bundling
in Multichannel Television Markets,” The American Economic Review, 102(2), 643-
685.
[15] Donohue, John J. III and Steven D. Levitt, 2001. ”The Impact of Legalized Abortion
on Crime,” The Quarterly Journal of Economics 116(2), 379-420.
[16] Della Vigna, Stefano and Ethan Kaplan, 2007. “The Fox News Effect: Media Bias
and Voting,” The Quarterly Journal of Economics, 122 (3), 1187-1234.
28

[17] FCC, 2005. “ Report on Cable Industry Prices .” FCC 05-12, Adopted January 14,
2005, Released February 4, 2005. Federal Communications Commission, Washing-
ton, DC.
[18] FCC, 2006. Report and Order and Further Notice of Proposed Rulemaking, FCC 06-
180, Adopted December 20, 2006, Released March 5, 2007, Federal Communications
Commission, Washington, DC.
[19] FCC, 2007, Second Report and Order 3, Implementation of Section 621(a)(1) of the
Cable Communications Policy Act of 1984, MB Docket 05-311, Released November
6, 2007, Federal Communications Commission, Washington, DC.
[20] FCC, 2009. Thirteenth Annual Report, FCC 07-206, Adopted November 27, 2007,
Released January 16, 2009, Federal Communications Commission, Washington, DC.
[21] FCC, 2011. Report on Cable Industry Prices, DA 11-284, Adopted February 14, 2011,
Released February 14, 2011, Federal Communications Commission, Washington,
DC.
[22] Goolsbee, Austin and Petrin, Amil, 2004. “The Consumer Gains from Direct Broad-
cast Satellites and the Competition with Cable TV,” Econometrica, 72(2), 351-381.
[23] Goolsbee, Austin and Syverson, Chad, 2008. “How Do Incumbents Respond To The
Threat Of Entry? Evidence From The Major Airlines,” The Quarterly Journal of
Economics, 123(4), 1611-1633.
[24] Haugsted, Linda, 2006. “State Groups Confront Heavy Lobbying; One Lobbyist Per
Legislator in Texas,” 3 April 2006, Multichannel News, MULTN, 27(14), 36-38.
[25] Hazlett, Thomas. 2007. “Cable TV Franchises as Barriers to Video Competition,”
Virginia Journal of Law & Technology, 12(2),1-82.
[26] Holmes, Thomas and James Schmitz, 2010. “Competition and productivity: a review
of evidence,” Annual Review of Economics, 2, 619-642.
[27] Hopenhayn, H. A., 1992. “Entry, Exit, and Firm Dynamics in Long-run Equilib-
rium,” Econometrica, 60(5), 1127-1150.
[28] Joint Study Committee, 1998. “Report on Franchise Fees and Conditions,
Rights of Way & Tax Implications of Competitive Markets,” Accessed at
http://www.senate.ga.gov/sro/Documents/StudyCommRpts/98JtFranchiseFeesRpt.pdf
on 10/12/2012
[29] Kelly, Mary T. and Ying, John S., 2003. “On Measuring Competitive Viability and
Monopoly Power in Cable: An Empirical Cost Approach,” The Review of Economics
and Statistics, 85(4), 962-970.
[30] Paul Klemperer, 1987. “Entry Deterrence in Markets with Consumer Switching
Costs,” The Economic Journal, (conference 1987), 99-117.
29

[31] Kreucher,Jon D., 2008. “Still Broken: Michigan’s Video Franchising Law 18 Months
Later,” Michigan Township News, July 2008, 18-24.
[32] McCann, Brian and Vroom, Govert, 2010. “Pricing Response to Entry and Agglom-
eration Effects,” Strategic Management Journal, 31 (3), 284-305.
[33] Milgrom, Paul and Roberts, John. 1982a. “Predation, reputation, and entry deter-
rence,” Journal of Economic Theory, 27(2), 280-312.
[34] Milgrom, Paul and Roberts, John, 1982b. “Limit Pricing and Entry under Incom-
plete Information: An Equilibrium Analysis,” Econometrica, 50 (2), 443-459.
[35] Owen, Bruce M. and Greenhalgh, Peter R., 1986. “Competitive Considerations In
Cable Television Franchising,” Contemporary Economic Policy, 4(2), 69-79.
[36] Petersen, Mitchell A., 2009. “Estimating Standard Errors in Finance Panel Data
Sets: Comparing Approaches,” Review of Financial Studies, 22(1), 435-480.
[37] Reardon, Marguerite, 2005a. “Telcos, Cable Companies Face Off Over TV
Franchises,” May 27, 2005, CNET News. http://news.cnet.com/Telcos%2C-cable-
companies-face-off-over-TV-franchises/2100-1034 3-5723368.html
[38] Reardon, Marguerite, 2005b. “Verizon Switches on TV Service,” May 27, 2005,
CNET News. http://news.cnet.com/Verizon-switches-on-TV-service/2100-1034 3-
5876947.html
[39] Reardon, Marguerite, 2006. “AT&T Enters TV Market,” January 5, 2006, CNET
News. http://news.cnet.com/AT38T-enters-TV-market/2100-1033 3-6020423.html
[40] Rogers, Christina, 2008. “Cable Giant’s Competition Benefits Users,” Detroit News,
July 7, 2008.
[41] Rubinovitz, Robert N., 1993. “Market Power and Price Increases for Basic Cable
Service since Deregulation,” The RAND Journal of Economics, 24(1), 1-18.
[42] Savage, Scott James and Wirth, Michael, 2005. “Price, Programming and Potential
Competition in US Cable Television Markets,” Journal of Regulatory Economics,
27(1), 25-46.
[43] Schneider, Christian, 2007. “The Benefits of Cable Competition in Wisconsin,” Wis-
consin Policy Research Institute Report.
[44] Seamans, Robert P., 2012. “Fighting City Hall: Entry Deterrence and Technology
Deployment in the Cable TV Industry”, Management Science, 58(3), 461-475.
[45] Seamans, Robert P., 2013. “Threat of Entry, Asymmetric Information and Pricing,”
Strategic Management Journal 34(4):, 426-444.
[46] Sher, Andy, 2008. “Spending in AT&T, cable fight approaches $18 million,” Chat-
tanooga Times/Free Press, Tenn. McClatchy-Tribune Regional News, 30 May 2008.
[47] Simon, Daniel, 2005. “Incumbent Pricing Responses to Entry,” Strategic Manage-
ment Journal, 26(13), 1229-1248.
30

[48] Spiwak, Lawrence J., 2006. “Competition’s Calling,” Legal Times, 29(11).
[49] Spurgin, Jay T., 2008. “State Video Franchise Law: State of Art or State of War?”
American Public Works Association handout.
[50] Sura, Arpan, 2006. “Telecom Competition Comes to Indiana,” Heart-
land Magazine. http://news.heartland.org/newspaper-article/2006/06/01/telecom-
competition-comes-ind
[51] Sutton, John, 1991. Sunk Costs and Market Structure, The MIT Press, Cambridge.
[52] Wagter, Herman, 2010. “Fiber-to-the-X: The Economics of Last-Mile Fiber”, Ars
Technica, March 31, 2010: http://arstechnica.com/tech-policy/2010/03/fiber-its-
not-all-created-equal/
[53] Yamawaki, Hideki, 2002. “Price Reactions to New Competition: A Study of US
Luxury Car Market, 1986-1997,” International Journal of Industrial Organization,
20 (1), 19-39.
A Data Appendix
The variables that we introduce in the various specifications along with the respective
sources are given below.
(i). Population density and population growth: Data on population density is available
only in the censal years. For the intervening years, population density estimates
can be obtained using the estimates of population that are available. The data set
is constructed using the following links:
http://www.census.gov/popest/counties/CO-EST2009-03.html and
http://www.census.gov/popest/archives/2000s/
(ii). The growth in the number of housing units comes from
http://www.census.gov/popest/housing/HU-EST2008-CO.html
(iii). Population profile comes from: http://www.census.gov/popest/counties/asrh/CC-
EST2008-agesex.html Following Crawford (2000), we look at the fraction of the
population that is aged between 5 and 18.
(iv). Per capita income comes from
http://www.bea.gov/regional/reis/default.cfm?selTable=Single
(v). Wages and salaries are drawn from the BLS website. We look at the wages for
NAICS code, 51 (Information) since data is generally missing when we explore a
finer level of disaggregation and look at either NAICS 515 Broadcasting, (except
Internet) or at NAICS 5152 Cable and other subscription programming.
31

(vi). All of these data mentioned above in (i) through (v) are available at the county
level. In addition, to control for whether local cable companies enjoy economies of
scale and scope, we look at the three variables which quantify the market structure.
National subscribers is simply the sum of all subscribers for a given cable company,
across all communities. The share of state subscribers is the fraction of subscribers
within a particular state that belong to the company operating the cable system
in question. Lastly, we also examine whether these companies are affiliated with
providers of content programming. Data on vertical affiliation between local cable
companies and content providers comes from Appendix C of FCC’s 13th Annual
Report to Congress on “The Status of Competition in the Market for the Delivery
of Video Programming.”
(vii). Data for the falsification test using electricity prices is drawn from:
http://www.eia.gov/electricity/sales revenue price/. We look at the prices for the
three categories of consumers: Residential, Commercial, and Industrial.
Further notes on methodology used for the demographic variables:
(i). Population density: Obtaining population density for counties in the inter-censal
years: Population density in year x in county y = Population density in year 2000
in county y (from the Census) * Population estimate in year x in county y (from the
BEA series) / Population estimate in year 2000 in county y (from the BEA series)
This technique works fine up to 2008. The BEA series runs out in 2008, hence
for the 2009 numbers, we have to go back to using the Census data. It should be
realized that by use of this approximation, we are implicitly using the land area that
is used in the 2000 estimates of population density all throughout the intervening
years as well. The only exception to this is Boulder County, CO and Broomfield
County, CO.
(ii). Per capita income: Numbers are obtained directly from the BEA figures without
any adjustments in general. However as for population, here too, two of the counties
- Maui + Kalawao are grouped together with their own FIPS code - 15901 which
is different from the FIPS codes of either Maui (15009) or Kalawao (15005). Hence
we have to impute the per capita income for Maui + Kalawao to both Maui and
Kalawao separately. Likewise for all jurisdictions in Virginia which are also com-
bined similarly. E.g. Albemarle + Charlottesville, VA (FIPS: 51901) which includes
two jurisdictions - Albemarle (FIPS: 51003) and Charlottesville (FIPS: 51540).
32
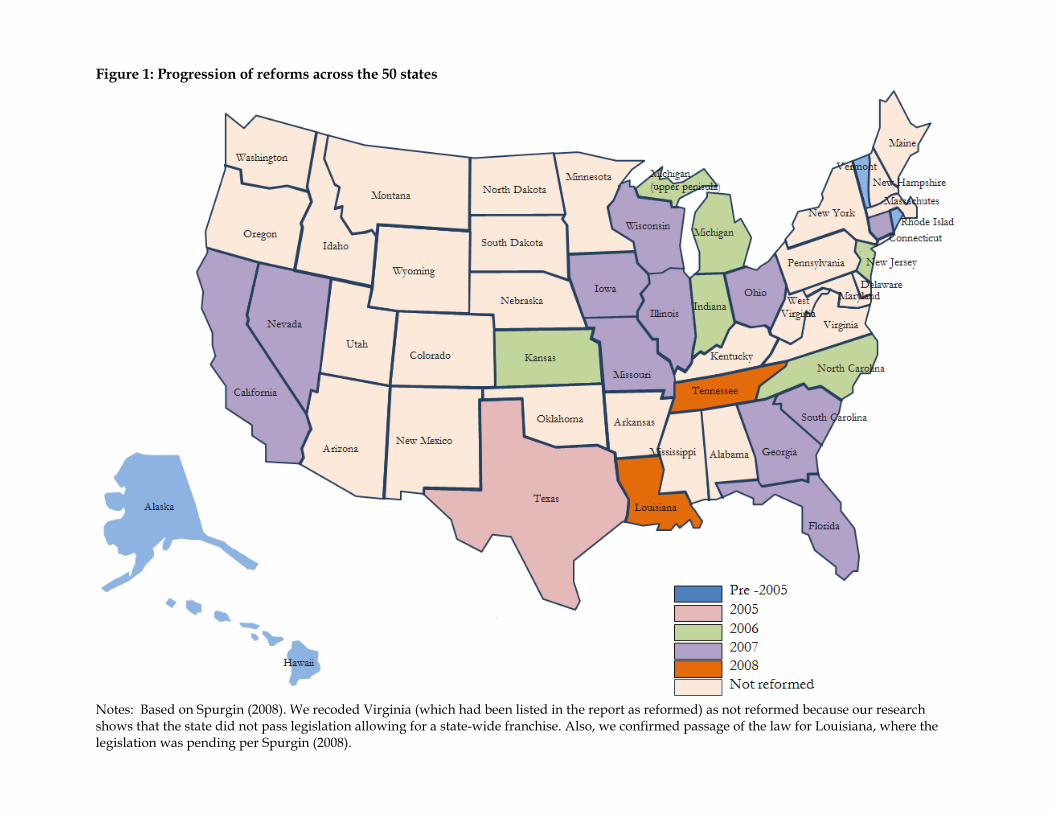
Figure 1: Progression of reforms across the 50 states
Notes: Based on Spurgin (2008). We recoded Virginia (which had been listed in the report as reformed) as not reformed because our research shows that the state did not pass legislation allowing for a state-wide franchise. Also, we confirmed passage of the law for Louisiana, where the legislation was pending per Spurgin (2008).

Figure 2a: Trend in price of “Basic” service
Notes: Data on cable prices is taken from successive issues of Warren’s TV Factbook (2004 – 2010). Price data is available at the level of each individual community. Generally the boundaries of a cable community correspond to that of a municipality, though there may be multiple cable communities within a single municipality and vice versa. There are approximately 30,000 cable communities in the U.S. The monthly price data used in this graph pertains to that of “Basic” service. This price excludes all installation charges and any charges associated with equipment rental and reflect the monthly subscription charges for an individual consumer. “Basic” service is the level of cable television service that must be taken by all cable television subscribers. The content of basic cable service varies among cable systems but, pursuant to the Communications Act, must include all local television signals and public, educational, and governmental access channels and, at the discretion of the cable operator, may include other video services. The list of states which reformed their franchising process between 2005 and 2008 along with the list of states which did not reform is provided in Table 1, and shown graphically in Figure 1.
18.0
019
.00
20.0
021
.00
Pric
e in
dol
lars
2004 2006 2008 2010Year
Did not reform
Reformed between 2005 - 2008
Monthly price of Basic Service between 2004 and 2010, 95% CI

Figure 2b: Trend in price of “Expanded Basic” service
Notes: Data on cable prices is taken from successive issues of Warren’s TV Factbook (2004 – 2010). Price data is available at the level of each individual community. Generally the boundaries of a cable community correspond to that of a municipality, though there may be multiple cable communities within a single municipality and vice versa. There are approximately 30,000 cable communities in the U.S. The monthly price data used in this graph pertains to that of “Expanded Basic” service. This price excludes all installation charges and any charges associated with equipment rental and reflect the monthly subscription charges for an individual consumer. “Expanded Basic” service offers additional video channels on one or more service tiers and includes most of the better-known national cable television networks. The list of states which reformed their franchising process between 2005 and 2008 along with the list of states which did not reform is provided in Table 1, and shown graphically in Figure 1.
35.0
040
.00
45.0
050
.00
Pric
e in
dol
lars
2004 2006 2008 2010Year
Did not reform
Reformed between 2005 - 2008
Monthly price of Expanded Basic Service between 2004 and 2010, 95% CI

Figure 3: Trend in price of “Basic” service in reformed states, around reform year
Notes: The percent numbers on the vertical axis are log points relative to prices for the year - 4 (i.e., four years prior to reform). The underlying regression includes all controls included in column (4) of Table 4 including state and year fixed effects, controls for market structure, demographic controls and control for number of channels. See notes to Table 4 for details on individual control variables. Data on cable prices is taken from successive issues of Warren’s TV Factbook (2004 – 2010). Data plotted are for 3 years prior to the enactment of reform and for 4 years after the enactment of reform. This graph is based on all communities, including states which reformed between 2005 and 2008, states which did not reform, and states which reformed prior to 2005.
Year of reform
0%(5
%)
(10%
)(1
5%)
(20%
)Pr
ice
chan
ge in
per
cent
-3 -2 -1 0 1 2 3 4Index = Years relative to enactment of reform
Mean percent change in price of Basic Service
Percent change in monthly price of Basic Service between 2004 and 2010for reformed states around year of reform, 90% CI

Table 1: Status of cable franchise reform legislation in all fifty states
4 States with laws prior to 2005:
Alaska, Hawaii, Rhode Island, and Vermont
19 States that enacted laws in 2005, 2006, 2007, or 2008:
2005: Texas
2006: Indiana, Kansas, Michigan, New Jersey, and North Carolina
2007: California, Connecticut, Florida, Georgia, Illinois, Iowa, Missouri,
Nevada, Ohio, South Carolina, and Wisconsin
2008: Louisiana and Tennessee
27 States that have not enacted laws (as of May 2013)
Alabama, Arizona, Arkansas, Colorado, Delaware, Idaho, Kentucky, Maine, Maryland,
Massachusetts, Minnesota, Mississippi, Montana, Nebraska, New Hampshire, New
Mexico, New York, North Dakota, Oklahoma, Oregon, Pennsylvania, South Dakota,
Utah, Virginia, Washington, West Virginia, and Wyoming
Source: “State Video Franchise Law: State of Art or State of War?” by Jay T. Spurgin (2008) supplemented by authors’ research.

Table 2: Summary statistics -- Number of communities
Reform Status 2004 2005 2006 2007 2008 2009 2010 Total
No reform 16,320 16,191 15,622 15,077 14,172 14,221 14,012 105,615
Reform before 2005 512 489 487 470 464 463 466 3,351
Reform between 2005 - 2008 18,805 18,391 17,818 17,379 15,981 16,018 15,723 120,115
Total 35,637 35,071 33,927 32,926 30,617 30,702 30,201 229,081
Notes: The lowest level of disaggregation at which data is available from the Warren’s TV Factbook (2004 – 2010) is the individual community. Generally the boundaries of a cable community correspond to that of a municipality, though there may be multiple cable communities within a single municipality and vice versa. The status of reforms by state is summarized in Table 1. Table 3: Summary statistics on monthly price of "Basic" and "Expanded Basic" service
"Basic” service "Expanded Basic" service
Reform Status 2004 2010 Average across the sample
% change between 2004 -2010
2004 2010 Average across the sample
% change between 2004 -2010
No Reform $17.77 $20.35 $19.11 15% $35.96 $46.85 $41.75 30%
Reform before 2005 $17.05 $22.94 $19.39 35% $39.80 $52.79 $46.21 33%
Reform between 2005 -2008 $18.23 $19.51 $18.85 7% $36.31 $47.20 $42.11 30%
Overall $18.00 $19.95 $18.98 - $36.23 $47.11 $42.02 -
Change in reformed states relative to non-reformed states = 7% - 15% = - 8%
= 30%-30% = 0%
Notes: Data on cable prices is taken from successive issues of Warren’s TV Factbook (2004 – 2010). Price data is available at the level of each individual community. Generally the boundaries of a cable community correspond to that of a municipality, though there may be multiple cable communities within a single municipality and vice versa. There are approximately 30,000 cable communities in the U.S. “Basic” service is the level of cable television service that must be taken by all cable television subscribers. The content of basic cable service varies among cable systems but, pursuant to the Communications Act, must include all local television signals and public, educational, and governmental access channels and, at the discretion of the cable operator, may include other video services. “Expanded Basic” service offers additional video channels on one or more service tiers and includes most of the better-known national cable television networks. The price data provided in this table exclude all installation charges and any charges associated with equipment rental and reflect the monthly subscription charges for an individual consumer. The status of reforms by state is summarized in Table 1.

Table 4: DID effect of reform on price of “Basic” and “Expanded Basic” tiers of service
(1) (2) (3) (4) Panel A: “Basic” service Year of reform -0.0229** -0.0237* -0.0264+ -0.0241
(-2.06) (-1.95) (-1.48) (-1.39) Post-reform -0.0553*** -0.0603*** -0.0684*** -0.0578**
(-2.95) (-2.85) (-2.94) (-2.26) Number of observations 211,500 183,253 181,704 181,637
R-squared 0.12 0.14 0.27 0.44 Panel B: “Expanded Basic” service Year of reform -0.00435 -0.00776 -0.00236 0.00144
(-0.21) (-0.35) (-0.10) (0.066) Post-reform 0.00134 0.00358 0.0171 0.0212
(0.042) (0.11) (0.50) (0.63) Number of observations 137,180 121,369 120,653 120,637
R-squared 0.18 0.20 0.23 0.27 Demographic controls N Y Y Y Controls related to market structure N N Y Y Control for number of channels N N N Y
Notes: Data on cable prices is taken from successive issues of Warren’s TV Factbook (2004 – 2010). Price data is available at the level of each individual community. Generally the boundaries of a cable community correspond to that of a municipality, though there may be multiple cable communities within a single municipality and vice versa. There are approximately 30,000 cable communities in the U.S. All regressions include state and year fixed effects. Demographic controls: Personal per capita income (and its square), population density (and its square), the rate of household growth, the fraction of the population aged between 5 and 18, and the local wage. All of these controls are available at the county level and are introduced in log form. They also include controls for the size of the average cable system (measured in terms of number of subscribers per cable system in the state) and the DMA rank. Controls related to market structure: Number of national subscribers, the share of state subscribers for the company providing service in that community, and a dummy that is set to 1 whenever the local company is vertically affiliated with a content service provider. Control for number of channels include log of number of channels provided on that tier of service. ``Year of reform” is a dummy variable that equals 1 for states which reformed between 2005 and 2008 in their year of reform. Thus, for example, for California which reformed in 2007, this dummy variable assumes the value 1 for that year and that year alone. ``Post-reform” is a dummy variable that equals 1 for states which reformed between 2005 and 2008 in the years following the reform. Thus, for example, for California, this variable assumes the value 1 for years 2008 through 2010. “Basic” service is the level of cable television service that must be taken by all cable television subscribers. The content of basic cable service varies among cable systems but, pursuant to the Communications Act, must include all local television signals and public, educational, and governmental access channels and, at the discretion of the cable operator, may include other video services. “Expanded Basic” service offers additional video channels on one or more service tiers and includes most of the better-known national cable television networks. The price data provided in this table exclude all installation charges and any charges associated with equipment rental and reflect the monthly subscription charges for an individual consumer. Robust t statistics, clustered by state, in parentheses + p < 0.15, * p < 0.10, ** p < 0.05, *** p < 0.01.

Table 5: DID effect of reform on price of “Basic” service – Test for prior trends
(1) (2) (3) (4)
Reform year – 2 -0.0102 -0.00106 -0.00633 -0.00186 (-0.84) (-0.086) (-0.47) (-0.15)
Reform year -1 -0.0299* -0.0186 -0.0197 -0.00661 (-1.72) (-1.00) (-0.82) (-0.30) Demographic controls N Y Y Y
Controls related to market structure N N Y Y
Control for number of channels N N N Y
Number of observations 144,790 128,402 127,522 127,478
R-squared 0.14 0.16 0.28 0.45
Notes: The dependent variable is the monthly price data for accessing`` Basic” service. This price excludes all installation charges and any charges associated with equipment rental and reflect the monthly subscription charges for an individual consumer. All regressions include state and year fixed effects. All years on or after the actual enactment of reforms are dropped. Demographic controls: Personal per capita income (and its square), population density (and its square), the rate of household growth, the fraction of the population aged between 5 and 18, and the local wage. All of these controls are available at the county level and are introduced in log form. They also include controls for the size of the average cable system (measured in terms of number of subscribers per cable system in the state) and the DMA rank. Controls related to market structure: Number of national subscribers, the share of state subscribers for the company providing service in that community, and a dummy that is set to 1 whenever the local company is vertically affiliated with a content service provider. Control for number of channels include log of number of channels provided on that tier of service. Year of reform: This is a dummy variable that equals 1 for states which reformed between 2005 and 2008 in their year of reform. Post-reform: This is a dummy variable that equals 1 for states which reformed between 2005 and 2008 in the years following the reform. Robust t statistics, clustered by state, in parentheses + p < 0.15, * p < 0.10, ** p < 0.05, *** p < 0.01.
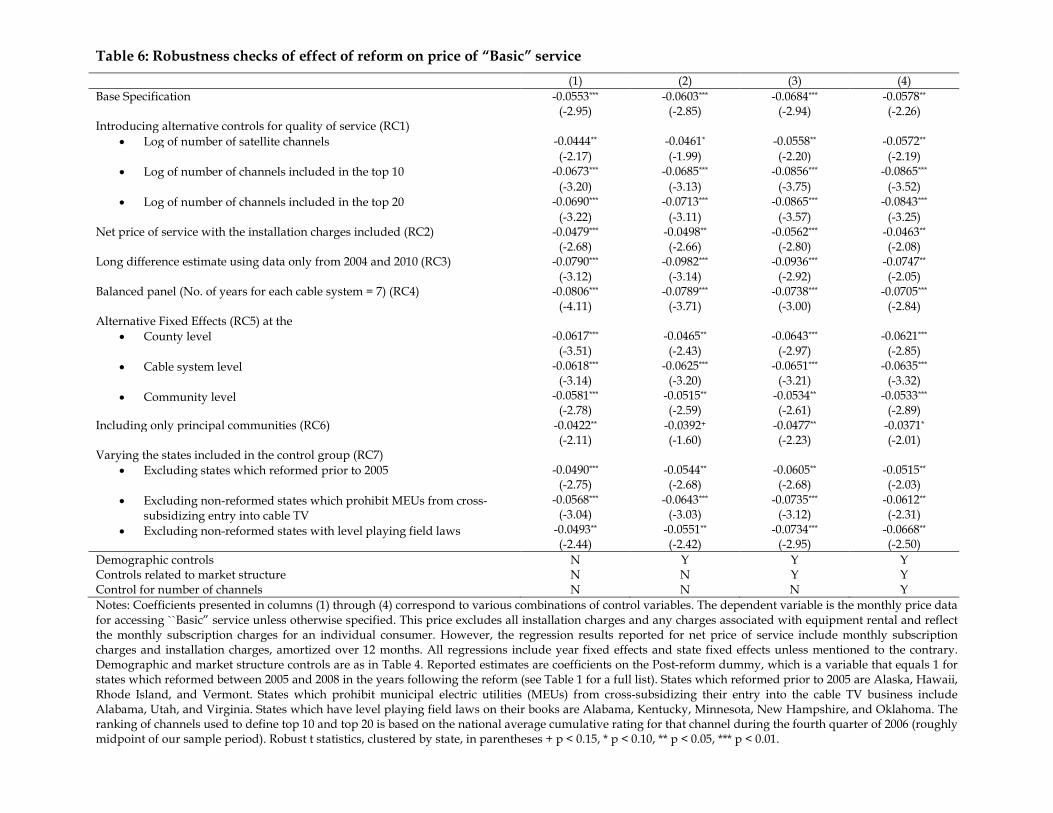
Table 6: Robustness checks of effect of reform on price of “Basic” service
(1) (2) (3) (4) Base Specification -0.0553*** -0.0603*** -0.0684*** -0.0578**
(-2.95) (-2.85) (-2.94) (-2.26) Introducing alternative controls for quality of service (RC1)
• Log of number of satellite channels -0.0444** -0.0461* -0.0558** -0.0572** (-2.17) (-1.99) (-2.20) (-2.19)
• Log of number of channels included in the top 10 -0.0673*** -0.0685*** -0.0856*** -0.0865*** (-3.20) (-3.13) (-3.75) (-3.52)
• Log of number of channels included in the top 20 -0.0690*** -0.0713*** -0.0865*** -0.0843*** (-3.22) (-3.11) (-3.57) (-3.25)
Net price of service with the installation charges included (RC2) -0.0479*** -0.0498** -0.0562*** -0.0463** (-2.68) (-2.66) (-2.80) (-2.08)
Long difference estimate using data only from 2004 and 2010 (RC3) -0.0790*** -0.0982*** -0.0936*** -0.0747** (-3.12) (-3.14) (-2.92) (-2.05)
Balanced panel (No. of years for each cable system = 7) (RC4) -0.0806*** -0.0789*** -0.0738*** -0.0705*** (-4.11) (-3.71) (-3.00) (-2.84)
Alternative Fixed Effects (RC5) at the • County level
• Cable system level
• Community level
-0.0617*** -0.0465** -0.0643*** -0.0621***
(-3.51) (-2.43) (-2.97) (-2.85) -0.0618*** -0.0625*** -0.0651*** -0.0635***
(-3.14) (-3.20) (-3.21) (-3.32) -0.0581*** -0.0515** -0.0534** -0.0533***
(-2.78) (-2.59) (-2.61) (-2.89) Including only principal communities (RC6) -0.0422** -0.0392+ -0.0477** -0.0371* (-2.11) (-1.60) (-2.23) (-2.01) Varying the states included in the control group (RC7)
• Excluding states which reformed prior to 2005
• Excluding non-reformed states which prohibit MEUs from cross-subsidizing entry into cable TV
• Excluding non-reformed states with level playing field laws
-0.0490*** -0.0544** -0.0605** -0.0515**
(-2.75) (-2.68) (-2.68) (-2.03) -0.0568*** -0.0643*** -0.0735*** -0.0612**
(-3.04) (-3.03) (-3.12) (-2.31) -0.0493** -0.0551** -0.0734*** -0.0668** (-2.44) (-2.42) (-2.95) (-2.50)
Demographic controls N Y Y Y Controls related to market structure N N Y Y Control for number of channels N N N Y Notes: Coefficients presented in columns (1) through (4) correspond to various combinations of control variables. The dependent variable is the monthly price data for accessing ``Basic” service unless otherwise specified. This price excludes all installation charges and any charges associated with equipment rental and reflect the monthly subscription charges for an individual consumer. However, the regression results reported for net price of service include monthly subscription charges and installation charges, amortized over 12 months. All regressions include year fixed effects and state fixed effects unless mentioned to the contrary. Demographic and market structure controls are as in Table 4. Reported estimates are coefficients on the Post-reform dummy, which is a variable that equals 1 for states which reformed between 2005 and 2008 in the years following the reform (see Table 1 for a full list). States which reformed prior to 2005 are Alaska, Hawaii, Rhode Island, and Vermont. States which prohibit municipal electric utilities (MEUs) from cross-subsidizing their entry into the cable TV business include Alabama, Utah, and Virginia. States which have level playing field laws on their books are Alabama, Kentucky, Minnesota, New Hampshire, and Oklahoma. The ranking of channels used to define top 10 and top 20 is based on the national average cumulative rating for that channel during the fourth quarter of 2006 (roughly midpoint of our sample period). Robust t statistics, clustered by state, in parentheses + p < 0.15, * p < 0.10, ** p < 0.05, *** p < 0.01.

Table 7a: Reforms’ effect on entry – Summary statistics
2004 2010 Change (entry) between 2004 and 2010
Reform Status
Fraction overbuilds
Fraction Telcos
Fraction overbuilds or Telcos
Fraction overbuilds
Fraction Telcos
Fraction overbuilds or Telcos
Fraction of overbuilds
Fraction of Telcos
Fraction of overbuilds or Telcos
(1) (2) (3) (4) (5) (6) (7) (8) (9) No Reform 0.70% 0.00% 0.70% 2.80% 24.60% 26.50% 2.10% 24.60% 25.80% Reform before 2005 0.00% 0.00% 0.00% 7.90% 11.20% 11.20% 7.90% 11.20% 11.20% Reform between 2005–2008 1.60% 0.00% 1.60% 4.00% 39.60% 40.70% 2.40% 39.60% 39.10% Overall 1.20% 0.00% 1.20% 3.50% 32.90% 33.70% 2.30% 32.90% 32.50%
Notes: Table presents statistics on fraction of communities that had entry by one or more cable operators (``overbuilds”) or Telcos (either AT&T or Verizon). Because the Telco data was collected at the county level, penetration rate reported here are likely to be upward biased, but this measurement error is likely to impact reformed and non-reformed states in a similar manner. The status of reforms by state is summarized in Table 1.

Table 7b: Reforms’ effect on entry – Linear propensity model
(1) (2) (3) Baseline: Assuming 2008 year of entry for Telcos Year of reform 0.0202 0.0247+ 0.0277+
(1.21) (1.48) (1.67) Post-reform 0.0824* 0.112** 0.116**
(1.77) (2.37) (2.48) Alternative 1: Assuming 2006 year of entry for Telcos Year of reform 0.0531+ 0.0678** 0.0703**
(1.61) (2.09) (2.17) Post-reform 0.0767** 0.123*** 0.125***
(2.29) (3.57) (3.66) Alternative 2: Assuming 2007 year of entry for Telcos Year of reform 0.0540 0.0628 0.0665
(1.16) (1.37) (1.45) Post-reform 0.0938* 0.134*** 0.138***
(1.95) (2.72) (2.81) Alternative 3: Assuming 2009 year of entry for Telcos Year of reform 0.00991 0.0135 0.0167*
(1.01) (1.43) (1.82) Post-reform 0.0560* 0.0761** 0.0795**
(1.71) (2.34) (2.53) Demographic controls N Y Y Controls for market structure N N Y Number of observations 48,280 39,067 37,745 R-squared 0.17 0.27 0.27 Notes: The dependent variable in this analysis is a dummy variable set to 1 if there is an overbuild in that community or if either AT&T or Verizon provides cable service to any community within that county. In the absence of precise information regarding the year of entry by AT&T or Verizon in these communities, we assume that all entry by Telcos occurred in 2008 for the baseline. The results if we assume that all entry took place either in 2006 or in 2007 or in 2009 is presented as alternatives 1, 2, and 3 respectively. The regressions are estimated on cable head-ends, as entry is observed at that level. There are approximately 6,000 cable head-ends in the U.S. All regressions include state and year fixed effects. Demographic controls: Personal per capita income (and its square), population density (and its square), the rate of household growth, the fraction of the population aged between 5 and 18, and the local wage. All of these controls are available at the county level and are introduced in log form. The list of demographic controls also includes controls for the size of the average cable system (measured in terms of number of subscribers per cable system in the state) and the DMA rank. Controls related to market structure: Number of national subscribers, the share of state subscribers for the company providing service in that community, and a dummy that is set to 1 whenever the local company is vertically affiliated with a content service provider. Robust t statistics, clustered by state, in parentheses + p < 0.15, * p < 0.10, ** p < 0.05, *** p < 0.01

Table 8: Monthly price of “Basic” service: Isolating effect of increased threat of entry (i.e., excluding effect of actual entry)
(1) (2) (3) (4) (5) (6) (7) (8)
Excluding all observations on cable overbuilds
Excluding all communities with
entry by cable overbuilders
Excluding all communities with
entry by cable overbuilders or
Telcos
Including only communities with
actual entry by overbuilders or
Telcos Year of Reform -0.0209 -0.0220 -0.0306* -0.0263+ -0.0338* -0.0274 -0.00394 -0.0226
(-1.26) (-1.26) (-1.71) (-1.49) (-1.69) (-1.39) (-0.14) (-0.81)
Post Reform -0.0605** -0.0525* -0.0799*** -0.0676** -0.0758** -0.0657** -0.0172 -0.0271
(-2.31) (-1.81) (-3.28) (-2.58) (-2.41) (-2.04) (-0.31) (-0.47)
Demographic controls & controls related to market structure Y Y Y Y Y Y Y Y
Control for number of channels N Y N Y N Y N Y Number of observations 177,292 177,225 172,385 172,318 148,282 148,215 33,422 33,422 R-squared 0.28 0.44 0.27 0.44 0.27 0.44 0.25 0.40
Notes: “Overbuilder(s)” refer to second or subsequent cable entrants and are so called because these networks are built in the same area as that already serviced by the incumbent. Columns (1) and (2) exclude all price observations relating to cable overbuilds (but include observations by incumbents in communities where the overbuilder is present), from both reformed and non-reformed states. Columns (3) and (4) exclude all communities which have experienced entry by an overbuilder (from the cable industry), from both reformed and non-reformed states. Columns (5) and (6) exclude all communities which have experienced entry, whether from an overbuilder (from the cable industry) or from the two main Telecom firms AT&T or Verizon, from both reformed and non-reformed states. Columns (7) and (8) include only those communities which have experienced entry, either from an overbuilder (from the cable industry) or from either AT&T or from Verizon, for both reformed and non-reformed states. The dependent variable in all cases is the Monthly price of “Basic” service, which excludes installation charges and any charges associated with equipment rental and reflect the monthly subscription charges for an individual consumer. All regressions include state and year fixed effects. Demographic controls: Personal per capita income (and its square), population density (and its square), the rate of household growth, the fraction of the population aged between 5 and 18, and the local wage. All of these controls are available at the county level and are introduced in log form. They also include controls for the size of the average cable system (measured in terms of number of subscribers per cable system in the state) and the DMA rank. Controls related to market structure: Number of national systems, the share of state systems for the company providing service in that community, and a dummy that is set to 1 whenever the local company is vertically affiliated with a content service provider. Control for number of channels include log of number of channels provided on that tier of service. Year of reform: This is a dummy variable that equals 1 for states which reformed between 2005 and 2008 in their year of reform. Post-reform: This is a dummy variable that equals 1 for states which reformed between 2005 and 2008 in the years following the reform. “Basic” service is the level of cable television service that must be taken by all cable television subscribers. The content of basic cable service varies among cable systems but, pursuant to the Communications Act, must include all local television signals and public, educational, and governmental access channels and, at the discretion of the cable operator, may include other video services. Robust t statistics, clustered by state, in parentheses + p < 0.15, * p < 0.10, ** p < 0.05, *** p < 0.01
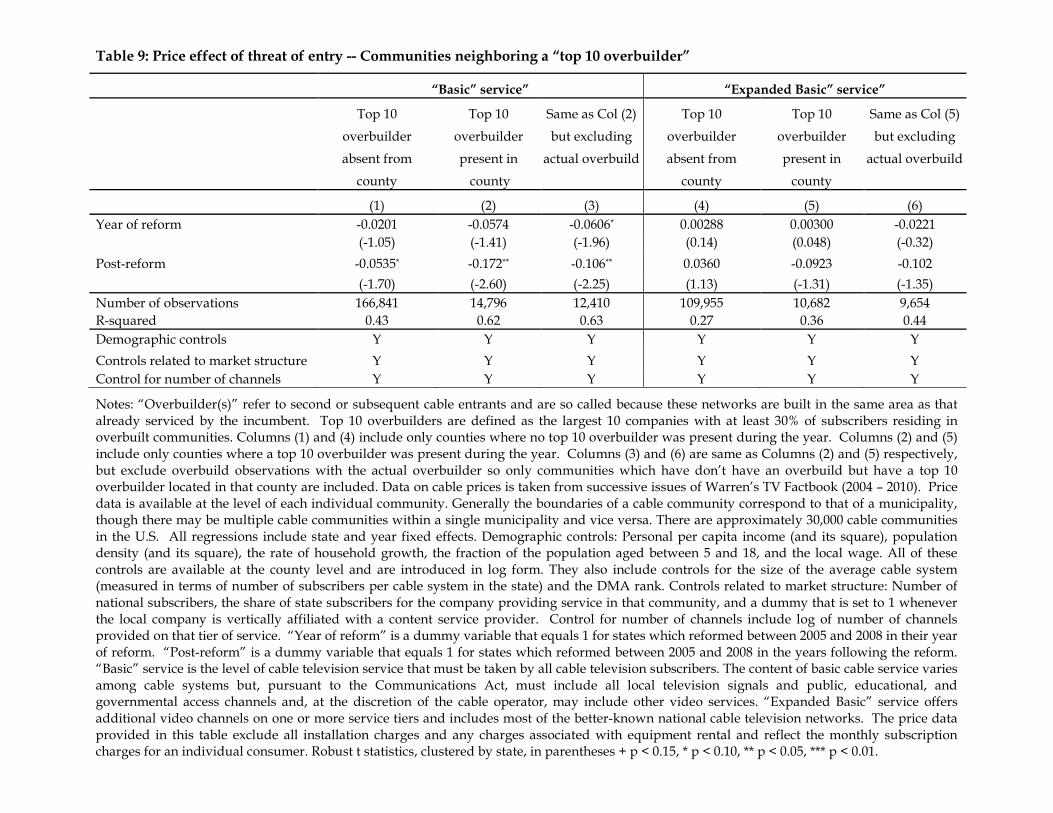
Table 9: Price effect of threat of entry -- Communities neighboring a “top 10 overbuilder”
“Basic” service” “Expanded Basic” service” Top 10
overbuilder
absent from
county
Top 10
overbuilder
present in
county
Same as Col (2)
but excluding
actual overbuild
Top 10
overbuilder
absent from
county
Top 10
overbuilder
present in
county
Same as Col (5)
but excluding
actual overbuild
(1) (2) (3) (4) (5) (6) Year of reform -0.0201 -0.0574 -0.0606* 0.00288 0.00300 -0.0221
(-1.05) (-1.41) (-1.96) (0.14) (0.048) (-0.32) Post-reform -0.0535* -0.172** -0.106** 0.0360 -0.0923 -0.102 (-1.70) (-2.60) (-2.25) (1.13) (-1.31) (-1.35) Number of observations 166,841 14,796 12,410 109,955 10,682 9,654 R-squared 0.43 0.62 0.63 0.27 0.36 0.44 Demographic controls Y Y Y Y Y Y Controls related to market structure Y Y Y Y Y Y Control for number of channels Y Y Y Y Y Y
Notes: “Overbuilder(s)” refer to second or subsequent cable entrants and are so called because these networks are built in the same area as that already serviced by the incumbent. Top 10 overbuilders are defined as the largest 10 companies with at least 30% of subscribers residing in overbuilt communities. Columns (1) and (4) include only counties where no top 10 overbuilder was present during the year. Columns (2) and (5) include only counties where a top 10 overbuilder was present during the year. Columns (3) and (6) are same as Columns (2) and (5) respectively, but exclude overbuild observations with the actual overbuilder so only communities which have don’t have an overbuild but have a top 10 overbuilder located in that county are included. Data on cable prices is taken from successive issues of Warren’s TV Factbook (2004 – 2010). Price data is available at the level of each individual community. Generally the boundaries of a cable community correspond to that of a municipality, though there may be multiple cable communities within a single municipality and vice versa. There are approximately 30,000 cable communities in the U.S. All regressions include state and year fixed effects. Demographic controls: Personal per capita income (and its square), population density (and its square), the rate of household growth, the fraction of the population aged between 5 and 18, and the local wage. All of these controls are available at the county level and are introduced in log form. They also include controls for the size of the average cable system (measured in terms of number of subscribers per cable system in the state) and the DMA rank. Controls related to market structure: Number of national subscribers, the share of state subscribers for the company providing service in that community, and a dummy that is set to 1 whenever the local company is vertically affiliated with a content service provider. Control for number of channels include log of number of channels provided on that tier of service. “Year of reform” is a dummy variable that equals 1 for states which reformed between 2005 and 2008 in their year of reform. “Post-reform” is a dummy variable that equals 1 for states which reformed between 2005 and 2008 in the years following the reform. “Basic” service is the level of cable television service that must be taken by all cable television subscribers. The content of basic cable service varies among cable systems but, pursuant to the Communications Act, must include all local television signals and public, educational, and governmental access channels and, at the discretion of the cable operator, may include other video services. “Expanded Basic” service offers additional video channels on one or more service tiers and includes most of the better-known national cable television networks. The price data provided in this table exclude all installation charges and any charges associated with equipment rental and reflect the monthly subscription charges for an individual consumer. Robust t statistics, clustered by state, in parentheses + p < 0.15, * p < 0.10, ** p < 0.05, *** p < 0.01.

Appendix Figures & Tables
Figure A1: Schematic of sample split test -- Comparing communities neighboring a top 10 overbuilder
X: Cable system operated by a top 10 overbuilder Y
i: Cable system operated by a non-top 10 overbuilder/ non-overbuilder
Non-reformed State
X County A
Y1
Y2
Y3
Y4
County B
X County A
Y1
Y2
Y3
Y4
County B
Reformed State

Appendix Figures & Tables
Table A1: State cable/video franchise law summary
State
Bill Number
Date Franchise Fees PEG Channels I-Net Service
Right of Way Control
Customer Service Build-out requirements
California AB 1715 AB 2987
7/20/07 9/29/06
Match incumbent; 5% maximum
Match incumbent; 3 minimum
Not required
Local encroachment permit required
State sets stds.; local enforcement
Phasing allowed
Connecticut HB 7182 6/28/07 State distributes tax revenue per # of subscribers
Match incumbent Required for libraries, schools
Not addressed Not addressed No specific requirements
Florida
HB 529 7/1/07 Local franchise fee replaced w/ Community Services Tax
Match incumbent; 2 minimum
Not required
Local control maintained; permit fees limited
FCC stds.; state enforces
Cannot deny service based on income level
Georgia
HB 227 7/1/07 Match incumbent; 5% maximum
Match incumbent; 3 for population >50k, 2 for population <50k
1 connection required
Local control maintained; permit fees limited
Not addressed Cannot deny service based on income level
Illinois
SB 678 HB 1500
6/30/07 Match incumbent; 5% maximum
Match incumbent Not addressed
Local control maintained
FCC stds. defined Phasing allowed
Indiana HR 1279 3/9/06 Match incumbent; 5% maximum
Utility commission provides guidance
A fee applies after 2009
Local control maintained
Not addressed Not addressed
Iowa SF 554 5/29/07 Match incumbent; 5% maximum
3 for population >50k, 2 for population <50k
Not required after initial agreement
Local control maintained
Not addressed Not required
Kansas SB 449 7/1/06 Set by cities; 5% maximum
2 channels maximum
Not addressed
Local control maintained; R/W defined
Implement system to handle inquiries
Cannot deny service based on income level
Louisiana SB 807 6/12/08 5% maximum 3 for population > 50k, 2 for population < 50k
Not addressed
Local control maintained
FCC Stds. Not required; Cannot deny service based on race or income level
Michigan
HB 6456 12/12/06 Match incumbent; 5% maximum
Match incumbent Not required
Local control maintained
State enforces stds.
Phasing allowed
Missouri SB 284 8/28/07 Match incumbent; 5%
3 for population >50k, 2
Not required
Local control maintained
1-800 customer service number
Phasing allowed

Appendix Figures & Tables State
Bill Number
Date Franchise Fees PEG Channels I-Net Service
Right of Way Control
Customer Service Build-out requirements
maximum for population <50k
must be in place
Nevada AB 518 AB 526
5/31/07 6/4/07
Match incumbent; 5% maximum
Match incumbent Not addressed
Local control maintained
State sets stds. Not required
New Jersey ACS 804 6/20/06 3.5% (1.5% previously)
2 minimum Required for government buildings
Permit fees set by state
State sets & enforces stds.
Within 3 years
North Carolina
HB 2047 7/20/06 7% sales tax collected by state, remitted to cities
3 for population >50k, 2 for population <50k
Request of service required
Local control maintained
Monitored by state AG
Cannot deny service based on income level
Ohio
SB 117 7/17/07 Match incumbent; 5% maximum
Match incumbent; 2 minimum
Not required
Local control maintained
FCC stds.; local enforcement
Phasing allowed
South Carolina
HB 3396 H 4428
3/30/07 5/23/06
Match incumbent; 5% maximum
Match incumbent; 3 minimum
Not addressed
Local control maintained
Not addressed Cannot deny service based on income level
Tennessee
HB 1421 Match incumbent; 5% maximum
Match incumbent; 3 for population >50k, 2 for population <50k
Not addressed
Local control maintained; bond required
FCC stds.; mediation to resolve issues
Cannot deny service based on income level
Texas SB 5 8/9/05 Up to 5% based on # of subscribers
3 for population >50k, 2 for population <50k
Match incumbent
Local control maintained
Not addressed Cannot deny service based on income level
Wisconsin
AB 207 4/1/07 Match incumbent; 5% maximum
Match incumbent; 3 for population >50k, 2 for population <50k
Not required
Permit fees not allowed
FCC stds. Phasing allowed
Notes: Based on Spurgin (2008). We recoded Virginia (which had been listed in the report as reformed) as not reformed because our research shows that the state did not pass legislation allowing for a state-wide franchise. Also, we confirmed passage of the law for Louisiana, where the legislation was pending per Spurgin (2008). Details for Louisiana’s cable franchise reform was sourced from: http://www.legis.la.gov/legis/Laws_Toc.aspx?folder=75&level=Parent . The details are available under RS 45:1363–1378.

Appendix Figures & Tables
Table A2: Log of average electricity prices paid by different categories of consumers, residential, commercial, and industrial between 2004 and 2010
(1) (2) (3) (4) Year of reform 0.0133 0.101 0.0447 0.0530 (0.77) (1.14) (0.41) (1.02) Post-reform 0.00185 0.000851 0.0181 0.00693 (0.13) (0.012) (0.20) (0.16) Type of consumer Residential Commercial Industrial All Number of observations 350 350 350 1050 R-squared 0.97 0.16 0.13 0.36
Notes: Data on electricity prices is drawn from: http://www.eia.gov/electricity/sales_revenue_price/. We look at average prices paid for electricity by Residential, Commercial, and Industrial categories of consumers over the period 2004–2010. Columns (1) through (3) are estimated separately for each category of consumers, and column (4) pools the data on all categories of consumers, but includes dummies for the industrial and residential sectors. All regressions include state and year fixed effects. “Year of reform” is a dummy variable that equals 1 for states which reformed between 2005 and 2008 in their year of reform. “Post-reform” is a dummy variable that equals 1 for states which reformed between 2005 and 2008 in the years following the reform. Robust t statistics, in parentheses + p < 0.15, * p < 0.10, ** p < 0.05, *** p < 0.01
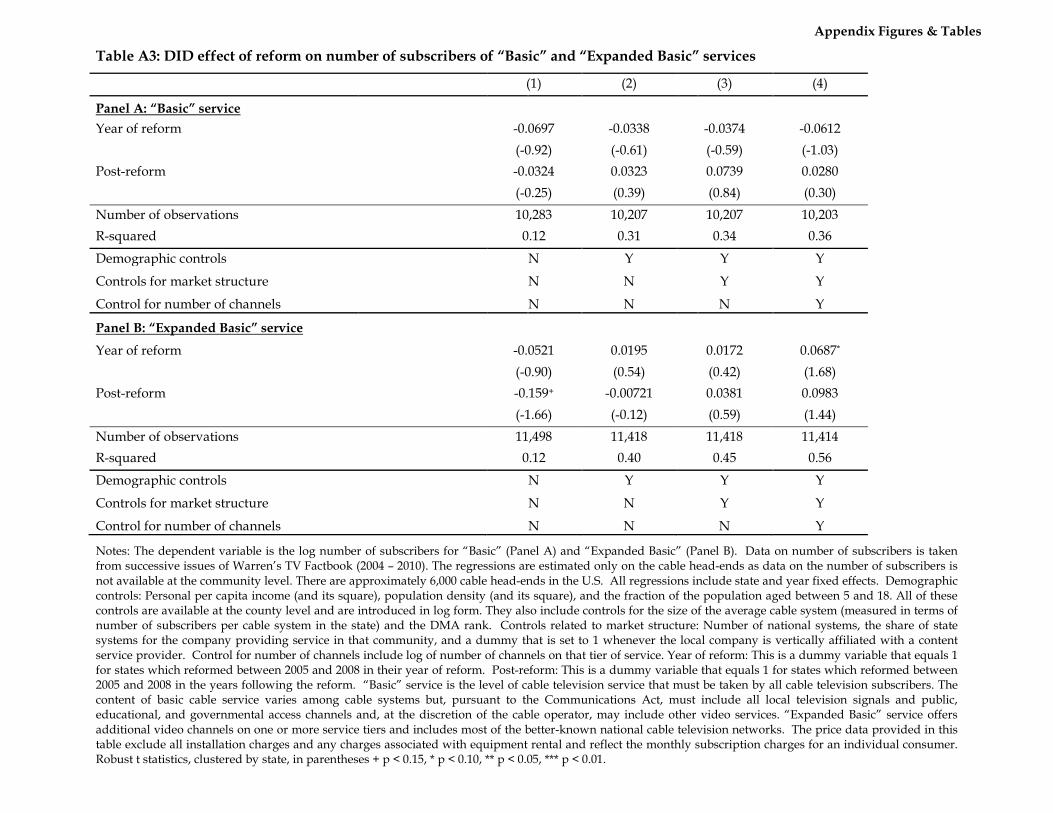
Appendix Figures & Tables
Table A3: DID effect of reform on number of subscribers of “Basic” and “Expanded Basic” services
(1) (2) (3) (4)
Panel A: “Basic” service Year of reform -0.0697 -0.0338 -0.0374 -0.0612
(-0.92) (-0.61) (-0.59) (-1.03) Post-reform -0.0324 0.0323 0.0739 0.0280
(-0.25) (0.39) (0.84) (0.30) Number of observations 10,283 10,207 10,207 10,203 R-squared 0.12 0.31 0.34 0.36
Demographic controls N Y Y Y
Controls for market structure N N Y Y
Control for number of channels N N N Y
Panel B: “Expanded Basic” service Year of reform -0.0521 0.0195 0.0172 0.0687*
(-0.90) (0.54) (0.42) (1.68) Post-reform -0.159+ -0.00721 0.0381 0.0983
(-1.66) (-0.12) (0.59) (1.44) Number of observations 11,498 11,418 11,418 11,414 R-squared 0.12 0.40 0.45 0.56
Demographic controls N Y Y Y
Controls for market structure N N Y Y
Control for number of channels N N N Y
Notes: The dependent variable is the log number of subscribers for “Basic” (Panel A) and “Expanded Basic” (Panel B). Data on number of subscribers is taken from successive issues of Warren’s TV Factbook (2004 – 2010). The regressions are estimated only on the cable head-ends as data on the number of subscribers is not available at the community level. There are approximately 6,000 cable head-ends in the U.S. All regressions include state and year fixed effects. Demographic controls: Personal per capita income (and its square), population density (and its square), and the fraction of the population aged between 5 and 18. All of these controls are available at the county level and are introduced in log form. They also include controls for the size of the average cable system (measured in terms of number of subscribers per cable system in the state) and the DMA rank. Controls related to market structure: Number of national systems, the share of state systems for the company providing service in that community, and a dummy that is set to 1 whenever the local company is vertically affiliated with a content service provider. Control for number of channels include log of number of channels on that tier of service. Year of reform: This is a dummy variable that equals 1 for states which reformed between 2005 and 2008 in their year of reform. Post-reform: This is a dummy variable that equals 1 for states which reformed between 2005 and 2008 in the years following the reform. “Basic” service is the level of cable television service that must be taken by all cable television subscribers. The content of basic cable service varies among cable systems but, pursuant to the Communications Act, must include all local television signals and public, educational, and governmental access channels and, at the discretion of the cable operator, may include other video services. “Expanded Basic” service offers additional video channels on one or more service tiers and includes most of the better-known national cable television networks. The price data provided in this table exclude all installation charges and any charges associated with equipment rental and reflect the monthly subscription charges for an individual consumer. Robust t statistics, clustered by state, in parentheses + p < 0.15, * p < 0.10, ** p < 0.05, *** p < 0.01.

Appendix Figures & Tables
Table A4: DID effect of reform on price of “Expanded Basic” service – Test for prior trends (1) (2) (3) (4)
Reform year – 2 -0.0153 -0.00887 -0.00428 0.00400 (-0.96) (-0.58) (-0.26) (0.23)
Reform year -1 -0.0115 -0.00664 0.000661 0.0109 (-0.47) (-0.28) (0.027) (0.43) Demographic controls N Y Y Y
Controls related to market structure N N Y Y
Control for number of channels N N N Y
Number of observations 90,683 82,189 81,933 81,923
R-squared 0.18 0.21 0.24 0.30
Notes: The dependent variable is the monthly price data for accessing`` Expanded Basic” service. This price excludes all installation charges and any charges associated with equipment rental and reflect the monthly subscription charges for an individual consumer. All regressions include state and year fixed effects. All years on or after the actual enactment of reforms are dropped. Demographic controls: Personal per capita income (and its square), population density (and its square), the rate of household growth, the fraction of the population aged between 5 and 18, and the local wage. All of these controls are available at the county level and are introduced in log form. They also include controls for the size of the average cable system (measured in terms of number of subscribers per cable system in the state) and the DMA rank. Controls related to market structure: Number of national subscribers, the share of state subscribers for the company providing service in that community, and a dummy that is set to 1 whenever the local company is vertically affiliated with a content service provider. Control for number of channels include log of number of channels provided on that tier of service. Year of reform: This is a dummy variable that equals 1 for states which reformed between 2005 and 2008 in their year of reform. Post-reform: This is a dummy variable that equals 1 for states which reformed between 2005 and 2008 in the years following the reform. Robust t statistics, clustered by state, in parentheses + p < 0.15, * p < 0.10, ** p < 0.05, *** p < 0.01.

Appendix Figures & Tables
Table A5: Robustness checks of effect of reform on price of “Expanded Basic” service
(1) (2) (3) (4) Base Specification 0.00134 0.00358 0.0171 0.0212
(0.042) (0.11) (0.50) (0.63) Introducing alternative controls for quality of service (RC1)
• Log of number of satellite channels 0.00875 0.00828 0.0204 0.0211 (0.28) (0.25) (0.60) (0.62) • Log of number of channels included in the top 10 0.00572 0.00647 0.0183 0.0203 (0.18) (0.20) (0.54) (0.60) • Log of number of channels included in the top 20 0.00642 0.00671 0.0185 0.0204 (0.20) (0.20) (0.55) (0.60)
Net price of service with the installation charges included (RC2) 0.00411 0.00728 0.0167 0.0194 (0.13) (0.22) (0.49) (0.57)
Long difference estimate using data only from 2004 and 2010 (RC3) -0.0134 -0.00320 0.0114 0.0134 (-0.33) (-0.076) (0.26) (0.30)
Balanced panel (No. of years for each cable system = 7) (RC4) 0.000997 0.00536 0.0110 0.0117 (0.027) (0.16) (0.32) (0.34)
Alternative Fixed Effects (RC5) at the • County level • Cable system level
• Community level
0.00132 -0.00100 0.00921 0.00860 (0.041) (-0.032) (0.28) (0.28)
-0.00149 0.000352 -0.000153 -0.000792 (-0.045) (0.013) (-0.0055) (-0.029) 0.00280 0.00678 0.00650 0.00409 (0.078) (0.21) (0.20) (0.13)
Including only principal communities (RC6) 0.00104 0.00638 0.0232 0.0334 (0.042) (0.27) (0.91) (1.40) Varying the states included in the control group (RC7)
• Excluding states which reformed prior to 2005 • Excluding non-reformed states which prohibit MEUs from
cross-subsidizing entry into cable TV • Excluding non-reformed states with level playing field laws
0.00155 0.00320 0.0154 0.0200 (0.047) (0.095) (0.44) (0.58)
-0.000391 0.000946 0.0138 0.0180 (-0.012) (0.028) (0.40) (0.53) 0.00257 0.00520 0.0185 0.0213 (0.072) (0.15) (0.51) (0.60)
Demographic controls N Y Y Y Controls related to market structure N N Y Y Control for number of channels N N N Y Notes: Coefficients presented in columns (1) through (4) correspond to various combinations of control variables. The dependent variable is the monthly price data for accessing “Expanded Basic” service unless otherwise specified. This price excludes all installation charges and any charges associated with equipment rental and reflect the monthly subscription charges for an individual consumer. However, the regression results reported for net price of service include monthly subscription charges and installation charges, amortized over 12 months. All regressions include year fixed effects and state fixed effects unless mentioned to the contrary. Demographic and market structure controls are as in Table 4. Reported estimates are coefficients on the Post-reform dummy, which is a variable that equals 1 for states which reformed between 2005 and 2008 in the years following the reform (see Table 1 for a full list). States which reformed prior to 2005 are Alaska, Hawaii, Rhode Island, and Vermont. States which prohibit municipal electric utilities (MEUs) from cross-subsidizing their entry into the cable TV business include Alabama, Utah, and Virginia. States which have level playing field laws on their books are Alabama, Kentucky, Minnesota, New Hampshire, and Oklahoma. The ranking of channels used to define top 10 and top 20 is based on the national average cumulative rating for that channel during the fourth quarter of 2006 (roughly midpoint of our sample period). Robust t statistics, clustered by state, in parentheses + p < 0.15, * p < 0.10, ** p < 0.05, *** p < 0.01.

Appendix Figures & Tables
Table A6: Quantity effect of threat of entry -- Communities neighboring a “top 10 overbuilder”
“Basic” service “Expanded Basic” service Top 10
overbuilder
absent from
county
Top 10
overbuilder
present in
county
Top 10 overbuilder
present in county but
excluding actual
overbuild
Top 10
overbuilder
absent from
county
Top 10
overbuilder
present in
county
Top 10 overbuilder
present in county
but excluding actual
overbuild
(1) (2) (3) (4) (5) (6)
Year of reform -0.0837 0.442 0.312 0.0612 0.546*** 0.516** (-1.30) (0.96) (0.63) (1.44) (3.32) (2.29)
Post-reform -0.0110 1.084** 1.019** 0.0748 0.818*** 0.777** (-0.11) (2.51) (2.48) (1.03) (3.40) (2.38)
Number of observations 8,622 399 376 9,623 452 428 R-squared 0.39 0.51 0.50 0.58 0.64 0.64 Demographic controls Y Y Y Y Y Y Controls related to market structure Y Y Y Y Y Y Control for number of channels Y Y Y Y Y Y
Notes: The dependent variable is the log number of subscribers for “Basic” (Columns (1) to (3)) and “Expanded Basic” (Columns (4) to (6)). “Overbuilder(s)” refer to second or subsequent cable entrants and are so called because these networks are built in the same area as that already serviced by the incumbent. Top 10 overbuilders are defined as the largest 10 companies with at least 30% of subscribers residing in overbuilt communities. Columns (1) and (4) include only counties where no top 10 overbuilder was present during the year. Columns (2) and (5) include only counties where a top 10 overbuilder was present during the year. Columns (3) and (6) are same as Columns (2) and (5) respectively, but exclude overbuild observations with the actual overbuilder so only communities which have don’t have an overbuild but have a top 10 overbuilder located in that county are included. Data on cable prices is taken from successive issues of Warren’s TV Factbook (2004 – 2010). The regressions are estimated only on the cable head-ends as data on the number of subscribers is available only at this level of disaggregation. There are approximately 6,000 cable head-ends in the U.S.. All regressions include state and year fixed effects. Demographic controls: Personal per capita income (and its square), population density (and its square), the rate of household growth, the fraction of the population aged between 5 and 18, and the local wage. All of these controls are available at the county level and are introduced in log form. They also include controls for the size of the average cable system (measured in terms of number of subscribers per cable system in the state) and the DMA rank. Controls related to market structure: Number of national subscribers, the share of state subscribers for the company providing service in that community, and a dummy that is set to 1 whenever the local company is vertically affiliated with a content service provider. Control for number of channels include log of number of channels provided on that tier of service. “Year of reform” is a dummy variable that equals 1 for states which reformed between 2005 and 2008 in their year of reform. “Post-reform” is a dummy variable that equals 1 for states which reformed between 2005 and 2008 in the years following the reform. “Basic” service is the level of cable television service that must be taken by all cable television subscribers. The content of basic cable service varies among cable systems but, pursuant to the Communications Act, must include all local television signals and public, educational, and governmental access channels and, at the discretion of the cable operator, may include other video services. “Expanded Basic” service offers additional video channels on one or more service tiers and includes most of the better-known national cable television networks. The price data provided in this table exclude all installation charges and any charges associated with equipment rental and reflect the monthly subscription charges for an individual consumer. Robust t statistics, clustered by state, in parentheses + p < 0.15, * p < 0.10, ** p < 0.05, *** p < 0.01.